1
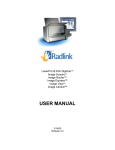
Manitoba Minerals Resource Division
Map Gallery User Guide
James Payne and Paul Lenton
Version 1.1, September 4, 2012
1
Table of Contents
Overview ......................................................................................................................................... 3
Navigation Tool .............................................................................................................................. 4
Zoom Tools ............................................................................................................................. 4
Extent Tools ............................................................................................................................ 4
Pan Tool .................................................................................................................................. 5
Overview Map ................................................................................................................................ 5
Scale ............................................................................................................................................ 6
Location co-ordinates...................................................................................................................... 6
Working with windows ................................................................................................................... 6
THE MAIN TOOLBAR ................................................................................................................. 8
Layer List .................................................................................................................................... 8
Legend....................................................................................................................................... 11
Drill Down ................................................................................................................................ 11
Advanced Search ...................................................................................................................... 14
Hyperlink Tool .......................................................................................................................... 20
Data Extract .............................................................................................................................. 20
Print ........................................................................................................................................... 25
Bookmarks ................................................................................................................................ 30
Draw and Measure .................................................................................................................... 31
2
Overview
When a Map Gallery project opens you will see a map canvas with a variety of tools available
for use. All views of the Map Gallery window are from Microsoft® Internet Explorer however
you can use other browsers such as Mozilla® Firefox or Google Chrome. The main controls are
labelled on this view of the opening screen. A complete description of all the available tools and
examples of their use follows.
3
Navigation Tool
The Navigation tool allows you to zoom in, zoom out, go back to the full extent of the map and
pan the map. An explanation of the functions of each tool follows.
Zoom Tools
At any time you can use the mouse wheel to zoom and zoom out but the interface
includes a number of specific tools to make it easier to locate the precise view you
need.
There are four tools used to zoom into an area of interest:
Fixed Zoom In: click on the + button for a fixed zoom in.
Fixed Zoom out: click on the – minus button for a fixed zoom out.
Windowed Zoom In: click on + tool, move the cursor to the map then holding the
left mouse button down draw a box to window in to the desired view.
Click on the - sign, move the cursor to the map, press the left mouse button and without
letting it go, draw a rectangle that is proportional to the amount you wish to zoom out.
Extent Tools
Click on the globe to return the map to its full extent as shown below
4
As you move about the map, zooming in, zooming out and panning, Map Gallery keeps
a list of the various view windows you have selected. You can use the Previous
View/Next View controls to move up and down this list. Click on the < button to jump
to the previous view extents or press the > button to jump to the next view in the list.
Pan Tool
When you are zoomed into the map and you want to centre an object that is on the
edge of the screen use the Pan tool.
Position the cursor on the map, press and hold the left mouse button then move the
mouse in the direction you want the map to move.
Release the mouse button when the map is in the desired location.
Overview Map
The overview map is
located in the lower right
corner of the screen. It
shows the current extent
of the main map area
(outlined in red) relative
to a large scale map.
To minimize the map,
click on the drop-down
arrow in the top left hand
corner.
The minimized map is
reduced to a small square
5
with an upward facing arrow. Clicking on the arrow will expand the map to its original size.
Scale
Along the bottom of the map a scale bar provides a visual reference of scale in both metric and
imperial units.
Location co-ordinates
All Map Gallery projects for Manitoba are presented in Universal Transverse Mercator
projection (UTM) using the NAD83 transformation.
The co-ordinate location of the cursor on the map is shown in Easting and Northing co-ordinates
below the map.
Clicking the double arrowhead
to the right of the co-ordinates
will open the locate tool.
The locate tool allows entry of
UTM co-ordinate pairs and when
the Locate button is pressed the
view will zoom to the location
and indicate the precise location.
Above the Navigation Tool is a small circle with a double arrowhead (
expands to a numeric scale bar
) that, when clicked,
indicating the current scale. The map scale can be changed by
typing a value in the box then pressing enter or by selecting
one of the preset scales available from the dropdown list.
Working with windows
Most interaction with Map Gallery takes place through dialogs in windows. These windows are
moveable and can be resized or closed as needed.
6
Along the top of the map viewer is the main tool bar which contains all the tools necessary to
turn layers on and off, identify, extract data and perform searches.
To use any of the tools on the main tool bar, click on an icon to open the associated window. All
windows operate in the same manner described below.
To minimize a window click on the negative symbol
and
the window shrinks to look like this
. To
maximize the window, click on the minimized window. Any of
the windows can be moved around on the screen by clicking on
the top of the window, holding the mouse button and moving the
window to its new location.
To close a window, click
.
If the list of information is too long or too wide to see in one
window, scroll bars will appear so you can scroll up and down.
To make the window bigger, grab the bottom right hand corner
of the window by clicking and holding the left mouse button on
the corner with the dots and drag the corner by moving the
mouse in the direction you want to expand the window. Release
the mouse button when the window is large enough.
Some windows have two or more icons along the top. A yellow
line under the icon indicates it is active. Clicking on an inactive
icon will open the window for that icon.
7
THE MAIN TOOLBAR
Layer List
The Layer List tool provides users with the ability to turn map layers on and off.
If the layer list is not showing when you first open the map
click on
located on the top Toolbar.
The legends for each type of map (Geology, Mineral
Dispositions and Assessment and Petroleum) default to the
main theme of each map and other layers that may be of
interest can be turned on by the user.
Each layer has a checkbox that allows users to turn their
visibility on or off.
.
To turn a layer off, click on the checkbox to remove the
check.
A layer with a solid sideways triangle or expansion arrow to
the left of the check box
indicates
there are sublayers below the main layer. To reveal the
sublayers click the triangle To close the sublayer, click the
drop-down arrow.
8
As you can see in this picture, there are many
sublayers that can be turned on so they are
visible on the map.
Note: a layer or subgroup of layers will only be
visible if there is a check in the checkbox. For
example, in the picture to the left, the Mineral
Lease and Mining Claim layers have a check in
the checkbox. These two layers sit under the
Mineral Dispositions heading which sits under
the major Mineral Dispositions heading. Both
have checks in the checkboxes beside their
names. This indicates the Mineral Lease and
Mining Claim layers will be visible on the map.
If the checkboxes beside the Mineral
Dispositions headings did not have a check in
them, the two layers would not be visible.
To the right of each layer (but not sublayer) is a control
used to manipulate characteristics of the entire layer or
retieve metadata for the layer.
The Zoom to selection will centre the layer in the view
and zoom to the layer extent.
9
Transparency will apply a percentage transparency to
the entire layer by moving the slider.
The Move up and Move down options will change the order the layers draw by changing the
order of the layers in Layer List as shown below.
The Description option provides access to
detailed metadata and has links to view
the information in other software such as
Google Earth.
10
Legend
A legend conveys the meaning of the symbols used to represent features on the map to a map
reader.
To open the legend window, click on
.
Layers that are turned on under the Layers window are
listed in the Legend window. An example of what each
layer looks like is shown below the layer name.
By default the background of the legend window is
partially transparent. Some colours may not display well
so a checkbox is available at the bottom of the legend to
remove background transparency from the legend.
Drill Down
The Drill Down tool identifies features on the map.
To open the Drill Down window, click on
. Click
the expansion arrow to reveal a list of layer options. The
“all visible layers” option will display information for
every open layer on the map. Alternatively you may
select one layer from which features will be identified.
11
There are two methods to select features for
identification and they are:
Identify with map point – to use this tool, click on
the icon, move the mouse cursor to the object you wish
to identify on the map, click the left mouse button and
the window changes to Results mode which lists all
objects that were touched by that point.
On the map, each of the objects
is highlighted and an info
popup window opens beside
one of the objects in the list.
The window includes all the
information the system has
about that object.
To zoom to an object in the list, click on the info popup window, scroll to the bottom and select
“Zoom to”.
To identify another object, click on
to return to the
tool window and click on the trash can icon
empty the selection set and start over.
to
12
Identify with extent - to use this tool,
click on the icon, move the mouse cursor
to the position on the map where you
want to start drawing the rectangle. Click
and hold the left mouse button and move
the cursor to start drawing a rectangle.
Continue drawing the rectangle until it
has touched or enclosed all of the objects
you wish to indentify. When the
rectangle has touched or enclosed all the
objects being identified, release the mouse
button to stop drawing. The window
changes to Results mode which lists all
objects touched by and enclosed in the
rectangle.
On the map, each of the objects
is highlighted and an info
popup window opens beside
that object. The window
includes all the information the
system has about that object.
To zoom to an object in the list,
click on the object in the
Results window.
13
Advanced Search
The Search tool enables users to search for features in a specific layer by creating a query of the
attribute data attached to the feature layer.
Select by Attributes
To open the Advanced Search window, click on
to open the Select by Attributes window.
Click on the expansion arrow to reveal a list of
searchable layers and select one.
Scroll through the field names and select one by
double clicking.
The selected field appears in the box at the bottom
of the window. At the same time, the Values box
is populated by the program. If the value list for
the layer is long only a subset will be displayed.
You can select a value directly from the box by
double clicking on the selected value or, if the
value is not in the list, type it directly into the
SELECT box where you set the criteria for the
search.
Note: If the value is a text item it must be enclosed
with single quotes but numeric values do not need
quotes. Examine the items in the Values list to
determine the required format.
14
The SELECT*FROM ...WHERE box is where
you set the criteria for the search by clicking on
one of the operator buttons then selecting or
entering a value. The target layer name appears
between FROM and WHERE.
Once all of the criteria have been set, click the
Select button.
The query executes, the map display will zoom in or out to display the full extent of the selection
and the results are shown in the Selection Results window. The selected items are highlighted
orange. Hovering the mouse cursor over any row will open an info popup window pointing to
the single feature selected. Clicking on any row will zoom to the selected feature. The “Export”
15
button at the bottom of the table will save the contents of the table as a comma-delimited text file
that can be easily imported into most spreadsheet programs.
Clicking on the Zoom
button will zoom
back to the extent of
the selection set with
the selected items
highlighted in orange.
Clicking Clear will
clear the Selection
Results window.
To conduct a new search click
to return
to the Select by Attributes window. Click the
Clear button to clear the search criteria or click
to open the Selection Options window.
16
Click the expansion arrow to reveal several
selection methods under Selection Method.
The choices are:
• create a new selection,
• add to the current selection i.e. add
another criteria to the initial search or,
• if multiple criteria were set, you
can remove one or more criteria.
To clear all selection click on the button at
the bottom of the window.
Select by Location
Another way of searching is by location.
The best way to explain this method is to use an example. Suppose you want to know which
mineral occurrences are within Unit 3 of the Bedrock Geology layer. The following example is
based on the query for Unit 3 described above having been done to create a selection set in
Bedrock Geology.
Start by setting Mineral Occurrence as the Target
layer and set Mineral Occurrence ID as the field to
search on.
17
Click
window.
to open the Search by Location
Select Mineral Occurrence;
Select that are completely within;
Select Bedrock Geology (notice that 33 occurrences
of unit 3 are selected);
Click Select and
The Selection Results window opens listing all the mineral occurrences that are found
completely within Unit 3 of the Bedrock Geology layer.
18
Other Search for Features Choices
Under the Search For Features list are the
following choices:
a. Search for features that are partially or
completely within a layer.
b. Search for features that are completely
within a layer.
c. Search for features that are partially
(but not fully) within a layer.
d. Search for features that are (fully)
inside a layer.
The Source Layer lists all the layers for the map that are currently enabled.
19
Hyperlink Tool
Some feature layers have external information that is accessed through a “hyperlink” that is in
the attribute table. If the selection result contains a small button with a red arrow head on the
right side then there is a hyperlink available. Click the button to access the information
Data Extract
This tool enables users to select a subset of data from a list of available layers and download it
onto their computer as a zip file. Users define the data subset by specifying an area of interest.
To open the Data Extract window, click on
. The
window displays all of the available layers for extracting.
There are four steps to extract data for downloading.
Step 1 – Select Area
There are four ways to select the area of the map to download data. They are:
20
Draw Polygon – Great tool for going
around straight lined objects.
To start, click the icon and move the
mouse cursor to where you want to start
the polygon. Click the left mouse button
and move the cursor where you want one
side to be, click the left mouse button to
anchor the line at that position and
continue drawing lines and anchoring
them until the polygon is complete.
Double click the left mouse button to
complete the polygon. If you made a
mistake, click Clear at the top of the
window.
Draw Freehand Polygon – Good tool
to create curved lines in a polygon.
To draw a freehand polygon on the map,
click the icon and move the mouse cursor
to where you want to start the polygon.
Click and hold the left mouse button and
move the cursor to draw the polygon.
When complete release the mouse button.
If you made a mistake, click Clear at the
top of the window.
21
Draw Circle
To draw a circle on the map, click the
icon and move the mouse cursor to where
you want to start the circle. Click and
hold the left button and move the mouse
to draw. The point at which you click the
mouse is the center of the circle. As you
move the mouse cursor, the circle
expands out from that point. When you
have finished drawing, release the mouse
button. If you made a mistake, click
Clear at the top of the window.
Draw Ellipse
To draw an ellipse on the map, click the
icon and move the mouse cursor to where
you want to start the ellipse. Click and
hold the left button and move the mouse
to draw. The point at which you click the
mouse is the center of the ellipse. As you
move the mouse cursor, the ellipse
expands out from that point. When you
have finished drawing, release the mouse
button. If you made a mistake, click
Clear at the top of the window.
22
Step 2 – Select Layers to Extract
Select which layers you want to extract by clicking the
box to the left of each layer.
Step 3 – Select File Format
Click the arrow and select the file format for the
download.
The choices are:
File geodatabase (.gdb)
Shapefile (.shp)
Autodesk AutoCAD (.dxf)
Autodesk AutoCAD (.dwg)
Bentley Microstation Design (V8) (.dgn)
23
Step 4 – Extract
Click the Extract button.
After a short wait a window opens and asks if
you want to save the data file. Click Yes to
save or click No to cancel.
24
Clicking Yes opens the save file
window on your computer where
you can give it a file name and
tell it where to save. Click the
Save button or Cancel button.
Print
The Print tool enables users to print “what you see is what you get” (WYSIWYG) output. All
map display content that is currently visible will be printed including the scale bar. Users can
specify a custom title and subtitle for the output document.
To print the map that is on
your screen use the Print
tool. Click on
to open
the Print Window shown
below.
25
Enter the title of the map in the Title box. Enter
an optional subtitle in the Subtitle box. When
ready to print, click the Print button.
If hard copy is chosen this opens your print
window. Click the Print button to send it to your
printer.
26
Below is a copy of the map as it prints. This method does not print a legend.
27
Alternatively, you can print the map to a PDF file
by checking the box beside the Print to PDF
option. Printing to PDF is the better method
because when it is prepared, a north arrow scale
and legend are created. The legend contains all
layers and depending on how many layers are on
the map can span multiple pages (only 1 page of 4
of the legend is shown below).
PDF version shown here.
28
29
Bookmarks
The Bookmarks tool stores a collection of map view extents (i.e., spatial bookmarks) of the data
contents displayed on the map. It enables users to create and add their own spatial bookmarks.
If you find that you are constantly zooming into the same
area time after time, you can use the Bookmarks tool to
make the task easier. After zooming into your area of
interest, select the Bookmarks tool
. Note: Bookmarks
are unique to the computer you are working on.
Click on
, enter a descriptive name
for your bookmark and click Add
Bookmark.
The bookmark is created and can be
used whenever you want to zoom into
that area again.
To return to the list of bookmarks click
on
.
The next time you open the map and
you want to zoom into an area you
previously bookmarked, use the
Bookmarks tool to open the window
and select the bookmark from the list.
To delete a bookmark, click on
.
30
Draw and Measure
The Draw and Measure tool enables users to draw simple graphics and text onto the map display.
It also provides some measurement capability, by displaying measurement values (if activated)
for drawn features: lengths for lines, and areas and perimeters for polygons. When the tool is
initially activated, the user is presented with a simple dialog that contains 9 feature creation
tools.
The text and graphics produced by these tools will appear on printed maps and PDF files
produced by the Print tool. The text and graphics are present only for the browser session they
are created in; if you close your browser the modifications are lost.
To access the tools click on
to open the
Draw and Measure tool window.
Draw Point
To draw a point on the map,
click on
and move your
mouse cursor to where you
want to draw a point and left
click.
31
Other shapes can be selected from the drop
down menu
To change the size of the shape, click the up or
down arrows to change the number in the Size
field or enter a number directly into the box.
To change the Alpha or transparency of the
interior colour of the shape, click the up or down
arrow to change the number in the Alpha field
or enter a number in the box. The maximum is
1 which represents a solid colour. The
minimum is 0 which represents no colour. Any
number in between will vary the transparency of
the colour.
To change the outline width of the shape, click
the up or down arrows to change the number in
the Width field.
Examples of the various sizes, shapes, outline widths and Alphas are shown above.
To change the interior colour of the shape,
click the down arrow on the coloured square
beside Marker Color and select a colour.
32
To change the outline colour of the shape, click
the down arrow on the coloured square beside
Outline Color and select a colour.
To move a point, click the point, release the mouse button then click and hold the mouse button.
Move it to its new location and release the mouse button then click the point one last time. To
clear any shapes that were drawn on the map click on Clear drawings.
Draw Line
To draw a straight line on the map,
click on
and move the mouse
cursor to where you want to start the
line and click the left mouse button.
Move the mouse in the direction you
want the line to be drawn and when
it is long enough double click the left
button to end the line.
If you want to make a multi segment
line draw the first leg of the line as
described previously then when you
want to change direction, click the
left mouse button and move your
mouse in the direction you want the
next leg of the line to go. When all
legs of the line are complete, double click the left mouse button.
33
Other line styles can be selected from the drop
down menu.
To change the line width, click the up or down
arrows to change the number in the Width field
or enter a number directly into the box.
To change the Alpha or transparency of the line,
click the up or down arrow to change the number
in the Alpha field or enter a number in the box.
The maximum is 1 which represents a solid
colour. The minimum is 0 which represents no
colour. Any number in between will vary the
transparency of the colour.
Examples of the various styles, widths and
Alphas are shown here.
To change the line colour, click the down arrow
on the coloured square beside Line Color and
select a colour.
34
To edit a line, click on the line then grab one end by clicking and holding the left mouse button
on the grey box then move the grey box to the desired location and release the mouse button. To
create a multi-segment line from a straight line, click on the line at the point where you want to
make the line turn. A grey box appears and can be moved as explained earlier. To exit the edit
mode, click on any of the drawing tools, close the Draw and Measure window then open the
Draw and Measure window again.
To clear shapes drawn on the map click on Clear drawings.
To show how long a line is, click the
checkbox next to Show Measurements
then click the down arrow to reveal a list
of units. When a line is drawn on the
map, its length, in the units you selected,
is displayed.
35
Draw Freehand Line
To draw a freehand line on
the map, click on
and
move the mouse cursor to
where you want to start the
line, click and hold the left
button and move the mouse
to draw. When you have
finished drawing, release the
mouse button.
Other line styles can be selected from the drop
down menu.
To change the line width, click on the up or down
arrows to change the number in the Width field or
enter a number directly into the box.
To change the Alpha or transparency of the line,
click the up or down arrow to change the number
in the Alpha field or enter a number in the box.
The maximum is 1 which represents a solid colour.
The minimum is 0 which represents no colour.
Any number in between will vary the transparency
of the colour.
Examples of the various styles, widths and Alphas
are shown here.
36
To change the line colour, click the down arrow on
the coloured square beside Line Color and select a
To show how long a line is, click the checkbox
next to Show Measurements then click the down
arrow to reveal a list of units. When a line is
drawn on the map, its length, in the units you
selected, is displayed.
To edit a freehand line, click on the line then grab
any of the grey boxes by clicking and holding the
left mouse button on a grey box. Move the grey
box to the desired location and release the mouse
button. To exit the edit mode, click on any of the
drawing tools, close the Draw and Measure
window then open the Draw and Measure
window again.
To clear shapes drawn on the map, click on Clear
drawings.
37
Draw Rectangle
To draw a rectangle on
the map, click on
and move the mouse
cursor to where you want
to start the rectangle.
Click and hold the left
button and move the
mouse to draw. When
you have finished
drawing, release the
mouse button.
Other styles of internal shading can be
selected from the drop down menu.
To change the outline width, click on the up or
down arrows to change the number in the Width
field or enter a number directly into the box.
To change the Alpha or transparency of the interior
colour of the rectangle, click the up or down arrow
to change the number in the Alpha field or enter a
number in the box. The maximum is 1 which
represents a solid colour. The minimum is 0 which
represents no colour. Any number in between will
vary the transparency of the colour. Examples of
the various styles, widths and Alphas are shown.
38
To change the interior colour of the
shape, click the down arrow on the
coloured square beside Fill Color and
select a colour.
To change the outline colour of the shape,
click the down arrow on the coloured
square beside Outline Color and select a
colour.
39
To show the area of and the distance around the rectangle, click the checkbox next to Show
Measurements. Select an Area Units from the dropdown list by clicking the down arrow then do
the same for the Distance Units.
When the rectangle is
drawn on the map, the
area of the rectangle and
the distance around the
rectangle are displayed.
Tool Tip: if you want the
rectangle to be
transparent, set Alpha to
0.
40
To move a rectangle, click in the
rectangle, release the mouse button,
click and hold the left mouse button
and drag the rectangle to its new
position. Release the mouse button
then click in the rectangle one last
time. To change the size of a
rectangle, click on the rectangle, grab
any of the editing boxes or circles by
clicking and holding the left mouse
button. Move the box or circle to the
desired location and release the mouse
button. To exit the edit mode, click
on the rectangle.
To clear shapes drawn on the map, click on Clear drawings.
Draw Circle
To draw a circle on the map,
click on
and move the
mouse cursor to where you
want to start the circle. Click
and hold the left button and
move the mouse to draw.
The point at which you click
the mouse is the center of the
circle. As you move the
mouse cursor, the circle
expands out from that point.
When you have finished
drawing, release the mouse
button.
Other styles of internal shading can be
selected from the drop down menu.
41
To change the outline width, click
on the up or down arrows to change
the number in the Width field or
enter a number directly into the box.
To change the Alpha or
transparency of the interior colour
of the circle, click the up or down
arrow to change the number in the
Alpha field or enter a number in the
box. The maximum is 1 which
represents a solid colour. The
minimum is 0 which represents no
colour. Any number in between
will vary the transparency of the
colour.
Examples of the various styles are shown here.
To change the interior colour of the
shape, click the down arrow on the
coloured square beside Fill Color and
select a colour.
To change the outline colour of the
shape, click the down arrow on the
coloured square beside Outline Color
and select a colour.
42
To show the area of and the distance around the circle, click the checkbox next to Show
Measurements. Select an Area Units from the dropdown list by clicking the down arrow then do
the same for the Distance Units.
When the circle is drawn on
the map, the area of the circle
and the distance around the
circle are displayed.
Tool Tip: if you want the
circle to be transparent, set
Alpha to 0.
To move a circle, click in the circle, release the mouse
button, click and hold the left mouse button and drag the
circle to its new position. Release the mouse button. To
exit the editing mode, click in the circle twice.
43
To change the size of a circle, click on the circle twice,
grab any of the editing boxes or circles by clicking and
holding the left mouse button. Move the box or circle to
the desired location and release the mouse button. To
exit the edit mode, click on the circle.
To clear shapes drawn on the map click on Clear
drawings.
Draw Ellipse
To draw an ellipse on the map, click
on
and move the mouse cursor
to where you want to start the ellipse.
Click and hold the left button and
move the mouse to draw. The point
at which you click the mouse is the
center of the ellipse. As you move
the mouse cursor, the ellipse expands
out from that point. When you have
finished drawing, release the mouse
button.
Other styles of internal shading can be
selected from the drop down menu.
44
To change the outline width, click on the up or down
arrows to change the number in the Width field or
enter a number directly into the box.
To change the Alpha or transparency of the interior
colour of the ellipse, click the up or down arrow to
change the number in the Alpha field or enter a
number in the box. The maximum is 1 which
represents a solid colour. The minimum is 0 which
represents no colour. Any number in between will
vary the transparency of the colour.
Examples of the various styles are shown here.
To change the interior colour of the
shape, click the down arrow on the
coloured square beside Fill Color and
select a colour.
To change the outline colour of the
shape, click the down arrow on the
coloured square beside Outline Color
and select a colour.
45
To show the area of and the distance around the ellipse, click the checkbox next to Show
Measurements. Select an Area Units from the dropdown list by clicking the down arrow then do
the same for the Distance Units.
When the ellipse is drawn on the map,
the area of the ellipse and the distance
around the ellipse are displayed.
Tool Tip: if you want the ellipse to be
transparent, set Alpha to 0.
To move an ellipse, click in the ellipse, release the
mouse button, click and hold the left mouse button
and drag the ellipse to its new position. Release the
mouse button. To exit the editing mode, click in the
ellipse twice.
46
To change the size of an ellipse, click on the ellipse
twice, grab any of the editing boxes or circles by
clicking and holding the left mouse button. Move
the box or circle to the desired location and release
the mouse button. To exit the edit mode, click on
the ellipse.
To clear shapes drawn on the map click on Clear
drawings.
Draw Polygon
To draw a polygon on the
map, click on
and move
the mouse cursor to where
you want to start the polygon.
Click the left mouse button
and move the cursor to draw
one side of the polygon, click
the left mouse button to
anchor the line at that
position and continue
drawing and anchoring lines
until the polygon is complete.
Double click the left mouse
button to complete the
polygon.
Other styles of internal shading can be
selected from the drop down menu.
47
To change the outline width, click on the up or down
arrows to change the number in the Width field or
enter a number directly into the box.
To change the Alpha or transparency of the interior
colour of the polygon, click the up or down arrow to
change the number in the Alpha field or enter a
number in the box. The maximum is 1 which
represents a solid colour. The minimum is 0 which
represents no colour. Any number in between will
vary the transparency of the colour.
Examples of the various styles are shown here.
To change the interior colour of the shape, click
the down arrow on the coloured square beside Fill
Color and select a colour.
To change the outline colour of the shape, click
the down arrow on the coloured square beside
Outline Color and select a colour.
48
To show the area of and the distance around the polygon, click the checkbox next to Show
Measurements. Select an Area Units from the dropdown list by clicking the down arrow then do
the same for the Distance Units.
When the polygon is drawn on the map,
the area of the polygon and the distance
around the polygon are displayed.
Tool Tip: if you want the polygon to be
transparent, set Alpha to 0.
To move a polygon, click in the
polygon, release the mouse button, click
and hold the left mouse button and drag
the polygon to its new position. Release
the mouse button. To exit the editing
mode, click in the polygon twice.
To change the shape of a polygon, click
on the polygon and grab any of the
editing boxes by clicking and holding
the left mouse button. Move the box to
the desired location and release the
49
mouse button. To exit the edit mode, click on the polygon twice.
To change the size of a polygon, click on
the polygon twice, grab any of the editing
boxes or circles by clicking and holding
the left mouse button. Move the box or
circle to the desired location and release
the mouse button. To exit the edit mode,
click on the polygon.
To clear shapes drawn on the map click on
Clear drawings.
Draw Freehand Polygon
To draw a freehand polygon on the map,
click on
and move the mouse cursor
to where you want to start the polygon.
Click and hold the left mouse button and
move the cursor to draw the polygon.
When complete release the mouse button.
Other styles of internal shading can be
selected from the drop down menu.
50
To change the outline width, click on the
up or down arrows to change the number
in the Width field or enter a number
directly into the box.
To change the Alpha or transparency of
the interior colour of the polygon, click the
up or down arrow to change the number in
the Alpha field or enter a number in the
box. The maximum is 1 which represents
a solid colour. The minimum is 0 which
represents no colour. Any number in
between will vary the transparency of the
colour.
Examples of the various styles are shown
here.
To change the interior colour of the shape,
click the down arrow on the coloured
square beside Fill Color and select a
colour.
To change the outline colour of the shape,
click the down arrow on the coloured
square beside Outline Color and select a
colour.
51
To show the area of and the distance around the polygon, click the checkbox next to Show
Measurements. Select an Area Units from the dropdown list by clicking the down arrow then do
the same for the Distance Units.
When the polygon is drawn on the map, the area of
the polygon and the distance around the polygon are
displayed.
Tool Tip: if you want the polygon to be transparent,
set Alpha to 0.
To move a polygon, click in the polygon, release the
mouse button, click and hold the left mouse button
and drag the polygon to its new position. Release
the mouse button. To exit the editing mode, click in
the polygon twice.
To change the shape of a polygon, click on the
polygon and grab any of the editing boxes by
clicking and holding the left mouse button. Move
the box to the desired location and release the
mouse button. To exit the edit mode, click on the
polygon twice.
52
To change the size of a polygon, click on the
polygon twice, grab any of the editing boxes or
circles by clicking and holding the left mouse
button. Move the box or circle to the desired
location and release the mouse button. To exit the
edit mode, click on the polygon.
To clear shapes drawn on the map click on Clear
drawings.
Add Text
To add text to the map click
on
and enter your text in
the Text window, position the
mouse cursor where you want
the text to appear and press
the left mouse button.
You can make the text bold
, italicise text
or
underline text
by
clicking on the corresponding
button. To turn off these
styles, click the buttons again.
53
To change the font, click on the down
arrow beside the Font and make your
selection.
To change the text colour, click on the down
arrow on the coloured square beside Color and
select a colour.
To change the text size, click
the down arrow beside Size or
enter a number directly into the
box.
To move the text, left click the
text then left click and hold the
mouse button. Drag the text to
its new location. Release the
mouse button and left click on
the text to anchor it in its new
position.
54