1
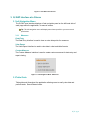
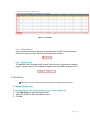
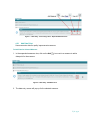
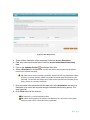
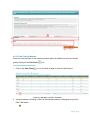
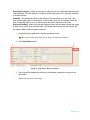
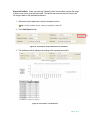
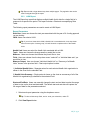
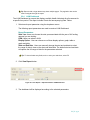
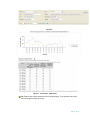
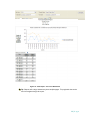
HEALTH QUALITY ONTARIO Quality Improvement Reporting & Analysis Platform (QI RAP) User Guide Table of Contents 1. 2. Introducing QI RAP ............................................................................................................................ 3 User Access ........................................................................................................................................ 3 2.1 Functionalities ............................................................................................................................. 3 3. QI RAP Interface at a Glance ........................................................................................................... 4 3.1 Left Navigation Menu ................................................................................................................. 4 3.1.1 3.2 4. Measures ............................................................................................................................. 4 Table Grids .................................................................................................................................. 4 3.2.1 Action Buttons ..................................................................................................................... 5 3.2.2 Pagination Bar .................................................................................................................... 5 Data Entry............................................................................................................................................ 5 4.1 Select Health Link ...................................................................................................................... 5 4.2 View Change Area ..................................................................................................................... 6 4.2.1 Add Data Point .................................................................................................................... 7 4.2.2 Charts ................................................................................................................................... 9 4.2.3 View All ................................................................................................................................ 9 Figure 13 - Data Entry - View All - Add Data Point ............................................................................. 10 4.2.4 Manage Favourites .......................................................................................................... 13 5. View Report ....................................................................................................................................... 14 5.1 View Reports ............................................................................................................................. 14 5.2.2 Health Link Dashboard .................................................................................................... 17 5.2.3 LHIN Report ...................................................................................................................... 19 5.2.4 LHIN Dashboard ............................................................................................................... 21 5.2.5 Provincial Report .............................................................................................................. 23 5.2.6 Provincial Dashboard............................................................................................................. 25 5.2.7 Provincial Snapshot: Cumulative Report Of All Measures ....................................... 27 5.2.8 Data Entry Status Report ................................................................................................... 28 5.3 Print Report ........................................................................................................................... 29 5.4 Export Report ............................................................................................................................. 29 6 7 8 Exiting QI RAP .................................................................................................................................. 30 Technical Support ............................................................................................................................ 31 Health Link Measures ...................................................................................................................... 31 2|Page Common Acronyms used in QIRAP User Manual QI RAP Quality Improvement Reporting & Analysis Platform QI Quality Improvement HQO Health Quality Ontario HL Health Link Figure 1 - Common Acronyms 1. Introducing QI RAP The Quality Improvement Reporting and Analysis Platform (QI RAP) provides a single, integrated platform for data reporting, and analysis of quality improvement (QI) measures. End users can enter data for measures through intuitive web pages, and can use the reporting capability of the platform to view charts and tables for each measure. Administrators of the system are Health Quality Ontario (HQO) staff, who have the ability to manage: users and access, available measures, and how data is captured and displayed in the analysis reports. 2. User Access 2.1 Functionalities The following table outlines the permissions that the Data Entry user, and View Only user have within the application: User Access Functionality Data Entry View Only Add data X Edit data X View data X X Run reports X X 3|Page Figure 2 - User Roles and Access 3. QI RAP Interface at a Glance 3.1 Left Navigation Menu The QI RAP user interface displays a fixed navigation panel on the left-hand side of each page within the application, for ease of access. Tip: The left navigation menu will display menu items specific to your access and permissions. 3.1.1 Measures Data Entry The Data Entry interface is used to view or enter data points for measures. View Report The View Report interface is used to view data in chart and table formats. Custom Measure The Custom Measure interface is used to create custom measures for data entry and report viewing. Figure 3 - Left Navigation Menu - Measures 3.2 Table Grids Table grids exist throughout the application allowing users to easily view data and perform tasks. See red boxes below. 4|Page Figure 4 - Table Grids 3.2.1 Action Buttons Action buttons are located in almost all of the grids within QI RAP. These buttons are features for users to perform various functions within the interface. 3.2.2 Pagination Bar The pagination bar is available within all grids. Select the left or right arrow to navigate pages, or select a value in the dropdown to display more fields within the grid at a time. 4. Data Entry Tip: Only users with data entry access will be able to complete data entry tasks. 4.1 Select Health Link To View Change Areas and Associated Measures for a selected Health Link: 1. Click Data Entry from the left navigation menu. 2. Select the Health Link from the dropdown menu. 3. Click Go. 5|Page Figure 5 - Data Entry The application will proceed to the Change Area page, which displays each Change Area available to the selected Health Link. 4.2 View Change Area Each Change Area within the initiative will be displayed on the Change Area page. To View Measures Associated with Selected Change Area: 1. Click on the Arrow that Change Area. icon next to a Change Area to view the measures associated with Figure 6 - Data Entry - View Change Area 1 2. Each measure will have three (3) action buttons next to it: 6|Page Figure 7 - Data Entry - View Change Area - Expanded Measure View 4.2.1 Add Data Point Users can enter data for quality improvement measures. To Add Data for Selected Measure: 1. In the expanded measures view, click on the Add data point for the measure. icon next to a measure to add a Figure 8 - Data Entry - Add Data Point 2. The data entry screen will pop up for the selected measure. 7|Page Figure 9 - Data Entry Screen 3. There will be a description of the measure(s) in the box labelled Description. 4. Data entry instructions can be found in the box labelled Instructions to data entry user. 5. Click on the Calendar Control icon beside Start Date. 6. Select a Start Date for the data point. An End Date will be auto-populated by the system based on the selected Start Date. Tip: Data can be entered monthly or quarterly. Health Links are only expected to submit quarterly. If entering quarterly, please choose the last month within the quarter as your start date. The end date will always be the same as the start date since the data point is always stored as a monthly submission. 7. Enter any notes to be associated with this data point in the Annotations text box (e.g. description of an event that occurred during the selected data reporting period). This step is optional. 8. Enter Field values for the measure. Tip: Asterisks (*) indicate mandatory fields. Tip: When entering data for the Primary Care Measure, fill in at least one set of these measures, then enter 0 in fields that are not applicable. 8|Page 9. Once the mandatory fields are filled out, any calculated values for the measure value will appear under Formulas. Tip: Areas that are greyed out do not require input. 10. If user would like to add more data in the next step, click Save & New and repeat steps 3-6. 11. Click Save. 4.2.2 Charts Charts for measures can be viewed through either the Data Entry Change Area page or through View Reports (See section 5.1). To Access Chart: 1. Click on the Change Area name to see associated measures. 2. Click on the Chart icon to view Chart Figure 10 - Data Entry - Chart 3. A pop-up window containing a Chart for the selected measure is displayed, along with a Data Table below. Tip: The Chart and Data Table will be blank for measures with no data points. 4.2.3 View All Users can view all the data points that have been entered for a measure through the View All page. Data points can be added, edited, and/or viewed for the selected measure through the grid. Charts can also be viewed from here. To View All Entered Data Point(s) for Selected Measure: 1. Click on the Change Area name to see the associated measures. 2. Click on the View All icon. 9|Page Figure 10 - Data Entry - View All 3. The View All page will display all data points entered for the measure (1). Users also have access to several action buttons (2) within this page, including: Add Data Point, Edit Data Point and View Chart. Figure 11 - Data Entry - View All Chart 4.2.3.1 Add Data Point for Measure Users can enter data for measures for selected Health Link from the View All grid by clicking on the icon (See 4.2.1 Add Data Point). Figure 12 - Data Entry - View All - Add Data Point 10 | P a g e 4.2.3.2 Edit Data Point for Measure Users can edit data points for measures for selected Health Link from the View All grid by clicking on the Edit icon. To Edit Entered Data Point from View All Grid: 1. Select a data point by clicking on it. 2. Click the Edit icon to edit selected data point. (Please see Figure 14 on next page) Figure 13 - Data Entry - View All - Edit Data Point 3. The data entry pop-up window will be displayed, and any fields within the pop-up can be edited: a. Edit Start Date by clicking on the Calendar Control icon beside Start Date. An End Date will be auto-populated by the system based on the selected Start Date. b. Edit Annotations. c. Edit Field values for a measure. d. If user would like to add more data in the next step, click Save & New to add a new data point. Otherwise, proceed to step 4. 4. Click Save. (Please see Figure 15 on following page). 11 | P a g e Figure 14 - Data Entry - View All - Edit Data Point 4.2.3.3 View Chart for Measure Users can view the Chart for the selected measure within the Health Link from the View All grid by clicking on the View Chart icon. To Access Charts from View All: 1. Click on the View Chart icon on the View All page to view the Chart Report. Figure 16 - Data Entry - View All - View Chart 2. A pop-up window containing a Chart for the selected measure is displayed, along with a Data Table below. 12 | P a g e Tip: Chart and Data Table will be blank for measures with no data points. For more information on the Chart Reports, please see section 5.1 4.2.4 Manage Favourites Users can manage favourite Change Areas allowing easy access to selected Change Areas for selected Health Link. To Manage Favourites: 1. Click Data Entry from the navigation menu on the left panel. 2. Click the Manage Favourite link. Figure 17 - Data Entry - Manage Favourite 3. Select the Change Areas for the Health Link that you would like to have displayed for data entry. 4. Unselect Change Areas that you would like to have hidden for data entry. 5. Click the Save icon on the Manage Favourite grid. 13 | P a g e Figure 18 - Data Entry - Manage Favourite 5. View Report 5.1 View Reports Users can access various reports using the View Report function. To View Report: 1. Click View Report from the navigation menu on the left panel. Figure 19 - View Report 2. Select the report you wish to view using the dropdown menu. 14 | P a g e 3. Click View button. 4. A pop-up window will display the Reports page. Tip: If you receive a pop-up blocker message, select “Allow pop-ups for QI RAP.hqontario.ca” Figure 15 - View Report - Pop-up Blocker 5.2 Types of Reports Eight different types of reports can be viewed for all measures with associated data points including Health Link reports, LHIN reports, and Provincial reports and associated Dashboards. The following section will describe each of the type of reports. 5.2.1: Health Link Report The Health Link Report displays a single Health Link’s data for a single measure for a specific time period. The report includes a Chart and accompanying Data Table. The following report parameters are used to create a Health Link Report: Report Parameters: LHIN: Users can select a LHIN to narrow down the Health Links for the next parameter. Health Link: Users can select the Health Link associated with a LHIN. Tip: There are two parameters called Health Link you must select both, and they must be matching, to move on. Start Year: Users can choose the date that corresponds to the Health Link. Topic: Users can choose the change area they would like to view. Measure: Users can choose the indicator they would like to view. Field: Users can choose from the drop down menu select all or individual data sets you would like to view. Measure Output: User clicks on the drop down menu and chooses either Raw or Cumulative. ‘Raw’ shows the value of the field as entered. ‘Cumulative’ shows the sum of the values for the field for all reporting periods up to and including the value for the last entry. 15 | P a g e Reporting Frequency: Users can choose the frequency for the data being displayed in the chart and table. This field defaults to Quarterly and the drop down menu provides the ability to choose monthly. Visibility: This parameter relates to the visibility of the annotation(s) on the chart. User must choose either None or Annotations. If you choose ‘None’ the annotations will still be seen in the Data Table once you view the report but will not be seen on the chart. Start and End Date: Users can manually change the start and end date to select the range of data to view on the chart and data table. The default start and end date will capture the full range of data for the parameters selected. 1. Select each report parameter using the dropdown menus. Tip: To clear all data entry fields, and re- enter your selections, select F5. 2. Click View Report button. Figure 16 - View Report - Report Parameters 3. The Chart will be displayed according to the selected parameters, along with the Data Table. (Please see Figure 22 on next page) 16 | P a g e Figure 17 - View Report - Chart Report Tip: Reports with a large dataset may have multiple pages. The pagination bar can be used to navigate through the report. 5.2.2 Health Link Dashboard The Health Link Dashboard is a report that displays a single Health Link’s data for all measures for a specific time period. The report includes a Chart and accompanying Data Table. The following report parameters are used to create a Health Link Report: Report Parameters: LHIN: Users can select a LHIN to narrow down the Health Links for the next parameter. Health Link: Users can select the Health Link associated with a LHIN. Reporting Frequency: Users can choose the frequency for the data being displayed in the chart and table. This field defaults to Quarterly and the drop down menu provides the ability to choose monthly. Display Option: User can choose one of three display options: graph, table or graph and table. 17 | P a g e Start and End Date: Users can manually change the start and end date to select the range of data to view on the chart and data table. The default start and end date will capture the full range of data for the parameters selected. 1. Select each report parameter using the dropdown menus. Tip: To clear all fields, and re- enter your selections, select F5. 2. Click View Report button. Figure 23 - View Report – Report Parameters HL Dashboard 3. The dashboard will be displayed according to the selected parameters. Figure 24 - View Report – HL Dashboard 18 | P a g e Tip: Reports with a large dataset may have multiple pages. The pagination bar can be used to navigate through the report. 5.2.3 LHIN Report The LHIN Report is a report that displays multiple Health Links’ data for a single field of a measure for a specific time period. The report includes a Chart and accompanying Data Table. The following report parameters are used to create a LHIN Report: Report Parameters: Start Year: Users can choose the start year associated with the year of HL funding approval you are looking. LHIN: Users can select a LHIN. Tip: If you do not know which LHIN a Health Link is associated with, in the drop down menu choose option “custom group”, this will show the complete menu of the Health Links. Health Link: Users can select the Health Link associated with a LHIN. Topic: Users can choose the change area they would like to view. Measure: Users can choose the indicator they would like to view. Field: Users can choose from the drop down menu “select all” or “individual data sets” you would like to view. Measure Output: User can choose “Individual Health Link” or “Summary of all Health Links” chosen in the previous field. Chart output options include: 1) Individual Health Links – Separate series for each selected Health Link organization is shown in the Chart for the selected Field. 2) Health Links Summary – Single series is shown on the chart as a summary of all of the Health Link organization(s) selected for the selected Field. Start and End Date: Users can manually change the start and end date to select the range of data to view on the chart and data table. The default start and end date will capture the full range of data for the parameters selected. 1. Select each report parameter using the dropdown menus. Tip: To clear all data entry fields, and re- enter your selections, select F5. 2. Click View Report button. 19 | P a g e Figure 18 - View Report - Report Parameters 3. The Chart will be displayed according to the selected parameters, along with the Data Table. Figure 196 - View Report - LHIN Report 20 | P a g e Tip: Reports with a large dataset may have multiple pages. The pagination bar can be used to navigate through the report. 5.2.4 LHIN Dashboard The LHIN Dashboard is a report that displays multiple Health Links data for all measures for a specific time period. The report includes Charts and accompanying Data Tables. 1. Select each report parameter using the dropdown menus. The following report parameters are used to create a LHIN Dashboard: Report Parameters: Start Year: Users can choose the start year associated with the year of HL funding approval you are looking. LHIN: Users can select a LHIN. Display Option: User can choose one of three display options: graph, table or graph and table. Start and End Date: Users can manually change the start and end date to select the range of data to view on the chart and data table. The default start and end date will capture the full range of data for the parameters selected. Tip: To clear all data entry fields, and re- enter your selections, select F5. 2. Click View Report button. Figure 20 - View Report – Report Parameters LHIN Dashboard 3. The dashboard will be displayed according to the selected parameters. 21 | P a g e Figure 28 - View Report – LHIN Dashboard 22 | P a g e Tip: Reports with a large dataset may have multiple pages. The pagination bar can be used to navigate through the report. 5.2.5 Provincial Report The Provincial Report is a report that displays LHIN level summary of Health Links data for a single field of a measure for a specific time period. The report includes a Chart and accompanying Data Table. The following report parameters are used to create a Provincial Report: Report Parameters: Start Year: Users can choose the start year associated with the year of HL funding approval you are looking. LHIN: Users can select a LHIN. Topic: Users can choose the change area they would like to view. Measure: Users can choose the indicator they would like to view. Field: Users can choose from the drop down menu and select individual data sets you would like to view. Measure Output: User can choose Individual LHIN or summary of all LHIN’s chosen in the previous field. Chart output options include: 1) Individual LHINs – separate series for each selected LHIN is shown in the Chart for the selected Field. 2) LHIN Summary – single series is shown on the Chart as a summary of all of the LHIN(s) selected for the selected Field. Start and End Date: Users can manually change the start and end date to select the range of data to view on the chart and data table. The default start and end date will capture the full range of data for the parameters selected. 1. Select each report parameter using the dropdown menus. Tip: To clear all data entry fields, and re- enter your selections, select F5. 2. Click View Report button. Figure 29- View Report - Report Parameters 3. The Chart will be displayed according to the selected parameters, along with the Data Table. 23 | P a g e Figure 21 - View Report - LHIN Report Tip: Reports with a large dataset may have multiple pages. The pagination bar can be used to navigate through the report. 24 | P a g e 5.2.6 Provincial Dashboard The Provincial Dashboard is a report that displays LHIN level summary of Health Links data for all measures for a specific time period. The report includes Charts and accompanying Data Tables. The following report parameters are used to create a Provincial Dashboard: Report Parameters: Start Year: Users can choose the start year associated with the year of HL funding approval you are looking Display Option: User can choose one of three display options: graph, table or graph and table. Start and End Date: Users can manually change the start and end date to select the range of data to view on the chart and data table. The default start and end date will capture the full range of data for the parameters selected. 1. Select each report parameter using the dropdown menus. Tip: To clear all data entry fields, and re- enter your selections, select F5. 2. Click View Report button. Figure 3122 - View Report- Report Parameters 3. The dashboard will be displayed according to the selected parameters. 25 | P a g e Figure 32 - View Report – Provincial Dashboard Tip: Reports with a large dataset may have multiple pages. The pagination bar can be used to navigate through the report. 26 | P a g e 5.2.7 Provincial Snapshot: Cumulative Report Of All Measures A summary report that displays the total number of Health Link Teams that are enrolled in the initiative, as well as the provincial totals for a selected set of measures and fields to capture overall performance in the province. The following report parameters are used to create a Provincial Snapshot: Cumulative Report of All Measures: Report Parameters: Start Year: Users can choose the start year associated with the year of HL funding approval you are looking. Topic: Users can choose the change area they would like to view. Measure: Users can choose the indicator they would like to view. Field: Users can choose from the drop down menu select all or individual data sets they would like to view. Start and End Date: Users can manually change the start and end date to select the range of data to view on the chart and data table. The default start and end date will capture the full range of data for the parameters selected. 1. Select each report parameter using the dropdown menus. Tip: To clear all data entry fields, and re- enter your selections, select F5. 2. Click View Report button. 3. Reporting Parameters: 27 | P a g e Figure 233 - View Report – Provincial Snapshot Report 4. The report will be displayed according to the selected parameters. 5.2.8 Data Entry Status Report A LHIN level report that depicts data entered by associated Health Links for a specific time period. There is an option to select all LHINs for a provincial perspective. The following report parameters are used to create a Data Entry Status Report: Report Parameters: LHIN: Users can select a LHIN. Start and End Date: Users can manually change the start and end date. 1. Select each report parameter using the dropdown menus. Tip: To clear all data entry fields, and re- enter your selections, select F5. 2. Click View Report button. 3. The report will be displayed according to the selected parameters. 28 | P a g e Figure 24 - View Report – Data Entry Status Report 5.3 Print Report To Print Report: 1. Click on the Print Data Table. icon underneath the report parameters to print the Chart and Figure 25 - View Report - Print Report 5.4 Export Report To Export Report: 1. Click on the Export icon underneath the report parameters to export the Chart and Data Table into a variety of formats (Available formats include: XML file with report data, CSV – comma delimited, PDF, MHTML – web archive, Excel, TIFF file, or Word). 29 | P a g e Figure 26 - View Report - Export Report 6 Exiting QI RAP A Close Window button is located at the top right corner of the page. To Exit QI RAP: 1. Click the Close Window button at the top right corner of the page. Figure 27 - Exiting QI RAP 2. Click Yes to confirm exiting QI RAP or No to remain logged in to QI RAP. Figure 38 - Exiting QI RAP – Confirmation 30 | P a g e 7 Technical Support Please contact [email protected] for technical support. We will respond to your email within one business day. 8 Health Link Measures Currently there are 2 Health Link measures that are being entered into QI RAP which include: 1) Number of patients with a coordinated care plan (CCP) developed through the Health Link and 2) Number of patients with regular and timely access to a primary care provider (PCP) 1. Number of patients with a coordinated care plan (CCP) developed through the Health Link Description: Number of Health Link patients with a coordinated plan of care developed through the Health Link during the past Quarter. Developed with the patient/caregiver and two (2) or more health care professionals. Containing a plan for one (1) or more health issues. Instructions: Enter the number of patients for whom coordinated care plans were developed (i.e., completed) in the three month reporting period (net new actual value). The plan must address a minimum of one health issue (health issues can be physical, mental, social or spiritual). In the annotations section, include any information that may influence the number of patients with a coordinated care plan of care. For example, enter "introduced virtual case conferencing through OTN" if you have begun to test the OTN PCVC conferencing technology. Fields: (1) How many patients in your Health Link did you target to develop a coordinated care plan for the quarter being reported? (TARGET) (2) How many patients in your Health Link had a coordinated care plan developed for them by the Health Link in the quarter being reported? (ACTUAL) 2. Number of patients with regular and timely access to a primary care provider Description: Number of Health Link patients with a primary care provider on record with hospitals or CCAC, or have access to primary care provider in the form of appointments, evening clinic, home visits, etc., or have regular and timely access to a primary care provider. Instructions: 31 | P a g e Enter the number of Health Links patients with a primary care provider on record or have access to a primary care provider for the Quarter being reported Fields: A: A: B: B: C: C: (Target) number of Health Link patients with a primary care provider on record with hospitals or CCAC for the quarter being reported. (TARGET) For the quarter being reported, how many patients with the Health Link have a primary care provider on record with hospitals or CCAC? (ACTUAL) (Target) number of Health Link patients with access to a primary care provider in the form of appointments, evening clinic, home visits, for the quarter being reported. (TARGET) For the quarter being reported, how many total patients with the Health Link have access to a primary care provider in the form of appointments, evening clinic, home visits? (ACTUAL) (Target) number of Health Link patients with regular and timely access to a primary care provider for the quarter being reported. (TARGET) For the quarter being reported, how many total patients with the Health Link have regular and timely access to a primary care provider? (ACTUAL) Formulas (1) Total number of patients with regular and timely access to a primary care provider (PCP) (TARGET) This is an automated calculation that sums the target values from field A, B and C together. (2) Total number of patients with regular and timely access to a primary care provider (PCP) (ACTUAL) This is an automated calculation that sums the actual values from field A, B and C together. 32 | P a g e