1
A29142-AB
December 2007
GenomeLab™
Genetic
Analysis
System
User’s Guide
Beckman Coulter, Inc.
4300 North Harbor Boulevard, Fullerton, CA 92834-3100
© Copyright 2006 - 2007 Beckman Coulter, Inc.
Copyright, Licenses and Trademarks
Copyright
© Beckman Coulter, Inc., 2006-2007. All rights reserved. No part of this
publication may be reproduced, transcribed, transmitted, or translated into any
language in any form by any means without the written permission of Beckman
Coulter, Inc.
Licenses and Trademarks
Beckman Coulter® is a registered trademark of Beckman Coulter, Inc.
GenomeLab™ is a trademark of Beckman Coulter, Inc.
All other trademarks are property of their respective owners.
ii
Table of Contents
Section 1
Getting Started . . . . . . . . . . . . . . . . . . . . . . . . . . . . . . . . . . . . 1
1.1 System Overview. . . . . . . . . . . . . . . . . . . . . . . . . . . . . . . . . . . . . . . . . . . . . . . . . . . . . . . . . . . . 1
Purpose of this System . . . . . . . . . . . . . . . . . . . . . . . . . . . . . . . . . . . . . . . . . . . . . . . . . . . . . . . .1
Functional Description . . . . . . . . . . . . . . . . . . . . . . . . . . . . . . . . . . . . . . . . . . . . . . . . . . . . . . . . .1
Hardware . . . . . . . . . . . . . . . . . . . . . . . . . . . . . . . . . . . . . . . . . . . . . . . . . . . . . . . . . . . . . . . . . . .2
Software: User Interface . . . . . . . . . . . . . . . . . . . . . . . . . . . . . . . . . . . . . . . . . . . . . . . . . . . . . . .10
1.2 Operating the System . . . . . . . . . . . . . . . . . . . . . . . . . . . . . . . . . . . . . . . . . . . . . . . . . . . . . . . 13
Preparing a Sample . . . . . . . . . . . . . . . . . . . . . . . . . . . . . . . . . . . . . . . . . . . . . . . . . . . . . . . . . .13
Starting-Up the System . . . . . . . . . . . . . . . . . . . . . . . . . . . . . . . . . . . . . . . . . . . . . . . . . . . . . . .13
Creating a Database and Project Folder . . . . . . . . . . . . . . . . . . . . . . . . . . . . . . . . . . . . . . . . . . .14
Setting up a Sample . . . . . . . . . . . . . . . . . . . . . . . . . . . . . . . . . . . . . . . . . . . . . . . . . . . . . . . . . .14
Running a Sample . . . . . . . . . . . . . . . . . . . . . . . . . . . . . . . . . . . . . . . . . . . . . . . . . . . . . . . . . . .15
Section 2
Sample Setup Module . . . . . . . . . . . . . . . . . . . . . . . . . . . . . . 19
2.1 Overview . . . . . . . . . . . . . . . . . . . . . . . . . . . . . . . . . . . . . . . . . . . . . . . . . . . . . . . . . . . . . . . . . 19
Using the Main Window . . . . . . . . . . . . . . . . . . . . . . . . . . . . . . . . . . . . . . . . . . . . . . . . . . . . . . .19
Menu Bar Options. . . . . . . . . . . . . . . . . . . . . . . . . . . . . . . . . . . . . . . . . . . . . . . . . . . . . . . . . . . .22
Toolbar Icons . . . . . . . . . . . . . . . . . . . . . . . . . . . . . . . . . . . . . . . . . . . . . . . . . . . . . . . . . . . . . . .27
2.2 Using the Sample Setup Module . . . . . . . . . . . . . . . . . . . . . . . . . . . . . . . . . . . . . . . . . . . . . . . 28
Opening a Sample Plate . . . . . . . . . . . . . . . . . . . . . . . . . . . . . . . . . . . . . . . . . . . . . . . . . . . . . . .28
Creating a New Sample Plate . . . . . . . . . . . . . . . . . . . . . . . . . . . . . . . . . . . . . . . . . . . . . . . . . . .28
Opening a Sample Plate . . . . . . . . . . . . . . . . . . . . . . . . . . . . . . . . . . . . . . . . . . . . . . . . . . . . . . .29
Creating a New Sample Plate . . . . . . . . . . . . . . . . . . . . . . . . . . . . . . . . . . . . . . . . . . . . . . . . . . .30
Selecting Samples . . . . . . . . . . . . . . . . . . . . . . . . . . . . . . . . . . . . . . . . . . . . . . . . . . . . . . . . . . .30
Using Property Sets . . . . . . . . . . . . . . . . . . . . . . . . . . . . . . . . . . . . . . . . . . . . . . . . . . . . . . . . . .35
Using Methods . . . . . . . . . . . . . . . . . . . . . . . . . . . . . . . . . . . . . . . . . . . . . . . . . . . . . . . . . . . . . .37
Defining Data Processing Conditions . . . . . . . . . . . . . . . . . . . . . . . . . . . . . . . . . . . . . . . . . . . . .39
Printing the Plate Report or Specifying Sample Plate Print Options . . . . . . . . . . . . . . . . . . . . . .40
Specifying Sample Plate Export Options. . . . . . . . . . . . . . . . . . . . . . . . . . . . . . . . . . . . . . . . . . .41
Export Options . . . . . . . . . . . . . . . . . . . . . . . . . . . . . . . . . . . . . . . . . . . . . . . . . . . . . . . . . . . . . .41
Export Options - Sequencing Results . . . . . . . . . . . . . . . . . . . . . . . . . . . . . . . . . . . . . . . . . . . . .42
Importing Sample Plate Information from TXT Files. . . . . . . . . . . . . . . . . . . . . . . . . . . . . . . . . .42
Exporting Sample Plate Data . . . . . . . . . . . . . . . . . . . . . . . . . . . . . . . . . . . . . . . . . . . . . . . . . . .44
Locking a Sample Plate . . . . . . . . . . . . . . . . . . . . . . . . . . . . . . . . . . . . . . . . . . . . . . . . . . . . . . .44
Viewing the Summary . . . . . . . . . . . . . . . . . . . . . . . . . . . . . . . . . . . . . . . . . . . . . . . . . . . . . . . .44
Section 3
Run Module . . . . . . . . . . . . . . . . . . . . . . . . . . . . . . . . . . . . . 45
3.1 Run Module Overview . . . . . . . . . . . . . . . . . . . . . . . . . . . . . . . . . . . . . . . . . . . . . . . . . . . . . . . 45
Using the Run Control Main Window . . . . . . . . . . . . . . . . . . . . . . . . . . . . . . . . . . . . . . . . . . . . .46
Menu Bar Options. . . . . . . . . . . . . . . . . . . . . . . . . . . . . . . . . . . . . . . . . . . . . . . . . . . . . . . . . . . .47
Toolbar Icons . . . . . . . . . . . . . . . . . . . . . . . . . . . . . . . . . . . . . . . . . . . . . . . . . . . . . . . . . . . . . . .53
Status Monitor . . . . . . . . . . . . . . . . . . . . . . . . . . . . . . . . . . . . . . . . . . . . . . . . . . . . . . . . . . . . . .57
Window Selection Tabs . . . . . . . . . . . . . . . . . . . . . . . . . . . . . . . . . . . . . . . . . . . . . . . . . . . . . . .59
3.2 Using the Run Module. . . . . . . . . . . . . . . . . . . . . . . . . . . . . . . . . . . . . . . . . . . . . . . . . . . . . . . 64
Gel Plug Warning . . . . . . . . . . . . . . . . . . . . . . . . . . . . . . . . . . . . . . . . . . . . . . . . . . . . . . . . . . . .64
GenomeLab Genetic Analysis System User’s Guide
PN A29142-AB
iii
Defining System Preferences . . . . . . . . . . . . . . . . . . . . . . . . . . . . . . . . . . . . . . . . . . . . . . . . . ..65
Running Sample Plates . . . . . . . . . . . . . . . . . . . . . . . . . . . . . . . . . . . . . . . . . . . . . . . . . . . . . . ..65
Setting or Changing Display Options. . . . . . . . . . . . . . . . . . . . . . . . . . . . . . . . . . . . . . . . . . . . ..70
Viewing the Last Analysis Performed . . . . . . . . . . . . . . . . . . . . . . . . . . . . . . . . . . . . . . . . . . . ..72
3.3 Using Direct Control. . . . . . . . . . . . . . . . . . . . . . . . . . . . . . . . . . . . . . . . . . . . . . . . . . . . . . . . . 73
Loading the Sample Plate and Buffer Plate . . . . . . . . . . . . . . . . . . . . . . . . . . . . . . . . . . . . . . . ..74
Setting the Capillary Temperature . . . . . . . . . . . . . . . . . . . . . . . . . . . . . . . . . . . . . . . . . . . . . . ..76
Performing an Optical Alignment . . . . . . . . . . . . . . . . . . . . . . . . . . . . . . . . . . . . . . . . . . . . . . ..77
Monitoring the Baseline. . . . . . . . . . . . . . . . . . . . . . . . . . . . . . . . . . . . . . . . . . . . . . . . . . . . . . ..78
Viewing Capillary Information . . . . . . . . . . . . . . . . . . . . . . . . . . . . . . . . . . . . . . . . . . . . . . . . . ..79
Viewing Gel Information . . . . . . . . . . . . . . . . . . . . . . . . . . . . . . . . . . . . . . . . . . . . . . . . . . . . . ..80
Viewing or Changing Buffer Information . . . . . . . . . . . . . . . . . . . . . . . . . . . . . . . . . . . . . . . . . ..80
Removing and Replacing the Capillary Array. . . . . . . . . . . . . . . . . . . . . . . . . . . . . . . . . . . . . . ..81
Removing and Replacing a Gel Cartridge/Gel Pump Plug . . . . . . . . . . . . . . . . . . . . . . . . . . . . ..87
Removing the Manifold Plug . . . . . . . . . . . . . . . . . . . . . . . . . . . . . . . . . . . . . . . . . . . . . . . . . . ..91
Section 4
Sequence Analysis . . . . . . . . . . . . . . . . . . . . . . . . . . . . . . . . 95
4.1 Sequence Analysis Module Overview . . . . . . . . . . . . . . . . . . . . . . . . . . . . . . . . . . . . . . . . . . . . 95
Main Window . . . . . . . . . . . . . . . . . . . . . . . . . . . . . . . . . . . . . . . . . . . . . . . . . . . . . . . . . . . . . ..95
Menu Bar Options . . . . . . . . . . . . . . . . . . . . . . . . . . . . . . . . . . . . . . . . . . . . . . . . . . . . . . . . . . ..97
Toolbar Icons . . . . . . . . . . . . . . . . . . . . . . . . . . . . . . . . . . . . . . . . . . . . . . . . . . . . . . . . . . . . ..106
4.2 Using the Sequence Analysis Module . . . . . . . . . . . . . . . . . . . . . . . . . . . . . . . . . . . . . . . . . . 114
Viewing Sample Data. . . . . . . . . . . . . . . . . . . . . . . . . . . . . . . . . . . . . . . . . . . . . . . . . . . . . . . ..114
Editing Sequence Analysis Parameters . . . . . . . . . . . . . . . . . . . . . . . . . . . . . . . . . . . . . . . . . ..116
Performing Quality-based Trimming . . . . . . . . . . . . . . . . . . . . . . . . . . . . . . . . . . . . . . . . . . . ..127
Performing Sequence-based Trimming. . . . . . . . . . . . . . . . . . . . . . . . . . . . . . . . . . . . . . . . . ..129
Editing Bases. . . . . . . . . . . . . . . . . . . . . . . . . . . . . . . . . . . . . . . . . . . . . . . . . . . . . . . . . . . . . ..135
Sequence Result Properties . . . . . . . . . . . . . . . . . . . . . . . . . . . . . . . . . . . . . . . . . . . . . . . . . ..138
Setting or Changing Display Options. . . . . . . . . . . . . . . . . . . . . . . . . . . . . . . . . . . . . . . . . . . ..145
Changing Display Colors . . . . . . . . . . . . . . . . . . . . . . . . . . . . . . . . . . . . . . . . . . . . . . . . . . . . ..147
Pinning Results . . . . . . . . . . . . . . . . . . . . . . . . . . . . . . . . . . . . . . . . . . . . . . . . . . . . . . . . . . . ..148
Performing a Batch Analysis . . . . . . . . . . . . . . . . . . . . . . . . . . . . . . . . . . . . . . . . . . . . . . . . . ..148
Using Compare Mode . . . . . . . . . . . . . . . . . . . . . . . . . . . . . . . . . . . . . . . . . . . . . . . . . . . . . . ..150
Sequence Result Report . . . . . . . . . . . . . . . . . . . . . . . . . . . . . . . . . . . . . . . . . . . . . . . . . . . . ..151
Section 5
Sequence Investigator Module . . . . . . . . . . . . . . . . . . . . . . . . 165
5.1 Sequence Investigator Module Overview . . . . . . . . . . . . . . . . . . . . . . . . . . . . . . . . . . . . . . . . 165
Main Window . . . . . . . . . . . . . . . . . . . . . . . . . . . . . . . . . . . . . . . . . . . . . . . . . . . . . . . . . . . . ..165
Menu Bar Options . . . . . . . . . . . . . . . . . . . . . . . . . . . . . . . . . . . . . . . . . . . . . . . . . . . . . . . . . ..167
Toolbar Icons . . . . . . . . . . . . . . . . . . . . . . . . . . . . . . . . . . . . . . . . . . . . . . . . . . . . . . . . . . . . ..171
5.2 Sequence Investigator Procedures. . . . . . . . . . . . . . . . . . . . . . . . . . . . . . . . . . . . . . . . . . . . . 173
Creating a Reference File. . . . . . . . . . . . . . . . . . . . . . . . . . . . . . . . . . . . . . . . . . . . . . . . . . . . ..173
Selecting a Reference and Sequence Results . . . . . . . . . . . . . . . . . . . . . . . . . . . . . . . . . . . . ..174
Numbering . . . . . . . . . . . . . . . . . . . . . . . . . . . . . . . . . . . . . . . . . . . . . . . . . . . . . . . . . . . . . . ..176
Viewing Reference Amino Acid Translations . . . . . . . . . . . . . . . . . . . . . . . . . . . . . . . . . . . . . ..176
iv
GenomeLab Genetic Analysis System User’s Guide
PN A29142-AB
Viewing Sequence Traces. . . . . . . . . . . . . . . . . . . . . . . . . . . . . . . . . . . . . . . . . . . . . . . . . . . . .176
Viewing Consensus Amino Acid Translations. . . . . . . . . . . . . . . . . . . . . . . . . . . . . . . . . . . . . .177
Printing Reports . . . . . . . . . . . . . . . . . . . . . . . . . . . . . . . . . . . . . . . . . . . . . . . . . . . . . . . . . . . .181
Exporting the Sequence . . . . . . . . . . . . . . . . . . . . . . . . . . . . . . . . . . . . . . . . . . . . . . . . . . . . . .181
Saving the Data . . . . . . . . . . . . . . . . . . . . . . . . . . . . . . . . . . . . . . . . . . . . . . . . . . . . . . . . . . . .182
Section 6
Fragment Analysis Module . . . . . . . . . . . . . . . . . . . . . . . . . . 183
6.1 Fragment Analysis Module Overview. . . . . . . . . . . . . . . . . . . . . . . . . . . . . . . . . . . . . . . . . . . 183
Main Window . . . . . . . . . . . . . . . . . . . . . . . . . . . . . . . . . . . . . . . . . . . . . . . . . . . . . . . . . . . . . .184
Menu Bar Options. . . . . . . . . . . . . . . . . . . . . . . . . . . . . . . . . . . . . . . . . . . . . . . . . . . . . . . . . . .185
Toolbar Icons . . . . . . . . . . . . . . . . . . . . . . . . . . . . . . . . . . . . . . . . . . . . . . . . . . . . . . . . . . . . . .190
6.2 Fragment Analysis Procedures . . . . . . . . . . . . . . . . . . . . . . . . . . . . . . . . . . . . . . . . . . . . . . . 192
Performance Safeguards . . . . . . . . . . . . . . . . . . . . . . . . . . . . . . . . . . . . . . . . . . . . . . . . . . . . .192
6.3 Working with Studies in the Fragment Analysis Module . . . . . . . . . . . . . . . . . . . . . . . . . . . . 193
Selecting the Components of the New Study . . . . . . . . . . . . . . . . . . . . . . . . . . . . . . . . . . . . . .194
Selecting Raw Data for the New Study . . . . . . . . . . . . . . . . . . . . . . . . . . . . . . . . . . . . . . . . . . .195
Selecting an Analysis Parameter Set . . . . . . . . . . . . . . . . . . . . . . . . . . . . . . . . . . . . . . . . . . . .197
Analyzing the Data . . . . . . . . . . . . . . . . . . . . . . . . . . . . . . . . . . . . . . . . . . . . . . . . . . . . . . . . . .198
Selecting Additional Results to add to the Study . . . . . . . . . . . . . . . . . . . . . . . . . . . . . . . . . . .199
6.4 Defining Fragment Analysis Parameters . . . . . . . . . . . . . . . . . . . . . . . . . . . . . . . . . . . . . . . . 200
General Tab . . . . . . . . . . . . . . . . . . . . . . . . . . . . . . . . . . . . . . . . . . . . . . . . . . . . . . . . . . . . . . .201
Analysis Method Tab . . . . . . . . . . . . . . . . . . . . . . . . . . . . . . . . . . . . . . . . . . . . . . . . . . . . . . . .202
Quantitation Tab . . . . . . . . . . . . . . . . . . . . . . . . . . . . . . . . . . . . . . . . . . . . . . . . . . . . . . . . . . . .205
STR Locus Tags Tab . . . . . . . . . . . . . . . . . . . . . . . . . . . . . . . . . . . . . . . . . . . . . . . . . . . . . . . .206
SNP Locus Tags Tab . . . . . . . . . . . . . . . . . . . . . . . . . . . . . . . . . . . . . . . . . . . . . . . . . . . . . . . .208
Advanced Tab . . . . . . . . . . . . . . . . . . . . . . . . . . . . . . . . . . . . . . . . . . . . . . . . . . . . . . . . . . . . . .210
6.5 Using the STR Locus Tag Editor . . . . . . . . . . . . . . . . . . . . . . . . . . . . . . . . . . . . . . . . . . . . . . 212
Locus Tab. . . . . . . . . . . . . . . . . . . . . . . . . . . . . . . . . . . . . . . . . . . . . . . . . . . . . . . . . . . . . . . . .212
Allele ID Criteria . . . . . . . . . . . . . . . . . . . . . . . . . . . . . . . . . . . . . . . . . . . . . . . . . . . . . . . . . . . .215
6.6 Using the SNP Locus Tag Editor . . . . . . . . . . . . . . . . . . . . . . . . . . . . . . . . . . . . . . . . . . . . . . 219
Result Set Filtering . . . . . . . . . . . . . . . . . . . . . . . . . . . . . . . . . . . . . . . . . . . . . . . . . . . . . . . . . .220
Accessing the Result Set View . . . . . . . . . . . . . . . . . . . . . . . . . . . . . . . . . . . . . . . . . . . . . . . . .221
Applying Exclusion Filters to the Result Set Data . . . . . . . . . . . . . . . . . . . . . . . . . . . . . . . . . . .222
Finding Exclusion Filters. . . . . . . . . . . . . . . . . . . . . . . . . . . . . . . . . . . . . . . . . . . . . . . . . . . . . .222
Viewing the Summary . . . . . . . . . . . . . . . . . . . . . . . . . . . . . . . . . . . . . . . . . . . . . . . . . . . . . . .223
Customizing the Result Set View . . . . . . . . . . . . . . . . . . . . . . . . . . . . . . . . . . . . . . . . . . . . . . .223
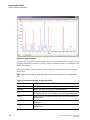
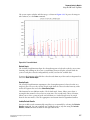
Viewing Electropherogram Data . . . . . . . . . . . . . . . . . . . . . . . . . . . . . . . . . . . . . . . . . . . . . . . .223
Re-Analyzing Results . . . . . . . . . . . . . . . . . . . . . . . . . . . . . . . . . . . . . . . . . . . . . . . . . . . . . . . .228
6.7 Using Fragment Lists . . . . . . . . . . . . . . . . . . . . . . . . . . . . . . . . . . . . . . . . . . . . . . . . . . . . . . 231
Accessing the Fragment List View . . . . . . . . . . . . . . . . . . . . . . . . . . . . . . . . . . . . . . . . . . . . . .231
Applying Exclusion Filters to the Fragment List . . . . . . . . . . . . . . . . . . . . . . . . . . . . . . . . . . . .232
Available Exclusion Filters . . . . . . . . . . . . . . . . . . . . . . . . . . . . . . . . . . . . . . . . . . . . . . . . . . . .232
Customizing the Fragment List . . . . . . . . . . . . . . . . . . . . . . . . . . . . . . . . . . . . . . . . . . . . . . . . .232
Manually Selecting Peaks for the Fragment List . . . . . . . . . . . . . . . . . . . . . . . . . . . . . . . . . . . .232
Exporting a Fragment List to CSV File . . . . . . . . . . . . . . . . . . . . . . . . . . . . . . . . . . . . . . . . . . .232
Showing a Stacked Graph . . . . . . . . . . . . . . . . . . . . . . . . . . . . . . . . . . . . . . . . . . . . . . . . . . . .233
GenomeLab Genetic Analysis System User’s Guide
PN A29142-AB
v
Including, Excluding & Resetting Peaks in the Fragment List . . . . . . . . . . . . . . . . . . . . . . . . ..233
6.8 Performing Bin Analysis. . . . . . . . . . . . . . . . . . . . . . . . . . . . . . . . . . . . . . . . . . . . . . . . . . . . . 233
Setting up a Bin Analysis. . . . . . . . . . . . . . . . . . . . . . . . . . . . . . . . . . . . . . . . . . . . . . . . . . . . ..233
Defining Parameters . . . . . . . . . . . . . . . . . . . . . . . . . . . . . . . . . . . . . . . . . . . . . . . . . . . . . . . ..234
Viewing Bin Analysis . . . . . . . . . . . . . . . . . . . . . . . . . . . . . . . . . . . . . . . . . . . . . . . . . . . . . . . ..235
Investigating Points. . . . . . . . . . . . . . . . . . . . . . . . . . . . . . . . . . . . . . . . . . . . . . . . . . . . . . . . ..236
Updating the Locus Tag and Allele List . . . . . . . . . . . . . . . . . . . . . . . . . . . . . . . . . . . . . . . . . ..237
Reviewing the Source Data . . . . . . . . . . . . . . . . . . . . . . . . . . . . . . . . . . . . . . . . . . . . . . . . . . ..238
6.9 Calculating Peak Ratios . . . . . . . . . . . . . . . . . . . . . . . . . . . . . . . . . . . . . . . . . . . . . . . . . . . . . 239
Beginning a Peak Ratio Calculation . . . . . . . . . . . . . . . . . . . . . . . . . . . . . . . . . . . . . . . . . . . . ..239
Selecting a Reference Trace . . . . . . . . . . . . . . . . . . . . . . . . . . . . . . . . . . . . . . . . . . . . . . . . . ..241
Selecting a Reference Peak . . . . . . . . . . . . . . . . . . . . . . . . . . . . . . . . . . . . . . . . . . . . . . . . . . ..241
Selecting a Test Peak . . . . . . . . . . . . . . . . . . . . . . . . . . . . . . . . . . . . . . . . . . . . . . . . . . . . . . ..242
6.10 Performing AFLP Analysis . . . . . . . . . . . . . . . . . . . . . . . . . . . . . . . . . . . . . . . . . . . . . . . . . . 242
Using the AFLP Feature . . . . . . . . . . . . . . . . . . . . . . . . . . . . . . . . . . . . . . . . . . . . . . . . . . . . . ..242
Setting the AFLP Analysis Parameters. . . . . . . . . . . . . . . . . . . . . . . . . . . . . . . . . . . . . . . . . . ..243
Starting a New AFLP Analysis . . . . . . . . . . . . . . . . . . . . . . . . . . . . . . . . . . . . . . . . . . . . . . . . ..244
Viewing the Cluster Analysis . . . . . . . . . . . . . . . . . . . . . . . . . . . . . . . . . . . . . . . . . . . . . . . . . ..244
Setting Cluster Analysis Parameters . . . . . . . . . . . . . . . . . . . . . . . . . . . . . . . . . . . . . . . . . . . ..245
Customizing the AFLP Table . . . . . . . . . . . . . . . . . . . . . . . . . . . . . . . . . . . . . . . . . . . . . . . . . ..246
Exporting the AFLP Analysis Results. . . . . . . . . . . . . . . . . . . . . . . . . . . . . . . . . . . . . . . . . . . ..246
6.11 Performing LOH Analysis. . . . . . . . . . . . . . . . . . . . . . . . . . . . . . . . . . . . . . . . . . . . . . . . . . . 246
6.12 Customizing the Results List . . . . . . . . . . . . . . . . . . . . . . . . . . . . . . . . . . . . . . . . . . . . . . . . 248
Selecting Columns for Display . . . . . . . . . . . . . . . . . . . . . . . . . . . . . . . . . . . . . . . . . . . . . . . ..248
Sorting the Results List. . . . . . . . . . . . . . . . . . . . . . . . . . . . . . . . . . . . . . . . . . . . . . . . . . . . . ..249
6.13 Reporting Results . . . . . . . . . . . . . . . . . . . . . . . . . . . . . . . . . . . . . . . . . . . . . . . . . . . . . . . . 251
Using Report Templates . . . . . . . . . . . . . . . . . . . . . . . . . . . . . . . . . . . . . . . . . . . . . . . . . . . . ..252
Editing Graph Displays . . . . . . . . . . . . . . . . . . . . . . . . . . . . . . . . . . . . . . . . . . . . . . . . . . . . . ..253
6.14 Exporting Results. . . . . . . . . . . . . . . . . . . . . . . . . . . . . . . . . . . . . . . . . . . . . . . . . . . . . . . . . 256
Text File Format. . . . . . . . . . . . . . . . . . . . . . . . . . . . . . . . . . . . . . . . . . . . . . . . . . . . . . . . . . . ..258
CEQ File Format. . . . . . . . . . . . . . . . . . . . . . . . . . . . . . . . . . . . . . . . . . . . . . . . . . . . . . . . . . . ..259
Exporting Fragment Lists or Genotypes from a Study. . . . . . . . . . . . . . . . . . . . . . . . . . . . . . ..259
Transferring Fragment Data to eXpress Profiler . . . . . . . . . . . . . . . . . . . . . . . . . . . . . . . . . . ..260
Section 7
Gene Expression . . . . . . . . . . . . . . . . . . . . . . . . . . . . . . . . . . 265
7.1 eXpress Profiler Overview . . . . . . . . . . . . . . . . . . . . . . . . . . . . . . . . . . . . . . . . . . . . . . . . . . . 265
eXpress Profiler Suite . . . . . . . . . . . . . . . . . . . . . . . . . . . . . . . . . . . . . . . . . . . . . . . . . . . . . . ..266
Using the Controller . . . . . . . . . . . . . . . . . . . . . . . . . . . . . . . . . . . . . . . . . . . . . . . . . . . . . . . ..266
7.2 Software Administration . . . . . . . . . . . . . . . . . . . . . . . . . . . . . . . . . . . . . . . . . . . . . . . . . . . . 267
Managing User Accounts . . . . . . . . . . . . . . . . . . . . . . . . . . . . . . . . . . . . . . . . . . . . . . . . . . . ..269
Managing Genes . . . . . . . . . . . . . . . . . . . . . . . . . . . . . . . . . . . . . . . . . . . . . . . . . . . . . . . . . . ..272
Managing Primers. . . . . . . . . . . . . . . . . . . . . . . . . . . . . . . . . . . . . . . . . . . . . . . . . . . . . . . . . ..274
Managing Universal Tags . . . . . . . . . . . . . . . . . . . . . . . . . . . . . . . . . . . . . . . . . . . . . . . . . . . ..276
7.3 Logging in as an eXpress Profiler User . . . . . . . . . . . . . . . . . . . . . . . . . . . . . . . . . . . . . . . . . 278
Changing a User Password . . . . . . . . . . . . . . . . . . . . . . . . . . . . . . . . . . . . . . . . . . . . . . . . . . ..279
7.4 eXpress Designer Module . . . . . . . . . . . . . . . . . . . . . . . . . . . . . . . . . . . . . . . . . . . . . . . . . . . 280
vi
GenomeLab Genetic Analysis System User’s Guide
PN A29142-AB
Designing a Multiplex with the eXpress Designer. . . . . . . . . . . . . . . . . . . . . . . . . . . . . . . . . . .281
Retrieving Gene Sequences with FASTA. . . . . . . . . . . . . . . . . . . . . . . . . . . . . . . . . . . . . . . . . .284
Evaluating Multiplex Primers . . . . . . . . . . . . . . . . . . . . . . . . . . . . . . . . . . . . . . . . . . . . . . . . . .286
Evaluating Primer and Amplicon Sequences with BLAST . . . . . . . . . . . . . . . . . . . . . . . . . . . . .287
Designing Primers . . . . . . . . . . . . . . . . . . . . . . . . . . . . . . . . . . . . . . . . . . . . . . . . . . . . . . . . . .289
7.5 Multiplex Designer . . . . . . . . . . . . . . . . . . . . . . . . . . . . . . . . . . . . . . . . . . . . . . . . . . . . . . . . 293
Creating a Multiplex with Genes and Primers . . . . . . . . . . . . . . . . . . . . . . . . . . . . . . . . . . . . . .294
Performing a Gene Expression Analysis with the Multiplex Design . . . . . . . . . . . . . . . . . . . . .297
7.6 eXpress Analysis Module . . . . . . . . . . . . . . . . . . . . . . . . . . . . . . . . . . . . . . . . . . . . . . . . . . . 298
Creating a New Analysis . . . . . . . . . . . . . . . . . . . . . . . . . . . . . . . . . . . . . . . . . . . . . . . . . . . . . .299
Setting up a Plate . . . . . . . . . . . . . . . . . . . . . . . . . . . . . . . . . . . . . . . . . . . . . . . . . . . . . . . . . . .302
Setting up Peak Binning . . . . . . . . . . . . . . . . . . . . . . . . . . . . . . . . . . . . . . . . . . . . . . . . . . . . . .305
Viewing Data for a Selected Well . . . . . . . . . . . . . . . . . . . . . . . . . . . . . . . . . . . . . . . . . . . . . . .306
Normalizing Peaks . . . . . . . . . . . . . . . . . . . . . . . . . . . . . . . . . . . . . . . . . . . . . . . . . . . . . . . . . .308
7.7 eXpress Map Module . . . . . . . . . . . . . . . . . . . . . . . . . . . . . . . . . . . . . . . . . . . . . . . . . . . . . . 312
Creating a Profile Graph . . . . . . . . . . . . . . . . . . . . . . . . . . . . . . . . . . . . . . . . . . . . . . . . . . . . . .313
Creating a Correlation Graph . . . . . . . . . . . . . . . . . . . . . . . . . . . . . . . . . . . . . . . . . . . . . . . . . .314
Creating K-Means Clusters . . . . . . . . . . . . . . . . . . . . . . . . . . . . . . . . . . . . . . . . . . . . . . . . . . . .315
7.8 eXpress Backup and Restore. . . . . . . . . . . . . . . . . . . . . . . . . . . . . . . . . . . . . . . . . . . . . . . . . 316
Saving the Backup Files . . . . . . . . . . . . . . . . . . . . . . . . . . . . . . . . . . . . . . . . . . . . . . . . . . . . . .316
Restoring the Backup Files . . . . . . . . . . . . . . . . . . . . . . . . . . . . . . . . . . . . . . . . . . . . . . . . . . . .316
Section 8
Database Management . . . . . . . . . . . . . . . . . . . . . . . . . . . . . 319
8.1 Data Manager Module Overview . . . . . . . . . . . . . . . . . . . . . . . . . . . . . . . . . . . . . . . . . . . . . . 319
Main Window . . . . . . . . . . . . . . . . . . . . . . . . . . . . . . . . . . . . . . . . . . . . . . . . . . . . . . . . . . . . . .320
Menu Bar Options. . . . . . . . . . . . . . . . . . . . . . . . . . . . . . . . . . . . . . . . . . . . . . . . . . . . . . . . . . .320
Toolbar Icons . . . . . . . . . . . . . . . . . . . . . . . . . . . . . . . . . . . . . . . . . . . . . . . . . . . . . . . . . . . . . .325
8.2 Data Manager Procedures. . . . . . . . . . . . . . . . . . . . . . . . . . . . . . . . . . . . . . . . . . . . . . . . . . . 327
Storing Methods and Parameters . . . . . . . . . . . . . . . . . . . . . . . . . . . . . . . . . . . . . . . . . . . . . . .327
Creating a Database . . . . . . . . . . . . . . . . . . . . . . . . . . . . . . . . . . . . . . . . . . . . . . . . . . . . . . . . .327
Setting the Working Database . . . . . . . . . . . . . . . . . . . . . . . . . . . . . . . . . . . . . . . . . . . . . . . . .328
Creating and Naming a Project . . . . . . . . . . . . . . . . . . . . . . . . . . . . . . . . . . . . . . . . . . . . . . . . .328
Deleting a Project or Database . . . . . . . . . . . . . . . . . . . . . . . . . . . . . . . . . . . . . . . . . . . . . . . . .328
Renaming a Project or Database: . . . . . . . . . . . . . . . . . . . . . . . . . . . . . . . . . . . . . . . . . . . . . . .328
Checking the Database Size . . . . . . . . . . . . . . . . . . . . . . . . . . . . . . . . . . . . . . . . . . . . . . . . . . .329
Reducing the Database Size . . . . . . . . . . . . . . . . . . . . . . . . . . . . . . . . . . . . . . . . . . . . . . . . . . .329
Backing Up a Database . . . . . . . . . . . . . . . . . . . . . . . . . . . . . . . . . . . . . . . . . . . . . . . . . . . . . . .330
Restoring the Database . . . . . . . . . . . . . . . . . . . . . . . . . . . . . . . . . . . . . . . . . . . . . . . . . . . . . .331
Converting Individual IDs to Subject IDs . . . . . . . . . . . . . . . . . . . . . . . . . . . . . . . . . . . . . . . . .332
Creating New Size Standards . . . . . . . . . . . . . . . . . . . . . . . . . . . . . . . . . . . . . . . . . . . . . . . . . .332
Exporting Database Files from the Data Manager . . . . . . . . . . . . . . . . . . . . . . . . . . . . . . . . . . .333
Importing Database Files . . . . . . . . . . . . . . . . . . . . . . . . . . . . . . . . . . . . . . . . . . . . . . . . . . . . .337
Generating a Sample Run History. . . . . . . . . . . . . . . . . . . . . . . . . . . . . . . . . . . . . . . . . . . . . . .338
Administrative Tools. . . . . . . . . . . . . . . . . . . . . . . . . . . . . . . . . . . . . . . . . . . . . . . . . . . . . . . . .338
GenomeLab Genetic Analysis System User’s Guide
PN A29142-AB
vii
Section 9
Maintenance and Diagnostics . . . . . . . . . . . . . . . . . . . . . . . . . 343
9.1 Routine Maintenance . . . . . . . . . . . . . . . . . . . . . . . . . . . . . . . . . . . . . . . . . . . . . . . . . . . . . . . 343
Cleaning the Capillary Array . . . . . . . . . . . . . . . . . . . . . . . . . . . . . . . . . . . . . . . . . . . . . . . . . ..344
Replacing the Gel Waste Bottle . . . . . . . . . . . . . . . . . . . . . . . . . . . . . . . . . . . . . . . . . . . . . . . ..349
Replacing the Wetting Tray . . . . . . . . . . . . . . . . . . . . . . . . . . . . . . . . . . . . . . . . . . . . . . . . . . ..350
9.2 Direct Control and Replenishment . . . . . . . . . . . . . . . . . . . . . . . . . . . . . . . . . . . . . . . . . . . . . 352
Accessing the Direct Control Window . . . . . . . . . . . . . . . . . . . . . . . . . . . . . . . . . . . . . . . . . . ..353
Loading the Sample Plate and Buffer Plate . . . . . . . . . . . . . . . . . . . . . . . . . . . . . . . . . . . . . . ..353
Specifying Capillary Temperature . . . . . . . . . . . . . . . . . . . . . . . . . . . . . . . . . . . . . . . . . . . . . ..356
Denaturing a Sample . . . . . . . . . . . . . . . . . . . . . . . . . . . . . . . . . . . . . . . . . . . . . . . . . . . . . . . ..357
Injecting a Sample. . . . . . . . . . . . . . . . . . . . . . . . . . . . . . . . . . . . . . . . . . . . . . . . . . . . . . . . . ..357
Performing a Separation . . . . . . . . . . . . . . . . . . . . . . . . . . . . . . . . . . . . . . . . . . . . . . . . . . . . ..358
Replenishing the Capillaries with Gel. . . . . . . . . . . . . . . . . . . . . . . . . . . . . . . . . . . . . . . . . . . ..358
Purging the Manifold. . . . . . . . . . . . . . . . . . . . . . . . . . . . . . . . . . . . . . . . . . . . . . . . . . . . . . . ..358
Performing an Optical Alignment . . . . . . . . . . . . . . . . . . . . . . . . . . . . . . . . . . . . . . . . . . . . . ..359
Viewing Capillary Information . . . . . . . . . . . . . . . . . . . . . . . . . . . . . . . . . . . . . . . . . . . . . . . . ..359
Viewing Gel Information . . . . . . . . . . . . . . . . . . . . . . . . . . . . . . . . . . . . . . . . . . . . . . . . . . . . ..360
Viewing or Changing Buffer Information . . . . . . . . . . . . . . . . . . . . . . . . . . . . . . . . . . . . . . . . ..361
Removing and Replacing the Capillary Array. . . . . . . . . . . . . . . . . . . . . . . . . . . . . . . . . . . . . ..361
Removing and Replacing a Gel Cartridge/Gel Pump Plug . . . . . . . . . . . . . . . . . . . . . . . . . . . ..367
Removing the Manifold Plug . . . . . . . . . . . . . . . . . . . . . . . . . . . . . . . . . . . . . . . . . . . . . . . . . ..371
9.3 Biological Waste Disposal . . . . . . . . . . . . . . . . . . . . . . . . . . . . . . . . . . . . . . . . . . . . . . . . . . . 373
Disposal of Formamide from the Sample Plate . . . . . . . . . . . . . . . . . . . . . . . . . . . . . . . . . . . ..374
Disposal of Buffer/Gel Mixture from the Buffer Plate. . . . . . . . . . . . . . . . . . . . . . . . . . . . . . . ..375
Disposal of the Capillary Array . . . . . . . . . . . . . . . . . . . . . . . . . . . . . . . . . . . . . . . . . . . . . . . ..376
Disposal of the Gel Cartridge. . . . . . . . . . . . . . . . . . . . . . . . . . . . . . . . . . . . . . . . . . . . . . . . . ..376
Disposal of D.I. Water/Gel Mixture from the Wetting Tray. . . . . . . . . . . . . . . . . . . . . . . . . . . ..376
Disposal of the Gel Waste Bottle . . . . . . . . . . . . . . . . . . . . . . . . . . . . . . . . . . . . . . . . . . . . . . ..377
9.4 Consumable Items List . . . . . . . . . . . . . . . . . . . . . . . . . . . . . . . . . . . . . . . . . . . . . . . . . . . . . 378
9.5 Diagnostics . . . . . . . . . . . . . . . . . . . . . . . . . . . . . . . . . . . . . . . . . . . . . . . . . . . . . . . . . . . . . . 382
Re-Initializing the System . . . . . . . . . . . . . . . . . . . . . . . . . . . . . . . . . . . . . . . . . . . . . . . . . . . ..382
Homing the Plates and/or Gel Pump . . . . . . . . . . . . . . . . . . . . . . . . . . . . . . . . . . . . . . . . . . . ..382
Viewing PC Settings . . . . . . . . . . . . . . . . . . . . . . . . . . . . . . . . . . . . . . . . . . . . . . . . . . . . . . . ..382
Viewing Instrument Status . . . . . . . . . . . . . . . . . . . . . . . . . . . . . . . . . . . . . . . . . . . . . . . . . . ..383
Viewing Optical Scan Data. . . . . . . . . . . . . . . . . . . . . . . . . . . . . . . . . . . . . . . . . . . . . . . . . . . ..383
Monitoring the Baseline. . . . . . . . . . . . . . . . . . . . . . . . . . . . . . . . . . . . . . . . . . . . . . . . . . . . . ..383
viii
GenomeLab Genetic Analysis System User’s Guide
PN A29142-AB
Safety Information
Safety Information
This section provides safety information and instructions for the hardware and accessories of
the system. It includes the following topics:
r
"Safety Symbols" on page x
r
"Chemical and Biological Safety" on page xi
r
"Electrical Safety" on page xi
r
"Moving Parts" on page xii
r
"Laser Safety" on page xii
r
"Electrical Safety" on page xi
r
"Moving Parts" on page xii
r
"Laser Safety" on page xii
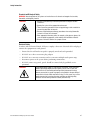
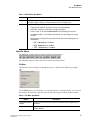
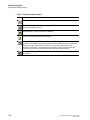
Notes and Warnings
The following information describes the notes and warnings used in this document.
NOTE Contains supplemental or explanatory information concerning the current topic or procedural step.
IMPORTANT Used whenever an action or circumstance may potentially cause personal injury. Mechanical
damage may also result. Also can contain information about a possible software program failure, draw
attention to a specific software setting or point out that a loss of data may occur if information stated within
the paragraph is not adhered to or if procedures are executed incorrectly.
CAUTION Used to prevent equipment damage. To disregard that caution may cause mechanical damage,
however, personal injury is not likely.
WARNING If the equipment is used in a manner not specified by Beckman Coulter, Inc., the protection
provided by the equipment may be impaired.
GenomeLab Genetic Analysis System User’s Guide
ix
Safety Information
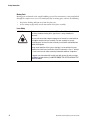
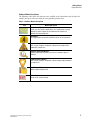
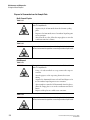
Safety Symbols
The symbols displayed below and on the instrument should remind you to read and
understand all safety instructions before attempting installation, operation, maintenance, or
repair to this instrument.
HIGH VOLTAGE Paragraphs marked by this symbol indicate that a potential hazard to
your personal safety exists from a high voltage source.
BIOHAZARD Paragraphs marked by this symbol indicate that a potential hazard to
your personal safety exists from a biological source.
LASER LIGHT Paragraphs marked by this symbol indicate that a potential hazard to
your personal safety exists from a laser source.
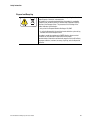
SHARP OBJECTS Paragraphs marked by this symbol indicate that a potential hazard
to your personal safety exists from unblunted corners or other appendages on the
outside or inside of the equipment.
HOT SURFACE Paragraphs marked by this symbol indicate that a potential hazard to
your personal safety exists from heated surfaces or other appendages on the outside
or inside of the equipment.
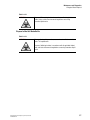
PROTECTIVE EARTH OR GROUND TERMINAL This symbol identifies the location of
the protective earth or ground terminal lug on the equipment.
OFF POSITION OF PRINCIPAL POWER SWITCH This symbol graphically represents
the equipment main power push-button switch when it is in the off position.
ON POSITION OF PRINCIPAL POWER SWITCH This symbol graphically represents
the equipment main power push-button switch when it is in the on position.
x
GenomeLab Genetic Analysis System User’s Guide
Safety Information
Chemical and Biological Safety
WARNING Normal operation of the system can involve the use of solvents and reagents that are toxic,
flammable, or biologically harmful.
WARNING
r Observe all precautionary information printed on the original solution
containers.
r Operate the system in the appropriate environment.
r Take all necessary precautions when using pathology or toxic materials to
prevent the generation of aerosols.
r Observe all applicable precautionary procedures when using flammable
solvents in or near the instrument.
r Wear appropriate laboratory attire, for example, safety glasses, gloves, lab
coat and breathing apparatus, when working with hazardous materials.
r Dispose of all waste solutions in a proper manner.
Electrical Safety
To reduce risk of electrical shock, all devices employ a three-wire electrical cable and plug to
connect the equipment to earth ground.
r
Ensure that the wall outlet receptacle is properly wired and earth grounded.
r
DO NOT use a three-to-two wire plug adapter.
r
DO NOT use a two-wire extension cord or a two-wire multiple-outlet power strip.
r
Disconnect power to the system before performing maintenance.
r
DO NOT remove any panels; panels should be removed only by qualified service
personnel.
WARNING
GenomeLab Genetic Analysis System User’s Guide
A high voltage power supply is used with this instrument. Safety interlocks
disable high-voltage output while the capillary access cover is open and
remove the risk of shock while performing routine instrument functions.
However, removal of any panel may expose an individual to the possibility of
severe electrical shock and/or mechanical injury. For this reason, any service
requiring removal of a panel or otherwise overriding or disabling safety
interlocks must be done by Beckman Coulter personnel only.
xi
Safety Information
Moving Parts
Moving parts are limited to the sample handling system. Plate movement is safety interlocked
through the sample access cover. To avoid injury due to moving parts, observe the following:
r
Keep loose clothing and hair away from the plate area.
r
Never attempt to physically restrict movement of the plate assembly.
Laser Safety
WARNING
The GenomeLab Instrument uses a “Class 3B” laser. The “3B” classification means
that “direct intrabeam viewing of this type of laser is always hazardous to
personnel.”
The laser and several other integral components are housed in a sealed container
that together comprise the laser assembly. The laser assembly has no user
serviceable parts. Service of the laser assembly is restricted to certified Beckman
Coulter field engineers.
During normal operation of the system, laser light is not accessible to the user.
Therefore, the overall laser classification of the CE Instrument is “Class 1,” defined
as “lasers which are safe under reasonably foreseeable conditions of operation.”
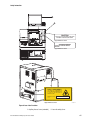
To prevent users from potentially harmful laser light, observe all safety warnings
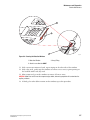
(see Figure for label locations) and NEVER REMOVE THE OUTER CASING OF THE
LASER ASSEMBLY.
xii
GenomeLab Genetic Analysis System User’s Guide
Safety Information
1
2
CAUTION
PWR
LASER
LASER LIGHT ACCESSIBLE WHEN COVER IS OPEN
OR REMOVED. AVOID EXPOSURE TO BEAM.
HW
*approximate location
AVOID EXPOSURE
LASER LIGHT IS EMITTED FROM THIS
APERTURE
*approximate location
CLASS 1 LASER PRODUCT
5
THIS PRODUCT CONFORMS TO
APPLICABLE REQUIREMENTS OF
21 CFR 1040 AT THE DATE OF
MANUFACTURE.
MANUFACTURED:
726024-C
*approximate location
901651L.AI
Figure 0 Laser Label Locations
1. Capillary Access Cover (extended)
GenomeLab Genetic Analysis System User’s Guide
2. Laser Assembly Cover
xiii
Safety Information
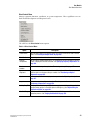
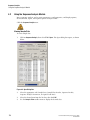
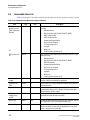
System Operation and Electromagnetic Interference
NOTE The following information addresses the EMI effect on system performance and provides
recommended mitigations.
Under the test conditions specified by the European normative electromagnetic compatibility
standard EN 61326-1, the instrument may exhibit temporary degradations in performance in
accordance with the table below.
Because the environmental circumstances contributing to the problem can vary, several
different mitigation techniques have been provided that should help eliminate or reduce the
interference.
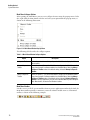
Troubleshooting Performance
Test Condition
Radio Frequency Field
Interference (RFI) System
exposed to electromagnetic
field strengths of greater
than or equal to 3 V / m at
multiple frequency bands.
Effect on Performance
Mitigation
May cause temporary degradation
of data accuracy. In some cases,
significant noise may appear in
the measured results. Separation
data will return to normal
performance once exposure is
removed.
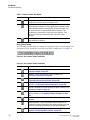
r Always run duplicates and controls.
May cause temporary loss of
capillary temperature control
resulting in lower than expected
capillary temperature. The system
logs the effect in the run log. It
will return to normal performance
once exposure is removed.
r Change the orientation of the
equipment by 90 degrees.
May cause temporary loss of
capillary temperature control
resulting in run not being initiated
because temperature cannot
reach desired level.
xiv
r Evaluate peaks carefully for
anomalous results.
r Re-run sample.
r Move location of the product by
several meters.
r Avoid using transmitters or cellular
phones within 1 meter of the
equipment.
r Review the temperatures in the run
log for any anomalies and re-run
as necessary.
GenomeLab Genetic Analysis System User’s Guide
Safety Information
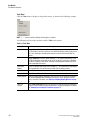
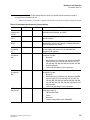
Disposal and Recycling
A016608L.EPS
It is important to understand and follow all laws regarding the safe and
proper disposal of electrical instrumentation.
The symbol of a crossed-out wheeled bin on the product is required in
accordance with the Waste Electrical and Electronic Equipment (WEEE)
Directive of the European Union. The presence of this marking on the
product indicates that the device:
r was put on the European Market after August 13, 2005.
r is not to be disposed via the municipal waste collection system of any
member state of the European Union.
For products under the requirement of WEEE directive, please contact
your dealer or local Beckman Coulter office for the proper
decontamination information and take-back program, which will facilitate
the proper collection, treatment, recovery, recycling, and safe disposal of
the device.
GenomeLab Genetic Analysis System User’s Guide
xv
Safety Information
xvi
GenomeLab Genetic Analysis System User’s Guide
Foreword
About this Guide
Foreword
About this Guide
This guide is intended for use with the GenomeLab™ Genetic Analysis System (referred to as
the “CE system” in this manual). This manual is divided into the following sections:
r
“Foreword,” this section, describes the purpose of this guide, provides a list of its
contents, discusses the use of the notes used in the document, tells how to get online
Help, and provides service contact information.
r
“Getting Started,” discusses the purpose and functional description of the system,
provides an overview of the three main components (chemistry, hardware, and software)
comprising the system, and details the safety features relevant to the system. It also
provides step-by-step procedures for operating the system.
r
“Sample Setup Module,” provides an overview of the module, including its menu
options, toolbars, and dialog boxes. It also shows you how to work with sample plates
using this module, such as opening, setting up, exporting, and importing sample plates.
r
“Run Module,” provides an overview of the Run module, including its menu options,
toolbars, and dialog boxes. It also shows you how to run sample plates and set the
display options using this module.
r
“Sequence Analysis,” provides an overview of the module, including its menu options,
toolbars, and dialog boxes. It shows you how to use this module to run a sequence
analysis, and to set up its parameters, result properties, and display options. It also
describes how to work with, report, and export sequence analysis results.
r
“Sequence Investigator Module,” provides an overview of the module, including its
menu options, toolbars, and dialog boxes. It also shows you how to use this module to
investigate and compare sequence analysis results.
r
“Fragment Analysis Module,” provides an overview of the module, including its menu
options, toolbars, and dialog boxes. It shows you how to use this module to work with
Studies, to run a fragment analysis, and to set up its parameters, result properties, and
display options. It also describes how to work with, report, and export fragment analysis
results.
r
“Gene Expression,” describes how the use the GenomeLab GeXP Genetic Analysis
System. This includes an overview of the system and describes how to use the GeXP
applications that run independently from the GenomeLab Genetic Analysis System. It
also explains how to back up and restore files used in the GeXP applications.
r
“Database Management,” provides an overview of the module, including its menu
options, toolbars, and dialog boxes. It provides procedures for database activities, such as
setting up and managing databases, exporting/importing data, and managing user
accounts.
r
“Maintenance and Diagnostics,” provides routine maintenance, replenishment,
diagnostic, and biological waste disposal procedures. It also lists the consumable
materials used in the system.
GenomeLab Genetic Analysis System User’s Guide
PN A29142-AB
1
Foreword
Technical Support
Technical Support
If you encounter a problem that is not discussed in this guide and you need technical support,
contact your local dealer, the provider of this product, or contact Beckman Coulter directly
using the information below.
NOTE Whenever you call your local dealer or Beckman Coulter, be sure to have your registration material,
instrument serial number, and software version number available. For future reference, record this
information here.
Instrument Serial Number:
Software Version:
Firmware Version:
Dealer Name:
Dealer Phone Number:
2
Mail
Beckman Coulter, Inc.
4300 North Harbor Boulevard
Fullerton, CA 92834-3100
Product Support
1-800-854-8067
Sales
1-800-742-2345
Service
1-800-551-1150
Telex
678413
FAX
1-800-643-4366
Internet
http://www.beckmancoulter.com
GenomeLab Genetic Analysis System User’s Guide
PN A29142-AB
Getting Started
System Overview
1Getting Started
This chapter discusses the purpose and functional description of the system, provides an
overview of the three main components (chemistry, hardware, and software) comprising the
system, and details the safety features relevant to the system. It also provides step-by-step
procedures for operating the system.
1.1
System Overview
This section describes the purpose and function of the CE system, provides an overview of
the main components comprising the system, and details the safety features relevant to the
system.
Purpose of this System
The purpose of the Capillary Electrophoretic (CE) Genetic Analysis System is two-fold:
r
To determine the nucleotide sequence of any given DNA sample
r
To estimate sizes of DNA fragments
Functional Description
The GenomeLab Genetic Analysis System is fully automated and capable of determining the
base sequence and fragment length of DNA samples that have been prepared with Beckman
Coulter, Inc. dye-labeled reagents. Four-color, dye-labeled terminator chemistry kits are used
to process samples for base sequence analysis. Generation of samples for fragment length
analysis is performed using one of two techniques:
r
dye-labeled primers for micro-satellite, AFLP and other similar applications
r
four-color dye-labeled terminator chemistry, for the single nucleotide
polymorphism application
The CE system incorporates two plate holders and accepts two 96-well plates at one time.
Each row of eight samples (sample set), containing labeled DNA fragments, is automatically
denatured and then separated by capillary electrophoresis. The separation gel is automatically
replaced in the eight capillaries after each separation. The separation gel supply is an easily
replaced cartridge with a capacity sufficient for two full microplates.
The instrument performs detection using laser-induced fluorescence in four spectral
channels. It automatically processes the four-channel raw data sets generated by each of the
eight capillaries to produce high-quality base sequences or fragment lists after separation.
Raw and analyzed data are stored in a database and may also be exported in file formats
compatible with common analysis applications.
GenomeLab Genetic Analysis System User’s Guide
PN A29142-AB
1
Getting Started
System Overview
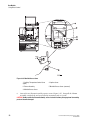
Hardware
The hardware performs sample handling as well as tasks associated with the separation and
detection phases of electrophoresis.
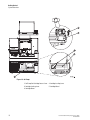
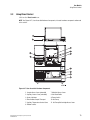
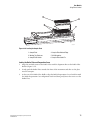
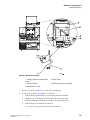
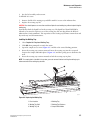
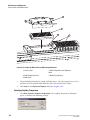
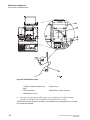
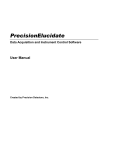
Figure 1.1 shows the GenomeLab instrument. The following sections describe the
GenomeLab instrument’s user-accessible hardware components.
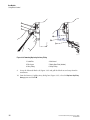
Figure 1.1 Instrument Hardware Overview
1. Sample Access Cover (extended)
7. Manifold Access Cover
2. Capillary Access Cover (extended)
8. Gel Waste Bottle
3. Status Indicators
9. Power Switch
4. Plate Holders/Sample Transport
10. Gel Pump
5. Capillary Temperature Control Cover
11. Gel Pump/Gel Cartridge Access Cover
6. Rubber Latches
2
GenomeLab Genetic Analysis System User’s Guide
PN A29142-AB
Getting Started
System Overview
Sample Access Cover
Provides access to the buffer plate, wetting tray, and sample plate.
Capillary Access Cover
Provides access to the capillary array through the capillary temperature control cover.
Capillary Temperature Control Cover
Provides an enclosed environment for the capillary temperature control and allows access to
the capillary array.
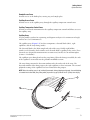
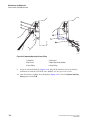
Capillary Array
Used to produce raw data for sequencing and fragment analysis is 33 centimeters in length,
and has an i.d. of 75 micrometers.
The capillary array (Figure 1.2) has three components: electrode block (inlet), eight
capillaries, and the array fitting (outlet).
The electrode block is the DNA sample inlet side of the array. It holds eight hollow,
stainless-steel electrodes. Each stainless-steel electrode holds a capillary in the center. These
electrodes are designed for immersion into an entire row (8 wells) of a 96-well microplate
(8-rows x 12-columns).
The capillaries pass through and exit the array fitting. When the fitting is installed, the ends
of the capillaries are inserted into the gel/buffer manifold reservoir.
The array fitting contains the detection window and is the outlet side of the array. The
detection window of the fitting exposes the eight capillaries to laser excitation. The external
polyimide coating of the capillaries has been removed for this purpose.
NOTE When the capillary array is not installed (for example, during shipping and storage), the manifold plug
is inserted into the manifold (array fitting outlet) to prevent any gel (inside of the CE system) from drying.
2
1
3
901592.AI
GenomeLab Genetic Analysis System User’s Guide
PN A29142-AB
3
Getting Started
System Overview
Figure 1.2 Capillary Array
1. Capillaries
3. Array Fitting (outlet)
2. Electrode Block (inlet)
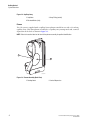
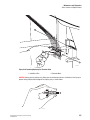
Plenum
The CE system is supplied with a capillary heater plenum suitable for use with a 33 cm long
capillary array. This short plenum assembly has a capillary array routing notch and a conical
depression on the back as shown in Figure 1.3.
NOTE Refer to the caution label on the front of the plenum assembly for positive identification.
1
2
901593L.AI
Figure 1.3 Plenum Assembly (Back View)
1. Routing Notch
4
2. Conical Depression
GenomeLab Genetic Analysis System User’s Guide
PN A29142-AB
Getting Started
System Overview
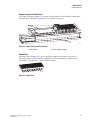
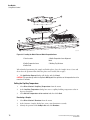
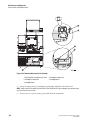
Sample Transport and Plate Holders
The Sample Transport (Figure 1.4) contains the plate holders used to hold the sample plate,
the buffer plate with buffer evaporation cover, and the wetting tray.
1
2
901594L.AI
Figure 1.4 Sample Transport and Plate Holders
1. Plate Holders
2. Part of Sample Transport
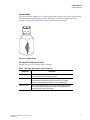
Sample Plate
The sample plate (Figure 1.5) is used to hold the samples for separation. The plate is a
V-bottom, thermal cycler-compatible, polypropylene plate containing 96 wells (8-rows x
12-columns). The wells have a 200 µL volume capacity.
900497e.AI
Figure 1.5 Sample Plate
GenomeLab Genetic Analysis System User’s Guide
PN A29142-AB
5
Getting Started
System Overview
Buffer Plate with Buffer Evaporation Cover
The buffer plate (Figure 1.6) holds the DNA separation buffer used during a sample run. The
plate is a flat-bottom, polystyrene, non-sterile plate containing 96 wells. When placed over
the buffer plate, an evaporation cover maintains the proper buffer level (250-300 µL) in the
buffer plate by preventing the buffer from evaporating. The cover slips over the buffer plate
position of the sample transport. As the CE system advances through the sample plate during
a run, the instrument pushes the evaporation cover back far enough to expose the next row of
buffer wells to use in the next sample set run.
1
2
901595L.AI
Figure 1.6 Buffer Evaporation Cover and Buffer Plate
1. Buffer Evaporation Cover
2. Buffer Plate
Wetting Tray
The wetting tray (Figure 1.7) is used to immerse the ends of the capillaries in deionized
water. When properly filled, the capillaries can be maintained for approximately seven days in
the wetting tray without attention. During continuous use of the CE system, the wetting tray
should be replenished with deionized water after a 96-well microplate has been run or prior
to a sample plate run.
The wetting tray is also used to rinse capillary tips and provide a receptacle for separation
medium that was purged from the capillaries.
CAUTION No more than one 96-well plate should be processed for each wetting tray, without replenishing
the Wetting Tray. For details, see "Replacing the Wetting Tray" on page 350.
900499e.AI
Figure 1.7 Wetting Tray
6
GenomeLab Genetic Analysis System User’s Guide
PN A29142-AB
Getting Started
System Overview
Gel Waste Bottle
The gel waste bottle (Figure 1.8) is used to capture and store the waste gel that is pushed out
of the manifold during the purge function. The bottle can hold the equivalent of 25 gel
cartridges. To prevent overflow, observe the gel level in the waste bottle
.
901514L.AI
Figure 1.8 Gel Waste Bottle
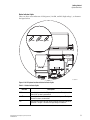
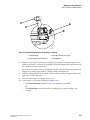
Gel Pump/Gel Cartridge Access Cover
Provides access to the gel pump and gel cartridge.
Table 1.1 Gel Pump, Gel Cartridge, and Gel Pump Plug
Component
Description
Gel Pump
Used to replenish the capillaries with fresh gel (from the cartridge) after
each sample set and two 96-well plate runs.
Gel Cartridge
Contains the fresh DNA separation gel. The separation gel is used for
both Sequence and Fragment Analysis. When full, the cartridge
contains a sufficient amount of gel for 24 runs (96 templates).
Gel Pump Plug
When the gel cartridge is not installed (for example, during shipping
and storage) the gel pump plug is inserted into the pump barrel to
prevent gel from drying in the system.
GenomeLab Genetic Analysis System User’s Guide
PN A29142-AB
7
Getting Started
System Overview
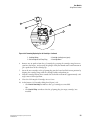
Figure 1.9 Gel Pump
1. Gel Pump/Gel Cartridge Access Cover 4. Cartridge Locking Lever
2. Cartridge Locking Lever
5. Cartridge Barrel
3. Cartridge Barrel
8
GenomeLab Genetic Analysis System User’s Guide
PN A29142-AB
Getting Started
System Overview
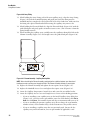
Status Indicator Lights
There are three status indicators: PWR (power), LASER, and HV (high voltage), as shown in
the figure below.
PWR
LASER
PWR
LASER
HV
HW
901652L.AI
Figure 1.10 CE System Location of Status Indicator Lights
Table 1.2 Status Indicator Lights
Indicator
Description
PWR
Green light is on when the CE system is powered on. The light is off
when the CE system is powered off.
LASER
Green light is on when the lasers are turned on during a run. The light is
off when the lasers are turned off.
HV
Green light is on when the high voltage is applied during the injection or
separation. The light is off when the high voltage is turned off.
GenomeLab Genetic Analysis System User’s Guide
PN A29142-AB
9
Getting Started
System Overview
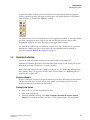
Software: User Interface
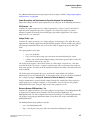
The software provides the interface for manual or automatic (pre-programmed) control of the
system and for data capture and basic data analysis. Combine with sentence below.
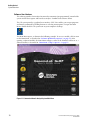
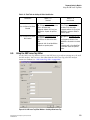
The CE system provides a graphical user interface (GUI) that enables you to open programs
and initiate commands by clicking buttons or selecting menu options. To open the Main
Menu, double-click the CE system icon on your computer's desktop:
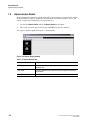
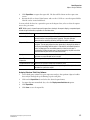
The Main Menu opens, as shown in the following example. To access a module, click its icon
on the Main Menu, as described in "Software Module Descriptions" on page 11. After
opening a software module, the Main Menu collapses, either to the Windows taskbar or as a
shortcut toolbar, as described in "Main Menu Collapse Options" on page 12.
Figure 1.11 GenomeLab Genetic Analysis System Main Menu
10
GenomeLab Genetic Analysis System User’s Guide
PN A29142-AB
Getting Started
System Overview
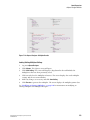
Software Module Descriptions
The following table shows the shortcut icons available on the Main Menu and describes the
module that opens when you click the corresponding shortcut icon.
Table 1.3 Software Module Descriptions
Icon
Module Description
Sample Setup Module
Create, save, and modify sample plates. Use sample plates to assign
methods to control sample sets and determine the sequence of
methods used to produce data.
Run Module
Run sample plates and control individual functions of the instrument.
Sequence Analysis Module
View, analyze, compare, manipulate, and print base sequence data
produced by sample runs.
Sequence Investigator Module
Compare sequences and create a consensus to compare against a
reference.
Fragment Analysis Module
View, analyze, compare, manipulate, and print fragment data produced
by sample runs.
Data Manager Module
Modify and print database files
Exit
Closes the CE system software.
GenomeLab Genetic Analysis System User’s Guide
PN A29142-AB
11
Getting Started
System Overview
Main Menu Collapse Options
After opening the Main Menu, you can set its collapse features using the pop-up menu. To do
this, right-click the Main Menu's title bar and select your option from the pop-up menu, as
shown in the following illustration.
Figure 1.12 Main Menu Window Pop-Up Menu
The following table describes the collapse options.
Table 1.4 Main Menu Window Collapse Options
Option
Description
Collapse to Toolbar
Select this option to immediately collapse the Main Menu to display the Main
Menu toolbar.
Always Collapse to
Toolbar
Select this option () to set the Main Menu to collapse to the Main Menu toolbar
every time you open a software module from the Main Menu. Selecting Always
Collapse to Toolbar makes it the default setting, instead of Always Collapse to
Taskbar.
Always Collapse to
Taskbar
Select this option () to set the Main Menu to collapse to the Windows taskbar
every time you open a software module from the Main Menu. Selecting Always
Collapse to Taskbar makes it the default setting, instead of Always Collapse to
Toolbar. From any application, you can access the Main Menu by left-clicking the
Main Menu button, located on the Windows taskbar.
Main Menu Toolbar
Provides access to all CE system modules from any active application window. By default, the
Main Menu toolbar provides a miniature version of software module icons as a horizontal
toolbar, as shown in the following example.
12
GenomeLab Genetic Analysis System User’s Guide
PN A29142-AB
Getting Started
Operating the System
To move the toolbar, click the title bar and hold the left mouse button while dragging the
toolbar to another location. When given enough space, the toolbar becomes a two-column
vertical toolbar, as shown in the following example.
The toolbar resizes to fit in any location in the active application window. To move the toolbar
to a more convenient location, click the title bar and hold the left mouse button while
dragging the toolbar to one of the four edges of the application's window.
The Main Menu toolbar icons are miniature versions of the ones provided in the expanded
Main Menu. Clicking one of these icons opens the corresponding software module, as
described "Software Module Descriptions" on page 11.
1.2
Operating the System
Perform the tasks involved in analyzing or managing samples and sample data.
Although the following procedures are independent from setting up and starting the system,
perform the procedures below in the sequence provided.
Before you begin, confirm that the Capillary is ready for use. See "Removing and Replacing
the Capillary Array" on page 361. Install a new Gel Waste Bottle. See "Replacing the Gel
Waste Bottle" on page 349.
Preparing a Sample
Prepare a sample for sequence or fragment analysis in accordance with using the instructions
contained in either the CE system DTCS or the Quick Start Chemistry Kits or the PCR
Reagent manufacturers kit for Fragment Analysis.
Starting-Up the System
1.
Turn on the PC and wait for Windows to start.
2.
Turn on the instrument.
3.
From the Windows desktop, select Start | Programs | GenomeLab System | Control
Center. The instrument initializes and after several seconds displays the Main Menu.
GenomeLab Genetic Analysis System User’s Guide
PN A29142-AB
13
Getting Started
Operating the System
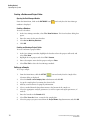
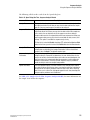
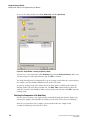
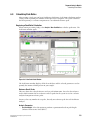
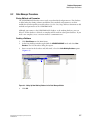
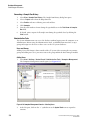
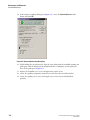
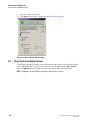
Creating a Database and Project Folder
Opening the Data Manager Module
From the Main Menu, click on the DATABASE icon
window is displayed.
and verify that the Data Manager
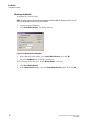
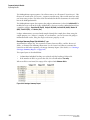
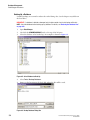
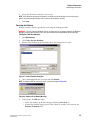
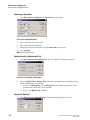
Creating a Database
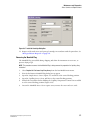
To create a database:
1.
In the Data Manager window, select File | New Database . The New Database dialog box
opens.
2.
Enter the name for this new database.
3.
Select Set as Working Database .
4.
Click OK.
Creating and Naming a Project Folder
To create and name a project folder:
1.
In the Data Manager window, highlight the database where the project will reside and
select File | New.
2.
Highlight the new project and select File | Rename .
3.
Enter a descriptive name for this project and press Enter.
4.
Select File | Exit to close the Data Manager module.
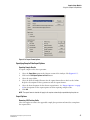
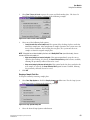
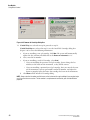
Setting up a Sample
To set up a sample:
14
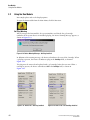
icon and verify that the Sample Plate
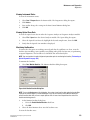
1.
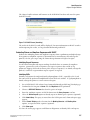
From the Main Menu, click the SETUP
Selection dialog is displayed.
2.
Select the Create a new sample plate radio button and click OK .
3.
Set up the sample plates by naming the desired cells.
4.
Add any associated notes or property information.
5.
Select a method from the drop-down menu at the bottom of the sample set.
6.
Select the appropriate analysis parameters (as well as report and export parameters, if
needed).
7.
Enter the barcode in the Barcode field.
8.
Select File | Save As . Enter a name for the sample plate.
9.
Select the project you just created from the Project Name drop-down menu and click OK .
GenomeLab Genetic Analysis System User’s Guide
PN A29142-AB
Getting Started
Operating the System
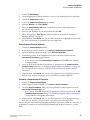
Running a Sample
Starting the Run Module
From the Main Menu, click the Run icon
displayed.
and verify that the Run window is
Checking the Capillary Array
Check the capillary life and usage on the life tab and if necessary, perform the procedure
"Removing and Replacing the Capillary Array" on page 361, and then return here.
Installing a Gel Cartridge
Check the gel life and usage on the life tab and if necessary, perform the procedure
"Removing and Replacing a Gel Cartridge/Gel Pump Plug" on page 367, and then return
here.
Installing the Gel Waste Bottle
If necessary, perform the procedure "Replacing the Gel Waste Bottle" on page 349, and then
return here.
Preparing Plates for a Run
1.
Load samples into the sample plate and cover with mineral oil.
2.
Load buffer (250-300 µL) into the buffer plate.
3.
Fill the wetting tray with D.I. water to the level indicator marker.
IMPORTANT No more than one 96-well plate should be processed, for each wetting tray, without
replenishing the wetting tray.
NOTE Periodically check the liquid level in the wetting tray.
CAUTION NEVER allow the liquid level to rise into the eight cannula recesses of the wetting tray lid, nor drop
below the fill level indicator line. The top surface of the wetting tray lid must remain clean and dry under any
and all circumstances.
GenomeLab Genetic Analysis System User’s Guide
PN A29142-AB
15
Getting Started
Operating the System
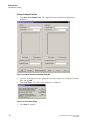
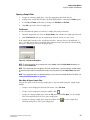
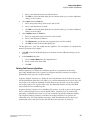
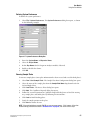
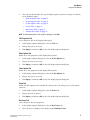
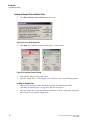
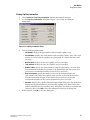
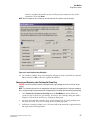
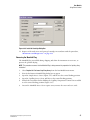
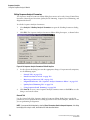
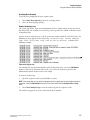
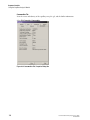
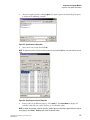
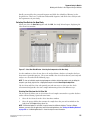
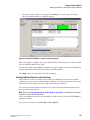
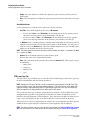
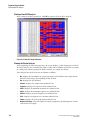
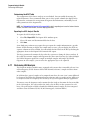
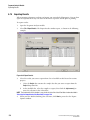
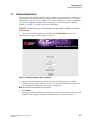
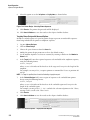
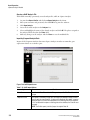
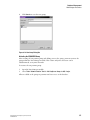
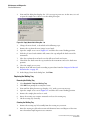
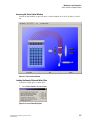
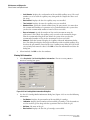
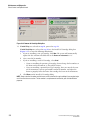
Starting the Sample Plate Run
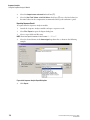
1.
Select Run | Start Sample Plate . The Sample Plate Run Confirmation dialog box is
displayed.
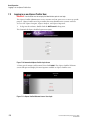
Figure 1.13 Sample Plate Run Confirmation Dialog Box
2.
Select the desired project on the appropriate side (left or right) for each prepared sample
plate and click OK .
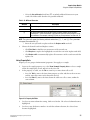
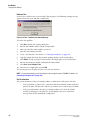
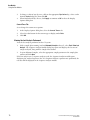
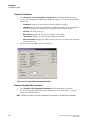
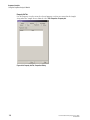
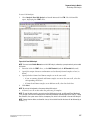
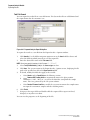
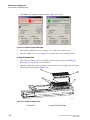
3.
Click Load Plates . The Access Plates dialog box is displayed.
Figure 1.14 Access Plates Dialog
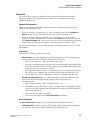
4.
16
Click Start to continue.
GenomeLab Genetic Analysis System User’s Guide
PN A29142-AB
Getting Started
Operating the System
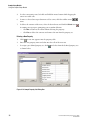
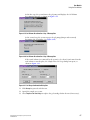
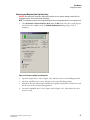
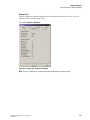
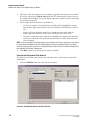
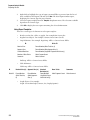
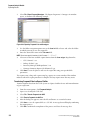
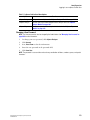
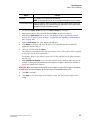
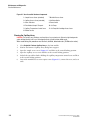
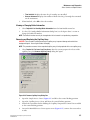
5.
Install the plate and select the Plate Loaded option for the Left and/or Right plate, if
applicable, and then select the side to immerse the capillaries.
NOTE Prepare the new plates before proceeding. Once the capillaries have been exposed to air, you will have
15 minutes to load the plates.
Figure 1.15 Capillaries Exposed Dialog Box
6.
Click Load to continue.
NOTE Refer to "Installing the Wetting Tray" on page 351, "Loading the Sample Plate" on page 354 and
"Loading the Buffer Plate and Evaporation Cover" on page 355.
7.
Click Start to begin the Run.
GenomeLab Genetic Analysis System User’s Guide
PN A29142-AB
17
Getting Started
Operating the System
18
GenomeLab Genetic Analysis System User’s Guide
PN A29142-AB
Sample Setup Module
Overview
2Sample Setup Module
2.1
Overview
Create, save, and modify methods and sample plates. Methods consist of sequential events
needed to perform a DNA separation. Sample plates provide a way to name and organize
samples.
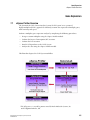
The sample plate definition contains the 96-well plate locations of the samples as well as the
method assigned to each sample. The capillary array must run the same separation
parameters across eight samples, one column at a time. Each column that contains samples is
called a Sample Set. The separation parameters applied to each sample set are specified in the
Method. Method parameters can be changed to create new methods.
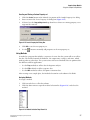
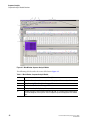
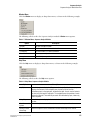
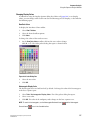
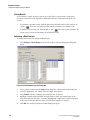
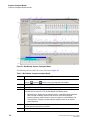
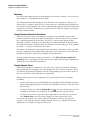
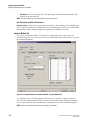
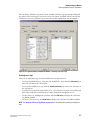
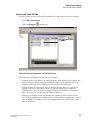
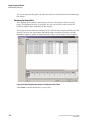
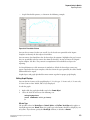
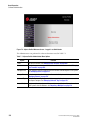
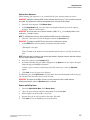
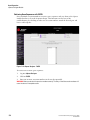
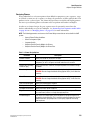
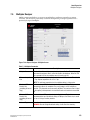
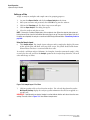
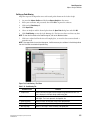
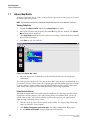
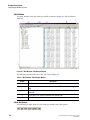
Using the Main Window
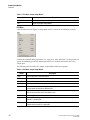
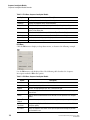
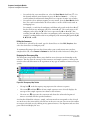
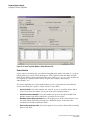
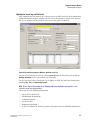
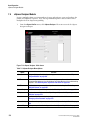
The portions of the Sample Setup module’s main window are described in Table 2.1.
Figure 2.1 Main Window, Sample Plate Module
GenomeLab Genetic Analysis System User’s Guide
PN A29142-AB
19
Sample Setup Module
Overview
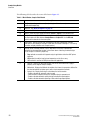
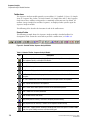
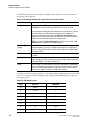
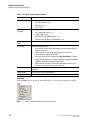
The following table describes the items called out in Figure 2.1.
Table 2.1 Main Window, Sample Plate Module
Item
A
Title Bar - Shows the module name (Sample Setup) and the active sample
plate DefaultSamplePlate).
B
Menu Bar - See "Menu Bar Options" on page 22.
C
Toolbar - See "Toolbar Icons" on page 27.
D
Legend - Shows the color coding information (Saved or Edited) of the individual cells.
E
Sample Name and Subject ID of the currently active cell. The radio button toggles
the sample plate cell labels between Sample Name and Subject ID. Use the Barcode
field to enter the barcode for the current plate.
F
Sample Plate - Displays 96 cells that correspond to a 96-well sample plate. (Sample
plate columns are numbered 1 through 12 and Rows are labeled A through H. This naming
convention uniquely identifies each sample location.)
G
Currently active (selected) method. Use this drop-down list to select a pre-defined
method to the corresponding samples in the column above. Selecting a method assigns
it to all samples in a column (sample set).
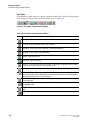
H
20
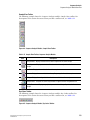
Description
r
Frag methods are used for all fragment analysis applications other than SNP primer
extension
r
LFR method is used for long fast read sequencing on the 33 cm array
r
SNP method is used for the SNP primer extension application
r
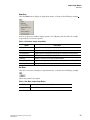
Note tab - Displays the Note sub-window, that can be used to describe or apply a
property set to single or multiple samples.
r
Method tab - Displays the Method sub-window, that shows the parameters defined for
the selected method and allows you to edit or create separation methods.
r
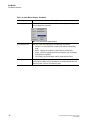
Analysis tab - Display the Analysis sub-window, that can be used to:
- Enable or disable the automatic analysis mode
- Select and edit a Sequence Analysis or Fragment Analysis parameter set
- Enable or disable automatic report printing and edit print report options
- Enable or disable automatic exporting of data and change export options
GenomeLab Genetic Analysis System User’s Guide
PN A29142-AB
Sample Setup Module
Overview
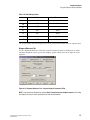
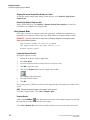
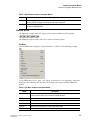
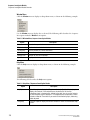
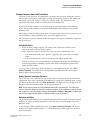
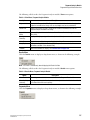
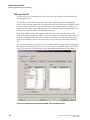
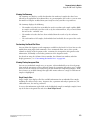
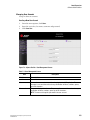
Editing Property Values
Attach information and a property set to the highlighted samples. This informational note
will accompany the sample throughout its lifetime.
Use the New Item
, Delete
modify the property sets.
, Move Item Up
, Move Item Down
, and Edit
icons to
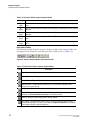
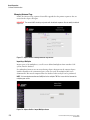
Figure 2.2 Note Sub-Window
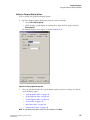
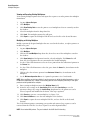
Editing Sample Properties
Sort and remove sample properties.
1.
To select a field in an existing property set, left-click the cell.
2.
Next, use the Tab key to move your selection from cell to cell. The Tab key moves the
focus from property to value and then to the next row and the arrow keys to move in the
direction selected.
3.
Press Enter to move the focus down the table one cell at a time, within the same column.
r
To select an entire column for sorting, click its header. The selected column is
highlighted.
r
To select a row, click its number. As with the column selection, the selected row is
highlighted.
r
To select consecutive rows, left-click and drag the cursor through the blocks. Click
the toolbar arrow buttons to move the row up or down one cell.
r
To delete the contents of the rows, select the desired rows and click Delete. A
warning message appears, prompting you to confirm deletion. Click Yes to delete
the contents or No to return to the editor.
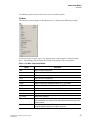
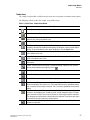
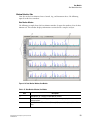
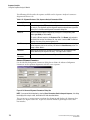
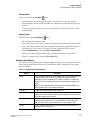
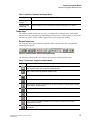
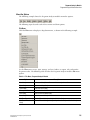
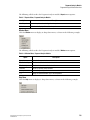
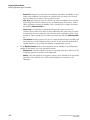
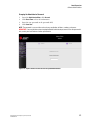
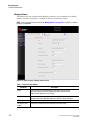
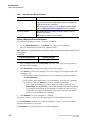
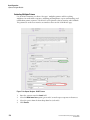
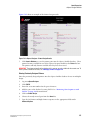
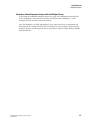
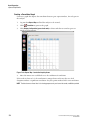
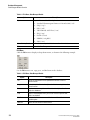
Viewing the Method Tab
The Method sub-window displays the parameters of the method for the selected samples.
Click the Edit button to modify one or all of the parameters of the existing method or to create
a new method.
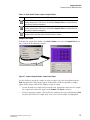
Figure 2.3 Sample Setup Method Sub-Window
GenomeLab Genetic Analysis System User’s Guide
PN A29142-AB
21
Sample Setup Module
Overview
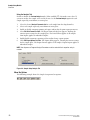
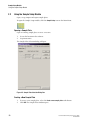
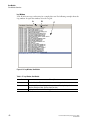
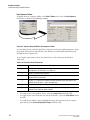
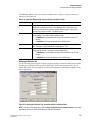
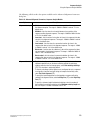
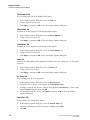
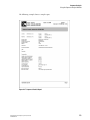
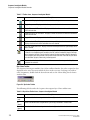
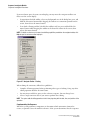
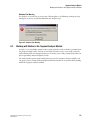
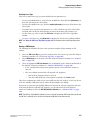
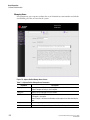
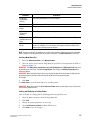
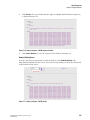
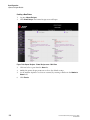
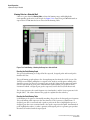
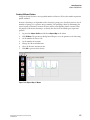
Using the Analysis Tab
Enable or disable the Perform Analysis mode. When enabled (), this mode causes the CE
system to analyze the sample at the end of the run. Set the Perform Analysis option for each
sample separately, row/column, or entire plate.
1.
Select the desired Analysis Parameter Set for each sample from the drop-down list.
2.
Select each sample separately, row/column or entire plate.
3.
Enable or disable automatic printing of reports and/or edit the print report parameters.
4.
Select Edit Print Format For Plate. The Report Format dialog box appears, showing the
current report settings for the sample plate. The Print Format applies to all samples.
Print Report applies to individual samples.
5.
Enable/disable automatic exporting of data and/or change export options.
6.
Click Edit Export Options For Plate. The Export dialog appears, showing the current settings
for the sample plate. The Export Format applies to all samples. Export Report applies to
individual samples.
NOTE New Sequence or Fragment Analysis Parameters must be created in their respective analysis
modules.
Figure 2.4 Sample Setup Analysis Tab
Menu Bar Options
The following example shows the Sample Setup menu bar options.
22
GenomeLab Genetic Analysis System User’s Guide
PN A29142-AB
Sample Setup Module
Overview
The following topics describe each of these menus and their options.
File Menu
Click the File menu to display its drop-down menu, as shown in the following example.
Use the File menu to create, open, save, import/export, view properties, and print sample
plates. The following table describes the Sample Setup module's File menu options.
Table 2.2 File Menu, Sample Setup Module
Option
Description
New
Opens an empty sample plate.
Open
Select an existing sample plate to open.
Close
Closes the selected sample plate.
Save
Saves the current sample plate.
Save As
Save the sample plate with a new name.
Import
Import a sample plate (tab-delimited ASCII text [*TXT] format).
Export
Export a sample plate (tab-delimited ASCII text [*TXT] format).
Properties
Provides an information window concerning the active sample plate.
Default Report Format
Define the report formats for new and imported sample plates.
Print Preview
Displays a facsimile of a hardcopy printout of the active sample plate.
Print Setup
Define printer properties.
Print
Displays a sub-menu from which you can choose to print a detailed report of the
active sample plate, the contents of the sample plate, the plate summary, or the
selected method.
Print Screen
Displays a sub-menu from which you can choose to print an image of the
computer desktop or application window to the printer.
GenomeLab Genetic Analysis System User’s Guide
PN A29142-AB
23
Sample Setup Module
Overview
Table 2.2 File Menu, Sample Setup Module
Option
Description
Lock
Use this option to prevent editing of the currently displayed plate.
Exit
Closes the Sample Setup module.
Edit Menu
Click the Edit menu to display its drop-down menu, as shown in the following example.
Perform the standard editing operations: cut, copy, paste, find, and replace. It also provides an
option for modifying previously defined parameters of a method contained in the active
sample plate.
The following table describes the Sample Setup module's Edit menu options.
Table 2.3 Edit Menu, Sample Setup Module
Option
24
Description
Undo
Use to undo the last action performed.
Redo
Use to redo the last undo action.
Clear All
Empties all cell properties in the active sample plate.
Select All
Selects all cells in the sample plate.
Cut
Deletes text in one or more cells of the sample plate and copies it to the clipboard. You
can then paste the cut text into different cells.
Copy
Copies text or the applied properties selected from one or more cells of the sample plate.
You can then paste the cut text into different cells.
Paste
Inserts copied or cut items at the cursor insertion point.
Find
Opens the Find dialog box, which you can use to search for text within the sample name
entered in a sample plate.
Replace
Opens the Replace dialog box, which you can use to search and replace text within the
sample names entered in a sample plate.
GenomeLab Genetic Analysis System User’s Guide
PN A29142-AB
Sample Setup Module
Overview
View Menu
Click the View menu to display its drop-down menu, as shown in the following example.
Activate or deactivate window display options. The following table describes the Sample
Setup module's View menu options.
Table 2.4 View Menu, Sample Setup Module
Option
Description
Toolbar
Toggles between displaying/not displaying the toolbar.
Status Bar
Toggles between displaying/not displaying the status bar.
Cell Coordinates
Toggles between displaying/not displaying the coordinates of the plate cells.
Sample Property Sets
Create, delete, or modify the property set.
Summary
Displays a summary of the currently selected plate.
View by Subject ID
Toggles the sample plate cell labels between Sample Name and Subject ID.
Working Database
Displays a dialog box showing the database in use.
Run Menu
Click the View menu to display its drop-down menu, as shown in the following example.
This menu provides one option.
Table 2.5 Run Menu, Sample Setup Module
Option
Start
Description
Invokes the Run module and loads the active sample plate.
GenomeLab Genetic Analysis System User’s Guide
PN A29142-AB
25
Sample Setup Module
Overview
Window Menu
Click the Window menu to display its drop-down menu, as shown in the following example.
The following table describes the Sample Setup module's Window menu options.
Table 2.6 Window Menu, Sample Setup Module
Option
Description
Next
Toggles between open sample plates.
Close
Closes the active sample plate or sample plate summary.
Help Menu
Click the Help menu to display its drop-down menu, as shown in the following example.
The following table describes the Help menu options.
Table 2.7 Help Menu, Sample Setup Module
Option
26
Description
Help Topics
Select this option to display the CE system online help. By default, the help system
displays the Contents in the navigation pane, located on the left, and the
introductory topic in the topic pane, located on the right. You can use the Contents
to select and print specific help topics. The navigation pane also provides a Search
tab and an Index tab. These tabs let you search for information by topic, index entry,
and/or keyword.
Using Help
Select this option to display the Contents window on how to use the Windows Help
system.
About GenomeLab
System
Select this option to access software, instrument, and system information.
Beckman Coulter
Home Page
Select this option to access the Beckman Coulter Home Page on the Internet.
GenomeLab Genetic Analysis System User’s Guide
PN A29142-AB
Sample Setup Module
Overview
Toolbar Icons
The Sample Setup module’s toolbar contains icons that correspond to common menu options.
The following table describes the Sample Setup toolbar icons.
Table 2.8 Toolbar Icons, Sample Setup Module
Icon
Description
New - Opens an empty sample plate.
Open - Select an existing sample plate to open.
Save - Saves the current sample plate to the same directory with the same name and
format as was used on the previous save.
Print Sample Plate - Print data associated with the active sample plate.
Print Preview - Displays a sample format of a hard-copy printout of the active sample plate.
A toolbar at the top of the window provides options for navigation, viewing, and printing the
display. To restore the default screen, press the Esc key or click the Close button.
Cut - Deletes text selected in one or more cells of the sample plate, which you can "paste"
into a different cell or cells.
Copy - Duplicates text selected in one or more cells of the sample plate, which you can
"paste" into a different cell or cells.
Paste - Inserts into one or more cells the text copied to the buffer when using the Copy or
Cut function.
Unlock - Indicates that the active plate is available for editing. Clicking this icon locks the
plate to prevent editing and changes the icon to
.
Run - Opens the Run module and executes the active sample plate.
Select All - Highlights (selects) all cells in the sample plate.
Clear All - Removes all cell properties in the sample plate.
View Summary - Displays a summary of a specific sample plate. To use this, open the
desired sample plate, then click this icon. The Sample Plate Summary spreadsheet appears
with a summary of each sample in the plate. This is a read-only spreadsheet and cannot be
edited.
Help Topics - Displays the CE system online help. By default, the help system displays the
Contents in the navigation pane, located on the left, and the introductory topic in the topic
pane, located on the right. You can use the Contents to select and print specific help topics.
The navigation pane also provides a Search tab and an Index tab. These tabs let you search
for information by topic, index entry, and/or keyword.
Context-Sensitive Help - Click this icon and then on a menu item to open the Help file
related to the selection.
GenomeLab Genetic Analysis System User’s Guide
PN A29142-AB
27
Sample Setup Module
Using the Sample Setup Module
2.2
Using the Sample Setup Module
Open, set up, import and export sample plates.
To open the Sample Setup module, click the Sample Setup icon on the Main Menu:
Opening a Sample Plate
Open an existing sample plate or create a new one.
1.
Get to this location in the software.
2.
Step instructions.
The Sample Plate Selection dialog will open.
Figure 2.5 Sample Plate Selection Dialog Box
Creating a New Sample Plate
28
1.
To create a new sample plate, select the Create a new sample plate radio button.
2.
Click OK. The Sample Plate window opens.
GenomeLab Genetic Analysis System User’s Guide
PN A29142-AB
Sample Setup Module
Using the Sample Setup Module
Opening a Sample Plate
1.
To open an existing sample plate, select the appropriate plate from the list.
2.
To help in the search, filter the plates by their displayed date. Selecting the Enable option.
3.
Use the Up and Down scroll arrows to change the Start Date and End Date.
4.
Click OK to open the selected sample plate.
Find Barcode
Use the Find Barcode option to search for a sample plate using its barcode.
1.
From the drop-down list, select the Project Name that contains the sample plate barcode.
2.
Click Find Barcode and type the sample plate barcode exactly as it was saved.
If the sample plate barcode exists, it will open the plate. You may also use the wildcards "*"
and "?" in your search. If the search finds more than one match, the Barcode Selection dialog
box opens, allowing you to select the proper plate.
Figure 2.6 Find Barcode Dialog Box
NOTE To search all projects for the sample name, select -(none)- from the Project Name drop-down list
before clicking Find Barcode.
NOTE If the sample plate does not appear in the list of available items, it may be residing in another project.
To select the project where the sample plate resides, select the project from the Project Name drop-down
list.
NOTE If the sample plate exists in a different database, you can reset the working database. For details, see
"Setting the Working Database" on page 328.
Other Ways to Open a Sample Plate
You can also open a new or existing sample plate at any time while using the Sample Setup
module.
r
To open a new sample plate from the File menu, select File | New.
r
To open a new sample plate using the toolbar, click
r
To open an existing sample plate, from the File menu, select File | Open. Use the Sample
Plate Selection dialog box to select your sample plate.
r
To open an existing sample plate using the toolbar, click
Selection dialog box to select your sample plate.
GenomeLab Genetic Analysis System User’s Guide
PN A29142-AB
.
. Use the Sample Plate
29
Sample Setup Module
Using the Sample Setup Module
Creating a New Sample Plate
To create a new sample plate:
1.
Click
. A blank sample plate opens.
2.
Select and highlight the cell or cells where the samples will reside.
3.
Enter the name of the samples in the Sample Name field and then press Enter.
4.
Enter the barcode for the plate in the Barcode field.
5.
Apply sample specific information in the Note window of the Note tab and apply property
sets and values.
6.
Assign a method to each sample set.
To edit the method or create a new method, see "Creating or Editing a Method" on page 38.
7.
r
To automatically analyze data after a sample set run, select the Analysis tab, then
select the Automatic Analysis check box. The system will analyze the sample data
using the parameter set selected from the drop-down list. For details, see "Defining
Data Processing Conditions" on page 39.
r
To automatically print a report after a sample set run, see "Printing the Plate Report
or Specifying Sample Plate Print Options" on page 40.
r
To automatically export data after a sample set run, see "Specifying Sample Plate
Export Options" on page 41.
Select File | Save As . In the Save As dialog box:
a.
Select a Project Name from the drop-down list.
b.
Enter a name for this plate in the name field.
c.
Click OK to save the plate.
Selecting Samples
Select individual samples positions. In addition, select the entire plate, row, or column using a
single click. Use the Shift or Ctrl keys to select contiguous and non-contiguous cells.
Selecting the Entire Sample Plate
Select the entire sample plate by left-clicking the grid box on the upper-left corner of the plate
grid. To remove the selection, left-click any sample in the grid.
Figure 2.7 Select the Entire Plate
30
GenomeLab Genetic Analysis System User’s Guide
PN A29142-AB
Sample Setup Module
Using the Sample Setup Module
Selecting the Entire Row
Place the mouse pointer over the row label on the left-hand side of the row to be selected. A
small black arrow will replace the mouse pointer. Click once to select the row. To remove the
selection, click any sample in the grid.
Figure 2.8 Select an Entire Row
Selecting the Entire Column
Place the mouse pointer over the column label at the top of the column to be selected. A small
black arrow replaces the mouse pointer (see Figure 2.9). Click once to select the column. To
remove the selection, click any sample in the grid.
Figure 2.9 Select the Entire Column
Selecting Contiguous Cells
To select contiguous cells:
1.
Left-click the first cell in the column or row.
2.
Press and hold the Shift key.
3.
Left-click the last cell (in the column or row) to be selected.
4.
Release the Shift key.
Figure 2.10 Select Contiguous Cells
GenomeLab Genetic Analysis System User’s Guide
PN A29142-AB
31
Sample Setup Module
Using the Sample Setup Module
Selecting Non-Contiguous Cells
1.
Click the first cell.
2.
Use the Ctrl+Click function to select each additional cell.
Figure 2.11 Selecting Non-contiguous Cells
Viewing a Sample Plate by Sample Name/Subject ID
Use the View | View by Subject ID option to toggle the sample plate view between Sample Name
and Subject ID. This works in conjunction with the options found next to the Sample Name and
Subject ID fields, as shown in the following example.
Figure 2.12 View by Subject ID / Sample Name Toggle
32
GenomeLab Genetic Analysis System User’s Guide
PN A29142-AB
Sample Setup Module
Using the Sample Setup Module
Naming Samples and Assigning Subject IDs
The sample plate window appends the plate location to each Sample Name entered in a
sample cell. For example, enter “MySample” as the name of the cell at position A3 in the
plate. The sample plate view identifies the sample as “MySample.A3”.
NOTE Position the mouse pointer over a named cell to display a “tool tip” that identifies both the sample
name and Subject ID.
If you enter a Subject ID before entering a sample name, the system automatically populates
the Sample Name field, which you can change at any time.
To name a single sample:
1.
Select the cell where the sample resides in the plate.
2.
Enter the name of the sample in the Sample Name text box and press the Enter key.
3.
Enter the Subject ID in the Subject ID text box and press Enter.
To name contiguous samples:
1.
Select the cells where the samples reside in the plate by clicking and dragging the mouse
cursor.
2.
Enter the name of the samples in the Sample Name text box and press the Enter key.
3.
Enter the Subject ID in the Subject ID text box and press Enter.
Naming all Wells
To name all wells in the plate:
1.
Click Select All
2.
Enter the name of the samples in the Sample Name field and press Enter.
3.
Enter the Subject ID data and press Enter.
.
To name multiple non-contiguous samples that are not within the same sample set:
1.
Click on the first cell.
2.
Press and hold the Ctrl key while selecting the additional samples.
3.
Enter the name of the samples in the Sample Name text box and press the Enter key.
4.
Enter the Subject ID in the Subject ID text box and press Enter. The plate editor displays
each edited cell with a green background shade. The Plate Status indicator displays
“Plate Edited.” This indicates that the plate must be saved.
NOTE If you attempt to close the plate before saving it, a Save Changes dialog box opens.
5.
Save the plate to retain the changes.
GenomeLab Genetic Analysis System User’s Guide
PN A29142-AB
33
Sample Setup Module
Using the Sample Setup Module
Viewing Cell Coordinates
To view or hide cell coordinates, select View | Cell Coordinates . The option will toggle the
display of the coordinates off and on.
Searching for Text in the Sample Plate
1.
Select Edit | Find . Use the options in the Find dialog to specify the search criteria.
2.
Enter the desired text in the Search what field.
r
Select Down to search down each column, beginning at the highlighted or selected
cell.
r
Select Up to search up each column, beginning at the highlighted or selected cell.
r
Select the Match whole word only option to locate text that is flanked by spaces. If
you do not select “Match whole word only,” the system finds the text, even if it is
part of another word.
r
Select the Match case option to find the entered text exactly as typed into the field.
If “Match case” is not selected, the system will find all occurrences of the text,
regardless of the case.
r
Select the Use wildcards check box () to include wildcard characters in your
search. The follow table describes the possible wildcards.
Table 2.9 Wildcard Characters
Wildcard
Description
*
The asterisk specifies to search for any letters before or after the entered text.
?
The question mark represents any single letter.
[!]
The exclamation point within brackets makes the query negative. Enter the letter
following the “!” within the brackets if you want the system to find anything that is not
the entered text. For example, entering [!A] finds any string that does not start with “A”.
NOTE The system supports the following wildcard combinations: [!]*, *?, and ?[!]?. The system does not
support the combination *[!].
3.
Click Find Next to find the next occurrence of the entered text.
Search for and Replacing Text in the Sample Plate
34
1.
Select Edit | Replace . Use the Replace options to specify your search and replace settings.
2.
Enter the desired text in the Find what text field.
r
Select the Match whole word only check box () to locate text that is flanked by
spaces. If “Match whole word only” is not selected, the system will find the text,
even if it is part of another word.
r
Select the Match case check box () to find the entered text exactly the way you
type it into the field. If you do not select “Match case,” the system finds all
occurrences of the text, regardless of case.
GenomeLab Genetic Analysis System User’s Guide
PN A29142-AB
Sample Setup Module
Using the Sample Setup Module
Select the Use wildcards check box () to include wildcard characters in your
search. The follow table describes the possible wildcards.
r
Table 2.10 Wildcard Characters
Wildcard
Description
*
The asterisk specifies to search for any letters before or after the entered text.
?
The question mark represents any single letter.
[!]
The exclamation point within brackets makes the query negative. Enter the letter
following the “!” within the brackets if you want the system to find anything that is not
the entered text. For example, entering [!A] finds any string that does not start with “A”.
NOTE The system will support the following wildcard combinations: [!]*, *?, and ?[!]?. The system does
not support the combination *[!].
r
3.
Enter the text you wish to replace with in the Replace with text field.
Choose the desired Search and Replace actions:
r
Click Find Next to find the next occurrence of the entered text.
r
Click Replace to replace the highlighted text with the text in the Replace with field.
r
Click Replace All to automatically replace all occurrences of the search text with the
replace text.
Using Property Sets
Property sets are groups of information (properties) that apply to a sample.
1.
To access the sample property sets, select View | Sample Property Sets or select a sample
cell in the sample plate screen and refer to the Note tab.
2.
In the property set table, use the Tab or arrow keys to move from cell to cell.
r
Press the Tab key moves the focus from property to value and then to the next row
and the arrow keys move in the direction selected.
r
Press the Enter key moves the focus down the table one cell at a time, within the
same column.
Figure 2.13 Property Set Editor
3.
To select an entire column for sorting, click on its header. The selected column becomes
highlighted.
4.
To select a row, click on its number. As with the column selection, the selected row
becomes highlighted.
GenomeLab Genetic Analysis System User’s Guide
PN A29142-AB
35
Sample Setup Module
Using the Sample Setup Module
5.
To select consecutive rows, left-click and hold the mouse button while dragging the
cursor over table cells.
6.
To move a selected row up or down one cell at a time, click the toolbar arrow
icons.
7.
To delete the contents of the rows, select the desired rows and click the Delete icon
A warning message opens, prompting you to confirm deletion:
r
Click No to return to the editor without deleting the property.
r
Click Yes to delete the contents and remove the row from the property set.
.
Entering a New Property
1.
Click
2.
Enter the new property name and value into the cells of the new row.
r
. A new row appears into the property table.
To assign a pre-defined property set, click
as shown below.
and select from the defined property sets
Figure 2.14 Sample Property Sets Dialog Box
36
GenomeLab Genetic Analysis System User’s Guide
PN A29142-AB
Sample Setup Module
Using the Sample Setup Module
Creating and Storing a Custom Property set
1.
Click the Create button in the Defined Sets portion of the Sample Property Sets dialog.
2.
Enter a name in the Create Property Set dialog box (Figure 2.15).
3.
If desired, use the Copy settings from drop-down list to choose an existing property set to
copy into the new one.
Figure 2.15 Create Property Set Dialog Box
4.
Click OK to save the new property set.
5.
Use the
button to manually add properties to the new property set.
Using Methods
A method is a program that includes a sequence of events that the system will use to collect
the data. The method controls the hardware, the temperatures, voltages, and times, which
work together to gather data. The system comes with several methods that are optimized for
the different software applications.
r
Use the Frag methods to collect data for fragment analysis.
r
Use the LFR methods to collect sequence data.
r
Use the SNP method to collect SNP primer extension data.
After creating a new sample plate, the Method selection for each column is left blank.
Assigning Methods
To assign a method.
1.
Click on and select a cell in the column.
2.
Click the down-arrow to open the method selection list (Figure 2.16) and select the
method.
Figure 2.16 Method Selection Drop-Down List
GenomeLab Genetic Analysis System User’s Guide
PN A29142-AB
37
Sample Setup Module
Using the Sample Setup Module
3.
Edit the new method as desired.
NOTE You must assign a method to each named row before saving the sample plate. If any named row is
not assigned a method and a save is attempted, a warning message appears, listing each column that needs
a method assigned to it.
Applying Methods to Multiple Sample Sets
To apply a method to multiple sample sets:
1.
Highlight the desired sample sets as explained in "Selecting Samples" on page 30.
2.
Select Edit | Auto-Fill Method Name . The Choose Method dialog box opens.
3.
Select a method from the drop-down list.
4.
In the Auto Fill area of the dialog box, select Selected sample sets only, then click OK .
To apply a method to all sample sets:
1.
Select Edit | Auto-Fill Method Name . The Choose Method dialog box opens.
2.
Select a method from the drop-down list.
3.
In the Auto Fill area of the dialog box, select All sample sets , then click OK .
To view the selected method, click the Method tab.
Conditioning the System
It is recommended to purge the manifold with fresh gel followed by a capillary gel fill, before
each plate run.
If the system has not been used for a long period of time, thoroughly purge the manifold and
run the condition method before performing a sample separation. Performing the condition
method fills the capillaries with gel 6 times.
NOTE Thoroughly clean the wetting tray with D.I. water before every run to remove old or dried gel.
Creating or Editing a Method
To create and/or edit a method:
1.
Select Edit | Method from the Sample Setup main screen.
2.
Highlight the desired method in the Choose Method to Edit dialog box and click OK .
3.
When the Method - Capillary Temperature dialog box opens, enter a temperature between
35 and 60° C.
4.
5.
38
a.
Select the Wait for Cap Temp option (if desired).
b.
Click OK to exit the Method dialog box or continue with step 4 to make additional
changes to the method.
Select Denature from the Event list.
a.
Enter a duration between 0 and 180 seconds (if 0 is selected, there will be no
denaturation).
b.
Click OK to exit the Method dialog box or continue with step 5 to make additional
changes to the method.
Select Pause from the Event list.
GenomeLab Genetic Analysis System User’s Guide
PN A29142-AB
Sample Setup Module
Using the Sample Setup Module
6.
7.
a.
Enter a time duration between 0 and 10 minutes.
b.
Click OK to exit the Method dialog box or continue with step 6 to make additional
changes to the method.
Select Inject from the Event list.
a.
Enter an injection voltage between 0.1 and 12.0 kV.
b.
Enter a time duration in seconds.
c.
Click OK to exit the Method dialog box or continue with step 7 to make additional
changes to the method.
Select Separate from the Event list.
a.
Enter the separation voltage between 0.1 and 12.0 kV.
b.
Enter a time duration in minutes.
c.
Click Advanced to specify the two separation phases for the method.
d.
Click OK to return to the Method dialog box.
The first phase is to “coax” the sample into the capillaries. The second phase is to perform the
normal separation of the samples.
8.
Click OK to exit the Method dialog box or continue to make additional changes to the
method.
9.
In the Save As dialog box:
a.
Select a Project Name from the drop-down list.
b.
Enter a name in the name field.
c.
Click OK .
Defining Data Processing Conditions
Analysis parameter sets define the conditions specific to an experiment used in data
processing. Modification of the Sequence or Fragment Analysis Parameters can only be
performed in their respective analysis modules.
Sequence Analysis Parameter Sets define the start and end times for the analysis of raw data,
the threshold below which bases are called as ‘N’s, and the information necessary to detect the
start of data to be analyzed, including the delay between the detected start of data and the
start of data analysis, the signal to noise ratio, the minimum duration, and the threshold
above which data are considered peaks.
Fragment Analysis Parameter Sets, including SNP analysis, are used to process the fragment
data to estimated fragment sizes and to identify alleles. Fragment sizes are estimated by
generating a calibration curve from a set of size standards run with the unknown samples.
The Fragment Analysis Parameter set defines the analysis model used to generate the
calibration curve, dye label mobility corrections, allele identification criteria (locus tags),
quantitation values, and other factors that will affect how your data are analyzed.
GenomeLab Genetic Analysis System User’s Guide
PN A29142-AB
39
Sample Setup Module
Using the Sample Setup Module
Assigning Analysis Parameter Sets
r For a Sequence Analysis, select a Sequence Analysis as the Parameter Set
r
For Fragment Analysis, select a Fragment Analysis as the Parameter Set
Performing an Analysis on a Sample
To perform an analysis on a sample:
1.
Select the cell/cells as described in "Selecting Samples" on page 30.
2.
Select the Analysis tab at the bottom of the window.
3.
Select the Perform Analysis option.
4.
Select the parameter set from the Parameter Set drop-down list (see Figure 2.17).
Figure 2.17 Analysis Tab - Selecting a Parameter Set
Printing the Plate Report or Specifying Sample Plate Print Options
Define the print options and report format for the currently open sample plate.
1.
With a cell highlighted, select the Analysis Tab.
2.
Select the Print Report check box () to print a report immediately after completion of
the run.
3.
Click Edit Print Format For Plate . The Report Format dialog box opens.
4.
Verify or select the Printer and Page Layout options .
r
5.
In the Sample Elements area of the Report Format dialog box, select each element to be
printed.
r
6.
40
If desired, click Colors and verify or modify the trace colors of the Raw Data and/or
Analyzed Data , then click OK .
If desired, click Options and verify or change the Raw Data , Sequence Analysis
Result Data , Fragment Analysis Result Data, Base Sequence Grouping and Current
Trace Options selections in the Print Options dialog box, then click OK .
Click OK on the Report Format dialog box to save the changes and close the dialog box.
GenomeLab Genetic Analysis System User’s Guide
PN A29142-AB
Sample Setup Module
Using the Sample Setup Module
Figure 2.18 Report Format Options
Specifying Sample Plate Export Options
Exporting Sample Results
To export sample results after separation:
1.
Select the Export Data option in the Export section of the Analysis Tab (Figure 2.17).
2.
Click on the Edit Export Options for Plate button.
3.
Select the target folder.
4.
Select the desired Sample Elements for the export format chosen. Refer to the Online
Help for a description of these parameters and the export formats.
5.
Select the desired options for the chosen export format. See "Export Options" on page
41 for descriptions of the export options used for exporting sample results.
6.
Click OK.
NOTE The export formats selected will apply to all samples automatically exported during the plate run.
Export Options
Removing CEQ Tracking Suffix
Select this option to remove the appended sample plate position and time/date stamp from
the exported files.
GenomeLab Genetic Analysis System User’s Guide
PN A29142-AB
41
Sample Setup Module
Using the Sample Setup Module
Resolving Filename Conflicts
Select this option to automatically increment the exported files of the same name with a
unique sequence number.
Export Options - Sequencing Results
The following options are specific to sequencing results only.
Apply Trimming
Select this option to remove the trimmed data from a sequence before it is exported. The
export replaces all internal trims with the letter “x”.
Export Only If Sequence > X nt
After performing the trimming operation, the resulting sequence may be too small to be
useful. Select the Export Only If Sequence > X nt option to specify a minimum size for the
sequence output, when exporting. This exports only those sequences greater than the set
number of nucleotides.
See the Online Help for additional Export Sample Elements.
Importing Sample Plate Information from TXT Files.
Importing a Sample Plate with Default Run Method and Analysis Parameters
Import the sample plate txt file(s) to the CE System. The run default separation method(s)
and analysis parameters that were pre-selected in the imported sample plate data sets will be
used for running and analyzing the plate.
1.
Select an appropriate Working Database and Project in the Data Manager module.
2.
Open the Sample Setup module.
3.
From the Menu Bar, select File | Import.
4.
In the Import dialog, navigate to the folder containing the Sample Plate TXT file.
5.
Highlight the selected sample plate TXT file and click Open in the Import dialog.
6.
The imported sample plate grid window will appear.
7.
Re-confirm the values and properties for all Sample Plate objects: the barcode, the
sample names, the separation method(s), the note, the analysis parameters, report and
export options.
8.
From the Menu Bar, select File | Save As.
9.
Save the Sample Plate to the desired project with a new name.
10. Repeat steps 1 through 8 for the second Sample Plate, if one is present.
Importing a Sample Plate
Using Non-Default Run Method or Analysis Parameters
If using non-default methods, the appropriate run method(s) and analysis parameters that
were pre-selected in the Data Sets must be set up in the CE System software before importing
the sample plate TXT file(s).
42
GenomeLab Genetic Analysis System User’s Guide
PN A29142-AB
Sample Setup Module
Using the Sample Setup Module
1.
Launch the Data Manager.
2.
Setup an appropriate Working Database or create a new Working Database and Project.
3.
Launch the Sample Setup module.
4.
Cancel the Sample Plate Selection popup window.
5.
From the Menu Bar, select Edit | Method.
6.
From the Choose Method to Edit dialog, confirm the presence of the appropriate or
pre-selected run method(s).
7.
If not present, highlight any existing method and click OK.
8.
Select the appropriate Event Type and edit the method as explained in"Creating or
Editing a Method" on page 38.
9.
When finished, click Save As and save the edited method to an appropriate Project with
the same method name as specified in the plate Import file.
Using a Sequence Reaction Separation
1.
Launch the Sequence Analysis module.
2.
In the Sequence Analysis module, select Analysis | Working Analysis Parameters.
3.
From the Working Parameters dialog, select Use Stored parameters.
4.
Confirm the presence of the appropriate/pre-selected analysis parameters in the
Select Analysis Parameters popup window.
r
5.
If not present, cancel the Select Analysis Parameters and click Edit in the Working
Parameters dialog.
Select the desired tab and edit the parameters as appropriate in the Sequence Analysis
Parameters Editor dialog box. See "Editing Sequence Analysis Parameters" on page 116
for a description of the Sequence Analysis Parameters Editor and creating Analysis
Parameters.
6.
When finished, click Save As and save the edited parameters to an appropriate Project
with the same analysis parameters name as specified in the plate Import file.
Performing a Fragment Analysis Separation
1.
Launch the Fragment Analysis Module.
2.
In the Fragment Analysis Module, select Analysis | Analysis Parameters.
3.
From the Analysis Parameters dialog, select the appropriate analysis parameters in the
Select Analysis Parameters Set field.
r
4.
If not present, click Edit and modify the appropriate analysis parameters in the Edit
Fragment Analysis Parameters dialog. See "Defining Fragment Analysis Parameters"
on page 200 for a description of this dialog.
When finished, click Save As and save the edited parameters to an appropriate Project
with the same analysis parameters name as specified in the plate Import file.
After creating the Non-Default Run Method and Analysis Parameters, follow the same steps as
in Importing a Sample Plate with Default Run Method and Analysis Parameters, as listed
above.
GenomeLab Genetic Analysis System User’s Guide
PN A29142-AB
43
Sample Setup Module
Using the Sample Setup Module
Exporting Sample Plate Data
Export the sample plate data to use in compatible equipment or to manually edit the plate
information.
IMPORTANT If a Sample Plate file is already open, make sure it has been saved before proceeding.
To export the sample plate:
1.
Open the sample plate file.
2.
Select File | Export.
3.
Select Resolve Filename Conflicts to prevent the file from overwriting a previous file
with the same name. If another file with the same name exists, the export function
increments the new file with a unique sequence number.
NOTE If you do not select Resolve Filename Conflicts and a file with the same name exists, the system
displays a warning message, asking if you want to replace the old file with the new one. Select Yes to
overwrite the existing file or No to cancel the export.
4.
Select a location to save the file.
5.
Enter a filename or leave the name as it is.
6.
Click OK .
Locking a Sample Plate
To prevent editing of the currently displayed plate, select File | Lock. The Notes, Method, and
Analysis tabs are disabled when the Sample Plate is locked.
Viewing the Summary
To display a read-only window showing the attributes of the currently selected plate, select
View | View Summary.
44
GenomeLab Genetic Analysis System User’s Guide
PN A29142-AB
Run Module
Run Module Overview
3Run Module
This chapter provides an overview of the Run module, including its menu options, toolbars,
and dialog boxes. It also shows you how to run sample plates and set the display options
using this module.
3.1
Run Module Overview
Launch pre-programmed sample plates and control individual functions of the instrument.
Use the Run module for:
r
Running a sample plate
r
Performing all instrument control and operational functions such as:
r
denaturing samples
r
injecting and separating samples
r
loading and unloading plates
r
controlling the capillary chamber temperature
r
filling the capillaries with gel
GenomeLab Genetic Analysis System User’s Guide
PN A29142-AB
45
Run Module
Run Module Overview
Using the Run Control Main Window
The following illustration identifies the areas on the Run module’s main window that are
described in Table 3.1.
Figure 3.1 Main Window, Run Module
The following table describes the items called out in the image above.
Table 3.1 Main Window, Run Module
Item
46
Description
A
Title Bar - Displays the name of the module (Run Control) and the user-defined system
name.
B
Menu Bar - See "Menu Bar Options" on page 47.
C
Toolbars - See "Toolbar Icons" on page 53.
D
Window Selection Tabs - Toggle between windows (see "Window Selection Tabs" on page
59).
E
Display Area - Graphically displays the raw data of the selected capillary or capillaries.
F
Status Monitor - Displays the current state of the run, capillary and gel cartridge status,
and system on-line/off-line status.
GenomeLab Genetic Analysis System User’s Guide
PN A29142-AB
Run Module
Run Module Overview
Table 3.1 Main Window, Run Module
Item
Description
G
Capillary Buttons - Letters A through H represent the eight capillaries in the array. Selecting
one of these buttons displays an associated pane shown in the display area.
H
Status Bar - Displays messages such as:
r
Currently active database - Displays the name of the active database.
r
Active Plate - Displays the side of the active plate (left/right).
r
Pause To Load - If you selected Pause to load, this area displays the wait time.
r
Configured 2nd Plate - If you loaded a second plate, this area displays the name of
the plate.
r
Display fields on the right of the status bar indicate which of the following keys are
latched down:
r CAP - Caps Lock key is enabled.
r NUM - Num Lock key is enabled.
r SCRL - Scroll Lock key is enabled.
Menu Bar Options
The following example shows the Run Control menu bar options.
The following topics describe each of these menus and their options.
File Menu
Click the File menu to display its drop-down menu, as shown in the following example.
Use the File menu to save the log file, set system preferences, and print the log, or an item on
the window. The following table describes the File menu options within the Run Module.
Table 3.2 File Menu, Run Module
Option
Description
Restore Data Monitor
Defaults
Restores the colors of the data monitor to the original default shipped with the
instrument.
Save Log
Saves the system log in a folder you select. The log is identified by the date and
a unique identifier.
GenomeLab Genetic Analysis System User’s Guide
PN A29142-AB
47
Run Module
Run Module Overview
Table 3.2 File Menu, Run Module
Option
Description
System Preferences
View and modify the System Name, Operator Name, Project Name and
Dye Names for Fragment Analysis and/or to activate or deactivate the alarms.
(See "Defining System Preferences" on page 65.)
Print Setup
Define printer properties.
Print Preview
Displays a facsimile of a hardcopy printout of the system log prior to printing.
Print Log
Prints the system log.
View Menu
Click the View menu to display its drop-down menu, as shown in the following example.
NOTE A " " next to an option indicates that the option is enabled.
Activate or deactivate window display options.
The following table describes the Run module's View menu options.
Table 3.3 View Menu
Option
48
Description
Toolbars
Choose which toolbars to display. Select () the options that identify the toolbars
you want displayed. To hide a toolbar, clear its check box. See "Toolbar Icons" on
page 53.
Status Bar
Toggles between showing and hiding the status bar. Select this option to show the
status bar. To hide the status bar, select this option again to clear the check mark.
Status Monitor
Select this option to activate or deactivate the Status Monitor window displays. The
default setting is activated. (See "Status Monitor" on page 57.)
Working
Database
Displays the name of the database currently in use.
GenomeLab Genetic Analysis System User’s Guide
PN A29142-AB
Run Module
Run Module Overview
Direct Control Menu
Manage separation functions, conditions, or system components. These capabilities serve in
both method development and diagnostic tools.
The table lists the Direct Control menu options.
Table 3.4 Direct Control Menu
Option
Description
Unload Plates
Move the plate holder to the position at the front of the instrument to load or unload
plates. See "Loading the Sample Plate" on page 354.
Plate Position
Graphically select the well location where the capillaries will be immersed.
Capillary
Temperature
Set the capillary holding temperature. This temperature will be over-ridden at the end
of each sample plate or when cancelled. See "Specifying Capillary Temperature" on
page 356.
Denature
Samples
Initiate the denaturing of samples. See "Denaturing a Sample" on page 357.
Optical
Alignment
Align the lasers with the detection windows of the eight capillaries. You can save and
view the data in the Sequence Analysis module. See "Performing an Optical
Alignment" on page 359.
Inject
Initiate the injection of the sample prior to separation. See "Injecting a Sample" on
page 357.
Separate
Initiate the separation of injected samples. The data generated is not saved. See
"Performing a Separation" on page 358.
Gel Capillary Fill
Fill all capillaries with fresh gel. (This forces any gel present in the capillary out to the
specified waste position in the buffer plate or wetting tray.) See "Replenishing the
Capillaries with Gel" on page 358.
Manifold Purge
Clear the manifold of air bubbles and/or remaining DNA fragments before the next
separation process. See "Purging the Manifold" on page 358.
GenomeLab Genetic Analysis System User’s Guide
PN A29142-AB
49
Run Module
Run Module Overview
Tools Menu
Click the Tools menu to display its drop-down menu, as shown in the following example.
NOTE A " " next to an option indicates that the option is enabled.
The following table describes the Run module's Tools menu options.
Table 3.5 Tools Menu
Option
50
Description
Autoscroll
Toggles Autoscroll off and on. When enabled (), the system will scale all data to the
last 10 minutes of the run on the X-axis and confine the display of data to the pane on
the Y-axis. Selecting a checked option removes the check mark and disables the
feature.
Autoscale
Toggles Autoscale off and on. When enabled (), the system automatically scales
the data displayed on the window to the fit into the pane. If autoscaling is disabled,
the data is scaled to its true values. Selecting a checked option removes the check
mark and disables the feature.
Pause Data
Display
Pauses or resumes data display. When enabled (), this option pauses data display.
(Pausing data does not stop the stream of data, just the display of data.)
Unzoom
Select Unzoom to undo one zoom level.
Unzoom All
Select Unzoom All to undo all zoom levels.
Display Options
Opens the Display Options dialog box, which you can use to modify the parameters
for currently displayed data, including its title, X-axis, Y-axis, dye traces, current
traces, and colors. For details, see "Setting or Changing Display Options" on page
70
View Last
Analysis
Select View Last Analysis to open the Sequence or Fragment Analysis module and
display the most recently analyzed sample set of a running sample plate. For details,
see "Viewing the Last Analysis Performed" on page 72.
GenomeLab Genetic Analysis System User’s Guide
PN A29142-AB
Run Module
Run Module Overview
Run Menu
Click the Run menu to display its drop-down menu, as shown in the following example.
The following table describes the Run module's Run menu options.
Table 3.6 Run Menu
Option
Description
Start Sample Plate
Opens the Sample Plate Run Confirmation dialog box.
Pause
Pauses a running sample plate.
Pause to Load
Load a second plate while a plate is running. For details, see "Pause to Load" on
page 68.
Stop System
Stop a running sample plate or direct control process. For details, see "Stopping
a Sample Plate Run" on page 69.
Monitor Baseline
Set the desired parameters. For details, see "Monitoring the Baseline" on page
383.
Diagnostics
View the instrument version, laser power, PC Settings, monitor status, and to
home the plates and/or the gel pump. For details, see "Diagnostics" on page 382.
Reset
Re-synchronizes system hardware with the firmware and to reset the system log.
GenomeLab Genetic Analysis System User’s Guide
PN A29142-AB
51
Run Module
Run Module Overview
Log Options Menu
Click the Log Options menu to display its drop-down menu, as shown in the following
example.
NOTE A " " next to an option indicates that the option is enabled.
The Log Options menu options are available when displaying the Log tab. The following table
describes the Run module's Log menu options.
Table 3.7 Log Options Menu
Option
Description
Errors Only
Toggles this option off and on. When enabled (), the Log window lists only errors.
All Detail
Toggles this option off and on. When enabled (), the Log window includes all
messages and system activity.
Sample Plate
Only
Toggles this option off and on. When enabled (), the Log window displays only the
items related to a running sample plate.
Freeze Log
Toggles this option off and on. Select this option to freeze or resume the display in
the Log window. (Freezing the log data does not stop the run, just the display of log
data.)
Replenish Menu
Click the Replenish menu to display its drop-down menu, as shown in the following example.
The following table describes the Run module's Replenish menu options.
Table 3.8 Replenish Menu
Option
52
Description
Capillary
Information
Opens the Capillary Information dialog box. Use this dialog box to enter information
that applies to your capillary array. For details, see "Viewing Capillary Information"
on page 359.
Install Capillary
Array
Opens the Install Capillary Array dialog box. Use this dialog box to install the capillary
array. Verify or change the information, then install the array.
GenomeLab Genetic Analysis System User’s Guide
PN A29142-AB
Run Module
Run Module Overview
Table 3.8 Replenish Menu
Option
Description
Release
Capillary Array
Displays the first in a series capillary array dialog boxes that let you remove the
currently installed capillary array. For details, see "Removing and Replacing the
Capillary Array" on page 361.
Gel
Cartridge/Buffer
Information
Opens the Gel Cartridge/Buffer Information dialog box, which provides information
concerning the gel cartridge and buffer. For details, see "Viewing Gel Information" on
page 360.
Install Gel
Cartridge
Opens the Install Gel Cartridge dialog box.
Release Gel
Cartridge
Use this option to remove the gel cartridge or, if you are not going to install a working
gel cartridge, to insert a clean empty cartridge or gel pump plug into the cartridge
chamber. For details, see "Removing and Replacing a Gel Cartridge/Gel Pump Plug"
on page 367
Replace Wetting
Tray
Displays the first in a series of dialog boxes that let you replace the wetting tray. For
details, see "Replacing the Wetting Tray" on page 350.
Empty Waste
Bottle
Displays the first in a series of dialog boxes that let you empty the waste bottle. For
details, see "Replacing the Gel Waste Bottle" on page 349.
Toolbar Icons
The Run module provides six toolbars: Standard, Direct Control, Data Monitor, Log,
Sequence Dye Colors, and Fragment Dye Colors. Each icon of the various toolbars
corresponds to a commonly used menu item.
The following tables describe the function of each of the toolbar icons.
Standard Toolbar
The following example shows the Sample Setup module’s Standard toolbar. For descriptions
of the actions that occur when you click a toolbar icon, see Table 3.9.
Figure 3.2 Standard Toolbar, Run Module
Table 3.9 Standard Toolbar, Run Module
Icon
Description
Restore Data Monitor Defaults - Displays the default color selections at
the time of installation.
Run Sample Plate - Runs a sample plate.
Pause - Pauses the currently running sample plate.
Stop - Stops the currently running sample plate or direct control
process.
GenomeLab Genetic Analysis System User’s Guide
PN A29142-AB
53
Run Module
Run Module Overview
Table 3.9 Standard Toolbar, Run Module
Icon
Description
View Last Results - Executes the Sequence or Fragment Analysis
module with the analysis of the last sample set run.
Help Topics - Displays the CE system online help. By default, the help
system displays the Contents in the navigation pane, located on the left,
and the introductory topic in the topic pane, located on the right. You
can use the Contents to select and print specific help topics. The
navigation pane also provides a Search tab and an Index tab. These
tabs let you search for information by topic, index entry, and/or
keyword.
Online Help - Click this icon and then on a menu item to open the help
topic related to the selection.
Direct Control Toolbar
The following example shows the Sample Setup module’s Direct Control toolbar. For
descriptions of the actions that occur when you click a toolbar icon, see Table 3.4.
Figure 3.3 Direct Control Toolbar, Run Module
Figure 3.4 Direct Control Toolbar, Run Module
Icon
Description
Inject - Injects sample prior to its separation and detection. See
"Injecting a Sample" on page 357.
Separate - Initiates the separation of injected samples. See
"Performing a Separation" on page 358.
Fill Capillary with Gel - Fills all eight of the capillaries with fresh gel. See
"Replenishing the Capillaries with Gel" on page 358.
Capillary Temperature - Specifies the desired temperature for the
capillaries. See "Specifying Capillary Temperature" on page 356.
Denature - Denatures the samples residing in a specific sample set. See
"Denaturing a Sample" on page 357.
Optical Alignment - Performs the alignment of the lasers with the
capillary windows. See "Performing an Optical Alignment" on page
359.
Plate Position - Selects where you want to position and immerse the
capillaries.
Load/Unload Plates - Selects the position where the capillaries are
immersed in the plate or wetting tray and moves the plates to the Load
position at the front of the instrument for loading/unloading plates.
Release Gel Cartridge - Removes the gel cartridge. See "Removing and
Replacing a Gel Cartridge/Gel Pump Plug" on page 367.
54
GenomeLab Genetic Analysis System User’s Guide
PN A29142-AB
Run Module
Run Module Overview
Figure 3.4 Direct Control Toolbar, Run Module
Icon
Description
Install Gel Cartridge - Installs a gel cartridge.
Release Capillary Array - Removes the current capillary array. See
"Removing and Replacing the Capillary Array" on page 361.
Install Capillary Array - Installs the capillary array.
Replace Wetting Station - Replaces the wetting tray. See "Replacing
the Wetting Tray" on page 350.
Data Monitor Toolbar
The following example shows the Sample Setup module’s Data Monitor toolbar. For
descriptions of the actions that occur when you click a toolbar icon, see Table 3.10.
Figure 3.5 Data Monitor Toolbar, Run Module
Table 3.10 Data Monitor Toolbar, Run Module
Icon
Description
Unzoom - Undoes one zoom level.
Unzoom All - Undoes all zoom levels.
Autoscroll - Scale all data to the last 10 minutes of the run on the X axis and confine the
display of data to the pane on the Y axis.
Autoscale On/Off - By default, data displayed on the screen is scaled automatically to the
confines of the screen (autoscale is on). If autoscaling is disabled, the data is scaled to its
true values.
Pause Data Update - Pause the display of data. (Pausing data does not stop the stream of
data, just the display of data.)
Monitor Baseline - Displays the baseline data trace. For details, see "Monitoring the
Baseline" on page 383.
Display Options - Modifies any or all display parameters. See "Setting or Changing
Display Options" on page 70.
Log Toolbar
The following example shows the Sample Setup module’s Log toolbar. For descriptions of the
actions that occur when you click a toolbar icon, see Table 3.11.
Figure 3.6 Log Toolbar, Run Module
GenomeLab Genetic Analysis System User’s Guide
PN A29142-AB
55
Run Module
Run Module Overview
Table 3.11 Log Toolbar, Run Module
Icon
Description
Print - Print the system log at any time the program is active. System Logs contain all of
the messages and activity from the time the program is opened to the time the program
is closed.
Print Preview - Display a print preview of the System Log.
Run Sample Toolbar
The following example shows the Sample Setup module’s Run Sample toolbar icon.
Figure 3.7 Run Sample Toolbar Icon
Click this toolbar button to open the Sample Plate Run Confirmation dialog box.
Sequence Dye Colors Toolbar
The following example shows the Sample Setup module’s Sequence Dye Colors toolbar. For
descriptions of the actions that occur when you click a toolbar icon, see Table 3.12
Table 3.12 Sequence Dye Colors Toolbar, Run Module
Icon
Description
A:
(red)
Red is the default color assigned to the Adenine (A:) nucleotide bases in the analyzed
data pane.
C:
(black)
Black is the default indicator assigned to the Cytosine (C:) nucleotide bases in the
analyzed data pane.
G:
(green)
Green is the default color assigned to the Guanine (G:) nucleotide bases in the
analyzed data pane.
T:
(blue)
Blue is the default color assigned to the Thymine (T:) nucleotide bases in the analyzed
data pane.
Fragment Dye Colors Toolbar
The following example shows the Sample Setup module’s Fragment Dye Colors toolbar. For
descriptions of the actions that occur when you click a toolbar icon, see Table 3.13.
Figure 3.8 Fragment Dye Colors Toolbar, Run Module
56
GenomeLab Genetic Analysis System User’s Guide
PN A29142-AB
Run Module
Run Module Overview
Table 3.13 Fragment Dye Colors Toolbar, Run Module
Icon
Description
D1
(red)
Red is the default color assigned to Dye #1 in the fragment data pane and D1 is the
default name.
D2
(black)
Black is the default color assigned to Dye #2 in the fragment data pane and D2 is the
default name.
D3
(green)
Green is the default color assigned to Dye #3 in the fragment data pane and D3 is the
default name.
D4
(blue)
Blue is the default color assigned to Dye #4 in the fragment data pane and D4 is the
default name.
Status Monitor
The Status Monitor displays the state of the current run. Figure 3.9 shows the status monitor
and Table 3.14 describes the areas.
A
B
C
Figure 3.9 Status Monitor Displays, Run Module
GenomeLab Genetic Analysis System User’s Guide
PN A29142-AB
57
Run Module
Run Module Overview
Table 3.14 Status Monitor Displays, Run Module
Item
Description
A - Progress Indicator
This area of the Status Monitor shows the Status, Event Type, and Progress of a
running sample plate or process.
NOTE Times displayed are approximations.
B - Information Tabs
C - Capillary Status
58
Select any of four tabs to display the corresponding status details:
r
Sample - Lists the sample plate, sample names and the method being
used.
r
Device - Displays the condition or value of devices or parameters.
r
µAmp - Shows the approximate overall microamperes (µA) and voltage
used during the separation.
r
Life - Displays the remaining gel, capillary usage and laser hours.
Indicates certain capillary usage, gel cartridge life and on-line status. When the
life of the gel or capillary array is exceeded, the associated indicator turns red.
When the system is on-line, the indicator is green.
GenomeLab Genetic Analysis System User’s Guide
PN A29142-AB
Run Module
Run Module Overview
Window Selection Tabs
View data on the Data Monitor, Direct Control, Log, and Instrument Data. The following
topics describe these windows.
Data Monitor Window
The following example shows the Data Monitor window. To open this window, select the Data
Monitor tab. This window displays information associated with a sample’s analysis.
Figure 3.10 Data Monitor Window, Run Module
Table 3.15 Data Monitor Window, Run Module
Item
Description
A
Data Monitor Tab - Displays the Data Monitor window.
B
Data Monitor Window - Displays the data for the running sample plate for the selected
capillary buttons.
C
Capillary Buttons - These buttons (A through H) represent the eight capillaries of the
array.
GenomeLab Genetic Analysis System User’s Guide
PN A29142-AB
59
Run Module
Run Module Overview
Direct Control Window
This window contains selectable areas and function buttons that perform some of the distinct
tasks listed in the Direct Control and Replenish drop-down menus. For details, see "Direct
Control Menu" on page 49 and "Replenish Menu" on page 52.
Right-click anywhere in the
window to open a full menu
B
A
I
H
F
C
D
G
E
Figure 3.11 Direct Control Window, Run Module
The example above identifies the selectable areas on the Direct Control window. When you
click a selectable area, the system initiates a unique Direct Control task. Table 3.16 lists the
tasks available in this window.
Table 3.16 Direct Control Window, Selectable Areas
Item
60
Description
A
Capillary Temperature - Change the capillary temperature.
B
Gel Capillary Fill - Fill all capillaries with fresh gel. (Any gel present in the capillary is
forced out to the specified waste position in the buffer plate or wetting tray.)
C
Optical Alignment - Align the lasers with the detection windows of the eight
capillaries. Data can be saved and viewed in the Sequence Analysis module.
GenomeLab Genetic Analysis System User’s Guide
PN A29142-AB
Run Module
Run Module Overview
Table 3.16 Direct Control Window, Selectable Areas
Item
Description
D
Manifold Purge - Clears the manifold of air bubbles and/or remaining DNA fragments
before the next separation process.
E
Install/Release Gel Cartridge - Releases and/or installs a gel cartridge.
F
Denature Samples - Initiates the denaturing of samples.
G
Plate Position - Select the plate or tray position where the capillaries will be
immersed.
H
Wetting Tray - Replace or refill the wetting tray.
I
Install/Release Capillary - Installs the capillary array. Verify or change the information
requested, and then install the array.
Access Plates
Load/Unload Plates - Displays the Unload Plates dialog box and:
r
Select the position for capillary immersion in the plate or wetting tray.
r
Move the plates to the Load position at the front of the instrument to load or
unload plates.
Inject
Inject - Initiates injection of the sample prior to separation.
Separate
Separate - Initiates the separation of injected samples.
For procedures on using the Direct Control window to replenish the system, see "Direct
Control and Replenishment" on page 352.
GenomeLab Genetic Analysis System User’s Guide
PN A29142-AB
61
Run Module
Run Module Overview
Log Window
VIew all of the messages and activity for a sample plate run. The following example shows the
Log window. To open this window, select the Log tab.
A
B
C
Figure 3.12 Log Window, Run Module
Table 3.17 Log Window, Run Module
Item
62
Description
A
Window Selection Tab - Select this tab to access the Log window.
B
Freeze Log - Freezes the display in the Log window. (Freezing the log data does not
stop the collection of data, just the display of data.)
C
Display Area - Provides the list of logged events.
GenomeLab Genetic Analysis System User’s Guide
PN A29142-AB
Run Module
Run Module Overview
Instrument Data Window
View the current for the eight capillaries and the voltage level of the instrument for the
current run. To open this window, select the Instrument Data tab.
A
C
B
Figure 3.13 Instrument Data Window, Run Module
Table 3.18 Instrument Data Window, Run Module
Item
Description
A
Current and Voltage Buttons - Select panes for display.
B
Window Selection Tab - Select this tab to access this window.
C
Display Area - Displays the current and voltage levels of selected current run.
GenomeLab Genetic Analysis System User’s Guide
PN A29142-AB
63
Run Module
Using the Run Module
3.2
Using the Run Module
Run sample plates and set the display options.
To open the Run module from the Main Menu, click the Run icon:
Gel Plug Warning
When you open the Run module, the system initializes and checks the gel cartridge
condition. If the system detects an installed gel plug, the Device Warning Message appears, as
shown in Figure 3.14.
Figure 3.14 Device Warning Message - Gel Plug Installed
In addition to this warning message, the Device tab indicates the state of the Cartridge. When
a gel plug is present, the Device tab indicates plug in the Cartridge field, as shown in
Figure 3.15.
The plug must be removed and replaced with a gel cartridge before the next run. When a
cartridge is present, the Device tab indicates Gel in the Cartridge field, as shown in
Figure 3.16.
Figure 3.15 Device Tab – Gel Plug installed
64
Figure 3.16 Device Tab – Gel Cartridge installed
GenomeLab Genetic Analysis System User’s Guide
PN A29142-AB
Run Module
Using the Run Module
Defining System Preferences
To define the system preferences:
1.
Select File | System Preferences . The System Preferences dialog box opens, as shown
in the following example.
Figure 3.17 System Preferences Dialog Box
2.
Enter the System Name and Operator Name .
3.
Select the Project Name .
4.
Define Dye Names for the Fragment Analysis module, if desired.
5.
Enable or disable the alarms.
6.
Click OK .
Running Sample Plates
To run two sample plates (once plate information has been created and saved for both plates):
1.
Select Run | Start Sample Plate . The Sample Plate Run Configuration dialog box opens.
2.
Select the name of the sample plate from the Sample Plate Name drop-down list for the
Left and Right Plates.
3.
Click Load Plates . The Access Plates dialog box opens.
4.
Click Start. The Capillaries Exposed dialog box opens.
5.
Follow the screen instructions in Capillaries Exposed dialog boxes to load the wetting
tray, sample plate, and buffer plate by following the instructions.
6.
Click Load to finish loading plates.
7.
Verify the sample position in the plate.
8.
Click Start to initiate the run.
NOTE If the working database exceeds 500 MB, an error message appears. If this happens, follow then
troubleshooting procedures described in "Database Size" on page 66, then return to these steps.
GenomeLab Genetic Analysis System User’s Guide
PN A29142-AB
65
Run Module
Using the Run Module
Database Size
If you select a database that is greater than 1700 megabytes, the following warning message
appears when you create and run a sample plate.
Figure 3.18 Run -- Database Size Warning Message
To resolve this problem:
1.
Click No to dismiss the warning dialog box.
2.
Exit the Run module and the Sample Setup module.
3.
Make sure all of the other modules are closed.
4.
Open the Data Manager module.
5.
Create a new database. For details, see "Creating a Database" on page 327.
6.
Copy the sample plate from the previous working database to the new database.
7.
Click OK All to copy any objects referenced by the sample plate to the new database.
8.
Exit the Data Manager module and launch the Run module.
9.
Select Run | Start Sample Plate .
10. Select the new sample plate and click OK .
The system processes the plate and stores it in the new database.
NOTE It is recommended that you archive databases that are larger than about 1700 MB. For details, see
"Checking the Database Size" on page 329.
Gel Re-estimation
The system determines if the gel cartridge volume is sufficient to safely process the plate.
66
r
If the gel volume is greater that 1.5 mL more than the minimum amount needed to
process the plate, the plate runs and the system does not re-estimate the gel volume.
r
If the system determines that the gel cartridge volume is less than the volume
needed to safely process the plate, the system displays the two re-estimation
message boxes before running the sample plate.
GenomeLab Genetic Analysis System User’s Guide
PN A29142-AB
Run Module
Using the Run Module
In the first step, the system homes the gel pump and displays the Gel Volume
Re-estimation message, as shown in Figure 3.19.
Figure 3.19 Gel Volume Re-estimation - Step 1 Message Box
In the second step, the system engages the gel pump plunger and accurately
determines the gel volume. (See Figure 3.20.)
Figure 3.20 Gel Volume Re-estimation - Step 2 Message Box
If the actual volume (re-estimated by the system) is less than 1.0 mL more than the
total volume to run the plate, the Sample Plate Gel Usage dialog box opens, as
shown in Figure 3.21.
Figure 3.21 Gel Usage Confirmation Dialog Box
11. Click Accept to proceed with the run.
12. Specify the sample sets to run.
13. Select Replace Gel Cartridge to replace the gel cartridge before the run (if necessary).
GenomeLab Genetic Analysis System User’s Guide
PN A29142-AB
67
Run Module
Using the Run Module
Gel Volume Notification
If you attempt any operation that requires gel and there is not enough gel in the cartridge to
perform the operation, a warning message appears.
For example, if you attempt to perform a capillary gel fill when the cartridge does not have
enough gel, the system displays the message shown in Figure 3.22.
Figure 3.22 Gel Warning Dialog Box
If you attempt to run a sample plate and the gel cartridge does not have enough gel to process
any sample sets in that plate, the system displays the message shown in Figure 3.23.
Figure 3.23 Gel Usage Confirmation Dialog Box
To end the run and return to the Run main window, click Abort .
Pausing a Sample Plate Run
r
To pause the currently executing sample plate, click the Pause
pauses at the next executable step of the sample plate.
r
To resume the run, click the Pause
icon. The system
icon again.
Pause to Load
To pause a current run so you can load another plate:
68
GenomeLab Genetic Analysis System User’s Guide
PN A29142-AB
Run Module
Using the Run Module
1.
Select Run | Pause to Load to pause the system and load another plate. The Pause To
Load Plates dialog box opens, as shown in the following example.
Figure 3.24 Pause to Load Plates Dialog Box
2.
Select one of the following load options:
r
Load plate after the current sample set: This option delays loading of plates until after
immediate sample run. After completion of sample separation, the system enters the
Access Plates condition. After loading the new plate, the system runs the next
sample set from the original sample plate.
NOTE If the plate has not been loaded by the time set in Modify Wait Time (max. 30 minutes), the run
resumes with the next sample set.
r
Stop current sample set now to load plate: This option immediately stops the run to
allow for plate loading. If selected, the Save Collected Data option becomes available,
allowing the previously collected data to be saved.
r
Stop current sample plate now to load plate: This option breaks the plate run before the
next sample. If selected, the Save Collected Data option become available, allowing
the previously collected data to be saved.
3.
Click OK.
Stopping a Sample Plate Run
To stop the currently executing sample plate:
1.
Select Run | Stop System or click the Stop System
toolbar icon. The the Stop System
dialog box opens, as shown in the following example.
Figure 3.25 Stop System Dialog Box
2.
Select the desired Stop Options radio button:
GenomeLab Genetic Analysis System User’s Guide
PN A29142-AB
69
Run Module
Using the Run Module
r
Stop sample plate: Stops the currently running sample plate immediately,
r
All Plates: Check this box to make the Stop sample plate selection apply to both
sample plates.
r
Skip current sample set: Skips the currently running sample set.
r
Stop after current sample set completes: Stops the run after the currently running
sample set has been completed.
r
Save Collected Data: Saves data already collected for the currently executing sample
set.
r
3.
Perform Shutdown Method: Purges the system of any remaining DNA fragments and
refills the capillaries with fresh gel after the sample plate has been cancelled. (The
capillary temperature will be set to 35°C.)
Click OK .
Setting or Changing Display Options
To set or change the graph data display options:
1.
Open the Display Options dialog box using one of these methods:
r
Select Tools | Display Options.
r
While viewing a graph display of sequence data, right-click the graph and select
Display Options.
The Display Options screen opens, as shown in Figure 3.26.
Figure 3.26 Display Options Dialog Box
70
GenomeLab Genetic Analysis System User’s Guide
PN A29142-AB
Run Module
Using the Run Module
2.
Select the tab that identifies the type of display options you want to change. For details,
see the following topics:
r
"Title Properties Tab" on page 71
r
"X Axis Options Tab" on page 71
r
"Y Axis Options Tab" on page 71
r
"Colors Tab" on page 71
r
"Dye Traces Tab" on page 71
r
"Current Trace Tab" on page 72
NOTE For detailed descriptions while using this dialog box, click Help.
Title Properties Tab
Set or change the title of the displayed data panel.
1.
In the Display Options dialog box, select the Title tab.
2.
Change any item as necessary.
3.
Click Apply to continue or OK to close the Display Options dialog box.
X Axis Options Tab
Define the X Axis properties of the displayed data panels.
1.
In the Display Options dialog box, select the X Axis Options tab.
2.
Change any item as necessary.
3.
Click Apply to continue or OK to close the Display Options dialog box.
Y Axis Options Tab
Define the Y Axis properties of the displayed data panels.
1.
In the Display Options dialog box, select the Y Axis Options tab.
2.
Change any item as necessary.
3.
Click Apply to continue or OK to close the Display Options dialog box.
Colors Tab
Define the color options of the window, the current traces, the voltage trace, or the optical
scan trace.
1.
In the Display Options dialog box, select the Colors tab.
2.
Change any item as desired.
3.
Click Apply to continue or OK to close the Display Options dialog box.
Dye Traces Tab
Set or change the dye trace properties.
1.
In the Display Options dialog box, select the Dye Traces tab.
2.
Select the traces to display or not display, under Show Dye Traces .
GenomeLab Genetic Analysis System User’s Guide
PN A29142-AB
71
Run Module
Using the Run Module
3.
To change a color of any dye trace, click on the appropriate Dye Colors dye, select a color
from the Color dialog box, then click OK .
4.
When finished with Dye Traces, click Apply to continue or OK to close the Display
Options dialog box.
Current Trace Tab
Set or change the current trace options:
1.
In the Display Options dialog box, select the Current Traces tab.
2.
Select the radio button for the current type to display under Data .
3.
Click OK .
Viewing the Last Analysis Performed
View the last analysis performed on the CE system:
1.
With a sample plate running (and with Automatic Analysis selected), select Tools | View Last
Analysis. The Sequence Analysis Module dialog box opens and displays the last row of
sample analyzed, along with the Sample Plate toolbar.
2.
To view additional samples, select the appropriate sample positions in the sample plate
toolbar and click Open.
If the last analysis was a sequence analysis result, the Sequence Analysis module opens,
displaying the analyzed sequence data. If a Fragment Analysis separation was performed, the
raw data will be displayed in the Sequence Analysis module.
72
GenomeLab Genetic Analysis System User’s Guide
PN A29142-AB
Run Module
Using Direct Control
3.3
Using Direct Control
Click on the Direct Control icon.
NOTE Use Figure 3.27, User Accessible Hardware Components, to locate hardware components referenced
in this section.
Figure 3.27 User Accessible Hardware Components
1. Sample Access Cover (extended)
7. Manifold Access Cover
2. Capillary Access Cover (extended)
8. Gel Waste Bottle
3. Status Indicators
9. Power Switch
4. Plate Holders/Sample Transport
10. Gel Pump
5. Capillary Temperature Control Cover
11. Gel Pump/Gel Cartridge Access Cover
6. Rubber Latches
GenomeLab Genetic Analysis System User’s Guide
PN A29142-AB
73
Run Module
Using Direct Control
Loading the Sample Plate and Buffer Plate
1.
Select Direct Control | Access Plates from the menu.
Figure 3.28 Access Plates Dialog Box
2.
Click Start. The Capillaries Exposed dialog opens as shown below.
Figure 3.29 Capillaries Exposed Dialogs
3.
Wait until the dialog warning turns green.
4.
Open the Sample Access Cover (Figure 3.27) and lift it to the vertical locking position.
Loading the Sample Plate
74
1.
Make sure the Wetting Station is installed or perform the following procedure,
"Installing the Wetting Tray" on page 351, and then return here.
2.
Align the Sample Plate Guide Pin with the notched corner of the sample plate and gently
lower the plate into position (Figure 3.30).
GenomeLab Genetic Analysis System User’s Guide
PN A29142-AB
Run Module
Using Direct Control
1
4
2
3
5
6
901600L.AI
Figure 3.30 Loading the Sample Plate
1. Sample Plate
4. Sample Plate Notched Edge
2. Wetting Tray Retainers
5. ALIGN together
3. Sample Plate Holder
6. Sample Plate Guide Pin
Loading the Buffer Plate and Evaporation Cover
1.
Align the notched corner of the Buffer Plate with the alignment line on the Buffer Plate
Holder (Figure 3.31).
2.
Gently push the Buffer Plate towards the front of the instrument and then set the plate
into the transport.
3.
At the rear of the Buffer Plate Holder, align the Buffer Evaporation Cover Guide Pin with
the Buffer Evaporation Cover Alignment Notch and then gently lower the cover over the
Buffer Plate.
GenomeLab Genetic Analysis System User’s Guide
PN A29142-AB
75
Run Module
Using Direct Control
2
3
4
5
1
901599L.AI
Figure 3.31 Loading the Buffer Plate and Buffer Evaporation Cover
1. Front Location
4. Buffer Evaporation Cover Alignment
Notch
2. Buffer Evaporation Cover
5. Wetting Tray Retainers
3. Buffer Plate
When finished positioning the sample and buffer plates, close the Sample Access Cover and
then select the position from which the plates were loaded (left or right).
4.
The Capillaries Exposed dialog will display and click Load .
CAUTION The separation gel within the capillaries will dry out if the capillaries are left exposed to the air for
more than 15 minutes.
Setting the Capillary Temperature
1.
Select Direct Control | Capillary Temperature from the menu.
2.
In the Capillary Temperature dialog box enter a capillary holding temperature value in
degrees centigrade.
3.
Select Wait for temperature to be reached and then click Start .
Denaturing a Sample
76
1.
Select Direct Control | Denature from the menu.
2.
In the Denature Samples dialog box, enter a time duration in seconds.
3.
Identify the position of the Sample Set and click Denature .
GenomeLab Genetic Analysis System User’s Guide
PN A29142-AB
Run Module
Using Direct Control
Injecting a Sample
1.
Select Direct Control | Inject from the menu.
2.
In the Inject dialog box, enter the Voltage in kV and enter a Time Duration in seconds.
3.
Use the Sample Set option to set the position of the samples and then click Inject .
Performing a Separation
1.
Select Direct Control | Separate from the menu.
2.
In the Separate dialog box:
a.
Enter a value for the voltage in kV.
b.
Enter a time duration in minutes.
c.
Identify the position of the buffer using the Buffer Set spin controls and then select
Separate .
NOTE Data will not be saved.
Replenishing the Capillaries with Gel
1.
Select Direct Control | Gel Capillary Fill from the menu.
2.
From the Gel Capillary Fill dialog box, select the Buffer Plate or Wetting Tray option to
identify the position where waste will be expelled from the capillaries.
r
If Buffer Plate was selected, use the Buffer Plate spin controls to identify the waste
position in the buffer plate and then select Fill .
r
If Wetting Tray was selected, click Fill .
Purging the Manifold
1.
Select Direct Control | Manifold Purge from the menu.
2.
In the Manifold Purge dialog box, enter a volume in milliliters (mL).
3.
Enter the number of cycles and then select Purge .
Performing an Optical Alignment
To align the lasers with the detection windows of the eight capillaries:
1.
Select Direct Control | Optical Alignment from the Run menu.
2.
To save the alignment data, select the Autosave check box.
3.
Enter a name in the Name field.
4.
Select a Work Folder from the drop-down menu.
5.
Select Align .
IMPORTANT Prior to performing an Optical Alignment, it is advisable to purge the Array Manifold and fill the
capillaries with fresh gel (in that order). See “Purging the Manifold” and “Replenishing the Capillaries with
Gel”.
GenomeLab Genetic Analysis System User’s Guide
PN A29142-AB
77
Run Module
Using Direct Control
Monitoring the Baseline
To monitor the system baseline:
NOTE An optical alignment must be performed before enabling the Monitor Baseline function. This will
ensure accurate determination of the system baseline.
1.
Perform an optical alignment.
2.
Select Run | Monitor Baseline. The dialog will open.
Figure 3.32 Monitor Baseline Dialog Box
3.
In the Monitor Baseline dialog, select Enable Monitor Baseline, then click OK.
4.
Select the Data Monitor tab to view the baseline trace.
After reviewing the baseline trace, disable Monitor Baseline. To do this:
78
1.
Select Run | Monitor Baseline.
2.
In the Monitor Baseline dialog, select the Enable Monitor Baseline option, then click OK.
GenomeLab Genetic Analysis System User’s Guide
PN A29142-AB
Run Module
Using Direct Control
Viewing Capillary Information
1.
Select Replenish | Capillary Information from the Run module menu bar.
2.
Use the Capillary Information dialog box (Figure 3.33) to view the following
information:
Figure 3.33 Capillary Information Dialog
3.
View the following information:
r
Part Number: Displays the part number of the installed capillary array.
r
Serial Number: Displays the serial number of the installed capillary array. (The serial
number is used to track the capillary array along with the samples that have used
the array.)
r
Date Installed: Displays the date the capillary array was installed.
r
Time Installed: Displays the time the capillary array was installed.
r
Number of Runs: Specify the desired number using the spin-control. (Set more than
the recommended number of separations to be performed before the system alerts
you that the recommended number of runs has been exceeded.)
r
Days on instrument: Specify the number of days on the instrument using the
spin-control. (This allows the capillary array to reside on the instrument longer
than the recommended length of time before the system alerts you that the
recommended number of days on the instrument has been exceeded.)
r
Advanced: Displays the Capillary Advanced Information dialog box. This dialog box
displays the length and diameter of the installed capillary array based on the part
number entered in the New Capillary Array dialog box. The fields are read-only and
cannot be edited. Click OK to enter the information and close the dialog box.
4.
When finished, click OK to close the dialog box.
GenomeLab Genetic Analysis System User’s Guide
PN A29142-AB
79
Run Module
Using Direct Control
Viewing Gel Information
1.
Select Replenish | Gel Cartridge/Buffer Information from the Run Module menu bar.
2.
Use the Gel Cartridge/Buffer Information dialog box (Figure 3.34) to view the following
information:
r
Part Number: Displays the part number of the installed gel cartridge.
r
Lot Number: Displays the lot number of the installed gel cartridge. (The lot number is
used to track the gel lot along with the separations that have used the gel.)
r
Gel Name: The name of the gel.
r
Date Installed: Displays the date the gel cartridge was installed.
r
Time Installed: Displays the time the gel cartridge was installed.
r
Hours on Instrument: Displays the number of hours that the gel cartridge has remained
on the instrument.
3.
When finished, select OK to close the dialog box.
Figure 3.34 Gel Cartridge/Buffer Information Dialog Box
Viewing or Changing Buffer Information
1.
Select Replenish | Gel Cartridge/Buffer Information from the Run Module menu bar.
2.
Use the Gel Cartridge/Buffer Information dialog box (see the figure above) to view or
change the buffer lot number.
NOTE The buffer lot number can only be changed when the instrument is not performing a separation.
80
GenomeLab Genetic Analysis System User’s Guide
PN A29142-AB
Run Module
Using Direct Control
Removing and Replacing the Capillary Array
CAUTION Be careful when installing or removing the capillary array to prevent damage and maintain low
background signals. Clean all gel residue thoroughly.
NOTE This procedure assumes that an expended capillary array is being replaced with a new capillary array.
1.
Select Replenish | Release Capillary Array from the Run menu. After the system prepares
for release of the capillary array, the Remove Capillary Array dialog (Figure 3.35) is
displayed.
Figure 3.35 Remove Capillary Array Dialog Box
2.
Open the Sample Access Cover (Figure 3.36) and lift it to the vertical locking position.
3.
Open the Capillary Access Cover and lift it to the vertical locking position.
4.
Disconnect the two rubber latches holding the Capillary Temperature Control cover and
lift the cover to the vertical locking position.
5.
Loosen the Manifold Access Cover captive screw (Figure 3.36), then remove the cover
and set it aside.
GenomeLab Genetic Analysis System User’s Guide
PN A29142-AB
81
Run Module
Using Direct Control
Figure 3.36 Manifold Access Cover
1. Capillary Temperature Control Cover
(open)
4. Captive Screw
2. Plenum Assembly
5. Manifold Access Cover (removed)
3. Manifold Access Cover
6.
Loosen the two Plenum Assembly captive screws (Figure 3.37), then pull the Plenum
Assembly straight back and away from the instrument and set it aside.
CAUTION Slowly remove the Plenum Assembly, as the electrode block may disengage from its mounting
posts and become damaged.
82
GenomeLab Genetic Analysis System User’s Guide
PN A29142-AB
Run Module
Using Direct Control
Figure 3.37 Plenum Assembly Removal
1. Captive Screw
3. Plenum Assembly
2. Rubber Latch
4. Captive Screw
7.
Lift the Eject Lever (Figure 3.38) to release the Array Fitting.
8.
Grasp the Array Fitting tab (Figure 3.38) and then:
a.
Pull the fitting approximately one inch out of the manifold.
b.
Touch the tip of the fitting to the bottom of the Optics Base Plate.
c.
Hold and wait five seconds for the gel strand to dry.
d.
Pull the fitting away from the instrument.
e.
Wipe gel strands off of the instrument using a damp tissue.
NOTE Note the number of runs and days on the instrument for this capillary array for reference. If this
capillary array is to be re-installed, this information is necessary. A label has been provided on the back of
the array packaging container so that this information may be recorded.
GenomeLab Genetic Analysis System User’s Guide
PN A29142-AB
83
Run Module
Using Direct Control
1
2
3
4
5
6
901597L.AI
Figure 3.38 Removing/Replacing the Array Fitting
9.
1. Guide Pins
4. Gel Strand
2. Eject Lever
5. Optics Base Plate (bottom)
3. Array Fitting
6. Array Fitting
Grasp the Electrode Block tab (Figure 3.39) and pull the block out and away from the
instrument.
10. From the Remove Capillary Array dialog box (Figure 3.35), select the Replace Capillary
Array option and click OK .
84
GenomeLab Genetic Analysis System User’s Guide
PN A29142-AB
Run Module
Using Direct Control
1
2
901602.AI
Figure 3.39 Removing/Replacing the Electrode Block
1. Guide Block Pins
2. Electrode Block
CAUTION Always grip the capillary array fitting near the end during removal or installation of the tip cap to
prevent flexing and possible breakage of the capillary array as shown below (Figure 3.40).
900654L.AI
GenomeLab Genetic Analysis System User’s Guide
PN A29142-AB
85
Run Module
Using Direct Control
Figure 3.40 Array Fitting
11. While holding the Array Fitting tab (of the new capillary array), align the Array Fitting
(Figure 3.38) with the manifold opening and guide pins. Push the fitting into the
manifold until it is completely seated against the bases of the Guide Pins. Make sure that
the fitting tab is placed downward when inserting the capillary array into its slot.
12. While holding the Electrode Block tab, align the Electrode Block (Figure 3.39) with the
guide block pins and gently push it in until resistance is met. (The resistance is from the
spring-loaded contacts.)
13. When installing the capillary array, carefully route the capillaries through the hole in the
Plenum Assembly (Figure 3.41) and straight across the guide block pins (Figure 3.39).
Figure 3.41 Plenum Assembly - Capillary Routing Hole
NOTE When reinstalling the Plenum Assembly, gently gather the capillaries between your thumb and
forefinger to make sure they pass through the hole in the Plenum Assembly without any constriction.
14. Replace the Plenum Assembly and tighten the two captive screws (Figure 3.37).
15. Replace the Manifold Access Cover and tighten the captive screw (Figure 3.36).
16. Lower the Capillary Temperature Control Cover and secure the two rubber latches.
17. Lower the Capillary Access Cover and Sample Access Cover to their locking positions.
86
r
If you are installing a new capillary array, in the Install Capillary Array dialog box
(Figure 3.42), select the correct part number, enter the serial number, click Set to
New, then click Done . The number of runs and days on instrument will revert to “0.”
r
If you are installing the previous capillary array, do not change the serial number,
number of runs, or the number of days on the instrument as they will be correct.
r
If you are installing a capillary array that was previously used, but not the last
capillary array on the instrument, enter its part number (if applicable) serial
GenomeLab Genetic Analysis System User’s Guide
PN A29142-AB
Run Module
Using Direct Control
number, and adjust the number of runs and the previous cumulative days on the
instrument. Then click Done .
NOTE Note the number of runs and days on the instrument for this capillary array for reference.
Figure 3.42 Install Capillary Array Dialog Box
18. The Confirm Capillary Array Selection dialog will appear. Read it and make the selection
Yes to continue, or No to abort the capillary installation.
Removing and Replacing a Gel Cartridge/Gel Pump Plug
CAUTION Care must be exercised when installing/removing a gel cartridge due to the viscosity of the gel
mixture.
NOTE This procedure assumes that an expended gel cartridge is being replaced with a fresh gel cartridge or
that a used gel cartridge is being removed (for storage purposes) and being replaced with the gel pump plug.
1.
Select Replenish | Release Gel Cartridge from the Run Module menu bar. When the
system is ready to release the gel cartridge, the Release Gel Cartridge dialog box will be
displayed. Wait until the lead screw is completely disengaged.
2.
Open the Gel Pump/Gel Cartridge Access Cover (Figure 3.43) by gently pushing in on
the top of the cover. (The cover is spring-loaded and will pop open.)
3.
Pull on the Cartridge Locking Lever. (The barrel will swing outwards to approximately a
90° angle from its locked position.)
GenomeLab Genetic Analysis System User’s Guide
PN A29142-AB
87
Run Module
Using Direct Control
Figure 3.43 Removing/Replacing the Gel Cartridge
1. Gel Pump/Gel Cartridge Access Cover
4. Cartridge Locking Lever
2. Cartridge Locking Lever
5. Cartridge Barrel
3. Cartridge Barrel
4.
Grasp the wings of the gel cartridge/gel pump plug and pull it out of the barrel
(Figure 3.44).
NOTE Always note the lot number and the hours on the instrument for a gel cartridge if you are planning to
use it for more than one session.
5.
88
If necessary, use a tissue to wipe gel strands off of the instrument.
GenomeLab Genetic Analysis System User’s Guide
PN A29142-AB
Run Module
Using Direct Control
1
3
2
4
901603L.AI
Figure 3.44 Removing/Replacing the Gel Cartridge - Continued
1. Cartridge Wings
3. Cartridge Locking Lever (open)
2. Gel Cartridge or Gel Pump Plug
4. Cartridge Barrel
6.
Remove any air pockets from the gel cartridge by grasping the cartridge wings between
your first two fingers, and pressing the plunger with your thumb until a small amount of
gel is pushed out of the cartridge tip.
7.
Insert the new cartridge or the gel pump plug into the barrel and lock it into position by
aligning the cartridge wings with the cartridge holder and pushing in.
8.
Push the cartridge locking lever towards the back of the instrument (approximately a 90°
angle) into its locked position.
9.
Close the Gel Pump/Gel Cartridge Access Cover.
10. In the Remove Gel Cartridge dialog box (Figure 3.45):
r
Click Install Cartridge to indicate that a gel cartridge was installed.
OR
r
Click Install Plug to indicate that the gel pump plug (or empty cartridge) was
installed.
GenomeLab Genetic Analysis System User’s Guide
PN A29142-AB
89
Run Module
Using Direct Control
Figure 3.45 Remove Gel Cartridge Dialog Box
11. If Install Plug was selected in step 10, proceed to step 12.
If Install Cartridge was selected in step 10, use the Install Gel Cartridge dialog box
(Figure 3.46) to enter the following information:
a.
If you are installing a new gel cartridge, click New. The system will automatically
update the date and time installed and set the Hours on Instrument to “0.”
b.
Next, enter the lot number.
c.
If you are installing a used Gel Cartridge, select Used.
d.
r
If you are installing the previous used gel cartridge, do not change the lot
number, or the hours on the instrument, as they will be correct.
r
If you are installing a previously used gel cartridge, but it was not the last one
on the instrument, enter its part number and/or lot number, and adjust the
hours to properly reflect the hours this cartridge has been on the instrument.
Click Done on the Install Gel Cartridge dialog.
NOTE Always note the lot number and the hours on the instrument for a gel cartridge if you are planning to
use it for more than one session. The lot number is an alphanumeric text box for your own identification
purposes.
90
GenomeLab Genetic Analysis System User’s Guide
PN A29142-AB
Run Module
Using Direct Control
Figure 3.46 Install Gel Cartridge Dialog Box
12. Dispose of the used tissue and spent gel cartridge in accordance with the procedure,
"Maintenance and Diagnostics" on page 343.
Removing the Manifold Plug
The Manifold Plug is installed during shipping and when the instrument is not in use, to
prevent the gel from drying.
NOTE This procedure assumes that the Manifold Plug is being removed in preparation for Capillary Array
installation.
1.
Select Replenish | Release Capillary Array from the Run Module main menu.
2.
Wait for the Remove Manifold Plug dialog box to appear.
3.
Open the Sample Access Cover (Figure 3.27) and lift it to the vertical locking position.
4.
Open the Capillary Access Cover and lift it to the vertical locking position.
5.
Unlatch the two rubber latches holding the Capillary Temperature Control Cover and lift
it to the vertical locking position (Figure 3.47).
6.
Loosen the Manifold Access Cover captive screw, remove the cover and set it aside.
GenomeLab Genetic Analysis System User’s Guide
PN A29142-AB
91
Run Module
Using Direct Control
Figure 3.47 Manifold Access Cover
1. Capillary Temperature Control Cover 4. Captive Screw
2. Plenum Assembly
5. Manifold Access Cover (removed)
3. Manifold Access Cover
92
7.
Lift the Eject Lever to release the Manifold Plug.
8.
Grasp the Manifold Plug tab (Figure 3.48) and then:
a.
Pull the plug approximately one inch out of the manifold.
b.
Touch the tip of the plug to the bottom of the Optics Base Plate.
c.
Hold and wait five seconds for the gel strand to dry.
d.
Pull the plug out and set it aside for future use.
e.
Wipe gel strands off of the instrument using a damp tissue.
GenomeLab Genetic Analysis System User’s Guide
PN A29142-AB
Run Module
Using Direct Control
1
2
3
4
5
6
901597L.AI
Figure 3.48 Removing the Manifold Plug
9.
1. Guide Pins
4. Gel Strand
2. Eject Lever
5. Optics Base Plate
3. Array Fitting
6. Array Fitting
Click OK on the Remove Manifold Plug dialog box.
10. To install the capillary array, see "Removing and Replacing the Capillary Array" on page
81.
GenomeLab Genetic Analysis System User’s Guide
PN A29142-AB
93
Run Module
Using Direct Control
94
GenomeLab Genetic Analysis System User’s Guide
PN A29142-AB
Sequence Analysis
Sequence Analysis Module Overview
4Sequence Analysis
This chapter provides an overview of the Sequence Analysis module, including its menu
options, toolbars, and dialog boxes. It shows you how to use this module to run a sequence
analysis, and to set up its parameters, result properties, and display options. It also describes
how to work with, report, and export sequence analysis results.
4.1
Sequence Analysis Module Overview
View, analyze, compare, edit, and print data of the following types:
r
Raw Data*
r
Current Data*
r
Voltage Data*
r
Analyzed Data
r
Base Sequences
r
Optical Scan Data*
r
Baseline Data*
r
Quality Parameters*
* These types of data cannot be edited.
This module accepts raw data and analyzed data. Editing and re-analysis functions enable you
to verify the accuracy of the base calls. You can also export these data to third-party packages
for further analysis.
Main Window
The following illustration identifies the areas on the Sequence Analysis module’s main
window that are described in Table 4.1.
GenomeLab Genetic Analysis System User’s Guide
PN A29142-AB
95
Sequence Analysis
Sequence Analysis Module Overview
Figure 4.1 Main Window, Sequence Analysis Module
The following table describes the items called out in Figure 4.1.
Table 4.1 Main Window, Sequence Analysis Module
Item
96
Description
A
Title Bar - Shows the module name (Sequence Analysis) and the currently active sample.
B
Menu Bar - See "Menu Bar Options" on page 97.
C
Toolbar - See "Toolbar Icons" on page 106.
D
Display Area - Graphically displays the opened data.
E
Double-clicking on a base sequence text letter (A, C, G, T) in the Dye Colors toolbar opens
the Color dialog box, which you can use to change the dye color displayed for the selected
dye.
GenomeLab Genetic Analysis System User’s Guide
PN A29142-AB
Sequence Analysis
Sequence Analysis Module Overview
Table 4.1 Main Window, Sequence Analysis Module
Item
F
Description
Analyzed Data - Displays the data that has been analyzed for the active sample.
Base SequenceDisplays a text view of the bases from the analyzed data for the active
sample.
Raw Data - Displays the raw data for the active sample.
Current - Displays the current data for the active sample.
Voltage - Displays voltage data for the active sample.
Compare Data - Compare the active analyzed data set against another analyzed data set.
Quality Parameters - Displays a graphical representation of the quality values for the active
sample.
G
Sample Plate - Enable the Sample Plate toolbar using the View | Toolbars option (shown as
in Undocked mode). Use this dialog box to select the samples to open or export.
Menu Bar Options
The following example shows the Sequence Analysis module’s menu bar.
The following topics describe each of these menus and their options.
GenomeLab Genetic Analysis System User’s Guide
PN A29142-AB
97
Sequence Analysis
Sequence Analysis Module Overview
File Menu
Click the File menu to display its drop-down menu, as shown in the following example.
Use the File menu to open, save, import, export, and print data and to set preferences. The
following table describes the Sequence Analysis module’s File menu options.
Table 4.2 File Menu, Sequence Analysis Module
Option
98
Description
Open
Open Sample Data, Sequence Analysis Parameters, Optical Scan Data, Sequence
Results, and Sample Plate Results.
Close
Closes the open sample.
Close Tab
Closes the active tab.
Save
Saves existing data.
Save As
Save data to a new name.
Import
Locate and select data to import. The system can import data in Standard
Chromatogram Format (*.scf) or Electropherogram Sample Data (*.esd) format.
GenomeLab Genetic Analysis System User’s Guide
PN A29142-AB
Sequence Analysis
Sequence Analysis Module Overview
Table 4.2 File Menu, Sequence Analysis Module
Option
Export
Description
Export data in one of the following formats:
r
Standard Chromatogram Format Ver 3.00 (*.scf)
r
Standard Chromatogram Format Ver 2.10 (*.scf)
r
Tab Delimited ASCII Text (*.txt)
r
SEQ Sequence Text (*.seq)
r
FASTA and Quality (*.fasta)
r
PHRED and SCF (*.scf.phd.1)
r
ESD (*.esd)
r
CEQ (*.cq*)
Export from Plate
Opens or exports samples from a specific sample plate. To select multiple samples,
press the Shift key while selecting samples. (The Sample Plate toolbar must be
open to use this menu option.)
Preferences
Used to:
r
View or change the panes displayed when you first open a sample.
r
Show the Report Format dialog box selecting File| Print Report.
r
Open all associated results that belong to a sample when a samples is
opened.
r
Open/export the most recent results from a sample plate.
r
Show the Analysis Log during analysis.
r
Print the entire desktop.
r
Print the application window, including all toolbars.
r
Print only the displayed panes.
r
Select audio playback speed.
Properties
View the general properties of the currently selected item. You can view the item
type, database, and project where the item resides, as well as the date and time the
item was last modified.
You may also view the sample name, sample plate, sample position in the sample
plate, the instrument, and the operator name.
You can also view the Property Set, run Method, Analysis, Alignment,
Consumables and Note of the currently selected sample.
Report
Format
Specify the format of the report to be generated for the active sample.
Print Preview
Displays a facsimile of a hardcopy printout of the selected sample plate.
Print Report
Prints the report.
Print Selected Pane
Prints the selected pane.
Print
Desktop
Prints the desktop, application, or main window as defined in the Preferences
dialog box.
Recent Objects
Lists the most recently opened objects. The first set of four is sample data and the
second set of four is sequence results.
Exit
Closes the Sequence Analysis module.
GenomeLab Genetic Analysis System User’s Guide
PN A29142-AB
99
Sequence Analysis
Sequence Analysis Module Overview
Edit Menu
Click the Edit menu to display its drop-down menu, as shown in the following example.
The following table describes the Sequence Analysis module’s Edit menu options.
Table 4.3 Edit Menu, Sequence Analysis Module
Option
100
Description
Undo
Cancels the last action performed.
Redo
Reverses the last undo action.
Cut
Cuts selected bases and copies them to the clipboard. To
activate/inactivate this function, select Tools | Edit. See "Tools Menu" on
page 102.
Copy
Copies selected bases to the clipboard.
Paste
Inserts one or more copied or cut bases from the clipboard to the
selected text position. To activate/inactivate this function, select Tools |
Edit. See "Tools Menu" on page 102.
Apply Quality-based Trimming
Commits to the quality-based trimming.
Apply Sequence-based
Trimming
Commits to the sequence-based trimming.
Audio Enable
Toggles between enabling or disabling audio. If enabled while in Edit
mode, the system audibly announces each letter as you type a base
letter.
Audio Playback
Audibly announces a series of selected base sequence text.
GenomeLab Genetic Analysis System User’s Guide
PN A29142-AB
Sequence Analysis
Sequence Analysis Module Overview
View Menu
Click the View menu to display its drop-down menu, as shown in the following example.
NOTE A " " next to an option indicates that the option is enabled.
The following table describes the Sequence Analysis module’s View menu options.
Table 4.4 View Menu, Sequence Analysis Module
Option
Description
Toolbars
Used to select which toolbars to display. Select () the options that identify the
toolbars you want displayed. To hide a toolbar, clear its check box. See "Toolbar Icons"
on page 106.
Status Bar
Toggles between displaying or not displaying the status bar.
Analyzed Data
Displays the data that has been analyzed for the active sample.
Base Sequence
Displays a text view of the bases from the analyzed data for the active sample.
Raw Data
Displays the raw data for the active sample.
Current
Displays the current data for the active sample.
Voltage
Displays voltage data for the active sample.
Alignment
Displays the alignment data for the active sample.
Alignment
Accuracy
Displays the alignment accuracy data for the active sample.
Quality
Parameters
Shows a graphical representation of the quality values for the active sample.
Trimming
Report
Toggles the trimming report pane on or off.
Parameters
Used to
Compute
Sequence
Displays the sequence analysis parameters used to produce the analyzed data. This
dialog box provides the same information displayed when editing these parameters;
however, the fields in this dialog box are read-only, and are not editable. This item is
not available for data that has not yet been analyzed. For parameter descriptions, see
"Editing Sequence Analysis Parameters" on page 116 or click Help when using the
dialog box.
GenomeLab Genetic Analysis System User’s Guide
PN A29142-AB
101
Sequence Analysis
Sequence Analysis Module Overview
Table 4.4 View Menu, Sequence Analysis Module
Option
Description
Run Log
Displays the messages received from the instrument during the sample run.
Working
Database
Displays the name of the database in use.
Tools Menu
Click the Tools menu to display its drop-down menu, as shown in the following example.
NOTE A " " next to an option indicates that the option is enabled.
The following table describes the Sequence Analysis module’s Tools menu options.
Table 4.5 Tools Menu, Sequence Analysis Module
Option
102
Description
Zoom
Magnifies a specific area of data in the display.
Pan
Moves analyzed data in the X and Y direction.
Align
Visually align bases and peaks in the analyzed data pane.
Edit
Insert, change, and/or delete bases.
Unzoom
Undoes one zoom level.
Unzoom All
Undoes all zoom levels.
Autoscale
Scales data to the confines of the pane. If autoscaling is disabled, the system
scales the data to their true values. Use this item to turn autoscaling on or off.
Base Spacing
Sets the space between base sequence text in groups of 0, 3, 5, or 10.
Base Synch
With both the analyzed data and base sequence panes open, synchronizes the
analyzed data display with the highlighted base sequence text, showing the
corresponding peak or peaks between two hairlines for the selected base.
Bases on Top
Toggles the base sequence text between displaying on the top or bottom in the
analyzed data pane.
Compare
Selects an analyzed data set to compare to the current analyzed data set.
GenomeLab Genetic Analysis System User’s Guide
PN A29142-AB
Sequence Analysis
Sequence Analysis Module Overview
Table 4.5 Tools Menu, Sequence Analysis Module
Option
Description
Compare Synch
Synchronizes scaling, zooming, and panning of two analyzed data sets while in the
Compare mode.
Align Compare
Views
Aligns selected points of each of the displayed analyzed data sets while in the
Compare mode.
Display Options
Opens the Display Options dialog box, which provides tabs used to modify any or
all of the following parameters: Title, X Axis Options, Y Axis Options, Dye Traces,
Current Traces, Colors, and Quality Parameters. For details, see "Setting or
Changing Display Options" on page 145 or click Help when using the dialog box.
Heterozygote
Display Color
Opens the Colors dialog box, which you can use to change the color of the
heterozygotes in the base sequence pane. For details, see "Changing Display
Colors" on page 147.
Analysis Menu
Click the Analysis menu to display its drop-down menu, as shown in the following example.
The following table describes the Sequence Analysis module’s Analysis menu options.
Table 4.6 Analysis Menu, Sequence Analysis Module
Option
Description
Analyze
Analyze active sample data or reanalyze existing sequence results. Selecting this
option opens the current Working Parameters dialog box. Click OK to start the
analysis.
Stop
Terminates the analysis currently in progress.
GenomeLab Genetic Analysis System User’s Guide
PN A29142-AB
103
Sequence Analysis
Sequence Analysis Module Overview
Table 4.6 Analysis Menu, Sequence Analysis Module
Option
104
Description
Working Analysis
Parameters
View and change the analysis parameters to be used for subsequent analyses. For
details, see "Editing Sequence Analysis Parameters" on page 116.
Restore Original
Base Sequence
Returns analyzed data displays and base sequence text back to their original states
(losing all edits).
Batch Analysis
Analyze multiple sample data or sample plate results sequentially. Selecting this
option opens the following dialog box. For details, see "Performing a Batch
Analysis" on page 148.
Reanalyze Batch
After performing a batch analysis, use this option to perform the analysis again.
For details, see "Reanalyzing a Batch" on page 149.
View Selected Batch
Sample Result
After performing a batch analysis, use this option to view the results of a selected
sample in the upper pane of the batch analysis window.
Skip
Current Sample
While performing a batch analysis, use this option to pass over the sample
currently being analyzed. (This item is not available if Sample Plate Results
was selected from the Batch Analysis Selection dialog box.)
Skip
Current Sample Set
While performing a batch analysis, use this option to pass over the sample set
currently being analyzed. (This item is not available if Sample Data was selected
from the Batch Analysis Selection dialog box.)
Skip
Current Sample
Plate
While performing a batch analysis, use this option to pass over the sample plate
currently being analyzed. (This item is not available if Sample Data was selected
from the Batch Analysis Selection dialog box.)
Pause After
Current Sample
Momentarily stops a batch analysis after the system analyzes the currently
running sample. Use Resume Batch Processing to continue the analysis.
Resume Batch
Processing
Resumes a batch analysis after it has been paused.
Third Party Analysis
Launches the third-party analysis package specified in the Third Party Analysis
Setup dialog box.
Third Party Analysis
Setup
Specifies the path, third-party analysis package (loaded on your PC), and the
export format of the data.
Service Alignment
Used to:
r
Align the sequence against puc18dG.
r
Print the alignment report.
r
Export the alignment data (as a text file).
Align with Template
Performs an alignment of the sequence against the current alignment settings.
Batch Alignment
Performs a batch alignment.
Trim Based on
Quality
Opens the Current Working Parameters dialog box. Click Edit to open the
Quality-based Trimming tab.
Trim Based on
Sequence
Opens the Current Working Parameters dialog box. Click Edit to open the
Sequence-based Trimming tab in the Sequence Analysis Parameters Editor.
Batch Trim
Opens the Batch Trimming dialog box.
GenomeLab Genetic Analysis System User’s Guide
PN A29142-AB
Sequence Analysis
Sequence Analysis Module Overview
Window Menu
Click the Window menu to display its drop-down menu, as shown in the following example.
The following table describes the Sequence Analysis module’s Window menu options.
Table 4.7 Window Menu, Sequence Analysis Module
Option
Description
Cascade
Cascades the open windows.
Tile Horizontally
Tiles the windows in a horizontal orientation.
Tile Vertically
Tiles the windows in a vertical orientation.
Close All
Closes any currently active windows.
Arrange Icons
Automatically arranges the icons.
Help Menu
Click the Help menu to display its drop-down menu, as shown in the following example.
The following table describes the Help menu options.
Table 4.8 Help Menu, Sequence Analysis Module
Option
Description
Help Topics
Select this option to display the CE system online help. By default, the help system
displays the Contents in the navigation pane, located on the left, and the
introductory topic in the topic pane, located on the right. You can use the Contents
to select and print specific help topics. The navigation pane also provides a Search
tab and an Index tab. These tabs let you search for information by topic, index entry,
and/or keyword.
Using Help
Select this option to display the Contents window on how to use the Windows Help
system.
About GenomeLab
System
Select this option to access software, instrument, and system information.
Beckman Coulter
Home Page
Select this option to access the Beckman Coulter Home Page on the Internet.
GenomeLab Genetic Analysis System User’s Guide
PN A29142-AB
105
Sequence Analysis
Sequence Analysis Module Overview
Toolbar Icons
The Sequence Analysis module provides seven toolbars: (1) Standard, (2) Data, (3) Sample
View, (4) Sequence Dye Colors, (5) Batch Control, (6) Sample Plate and (7) Base Sequence.
Each icon on these toolbars corresponds to a commonly used menu item. By default, all
toolbars (except Sample Plate and Base Sequence) are displayed when you first open the
Sequence Analysis module.
The following tables describe the function of each of the toolbar icons.
Standard Toolbar
The following example shows the Sequence Analysis module’s Standard toolbar. For
descriptions of the actions that occur when you click a toolbar icon, see Table 4.9.
Figure 4.2 Standard Toolbar, Sequence Analysis Module
Table 4.9 Standard Toolbar, Sequence Analysis Module
Icon
Description
Open - Opens data files, including: Sample Data, Sequence Analysis Parameters, Optical Scan
Data, Sequence Results, and Sample Plate Results.
Save - Saves existing data.
Print - Prints the report.
Print Preview - Displays a facsimile of a hardcopy printout of the selected sample plate.
Print Desktop - Prints the desktop, application, or main window as defined in the Preferences
dialog box.
Cut - Cuts selected bases from the selected position and copies them to the clipboard.
Copy - Copies selected bases to the clipboard.
Paste - Inserts one or more copied or cut bases to the selected text position.
Undo - Undoes the last action performed.
Redo - Redoes the last undo action.
Apply Quality-based Trimming - Commits to the quality-based trimming.
Apply Sequence-based Trimming - Commits to the sequence-based trimming.
Audio Enable - Toggles between enabling or disabling audio. When this option is enabled in Edit
mode, the system audibly announces each base letter typed.
106
GenomeLab Genetic Analysis System User’s Guide
PN A29142-AB
Sequence Analysis
Sequence Analysis Module Overview
Table 4.9 Standard Toolbar, Sequence Analysis Module
Icon
Description
Audio Playback - Audibly announces a series of selected base sequence text.
Working Analysis Parameters - View and/or change the analysis parameters to be used for
subsequent analyses.
Analyze - Analyze active sample data or reanalyze existing sequence results. Selecting this option
opens the current Working Parameters dialog box. Click OK to start the analysis.
Stop - Terminates the analysis currently in progress.
Trim Based on Quality - Performs a trim based on quality.
Trim Based on Sequence - Performs a trim based on a sequence.
Restore Original Base Sequence - Returns analyzed data display and base sequence text back to
its original state (losing all edits).
Third Party Analysis - Opens the third-party analysis package specified in the Third Party Analysis
Setup dialog box.
Align - Performs an alignment of the sequence against the current alignment settings.
Base Sequence Toolbar - Displays the base sequence toolbar that allows you to search for text and
ambiguity codes.
View Sample Plate Toolbar - Displays the sample plate toolbar that allows you to select the
samples to open or export.
Heterozygote Backward Search - Search backwards for heterozygotes in the base sequence text
pane.
Heterozygote Forward Search - Search forward for heterozygotes in the base sequence text pane.
Help Topics - Displays the CE system online help. By default, the help system displays the
Contents in the navigation pane, located on the left, and the introductory topic in the topic pane,
located on the right. You can use the Contents to select and print specific help topics. The
navigation pane also provides a Search tab and an Index tab. These tabs let you search for
information by topic, index entry, and/or keyword.
Context-Sensitive Help - Click this icon and then on a menu item to open the Help file related to
the selection.
GenomeLab Genetic Analysis System User’s Guide
PN A29142-AB
107
Sequence Analysis
Sequence Analysis Module Overview
Data Toolbar
The following example shows the Sequence Analysis module’s Data toolbar. For descriptions
of the actions that occur when you click a toolbar icon, see Table 4.10.
Figure 4.3 Data Toolbar, Sequence Analysis Module
Table 4.10 Data Toolbar, Sequence Analysis Module
Icon
Description
Zoom Mode - Magnifies a specific area of data in the display.
Pan Mode - Move analyzed data in the X and Y direction.
Align Mode - Visually aligns bases and peaks in the analyzed data pane.
Edit Mode - Insert, change, and/or delete bases.
Unzoom - Zoom out one level.
Unzoom All - Zoom out all levels.
Autoscale - Scales data to the confines of the pane. If autoscaling is disabled, the data is scaled to
its true values. Use this item to turn autoscaling on or off.
Base Spacing - Sets the space between base sequence text in groups of 0, 3, 5, or 10.
Base Synch - With both the analyzed data and base sequence panes open, synchronizes the
analyzed data display with the highlighted base sequence text showing the corresponding peak or
peaks between two hairlines for the selected base.
Bases on Top - Toggles the base sequence text between displaying on the top or bottom in the
analyzed data pane.
Compare Synch - Synchronizes scaling, zooming, and panning of two analyzed data sets while in
the Compare mode.
Align - Aligns selected points of each of the displayed analyzed data sets while in the Compare
mode.
Display Options - Opens the Display Options dialog box.
108
GenomeLab Genetic Analysis System User’s Guide
PN A29142-AB
Sequence Analysis
Sequence Analysis Module Overview
Sample View Toolbar
The following example shows the Sequence Analysis module’s Sample View toolbar. For
descriptions of the actions that occur when you click a toolbar icon, see Table 4.11
Figure 4.4 Sequence Analysis Module, Sample View Toolbar
Table 4.11 Sample View Toolbar, Sequence Analysis Module
Icon
Description
Analyzed Data - Displays the data that has been analyzed for the active sample.
Base Sequence - Displays a text view of the bases from the analyzed data for the active
sample.
Raw Data - Displays the raw data for the active sample.
Current - Displays the current data from the capillary arrays for the active sample.
Voltage - Displays the voltage data from the instrument for the active sample.
Compare Data - Compare the active analyzed data set against another analyzed data set.
Quality Parameters - Displays a graphical representation of the quality values for the active
sample.
Dye Colors Toolbar
The following example shows the Sequence Analysis module’s Dye Colors toolbar. For
descriptions of the actions that occur when you click a toolbar icon, see Table 4.12.
Figure 4.5 Sequence Analysis Module, Dye Colors Toolbar
GenomeLab Genetic Analysis System User’s Guide
PN A29142-AB
109
Sequence Analysis
Sequence Analysis Module Overview
Table 4.12 Dye Colors Toolbar, Sequence Analysis Module
Icon
Description
A:
(red)
Red is the default color assigned to the Adenine (A:) nucleotide bases in the analyzed data
pane.
C:
(black)
Black is the default indicator assigned to the Cytosine (C:) nucleotide bases in the analyzed
data pane.
G:
(green)
Green is the default color assigned to the Guanine (G:) nucleotide bases in the analyzed
data pane.
T:
(blue)
Blue is the default color assigned to the Thymine (T:) nucleotide bases in the analyzed data
pane.
N:
(gray)
Gray is the default color assigned to ambiguous nucleotide bases in the analyzed data
pane.
Batch Control Toolbar
The following example shows the Sequence Analysis module’s Batch Control toolbar. For
descriptions of the actions that occur when you click a toolbar icon, see Table 4.13.
Figure 4.6 Sequence Analysis Module, Batch Control Toolbar
Table 4.13 Batch Control Toolbar, Sequence Analysis Module
Icon
Description
Batch Analysis - Analyze multiple sample data or sample plate results sequentially.
Batch Alignment - Select sequence results or sample plate results to align.
Batch Trimming - Trims multiple sample data or sample plate results sequentially.
Reanalyze Batch - After performing a batch analysis, use this option to perform a new
analysis on the same data set.
Stop Analysis - Terminates the analysis currently in progress.
Pause - Momentarily stops a batch analysis after the currently running sample has been
analyzed. Use Resume Batch Processing to continue the analysis.
Resume - Resumes a batch analysis after it has been paused.
Skip Sample - While performing a batch analysis, click this icon to pass over the sample
currently being analyzed. (This item is not available if Sample Plate Results was selected
from the Batch Analysis Selection dialog box.)
110
GenomeLab Genetic Analysis System User’s Guide
PN A29142-AB
Sequence Analysis
Sequence Analysis Module Overview
Table 4.13 Batch Control Toolbar, Sequence Analysis Module
Icon
Description
Skip Set - While performing a batch analysis, click this icon to pass over the sample set
currently being analyzed. (This item is not available if Sample Data was selected from the
Batch Analysis Selection dialog box.)
Skip Plate - While performing a batch analysis, click this icon to pass over the sample plate
currently being analyzed. (This item is not available if Sample Data was selected from the
Batch Analysis Selection dialog box.)
View Results - After performing a batch analysis, click this icon to view the results of a
selected sample in the upper pane of the Batch Analysis window.
Sample Plate Toolbar
To display the Sample Plate toolbar, select View | Toolbars, then select the Sample Plate check
box, as shown in the following example.
Figure 4.7 Sequence Analysis Module, Sample Plate Toolbar
Use this toolbar to specify the samples to open or export. Select the desired plate from the
Plate drop-down list. Valid samples appear as filled wells. Wells not specified as samples
appear dark or empty. Click on the samples to open or export.
r
To view the name of a sample and associated result, position the cursor over the sample.
The sample and result names appear in the Sample and Result text boxes.
r
To select contiguous samples, click on the first sample in the series, hold down the Shift
key, then click on the last sample in the series. The selected samples are highlighted.
GenomeLab Genetic Analysis System User’s Guide
PN A29142-AB
111
Sequence Analysis
Sequence Analysis Module Overview
Base Sequence Toolbar
To display the Base Sequence toolbar, select View | Toolbars, then select the Base Sequence
check box, as shown in the following example.
Figure 4.8 Sequence Analysis Module, Base Sequence Toolbar
Use this dialog box to search for specific base sequences and to view quality parameters. Enter
the desired string of bases and click the arrow buttons to search backwards and forwards
through the base sequence text.
To use regular expressions to locate the desired text, use the characters described in
Table 4.14.
Table 4.14 Characters Used in Expressions
Character
112
Description
|
The pipe character (|) allows either expression on its side to match the target string.
The expression "a|b" will match ‘a’ as well as ‘b’.
.
The dot (.) will match any character.
*
The asterisk (*) indicates that the character to the left of the asterisk in the expression
should match 0 or more times.
+
The plus (+) is similar to the asterisk but there should be at least one match of the
character to the left of the + sign in the expression.
?
The question mark (?) matches the character to its left 0 or 1 times.
[]
Brackets ([ and ]) enclosing a set of characters indicates that any of the enclosed
characters may match the target character.
r
To search for the text regardless of case, select the Ignore Case check box ().
r
To search for the exact match for text (not the IUB codes), select the Exact Match check
box ().
r
To search for text within a range, highlight the range of interest in the base sequence
pane and select the Search Highlighted Range check box ().
GenomeLab Genetic Analysis System User’s Guide
PN A29142-AB
Sequence Analysis
Sequence Analysis Module Overview
The following table identifies the IUB codes you can enter to find the corresponding bases
when the Exact Match check box is clear.
Table 4.15 IUB Codes
IUB
Bases
N
G, A, T, or C
V
G, A, or C
B
G, T, or C
H
A, T, or C
D
G, A, or T
K
G or T
S
G or C
W
A or T
M
A or C
Y
C or T
R
A or G
GenomeLab Genetic Analysis System User’s Guide
PN A29142-AB
113
Sequence Analysis
Using the Sequence Analysis Module
4.2
Using the Sequence Analysis Module
Run a sequence analysis, and set up its parameters, result properties, and display options,
then work with, report, and export sequence analysis results.
Click the Sequence Analysis icon:
Viewing Sample Data
To view sample data:
1.
Click on Sequence Analysis, then select File | Open . The Open dialog box opens, as shown
below:
Figure 4.9 Open Dialog Box
114
2.
Select the appropriate tab (Sample Data, Sample Plate Results, Sequence Results,
Sequence Analysis Parameters, or Optical Scan Data).
3.
Select the desired item from the list box, then click OK .
4.
Use the Sample View toolbar icons to display the desired data.
GenomeLab Genetic Analysis System User’s Guide
PN A29142-AB
Sequence Analysis
Using the Sequence Analysis Module
The following table describes each tab in the Open dialog box.
Table 4.16 Open Dialog Box Tabs, Sequence Analysis Module
Tab
Description
Sample Data
Displays the list of raw data and baseline data stored in the selected project. On
the right-hand side of the list box you may view the date and time the sample
was run. You may want to open a raw data set to analyze it.
Sequence Results
Displays the list of analyzed data that resides in the selected project. On the
right-hand side of the list box you may view the date and time the sample was
run as well as the raw data from which the sequence result was derived.
Sequence data consists of analyzed data and its base sequence text. When you
open sequence data you may also view the associated raw data, current, and
voltage. This option is available for sequence analysis only.
To filter the list, select the Enable check box () and enter the Start and End
dates for the items you wish to view. Click Refresh to view the filtered results.
Sample Plate Results
Displays the list of sample plates run in the selected project. Selecting a
sample plate result displays the Sample Plate toolbar. Click on the desired
samples, then click Open. The desired samples open.
Sequence Analysis
Parameters
Displays the Sequence Analysis Parameters saved in the project. The
Sequence Analysis Parameter Set determines the start and end times for the
analysis of raw data, the threshold above which data are considered peaks, the
data start criteria, the heterozygote detection parameters, and the alignment
template and parameters. You may also edit sequence analysis parameters
under the Analysis tab in the Sample Setup module.
Optical Scan Data
Lists the alignment optical scan data available in the selected project. Optical
scan data are the result of the two lasers scanning the capillaries to determine
the position of the capillary windows where the lasers focus when collecting
data. If the scan is successful, eight peaks appear for each laser, denoting that
all eight capillary windows were established.
See Table 4.11, Sample View Toolbar, Sequence Analysis Module, for more information on
the Sample View Toolbar descriptions.
GenomeLab Genetic Analysis System User’s Guide
PN A29142-AB
115
Sequence Analysis
Using the Sequence Analysis Module
Editing Sequence Analysis Parameters
The Sequence Analysis Parameters Editor dialog box consists of six tabs: General, Initial Data
Detection, Heterozygote Detection, Quality-based Trimming, Sequence-based Trimming, and
Alignment Reference.
To edit the Sequence Analysis Parameters:
1.
Select Analysis | Working Analysis Parameters to open the Working Parameters dialog
box.
2.
Click Edit . The Sequence Analysis Parameters Editor dialog box opens, as shown below.
Figure 4.10 Sequence Analysis Parameters Editor Dialog Box
3.
4.
Use the tabs on this dialog box to make appropriate changes. For parameter descriptions,
see the following topics:
r
"General Tab" on page 116
r
"Initial Data Detection Tab" on page 118
r
"Heterozygote Detection Tab" on page 119
r
"Alignment Reference Tab - Sequence Analysis Parameters Editor" on page 121
r
"Quality-based Trimming Tab" on page 124
r
"Using Sequence-based Trimming" on page 125
Click Save As to create a new Sequence Analysis Parameter name or click OK to save the
changes and exit the editor.
General Tab
Use the General tab of the Sequence Analysis Parameters Editor dialog box to specify the
parameters used to perform the basecalling operation on the desired samples, whether or not
you are performing an alignment.
NOTE If you opened this dialog box by selecting View | Parameters Used to Compute Sequence, this dialog
box displays the analysis values, but disables the fields described below.
116
GenomeLab Genetic Analysis System User’s Guide
PN A29142-AB
Sequence Analysis
Using the Sequence Analysis Module
The following table describes the options available on the Sequence Analysis Parameters General tab.
Table 4.17 General Tab, Sequence Analysis Parameters Editor
Option
N Threshold
Analysis Start/Stop
Description
Specifies the value for the threshold below which N’s are substituted for called
bases. Enter the desired value in the N Threshold text box. The range is 0.00 to
1.00. For example, entering:
r
1.00 calls all bases as indeterminate (N’s).
r
0.50 calls all bases with an estimated error of probability of greater than
50% as N’s.
r
0.00 does not call any N’s.
r
0.60 is recommended (called bases with an estimated error probability of
greater than 40% will be called N’s).
Enter the time in minutes from the start of the raw data where the analysis is to
begin, and the time in minutes from the start of the raw data where the analysis is
to end.
r
Start: The default value of "0" for the start time uses the system algorithm to
find the start of valid data and the values entered under the Initial Data
Detection tab.
r
Stop: The default value of "0" for the stop time analyzes to the end of
collected raw data.
PCR Product
Selecting this check box () causes analysis to end when a sudden drop off of
signal lasting at least two minutes is encountered. This prevents the analysis of
baseline data.
<200 Bases
Signifies that the sequences generated from PCR are less than 200 nucleotides in
length. Selecting this check box () changes the default values for the Delay and
Minimum Duration on the Initial Data Detection tab. The default value for Delay is
0.20 minutes and the default value for Minimum Duration is 2.00 minutes.
NOTE This option is available only when PCR Product is selected.
Use Default Mobility
Calib.
Select this check box () to optimize the analysis results of most short PCR
products. This stabilizes the data adjustment that accounts for the difference in
mobility of fragments due to their respective dye labels. This differential mobility
has the greatest effect on the shorter fragments and has to be accounted for in the
analysis of data that includes short fragments.
NOTE This option is automatically selected when <200 Bases is selected, which is
recommended.
Pre-peak Reduction
GenomeLab Genetic Analysis System User’s Guide
PN A29142-AB
Select this check box () if you want the software to identify and reduce the
inclusion of "pre-peaks" in the analyzed data. Pre-peaks are artifacts that may
appear one base prior to the significant peak. They are usually caused by including
primers that are not full-length in the sequencing reaction. Sometimes they are
caused by slippage of the enzyme during the extension reaction in which case the
pre-peaks are often found starting near the end of a series of the same base.
117
Sequence Analysis
Using the Sequence Analysis Module
Table 4.17 General Tab, Sequence Analysis Parameters Editor
Option
Color
Description
Click this button to view the color calibration for the analysis parameters. The
Color Calibration dialog box opens. The values in the matrix show the cross talk
between the filters and the emissions for A, C, G, and T.
If you want to select another color calibration, click Select Stored Color
Calibration, select the new color calibration, then click OK. The name of the
selected color calibration appears in the field.
Informational
Display
The lower section of this dialog box displays specific features that are
enabled/disabled from other tabs. To change these settings, select the appropriate
tab and edit the feature.
Initial Data Detection Tab
Use the Initial Data Detection tab of the Sequence Analysis Parameters Editor dialog box to
enable the system to detect the start of data to be analyzed. The system attempts to detect
valid data using the system algorithm and values entered on this tab only if the Analysis Start
time on the General tab is set to “0.0”.
Figure 4.11 Initial Data Detection Tab
NOTE If you opened this dialog box by selecting View | Parameters Used to Compute Sequence, this dialog
box displays the analysis values, but disables the fields described below.
NOTE Set the Initial Data Detection parameters based on the sample cleanup method used. If the cleanup
method leaves large peaks due to unincorporated dye at the beginning of data, set the parameters to avoid
these blobs. (This makes it difficult to read to the end of the primer; however, the basecall accuracy improves
since dye peaks do not interfere with early mobility correction.) If the cleanup method tends to leave dye
peaks at the beginning of data, set the Threshold to 30 or 35 and set the Delay to 0.75. (If there are still fat
peaks at the start of analyzed data, make this a larger delay.)
NOTE If the cleanup eliminates dye peaks, you can read closer to the end of the primer by setting the
Threshold to 20, and the Delay to 0.6.
118
GenomeLab Genetic Analysis System User’s Guide
PN A29142-AB
Sequence Analysis
Using the Sequence Analysis Module
The following table describes the options available on the Sequence Analysis Parameters Initial Data Detection tab.
Table 4.18 Initial Data Detection Tab, Sequence Analysis Parameters Editor
Option
Description
Threshold
Enter the maximum ratio value of all the data in the energy profile above which the
signal must rise before the analysis starts detecting data. The data must stay
above this threshold for the minimum duration without gaps for more than 21
seconds. The range is 0 to 100%. The default is 40%.
Delay
Enter a value for the delay between the detected start of data when the data that
will be analyzed. The range is 0.00 to 180.00 minutes.
r
If <200 Bases is not checked on the General tab, the default value is 0.75
minutes.
r
If <200 Bases is checked, the default value is 0.20 minutes.
Signal to Noise
Enter the Signal to Noise value to specify the signal to noise ratio for significant
data. The range is 3.00 to 1000.00. The default value is 7.00.
Minimum Duration
Enter the value at which the signal-to-noise threshold must exceed with no gaps
greater than 21 seconds. The range is 2.00 to 50.00 minutes.
r
If <200 Bases is not checked on the General tab, the default value is 5.00
minutes.
r
If <200 Bases is checked, the default value is 2.00 minutes.
Heterozygote Detection Tab
Use the Heterozygote Detection tab of the Sequence Analysis Parameters dialog box to enable
Heterozygote detection and to specify the parameters for detecting heterozygotes. If you
enable this feature, the next analysis run detects heterozygotes and displays ambiguity codes
where appropriate.
Figure 4.12 Heterozygote Detection Tab - Sequence Analysis Parameters Editor
NOTE If you opened this dialog box by selecting View | Parameters Used to Compute Sequence, this dialog
box displays the analysis values, but disables the fields described below.
GenomeLab Genetic Analysis System User’s Guide
PN A29142-AB
119
Sequence Analysis
Using the Sequence Analysis Module
The following table describes the options available on the Sequence Analysis Parameters Heterozygote Detection tab.
Table 4.19 Heterozygote Detection Tab, Sequence Analysis Parameters Editor
Option
Description
Detect Heterozygotes
Select this check box () if you want heterozygotes detected. When selected, the
N Threshold (on the General tab) is disabled, and "N’s" will not be called.
The system detects heterozygotes after it determines the "final basecall". It detects
peaks that meet the sensitivity criterion and examines each called base to
determine if another peak nearby meets the Spacing and Height Ratio criteria
specified. If one or more nearby peaks meet the criteria, the system merges their
identities with the called base to produce an ambiguity code.
NOTE If you specify the Detect Heterozygote option, "N’s" are not called. The N
Threshold text box is grayed out to disable calling “N’s.”
% of Average Peak
Spacing
Enter a value to determine how far to look on either side of each called base to
look for other peaks. This value is centered over the peak for the called base; for
instance, a value of 50 looks 25% on either side of the peak for secondary peaks.
The range is 0-100%
Height Ratio
Enter the height ratio of the secondary peak relative to called base peak. The range
is 0-100%.
Sensitivity
Enter the value that specifies the minimum sharpness of detected secondary
peaks. The higher the value, the higher the sensitivity used to detect smaller, less
visually defined peaks. The range is 0.00 to 1.00.
Range
Enter the range in the called sequence where the system looks for heterozygotes
within a called sequence. Also provide the number of bases prior to the last called
base you want heterozygote detection to end in the case of short PCR samples
that may vary in length. The range is 0-length of the sequence.
If a value is outside of an expected range, a message box opens, requesting you to enter a valid
value. The system uses the IUB ambiguity codes shown in the following table to represent
heterozygous bases.
Table D.20 IUB Ambiguity Codes
120
Code
Definition
Mnemonic
A
Adenine
A
C
Cytosine
C
G
Guanine
G
T
Thymine
T
R
AG
puRine
Y
CT
pYrimidine
K
GT
Keto
M
AC
aMino
GenomeLab Genetic Analysis System User’s Guide
PN A29142-AB
Sequence Analysis
Using the Sequence Analysis Module
Table D.20 IUB Ambiguity Codes
Code
Definition
Mnemonic
S
GC
Strong 3 H bonds
W
AT
Weak 2 H bonds
B
CGT
Not A
D
AGT
Not C
H
ACT
Not G
V
ACG
Not T
N
AGCT
aNything
The system reports the heterozygous bases in the analyzed data and in the base sequence data.
Alignment Reference Tab
Use the Alignment Reference tab of the Sequence Analysis Parameters dialog box to enable
automatic alignment and to specify the template against which you want to align the active
sequence.
Figure 4.13 Alignment Reference Tab - Sequence Analysis Parameters Editor
NOTE If you opened this dialog box by selecting View | Parameters Used to Compute Sequence, this dialog
box displays the analysis values, but disables the fields described below.
GenomeLab Genetic Analysis System User’s Guide
PN A29142-AB
121
Sequence Analysis
Using the Sequence Analysis Module
The following table describes the options available on the Sequence Analysis Parameters Alignment Reference tab.
Table 4.21 Alignment Reference Tab, Sequence Analysis Parameters Editor
Option
Description
Perform Alignment
Select this check box () to perform an alignment automatically when running
an analysis. The alignment uses the alignment template and parameters (specified
below) and in the Advanced Alignment Parameters dialog box.
Reference
Select the desired alignment template by clicking on its corresponding radio
button (puc18dG, puc 18, or m13).
To select a different template, click Reference File. Click Browse and navigate to
the folder that contains the reference file, then select it and click OK. The text box
displays the name of the selected reference file.
Cutoff Accuracy
Enter the desired Cutoff Accuracy. The alignment detects the base number in the
called sequence at which the accuracy falls below this Cutoff Accuracy value. The
range is 0.0 to 100.0%.
Allowed N’s
Enter the percentage of N’s allowed to occur before they are counted as errors
when determining the alignment accuracy. The range is 0.0 to 100.0%.
Advanced Alignment
Parameters
Click this button to open the Advanced Alignment Parameters dialog box.
Advanced Alignment Parameters
Use the Advanced Alignment Parameters dialog box to define the Advanced Alignment
Parameters used to perform alignments with the active sequence.
Figure 4.14 Advanced Alignment Parameters Dialog Box
NOTE If you opened this dialog box by selecting View | Parameters Used to Compute Sequence, this dialog
box displays the analysis values, but disables the fields described below.
The system uses a scoring matrix to perform the alignment and displays the alignment that
produces the highest total score. In general, matches should be given higher scores than
non-matches.
122
GenomeLab Genetic Analysis System User’s Guide
PN A29142-AB
Sequence Analysis
Using the Sequence Analysis Module
The following table describes the options available on the Advanced Alignment Parameters
dialog box.
Table 4.22 Advanced Alignment Parameters, Sequence Analysis Module
Option
Alignment Scoring
Alignment Controls
GenomeLab Genetic Analysis System User’s Guide
PN A29142-AB
Description
r
Match - Sets the value of a match between a base position of the sequence and
the reference template. The range is -1000.0 to 1000.0. A value of "1" is the
default value.
r
MisMatch - Sets the value of a mismatch between a base position of the
sequence and the alignment sequence. The range is -1000.0 to 1000.0. A value
of "-2.0" is the default value.
r
Insert start - Sets the value of an insertion of a base in the sequence that does
not exist in the alignment sequence. The range is -1000.0 to 1000.0. A value of
"-4.0" is the default value.
r
Insert extend - Sets the value of a consecutive insertion of a base in the
sequence that does not exist in the alignment sequence. The range is -1000.0
to 1000.0. A value of "-3.0" is the default value.
r
Delete start - Sets the value of a deletion of a base in the sequence that does
not correspond to the alignment sequence. The range is -1000.0 to 1000.0. A
value of "-4.0" is the default value.
r
Delete extend - Sets the value of a consecutive deletion of a base in the
sequence that does not exist in the alignment sequence. The range is -1000.0
to 1000.0. A value of "-3.0" is the default value.
r
To optimize the alignment to find matching substrings first, then run the
alignment algorithm only on the bases remaining outside the substrings,
reducing execution time and storage space, select Find matching substrings
(). This check box is selected by default.
r
To use only substrings with the highest score, and ignore the rest, as opposed
to using every character from both strings to compute the similarity score,
select Find Local alignment ().
r
To specify that overhanging bases on the template or sequence will not be
counted in the alignment score, select Left Edge Free () and/or Right Edge
Free ().
r
To specify a minimum length for detected substrings, enter the number of
bases needed to constitute a substring in the Minimum substring length text
box. The range is 5 to 2000. The default value is "30".
123
Sequence Analysis
Using the Sequence Analysis Module
Quality-based Trimming Tab
Use quality-based trimming to trim poor quality data from the ends of the sequence. The
resulting base sequence and trace views display the base letters of the poor quality data as
strike through.
Figure 4.15 Quality-based Trimming Tab
The following table describes the options available on the Sequence Analysis Parameters Quality-based Trimming tab.
Table 4.23 Quality-based Trimming Tab
Option
Ends To Be Trimmed
Trimming Stringency
124
Description
Click the radio button to select the ends to be trimmed:
r
Select Both Ends to trim outside the 5' and 3' coding region.
r
Select Left (5') End to trim to the left of the 5' end.
r
Select Right (3') End to trim to the right of the 3' end.
r
Select None if you do not want to perform quality-based trimming.
Click and drag the slider control to set the quality values from low to high.
There are five possible selections ranging from Low to High that correspond
to error rate of 0.07, 0.06, 0.05, 0.03, 0.01. The default value is Medium
(5%).
GenomeLab Genetic Analysis System User’s Guide
PN A29142-AB
Sequence Analysis
Using the Sequence Analysis Module
Using Sequence-based Trimming
Apply contaminant (sequence-based) trimming. This can be done in batch analysis mode or
in sequence analysis mode. The resulting base sequence and trace views display the base
letters of the vector and other subsequences as underlined. If multiple vector or subsequences
matched, they appear as multiple underlined in the Trace View.
Figure 4.16 Sequence-based Trimming Tab
GenomeLab Genetic Analysis System User’s Guide
PN A29142-AB
125
Sequence Analysis
Using the Sequence Analysis Module
Contaminant trimming can be based on any combination of the following:
r
Vector sequences such as plasmid, BAC, PAC, and cosmids.
r
Primer sequences
r
Restriction enzyme sites
NOTE If you opened this dialog box by selecting View | Parameters Used to Compute Sequence, this dialog
box displays the analysis values, but disables the fields described below.
The following table describes the options available on the Sequence Analysis Parameters Sequence-based Trimming tab.
Table 4.24 Sequence-based Trimming Tab
Option
Perform Sequence-based
Trimming
Vector/Other Sequence
Files
Description
Select this check box () to enable sequence-based trimming.
r
Click
to select a reference sequence. It must be in the .fasta
format and stored in an accessible folder.
r
Click
to remove a previously selected reference sequence.
NOTE There is no practical limit on the number of .fasta reference sequences
used; however, larger files (greater than 200 Kbase) increase processing
time.
126
Max. # of Vector/Other
Sequences
Set the number of sequences to appear in the result. This number is
determined by the goodness of alignment by scoring the found
subsequences and displaying only the top number selected. The trimming
log details all vectors/other sequences found regardless of the score.
Min. Substring Length
Set the minimum substring length. Only the subsequences that meet or
exceed this length will be trimmed.
Distance from End
Set the distance from the end of the sequence and contaminant for automatic
removal. You may set the Left (5') independently from the Right (3') end.
Enable Internal Matches
Select this check box () to allow trimming within the sequence.
GenomeLab Genetic Analysis System User’s Guide
PN A29142-AB
Sequence Analysis
Using the Sequence Analysis Module
Performing Quality-based Trimming
Setting Up Quality-based Trimming
To setup quality-based trimming:
1.
Open the Sequence Analysis module.
2.
Open a result and select Analysis | Working Analysis Parameters .
3.
Click Edit to open the Sequence Analysis Parameters Editor.
4.
Select the Quality-based Trimming tab.
5.
Select Ends To Be Trimmed and Trimming Stringency.
6.
Click Save As and save the new parameters.
7.
Click OK .
8.
Select Analysis | Trim Based on Quality. The analysis parameters, created in the steps
above, should be listed. If not, click Use Stored Parameters and select the appropriate
analysis parameters.
9.
Click OK .
The resulting base sequence and trace views display the base letters, if poor quality, as strike
through after performing a quality-based trim.
NOTE When performing quality-based and sequence-based trimming, quality-based trimming is always
performed first.
Figure 4.17 Base Sequence and Trace Views after Quality-based Trimming
GenomeLab Genetic Analysis System User’s Guide
PN A29142-AB
127
Sequence Analysis
Using the Sequence Analysis Module
Applying Quality Trimming
If the trimming is acceptable, select Edit | Apply Quality-based Trimming to apply the
resulting base sequence and trace view.
Figure 4.18 Base Sequence and Trace Views after Quality-based Trimming – Quality-based Trimming
Applied
NOTE To recover the original sequence after performing Apply Quality-based Trimming, select Edit |
Undo.
128
GenomeLab Genetic Analysis System User’s Guide
PN A29142-AB
Sequence Analysis
Using the Sequence Analysis Module
Performing Sequence-based Trimming
Setting Up Sequence-based Trimming
To setup sequence-based trimming:
1.
Open the Sequence Analysis module.
2.
Open a result and select Analysis | Working Analysis Parameters .
3.
Click the Edit button to open the Sequence Analysis Parameters Editor.
4.
Select the Sequence-based Trimming tab.
5.
Select the Perform Sequence-based Trimming check box () and select the desired options.
6.
Click Save As and save the new parameters.
7.
Click OK .
8.
Select Edit | Trim Based on Sequence . The analysis parameters, created in the steps
above, should be listed. If not, click Use Stored Parameters and select the appropriate
analysis parameters.
9.
Click OK .
NOTE When performing quality-based and sequence-based trimming, quality-based trimming is always
performed first.
The following example shows the resulting base sequence and trace view after performing a
sequence-based trim.
Figure 4.19 Base Sequence and Trace Views after Sequence-based Trimming
GenomeLab Genetic Analysis System User’s Guide
PN A29142-AB
129
Sequence Analysis
Using the Sequence Analysis Module
Applying Sequence-based Trimming
If the trimming is acceptable, select Edit | Apply Sequence-based Trimming to remove the
trims from the sequence. The following example shows the resulting base sequence and trace
view after applying sequence-based trimming.
NOTE When applying sequence-based trimming, quality-based trimming is automatically applied first if
quality-based trimming was performed.
Figure 4.20 Base Sequence and Trace Views after Sequence-based Trimming
NOTE To recover the original sequence after performing Apply Sequence-based Trimming, select Edit
| Undo.
Internal Trimming
Select the Enable Internal Matches check box () on the Sequence-based Trimming tab to
trim subsequences from within the sequence. To exclude a subsequence from final removal,
right-click on the subsequence and select Vector/Other Subsequences | subsequence where
subsequence is the subsequence name.
130
GenomeLab Genetic Analysis System User’s Guide
PN A29142-AB
Sequence Analysis
Using the Sequence Analysis Module
NOTE The system removes only the selected subsequences from the sequence when you apply trimming.
Figure 4.21 Base Sequence and Trace Views after Sequence-based Trimming – Enable Internal Matches
GenomeLab Genetic Analysis System User’s Guide
PN A29142-AB
131
Sequence Analysis
Using the Sequence Analysis Module
After you apply sequence-based trimming, the system replaces the internal matches in the
resulting base sequence and trace view with the letter “x”, as shown in the following example.
Figure 4.22 Base Sequence and Trace Views after Sequence-based Trimming – Enable Internal Matches
Batch Trimming
Enable automatic trimming of a large number of results. To perform batch trimming:
132
1.
Open the Sequence Analysis module.
2.
Select Analysis | Batch Trimming .
3.
Select the Sequence Results or Sample Plate Results tab.
4.
Select the results to be trimmed.
GenomeLab Genetic Analysis System User’s Guide
PN A29142-AB
Sequence Analysis
Using the Sequence Analysis Module
5.
Click the right-arrow to move the selected results to the “selected” list box.
Figure 4.23 Batch Trimming Result Selection
6.
Click OK .
7.
Verify that the required analysis parameters are selected in the Working Parameters
dialog box. (If not, click Use Stored Parameters and select the appropriate analysis
parameters).
8.
If necessary, select the Export Results check box () to export the results to files. The Edit
Export Options button becomes available. For details, see "Export Options" on page
135.
9.
Click OK .
GenomeLab Genetic Analysis System User’s Guide
PN A29142-AB
133
Sequence Analysis
Using the Sequence Analysis Module
Trimming Report
Exporting results creates a Trimming Report, which you can view and print.
To view the Trimming Report, select View | Trimming Report . The new pane opens at the
bottom of the screen displaying the following details:
r
Result Name
r
Original Sequence Length
r
Length after Quality-based Trimming
r
Vector/Other Subsequence Name
r
First Base Trimmed
r
Last Base Trimmed
r
Enabled
r
Length after Sequence-based Trimming
r
Exported
From the Trimming Report pane, you can format the grid, print the grid data, and export the
data as comma separated (.csv) or tab delimited (.txt) text files.
To access these options, right-click over the Trimming Report, then select the desired option
from the pop-up menu.
The following table describes these options.
Table 4.25 Trimming Report Right-Click Menu
Option
Print Grid Data
Description
Select this option to print the entire grid as it is represented on the screen.
Export Grid Data Select this option to save the grid data as a comma separated (*.csv) or tab delimited
(*.txt) text file.
Format Grid
Select this option to open a cascading menu with formatting options, as shown in the
following example.
Use this menu to customize the look of the data grid. If you hide rows or columns using
this menu, the Print Grid Data option omits them; however, this does not affect the
Exported Grid Data (this exports all data).
134
GenomeLab Genetic Analysis System User’s Guide
PN A29142-AB
Sequence Analysis
Using the Sequence Analysis Module
Export Options
The Export dialog box provides two options you can choose when exporting sequence data,
as described in the following table.
Table 4.26 Export Options
Option
Description
Apply Trimming
If you selected the Export option during sample setup or batch analysis,
selecting the Apply Trimming option removes the trims from the
sequence before it is exported. The exported file replaces all internal
trims with the letter “x”.
Export Only If
The resulting sequence, after trimming, may be too small to be useful.
Sequence > X nt Use the Export Only If Sequence > X nt option to specify a minimum
size that the sequence must be when exporting. This exports only those
sequences greater than the set number of nucleotides.
Figure 4.24 Export Options
Editing Bases
You can edit bases displayed in the analyzed and bases data panes using the Sequence
Analysis module’s Tools menu. The system identifies edited bases by showing them in
lower-case letters.
Inserting Bases in the Analyzed Data Pane
To insert bases in the analyzed data pane:
1.
Select Tools | Edit .
2.
Click on an area between two bases. The Insert Base dialog box opens.
3.
Select the desired base.
4.
Click OK .
GenomeLab Genetic Analysis System User’s Guide
PN A29142-AB
135
Sequence Analysis
Using the Sequence Analysis Module
The screen inserts the base as a lower-case letter in both the analyzed data and the base
sequence panes.
Inserting Bases in the Base Sequence Pane
To insert bases in the base sequence pane:
1.
Select Tools | Edit .
2.
Place the mouse cursor between the two bases where you want to insert the base.
3.
Type in the new base.
The screen inserts the base as a lower-case letter in both the analyzed data and the base
sequence panes.
Changing Bases in the Analyzed Data Pane
To change bases in the analyzed data pane:
1.
Select Tools | Edit .
2.
Click on a base in the analyzed data pane. The Change Base dialog box opens.
3.
Select the desired base.
4.
Click OK .
The screen shows the changed base as a lower-case letter in both the analyzed data and the
base sequence panes.
Changing Bases in the Base Sequence Pane
To change bases in the base sequence pane:
1.
Select Tools | Edit .
2.
Highlight the bases to change in the base sequence text.
3.
Type in the new bases.
The screen shows the changed base as a lower-case letter in both the analyzed data and the
base sequence panes
NOTE The left and right arrow keys move the cursor through the data in the base sequence pane. To select
bases, hold the Shift key down while using the left and right arrow keys to select the desired bases.
Deleting Bases in the Base Sequence Pane
To delete bases in the base sequence pane:
1.
Select Tools | Edit .
2.
Highlight the bases in the base sequence text to delete.
3.
Press the Delete key (or use the Cut
icon).
The screen removes the selected bases from both the base sequence and analyzed data panes.
136
GenomeLab Genetic Analysis System User’s Guide
PN A29142-AB
Sequence Analysis
Using the Sequence Analysis Module
Specifying Base Grouping
To specify base grouping in the base sequence pane:
1.
Select Tools | Base Spacing to open the cascading menu.
2.
Select the desired group spacing.
Viewing the Analysis Log
The system logs all the steps used in performing the base-calling routine on the raw data in
the analysis log. For example, the system logs a message when it is unable to find the end of
PCR product data.
You may view the analysis log to see if the system was unable to find the end of PCR data. The
following message appears in the analysis log: “Analyzed Data: Cannot compute
stop time. Using data stop time of xxx.xx minutes”, as shown in the
following example.
Figure 4.25 Analysis Log
Occasionally, the system cannot find the end of PCR product data, even if the PCR Product
option is selected. To determine if this is the case, review the analysis log and use this
information in future analysis of the same sample.
To view the analysis log:
1.
Open the sequence results you would like to review.
NOTE If the sample data has not yet been analyzed, analyze the sample data set using the desired analysis
parameters. Select the PCR Product check box () and enter 0.0 for both the Analysis Start and Stop
times.
2.
Select View | Analysis Log to view the analysis log for the sequence result.
The analysis log appears in a pane at the bottom of the window.
GenomeLab Genetic Analysis System User’s Guide
PN A29142-AB
137
Sequence Analysis
Using the Sequence Analysis Module
Sequence Result Properties
View method, analysis, alignment, consumable, general, notes, and property set information.
To view these properties:
1.
Select File | Properties when a sequence result is open. The Properties dialog box opens.
NOTE The Alignment tab appears in this dialog box only if you have performed an alignment on the open
sequence result.
2.
Select the tab that displays the type of properties you want to view. For details, see the
following topics:
r
"General Tab" on page 138
r
"Notes Tab" on page 139
r
"Property Set Tab" on page 140
r
"Method Tab" on page 141
r
"Analysis Tab" on page 142
r
"Alignment Tab" on page 143
r
"Consumables Tab" on page 144
NOTE To view detailed descriptions while using this dialog box, click Help.
3.
When finished reviewing the properties, click Close.
General Tab
Use the General tab to view the general properties of the currently selected sequence result.
Figure 4.26 General Tab, Properties Dialog Box
View the item type, database, and project where the item resides, as well as the date and time
the item was last modified. You may also view the sample name, sample plate, sample
position in the sample plate, the instrument, and the operator name.
138
GenomeLab Genetic Analysis System User’s Guide
PN A29142-AB
Sequence Analysis
Using the Sequence Analysis Module
Notes Tab
Use the Notes tab to view the note that was entered in the Sample Setup when the sample ID
was defined. Select File | Properties | Notes.
Figure 4.27 Note Tab, Properties Dialog Box
GenomeLab Genetic Analysis System User’s Guide
PN A29142-AB
139
Sequence Analysis
Using the Sequence Analysis Module
Property Set Tab
Use the Property Set tab to view the selected property set that was entered in the Sample
Setup when the sample ID was defined. Select File | Properties | Property Set.
Figure 4.28 Property Set Tab, Properties Dialog
140
GenomeLab Genetic Analysis System User’s Guide
PN A29142-AB
Sequence Analysis
Using the Sequence Analysis Module
Method Tab
View the method associated with the result, and the steps used to perform the separation, as
well as their associated values.
In addition, view the parameters for the first part and the second part of the separation, as
well as the total separation time.
Select File | Properties | Method.
Figure 4.29 Method Tab, Properties Dialog Box
GenomeLab Genetic Analysis System User’s Guide
PN A29142-AB
141
Sequence Analysis
Using the Sequence Analysis Module
Analysis Tab
View the analysis parameters used to produce the open sequence result. View the name of the
parameter set used as well as all of the parameters and color calibration used to perform the
analysis.
Select File | Properties | Analysis.
Figure 4.30 Analysis Tab, Properties Dialog Box
142
GenomeLab Genetic Analysis System User’s Guide
PN A29142-AB
Sequence Analysis
Using the Sequence Analysis Module
Alignment Tab
View the alignment template information and the alignment parameters used to create the
alignment of the currently open result.
Select File | Properties | Alignment.
Figure 4.31 Analysis Tab, Properties Dialog Box
NOTE This tab is visible only if an alignment has been performed on the sequence result.
GenomeLab Genetic Analysis System User’s Guide
PN A29142-AB
143
Sequence Analysis
Using the Sequence Analysis Module
Consumables Tab
View the status and identity of the capillary array, the gel, and the buffer information.
Select File | Properties | Consumables.
Figure 4.32 Consumables Tab, Properties Dialog Box
144
GenomeLab Genetic Analysis System User’s Guide
PN A29142-AB
Sequence Analysis
Using the Sequence Analysis Module
Setting or Changing Display Options
To set or change the graph data display options:
1.
Open the Display Options dialog box using one of these methods:
r
Select Tools | Display Options.
r
While viewing a graph display of sequence data, right-click the graph and select
Display Options.
The Display Options screen opens, as shown in Figure 4.33.
Figure 4.33 Display Options Dialog Box
2.
Select the tab that identifies the type of display options you want to change. For details,
see the following topics:
r
"Title Properties Tab" on page 146
r
"X Axis Options Tab" on page 146
r
"Y Axis Options Tab" on page 146
r
"Colors Tab" on page 146
r
"Dye Traces Tab" on page 146
r
"Current Trace Tab" on page 146
NOTE To view detailed descriptions while using this dialog box, click Help.
GenomeLab Genetic Analysis System User’s Guide
PN A29142-AB
145
Sequence Analysis
Using the Sequence Analysis Module
Title Properties Tab
To set or change the title of the displayed data panel:
1.
In the Display Options dialog box, select the Title tab.
2.
Change any item as necessary.
3.
Click Apply to continue or OK to close the Display Options dialog box.
X Axis Options Tab
To define the X Axis properties of the displayed data panels:
1.
In the Display Options dialog box, select the X Axis Options tab.
2.
Change any item as necessary.
3.
Click Apply to continue or OK to close the Display Options dialog box.
Y Axis Options Tab
To define the Y Axis properties of the displayed data panels:
1.
In the Display Options dialog box, select the Y Axis Options tab.
2.
Change any item as necessary.
3.
Click Apply to continue or OK to close the Display Options dialog box.
Colors Tab
To define the color options of the window, the current traces, the voltage trace, or the optical
scan trace:
1.
In the Display Options dialog box, select the Colors tab.
2.
Change any item as desired.
3.
Click Apply to continue or OK to close the Display Options dialog box.
Dye Traces Tab
To set or change the dye trace properties:
1.
In the Display Options dialog box, select the Dye Traces tab.
2.
Select the traces to display or not display, under Show Dye Traces .
3.
To change a color of any dye trace, click on the appropriate Dye Colors dye, select a color
from the Color dialog box, then click OK .
4.
When finished with Dye Traces, click Apply to continue or OK to close the Display
Options dialog box.
Current Trace Tab
To set or change the current trace options:
146
1.
In the Display Options dialog box, select the Current Traces tab.
2.
Select the radio button for the current type to display under Data .
3.
Click OK .
GenomeLab Genetic Analysis System User’s Guide
PN A29142-AB
Sequence Analysis
Using the Sequence Analysis Module
Changing Display Colors
In addition to using the Display Options dialog box Colors tab (page 146) to set display
colors, you can change colors used in raw data and heterozygote base displays, as described in
the following topics.
Raw Data Colors
To display the Raw Data Colors toolbar:
1.
Select View | Toolbars.
2.
Select the desired toolbar options.
3.
Click Close.
To change the colors of the raw data traces:
1.
On the Raw Data Colors toolbar, click on the trace color to change
(A , C , G , or T ). The Color palette dialog box opens as shown below.
Figure 4.34 Color Dialog Box
2.
Select the new color.
3.
Click OK .
Heterozygote Display Color
The heterozygous bases are bold and red, by default. To change the color of the heterozygotes
in the base sequence pane:
1.
Select Tools | Heterozygotes Display Color. The Color palette dialog box opens.
2.
Select a new color.
3.
Click OK . The color of the ambiguity codes changes in the base sequence text.
NOTE To search for heterozygotes, use the Heterozygote Backward Search
Forward Search
GenomeLab Genetic Analysis System User’s Guide
PN A29142-AB
and the Heterozygote
icons in the Standard toolbar.
147
Sequence Analysis
Using the Sequence Analysis Module
Pinning Results
Several analyses (single or batch) may be necessary before a given result is satisfactory.
Overwrite a previous result or produce additional result tabs, using functions in the CE
System.
r
To overwrite a previous result, click the pin in the left-hand corner of the result tab to
“unpin”
the result. A reanalysis of that sample overwrites the existing result.
r
To produce a new results tab, click the pin to “pin”
the result. Upon reanalysis, the
system creates a new tab containing the reanalyzed results.
Performing a Batch Analysis
To analyze more than one sample simultaneously:
1.
Select Analysis | Batch Analysis . The Batch Analysis Selection dialog box dialog box
opens.
Figure 4.35 Batch Analysis Selection Dialog Box
148
2.
Select a project name from the Project drop-down list at the bottom of the dialog box.
3.
Select the appropriate tab: Sample Data or Sample Plate Results.
4.
Select Enable and enter a filtering start and stop date, if desired.
5.
Highlight a sample name and click the right arrow to move the sample name to the
selected list box (on the right). Continue highlighting sample names and moving them
to the selected list box until you have selected all the samples for analysis.
6.
Click OK. The Analysis Parameters Editor dialog box opens.
GenomeLab Genetic Analysis System User’s Guide
PN A29142-AB
Sequence Analysis
Using the Sequence Analysis Module
7.
Select the appropriate analysis parameters or edit an existing parameter set and click OK .
The batch processing begins and a window opens.
Figure 4.36 Sequence Analysis - Batch Processing
Reanalyzing a Batch
To reanalyze a batch:
1.
After performing a batch analysis, select Analysis | Reanalyze Batch .
2.
Select a new parameter set or edit the currently selected set from the Working Analysis
Parameters dialog box to obtain different results.
3.
Click OK to start the reanalysis.
NOTE To keep the results from the previous analysis, “pin” the results tab by clicking on the pin icon
Otherwise, the system overwrites the results with any subsequent reanalyses.
.
Viewing the Selected Batch Result
To view the selected batch result after performing a batch analysis:
1.
Click the desired sample in the upper pane of the batch analysis window.
2.
Select Analysis | View Selected Batch Sample Result .
Skipping the Current Sample Analysis in a Batch
To skip the current sample during a batch analysis, select Analysis | Skip Current Sample .
Skipping the Current Sample Set Analysis in a Batch
To skip the sample set during a batch analysis, select Analysis | Skip Current Sample Set .
GenomeLab Genetic Analysis System User’s Guide
PN A29142-AB
149
Sequence Analysis
Using the Sequence Analysis Module
Skipping the Current Sample Plate Analysis in a Batch
To skip the current sample plate during a batch analysis, select Analysis | Skip Current
Sample Plate .
Restoring the Original Sequence Data
With a Results file open, select Analysis | Restore Original Base Sequence to return the
result data to its original state, losing all edits.
Using Compare Mode
Select up to 15 results to compare against the open result, enabling the comparison of a
maximum of 16 sequence results at one time, while within the Sequence Analysis mode.
IMPORTANT If you select more than 16 results from the Compare dialog box, a message box opens,
displaying the following warning:
The maximum number of results allowed
for comparison with the open result is 15.
Please select again.
Comparing Sequence Results
To compare sequence results:
1.
Launch the Sequence Analysis application.
2.
Select File | Open .
3.
Select the Sequence Results tab and select one sequence result.
4.
Click OK to open the result.
5.
Click on the Compare button on the Sample View toolbar:
The Compare dialog box opens.
6.
Select up to fifteen results.
7.
Click OK .
The system processes all fifteen results and the original result, and displays the results on the
screen.
NOTE The originally opened sequence result appears in the top pane.
To enable Compare Synch, select Tools | Compare Synch .
Zooming Results
Click on the Zoom Mode
icon and zoom in on a region in the original sequence result and
the other fifteen results zoom into the same region.
Select Tools | Unzoom All and all sixteen results zoom out so you can view the entire result.
150
GenomeLab Genetic Analysis System User’s Guide
PN A29142-AB
Sequence Analysis
Using the Sequence Analysis Module
Panning Results
To pan results, click the Pan Mode
icon.
r
Pan through the data in the original sequence and all sixteen results pan together.
r
Pan through the data in a result other than the original one and all sixteen results pan
together.
r
Use the horizontal scroll bar to move the data along the X-axis. The data panes scroll
synchronously.
Aligning Results
To align results, click the Align Mode
icon.
r
Select a point in the original result.
r
Select points in the other results you want to align with the point in the original result.
r
Access the Display Options dialog box by double clicking in the original result pane. If
you choose the X axis or the Y axis range, the range changes in all of the panes.
r
Disable Compare Synch by selecting Tools | Compare Synch .
r
Check zoom, align, and pan and the panes function independently of each other.
r
Close the Compare tab by selecting File | Close Tab .
Sequence Result Report
The sequence result report includes additional information when certain Sample Elements are
selected in the Report Format dialog box. The following table describes what each sample
element includes.
Table 4.27 Sequence Result Report Options
Option
Header
Description
Contains summary information for the sample such as sample name, position,
the method under which it was run, the sample plate name, the analysis
parameter set name, and capillary serial number. In addition, the sample note,
property set, and consumables information associated with the sample will be
printed.
NOTE This is the same information found on the General, Note, Property Set,
and Consumables tabs in the Properties dialog box.
Raw Data
Includes the unanalyzed data from the sample run.
Result Data
Displays data that has undergone final processing to produce result data. If the
data has been analyzed using a sequence analysis parameter set, the data with
each peak assigned a base is printed.
Result Output
Displays the final output in text form. If the data has been analyzed using a
sequence analysis parameter set, the called sequence will be printed in text
form. This section of the report corresponds to the base sequence text.
Current
Includes the trace associated with the current output of each capillary or the
total current of the sample set run.
GenomeLab Genetic Analysis System User’s Guide
PN A29142-AB
151
Sequence Analysis
Using the Sequence Analysis Module
Table 4.27 Sequence Result Report Options
Option
Description
Voltage
Includes the trace associated with the voltage output of the system during the
sample set run.
Analysis Log
Contains all of the steps used to perform the base-calling routine on the raw
data.
Run Log
Contains all of the actions performed and instrument messages for the sample
run.
Method Summary
Contains the details of the method used to perform the sample run. This is the
information found on the Method tab of the Properties dialog box.
Analysis Parameters
Shows the parameters used to produce result data and output for a given
sample, including heterozygote detection and alignment. If the data has been
analyzed using a sequence analysis parameter set, the sequence analysis
parameter set will be printed. In addition, the alignment template and the
alignment parameters information will be included in this section, when
applicable.
This information is available on the Analysis and Alignment tabs of the
Properties dialog box. It includes alignment information only if an alignment
was performed.
152
Quality Parameters
Includes the parameters that indicate that any given base is an A, C, G, or T
along with a value to indicate the likelihood that the call is correct.
Trimming Log
Shows the parameters used in quality-based and sequence-based trimming. It
includes the original sequence length, the length after quality-based
sequencing, the length after sequence-based trimming, the vectors trimmed,
and the base sequence in its original and trimmed forms. For sequence-based
trims, an "x" replaces the trimmed bases that are located further than that
specified in the Distance from End setting or if they are an internal match.
Alignment Results
Displays the text results of the alignment between a template sequence and a
sequence result. The top row of text is the base number, the second line is the
template sequence, the third line is the sample sequence and the last line is the
consensus.
Alignment Accuracy
Shows the statistical analysis of the accuracy of the sample sequence. This
section groups the errors in the alignment into 50-base regions and displays
the number and type of error for each region.
r
To define the report format and content, select File | Report Format .
r
To print the report without previewing or formatting prior to printing, select File | Print
Report .
r
To the view the report, select File | Print Preview.
GenomeLab Genetic Analysis System User’s Guide
PN A29142-AB
Sequence Analysis
Using the Sequence Analysis Module
The following example shows a sample report.
Figure 4.37 Sequence Results Report
GenomeLab Genetic Analysis System User’s Guide
PN A29142-AB
153
Sequence Analysis
Using the Sequence Analysis Module
Displaying Quality Parameters in a Report
To display the quality parameters in a report:
1.
Select File | Report Format .
2.
In the Sample Elements section, select the Quality Parameters option.
3.
Click OK .
Figure 4.38 Report Format Dialog Box
154
r
To view the quality parameters of an analyzed data set prior to printing, select File | Print
Preview.
r
To exit the Print Preview option, click Close .
r
To print the quality parameters for that data set, select File | Print Report .
GenomeLab Genetic Analysis System User’s Guide
PN A29142-AB
Sequence Analysis
Using the Sequence Analysis Module
The system prints the Quality Values as numerical values, as shown in the following example.
Figure 4.39 Quality Parameters Report
The following table describes the categories on the quality parameters report.
Table 4.28 Quality Parameters Report Categories
Number
Base
Number of the Called Base
Single letter designation of the called base (A, C, G, T or other IUB code)
A
Base identity score assigned by the base-caller, ranging from 0 - 255
C
Base identity score assigned by the base-caller, ranging from 0 - 255
G
Base identity score assigned by the base-caller, ranging from 0 - 255
T
Base identity score assigned by the base-caller, ranging from 0 - 255
Call Score
Quality Value
Calculated probability of correctness indicated on a linear (0.00 - 1.00) scale
Probability of correctness presented on a logarithmic (1 - 100) scale
Migration
Actual migration time (in minutes) in the raw data corresponding to the called bases
Data Point
Actual number of the data points in the analyzed data corresponding to the called bases
Insert
Edit
Indicates whether a base has been manually added to the base sequence
Indicates whether the base call has been manually changed
GenomeLab Genetic Analysis System User’s Guide
PN A29142-AB
155
Sequence Analysis
Using the Sequence Analysis Module
Magnifying (Zooming) Data
To magnify data:
1.
Click on the upper left-hand point of the area to be magnified.
2.
Drag the mouse cursor down to the lower right-hand point of the area and then release
the mouse button.
3.
Repeat this procedure to increase magnification.
NOTE Use the Unzoom
or Unzoom All
icons to zoom out.
Panning Data
To pan back and forth in the data pane:
1.
Select Tools | Pan .
2.
Click anywhere in the raw or analyzed data panes and drag the mouse cursor left or right
to move the display.
3.
Deactivate the pan mode by selecting Tools | Zoom or by clicking on the Autoscale
button.
Synchronizing Result Data with Result Output
To synchronize the analyzed data with the base sequence:
1.
Access the Sequence Analysis module.
2.
Open the desired analyzed data.
3.
Select Tools | Base Synch (Peak Synch) or click the Synch
4.
Select a base or range of bases in the base sequence pane. The corresponding peaks
appear between two hairline markers in sequence analysis.
icon.
Aligning Bases and Peaks
To align the bases in the base sequence pane with the peaks in the analyzed data pane:
156
1.
Select File | Open .
2.
In the Open dialog box, select the Results tab, highlight the desired sequence results,
then click OK.
3.
Click the Align Mode
4.
Click on the apex of the peak for which you want to view the alignment. (A hairline
cursor is displayed through the apex of the peak to its corresponding base.)
5.
Click the Zoom , Pan , or Edit button to exit from the Align mode.
icon to visually align the peak with the base call.
GenomeLab Genetic Analysis System User’s Guide
PN A29142-AB
Sequence Analysis
Using the Sequence Analysis Module
Specifying the Base Call Location
To specify the base call location:
1.
Open a sequence results file.
2.
Select Tools | Bases on Top to toggle the bases from the top to the bottom of the analyzed
data pane or vice versa.
Using Audio Enable
To enable the audio feature:
1.
With a sequence results file open, select Edit | Audio Enable .
2.
Enter text into the base sequence pane to hear the letter bases announced as they are
typed.
NOTE To enter text in the base sequence pane, Edit mode must be enabled.
Using Audio Playback
To enable the audio playback feature:
1.
With a sequence results file open, highlight a series of base sequence text.
2.
Select Edit | Audio Playback to hear the announcement of the highlighted base sequence
text.
NOTE To use this feature, Edit mode must be enabled.
Viewing Color Calibrations
To view a color calibration for a sequence result:
1.
Select File | Open .
2.
In the Open dialog box, select the Sequence Results tab, highlight the desired result
name, then click OK.
3.
Select View | Parameters Used to Compute Sequence .
4.
In the Parameters Used dialog box, click Color.
r
To view the color calibration prior to the run, select the Initial Values radio button.
r
To view the color calibration after the run, select the Final Values radio button.
NOTE This is a read-only dialog box. To make changes to the color calibrations, select Analysis | Working
Analysis Parameters | Edit | Color.
r
To add a successful color calibration to the list of available color calibrations, click
Save As in the Color Calibration Editor dialog box. Enter the desired name, then
click OK .
Computing a New Color Calibration
To compute a new color calibration:
1.
Select Analysis | Working Analysis Parameters .
2.
In the Working Parameters dialog box, click Edit .
3.
Click Color in the Sequence Analysis Parameters Editor dialog box.
GenomeLab Genetic Analysis System User’s Guide
PN A29142-AB
157
Sequence Analysis
Using the Sequence Analysis Module
4.
Select the Compute new color matrix check box ().
5.
Select the Use Final Values as Initial Values check box () to use the final values for
the initial values for the computation (recommended if the peak resolution is good).
Exporting Sequence Result
To export from the Sequence Analysis module:
1.
Launch the Sequence Analysis module and open a sequence result.
2.
Select File | Export to open the Export dialog box.
3.
Select a target folder and file name.
NOTE Do not use special characters in the file name: “/ : * ? \" < > |”.
4.
Select the desired format in the Save as type drop-down list as shown in the following
example.
Figure 4.40 Sequence Analysis Export Dialog Box
5.
158
Click Export .
GenomeLab Genetic Analysis System User’s Guide
PN A29142-AB
Sequence Analysis
Using the Sequence Analysis Module
Sequence Export File Types
The following table describes the available export file types and options.
Table 4.29 Sequence Export Options
Option
SCF (.scf)
Description
Use the SCF (Standard Chromatogram Format) format to store analyzed DNA
sequence data for a single sample. The format describes both "public" and
"private" data sections. The well-defined public data section contains trace data
points, the called sequence, the positions of each called base within the trace
data, and the call scores for each called base. It also includes a public comment
section. The private section may store other information that most software
packages ignore.
The CE system uses the private data section to store sample data (including
raw data along with current and voltage data). You can store sample data from
either sequencing or fragment analysis samples. The notes and property sets
for the sample are stored in the comment section. The CE system software
supports SCF versions 2.1 and 3.0. (You would use this format, for instance, to
export analyzed sequence data into Lasergene's SeqMan from DNASTAR Inc.).
Third-party packages cannot currently view raw data, current, or voltage.
However, custom applications can be written to view the data.
Use the SCF format to transfer data from instrument to instrument, or to import
data from third-party software into the Sequence Analysis module. Using SCF
to exchange data between instruments removes information, such as sample
plate name, capillary array serial number, etc. To maintain exact copies of data
including header information, use the CEQ format and import and export these
data using the Data Manager.
Tab-Delimited Text (.txt)
The Tab-delimited format is valid for raw data, sequence results, and fragment
results. Select the Raw Data check box () to include raw data, as well as
current and voltage data. Select the Results Data and Results Output check
boxes () to include the sequence results.
The data points are expressed as text values which can be viewed in any text
editor or in Excel.
SEQ (.seq)
GenomeLab Genetic Analysis System User’s Guide
PN A29142-AB
The Seq format only applies to the sequence results portion (such as text
bases) of analyzed sequence data. This format is used, for instance, to export
data into Lasergene's SeqMan from DNASTAR Inc. Selecting the SEQ format
exports the Result Output (Base Sequence) automatically if the sample has
been analyzed with a sequence analysis parameter set. If the sample has been
analyzed with a fragment analysis parameter set, nothing is exported.
159
Sequence Analysis
Using the Sequence Analysis Module
Table 4.29 Sequence Export Options
Option
FASTA (.fasta)
Description
The FASTA format only applies to the sequence results portion (such as text
bases) of analyzed data, and contains a comment line that is used to identify
the data. Along with the text file, a quality values file is also generated
(*.FASTA.QUAL) which lists the quality value for each base. (Quality values
correspond to -10*log10[error rate]). The range for the quality values is 1 to
99. Edited and inserted bases have a value of 99. You would use this format, for
instance, to export data into PHRAP.
Selecting the FASTA format exports the Result Output (Base Sequence) and the
Quality Parameters automatically if the sample has been analyzed with a
sequence analysis parameter set. If the sample has been analyzed with a
fragment analysis parameter set, nothing is exported.
NOTE For instance, in PHRED, a quality value of 10 means 1 error in 10. A
quality value of 20 means an error rate of 1 error in 100. A quality value of 30
means an error rate of 1 error in 1,000. A quality value of 40 means an error
rate of 1 error in 10,000, etc. Normally PHRED would export these quality
values into PHRAP. In the case of exporting from the CE system, we bypass
PHRED and export directly into PHRAP.
PHRED (.scf.phd.1)
The PHRED format produces two files: a PHRED file and an SCF file. A PHRED
file is a text file composed of a SEQUENCE section containing a COMMENT and
DNA section. The SEQUENCE section also contains the name of the Analyzed
Result that was stored.
The COMMENT section contains the file name of the associated SCF file
(CHROMAT_FILE) that was produced along with the PHRED file. The values for
ABI_THUMBPRINT and PHRED_VERSION are fixed text "N/A." The values for
CALL_METHOD and QUALITY_LEVELS are fixed as "CEQ” and "99" respectively
for the CE system. The TIME stamp is the current time at the time of export.
The DNA section is composed of the base-call (always lower-case), PHRED
Quality Value, and the Peak Index (data point) of the analyzed data contained
within the associated SCF file. Values are separated by spaces.
Selecting the PHRED format exports the Result Data, Result Output (Base
Sequence), and Quality Parameters automatically if the sample has been
analyzed with a sequence analysis parameter set. If the sample has been
analyzed with a fragment analysis parameter set, nothing is exported.
ESD (.esd)
160
The ESD, electropherogram sample data, format is used to export raw data
from the CE system to a third-party software package for analysis. Selecting
this option exports only the raw data, and no other information.
GenomeLab Genetic Analysis System User’s Guide
PN A29142-AB
Sequence Analysis
Using the Sequence Analysis Module
Table 4.29 Sequence Export Options
Option
CEQ (.cq*)
Description
Selecting the CEQ format, the format native to our database, exports sample
data, sequence or fragment results, sample plate results, sequence, or
fragment analysis parameters, sample plates, methods, locus tags (fragment
data only), standards (fragment data only), and optical scan data. The sample
elements are automatically selected in the Export dialog box, such that all of the
associated information listed above will be exported. This format essentially
takes a “snapshot” of the file and can retain all of the information belonging to
that file.
This format can only be used when importing data into the Data Manager. This
format can also be used when exporting data from the Sequence and the
Fragment Analysis modules and the Data Manager.
When exporting as CE system data, the various data types are exported to files
with the following extensions:
d
Sequence Analysis ParameterCQA
d
Sequence InvestigatorCQC
d
Fragment Size StandardCQD
d
Fragment Analysis ParameterCQF
d
Galvo Scan DataCQG
d
Fragment Locus TagsCQL
d
MethodsCQM
d
SNP Locus TagsCQN
d
Sequence ResultCQR
d
Sample DataCQS
d
Sample TableCQT
d
Fragment ResultCQU
d
Sample Table ResultCQX
Remove CEQ Tracking
Suffix
You may automatically remove the plate position coordinates (*.A01, *.B02,
etc.) and the time/date stamp from the sample name which is normally
generated by the CE system software on export. To do so, select the Remove
CEQ Tracking Suffix check box ().
Resolve Filename
Conflicts
If the system encounters the same sample name at the destination, it usually
overwrites the name (if you choose to remove the plate position coordinates
and the time/date stamp which ensures a unique name). If you select the
Resolve Filename Conflicts check box (), the system increments the
sample names on export when it encounters duplicate names. For example, if
the system encounters the duplicate sample name of “Fred” on export, it
renames the file exported to “Fred_1”.
Apply Trimming
Selecting this option removes the trims from the sequence before you export it
and replaces internal trims with the letter “x”.
GenomeLab Genetic Analysis System User’s Guide
PN A29142-AB
161
Sequence Analysis
Using the Sequence Analysis Module
Customizing Filename Extension
To supply your own custom filename extension (or none at all) to exported files, modify the
CEQ.ini file as follows:
NOTE If there is no Export section in the CEQ.ini file, export any sample file to generate the Export section,
then modify as needed.
Find the section [EXPORT] and add/modify the appropriate entry.
TXT_EXT for Text files, default is “.txt”
SEQ_EXT for SEQ files, default is “.seq”
FASTA_EXT for FASTA files, default is “.fasta”
SCF_EXT for SCF files, default is “.scf”
PHD_EXT for PHRED files, default is “.scf.phd.1”
To have no file extension added, set the entry to nothing (make sure there are no spaces after
the “=”).
SCF_EXT= Example Output FileName: SpaSample
To use a unique file extension, add or modify the entry with the desired file extension (do not
place the leading dot “.”, the system will add it).
SCF_EXT=scf v3
Output FileName: SpaSample.scf v3
To hide an entry and make the system use the default, either delete or place an “;” before it.
SCF_EXT=SCFV3
Output FileName: SpaSample.scf
Exporting Data to a Third-Party Package
CAUTION Verify that the third-party analysis package accepts the data transferred using a command-line,
and that it is compatible with the file types provided by the CE system software before attempting to perform
this procedure.
To export sequence data to a third-party analysis package:
162
1.
Select File | Open .
2.
In the Open dialog box, select the appropriate tab, highlight the desired data, then click
OK.
3.
Select Analysis | Third Party Analysis Setup .
4.
In the Third Party Analysis Setup dialog box:
a.
Specify the path and executable file of the third-party analysis package.
b.
Select the appropriate Export Data Format radio button.
c.
Click OK .
GenomeLab Genetic Analysis System User’s Guide
PN A29142-AB
Sequence Analysis
Using the Sequence Analysis Module
5.
Select Analysis | Third-Party Analysis .
6.
In the Export dialog box, enter the filename, then click OK . The system exports the data
and launches the third-party package, displaying the exported data.
GenomeLab Genetic Analysis System User’s Guide
PN A29142-AB
163
Sequence Analysis
Using the Sequence Analysis Module
164
GenomeLab Genetic Analysis System User’s Guide
PN A29142-AB
Sequence Investigator Module
Sequence Investigator Module Overview
5Sequence Investigator Module
This chapter provides an overview of the Sequence Investigator module, including its menu
options, toolbars, and dialog boxes. It also shows you how to use this module to investigate
and compare sequence analysis results.
5.1
Sequence Investigator Module Overview
Compare sequences to known reference sequences. For each comparison, you can use one or
two new sequence results, in either orientation, to form a consensus for the comparison. The
software automatically determines and matches the orientation of the sequences, forms the
consensus, aligns the consensus with the reference sequence, and provides a detailed report of
the differences.
The Sequence Investigator provides a number of tools you can use to inspect and edit the data
before generating the final report. The navigator toolbar allows you to jump to points of
interest, from specific base sequences to a variety of discrepancies in the aligned data set. The
discrepancy map provides an overview of the coverage of the reference sequence by the
sequences and indicates the locations of the discrepancies. Together, these alignment,
inspection, editing, and reporting features make Sequence Investigator an ideal tool for
identifying mutations or polymorphisms in DNA.
Main Window
Figure 5.1 shows the Sequence Investigator screen layout. This consists of a title bar, menu
bar, several toolbars, the display window, and the status bar.
GenomeLab Genetic Analysis System User’s Guide
PN A29142-AB
165
Sequence Investigator Module
Sequence Investigator Module Overview
Figure 5.1 Main Window, Sequence Investigator Module
The following table describes the items called out in Figure 5.1
Table 5.1 Main Window, Sequence Investigator Module
item
A
Description
Title Bar - Shows the module name, the active document name, and has the standard
minimize
166
, maximize
and close icons at the top-right of the window.
B
Menu Bar - See "Menu Bar Options" on page 167.
C
Standard Toolbar - See "Toolbar Icons" on page 171.
D
Display Window - Use this area to graphically display the specific window or windows
associated with the current task. This window displays the following panes:
r
Alignment Panes - Displays the text alignment results, including the following elements:
Base and codon numbering, reference and consensus amino acid translations,
reference sequence, sample sequences, consensus sequence, and the difference line.
r
Trace Data Panes - Displays trace data and base sequence results for the selected
sample sequences.
E
Dye Colors Toolbar - Use these user-defined colors in the trace data view and the bases in the
text view when the text coloring is activated.
F
Navigator Toolbar - Offers search and navigation tools within an alignment.
GenomeLab Genetic Analysis System User’s Guide
PN A29142-AB
Sequence Investigator Module
Sequence Investigator Module Overview
Table 5.1 Main Window, Sequence Investigator Module
item
Description
G
Discrepancy Map Toolbar - Displays color-coded locations of any type of attributes selected.
You may view the coverage of the reference and sample sequences.
H
Status Bar - Displays information concerning the current selection, including the position of
the currently highlighted text.
Menu Bar Options
The following example shows the Sequence Investigator module menu bar options.
The following topics describe each of these menus and their options.
File Menu
Click the File menu to display its drop-down menu, as shown in the following example.
Use the File menu to create, open, save, export, set preferences, view properties, and print a
document. The following table describes the Sequence Investigator module's File menu
options.
Table 5.2 File Menu, Sequence Investigator Module
Option
Description
New
Prompts for a reference file from a Windows folder, or disk, and then prompts for one
or two sequence results from the current working database.
Open
Opens an existing compared sequence result.
Close
Closes the document.
Save
Saves the active document to a Windows folder.
Save As
Save the current document to a new name and/or folder.
Export
Exports the current document as a text (*.txt) or a protein file (*.pro).
GenomeLab Genetic Analysis System User’s Guide
PN A29142-AB
167
Sequence Investigator Module
Sequence Investigator Module Overview
Table 5.2 File Menu, Sequence Investigator Module
Option
Description
Preferences
Sets the preferences for the Sequence Investigator.
Properties
Displays the properties of the current document.
Report Format
Set the format options used to print reports and adjust the printer settings.
Print Preview
Displays a print preview of the active document using the format specified in the
Report Format dialog box.
Print
Prints the active document as specified in the Report Format dialog box.
Print Desktop
Prints the active desktop area as specified in the Preferences dialog box.
Recent Objects
Provides a short cut to open previously opened documents.
Exit
Exits the Sequence Investigator module.
Edit Menu
Click the Edit menu to display its drop-down menu, as shown in the following example.
Use the Edit menu to edit displayed data. The following table describes the Sequence
Investigator module's Edit menu options.
Table 5.3 Edit Menu, Sequence Investigator Module
Option
168
Description
Insert
Inserts a space before the currently selected position.
Delete
Deletes the selected position.
Replace
Replaces the highlighted position with a selected IUB code.
Trim
Removes contiguous selected bases that contain an end base in the sample sequence
base-call text.
Search
Searches forward and backward for the attributes or text specified in the navigator
toolbar.
Restore To
Original
Restores the compared sequence result to its original state (removing all changes).
Quality
Threshold
Changes the quality threshold below which bases in the consensus are identified as
having low quality.
Flip Traces
Moves the sequence trace shown in the top trace pane and exchanges its position
with the bottom trace.
GenomeLab Genetic Analysis System User’s Guide
PN A29142-AB
Sequence Investigator Module
Sequence Investigator Module Overview
View Menu
Click the View menu to display its drop-down menu, as shown in the following example.
NOTE A " " next to an option indicates that the option is enabled.
Use the View menu to display data as desired. The following table describes the Sequence
Investigator module's View menu options.
Table 5.4 View Menu, Sequence Investigator Module
Option
Description
Toolbars
Select the toolbars that will be displayed. Selecting one of these options
toggles between showing and hiding the corresponding toolbar. See
"Toolbar Icons" on page 171.
Status Bar
Toggles between showing and hiding the status bar.
Unzoom All
Shows each sequence in its entirety.
History
Opens the history log.
Base Numbering
Toggles base numbering off or on.
Codon Numbering
Toggles codon numbering off or on.
Sequences
Toggles between showing and hiding the sequences.
Reference Amino Acid
Translation
Toggles between showing and hiding the reference amino acid
translation.
Consensus Amino Acid
Translation
Toggles between showing and hiding the consensus amino acid
translation.
Differences
Toggles the sequence differences off or on.
Show Colors
Toggles color used for text and background.
Working Database
Displays the active database.
GenomeLab Genetic Analysis System User’s Guide
PN A29142-AB
169
Sequence Investigator Module
Sequence Investigator Module Overview
Window Menu
Click the Window menu to display its drop-down menu, as shown in the following example.
Use the Window menu to display data as desired. The following table describes the Sequence
Investigator module's Window menu options.
Table 5.5 Window Menu, Sequence Investigator Module
Option
Description
Cascade
Cascades the open windows.
Tile Horizontally
Tiles the windows in a horizontal orientation.
Tile Vertically
Tiles the windows in a vertical orientation.
Close All
Closes all open windows.
Arrange Icons
Arranges all icons on the desktop.
Open file list
Displays a list of all open documents.
Help Menu
Click the Help menu to display its drop-down menu, as shown in the following example.
The following table describes the Help menu options.
Table 5.6 Help Menu, Sequence Investigator Module
Option
170
Description
Help Topics
Select this option to display the CE system online help. By default, the help system
displays the Contents in the navigation pane, located on the left, and the
introductory topic in the topic pane, located on the right. You can use the Contents
to select and print specific help topics. The navigation pane also provides a Search
tab and an Index tab. These tabs let you search for information by topic, index entry,
and/or keyword.
Using Help
Select this option to display the Contents window on how to use the Windows Help
system.
GenomeLab Genetic Analysis System User’s Guide
PN A29142-AB
Sequence Investigator Module
Sequence Investigator Module Overview
Table 5.6 Help Menu, Sequence Investigator Module
Option
Description
About GenomeLab
System
Select this option to access software, instrument, and system information.
Beckman Coulter
Home Page
Select this option to access the Beckman Coulter Home Page on the Internet.
Toolbar Icons
The toolbars provide quick and easy access to commonly used menu items. Each toolbar
contains icons that correspond to commonly used menu items. Click the icon to execute the
function. By default, all the toolbars appear when you first open the module.
Standard Toolbar Icons
The Sequence Investigator module’s standard toolbar contains icons that correspond to
common menu options.
Figure 5.2 Standard Toolbar, Sequence Investigator Module
The following table describes the Sequence Investigator standard toolbar icons.
Table 5.7 Toolbar Icons, Sequence Investigator Module
Icon
Description
New - Prompts for a reference file from a Windows folder, or disk, then prompts for one or
two sequence results from the current working database.
Open - Open an existing compared sequence result.
Save - Saves the active document to a Windows folder.
Print - Prints the active document as specified in the Report Format dialog box.
Print Preview - Displays a print preview of the active document using the format specified
in the Report Format dialog box.
Print Desktop - Prints the active desktop area as specified in the Preferences dialog box.
Insert - Inserts a space before the currently selected position.
Delete - Deletes the selected position.
Trim - Removes contiguous selected bases that contain an end base in the sample
sequence base-call text.
Restore to Original - Restores the compared sequence result to its original state (removing
all changes).
GenomeLab Genetic Analysis System User’s Guide
PN A29142-AB
171
Sequence Investigator Module
Sequence Investigator Module Overview
Table 5.7 Toolbar Icons, Sequence Investigator Module
Icon
Description
Unzoom all - Displays both sequence traces in their entirety.
Toggle Sequences - Displays or hides the sequences in the text view.
Toggle Reference AA Translation - Displays or hides the reference amino acid translation
line in the text view.
Toggle Consensus AA Translation - Displays or hides the consensus amino acid translation
line in the text view.
Toggle Differences - Displays or hides the differences line in the text view.
Dye Color Coded Text - Displays base text in the specified dye colors when selected.
Displays the base text in black and white when not selected.
Dye Color Coded Text block - Displays the base text background in the specified dye colors
when selected.
Help Topics - Displays the CE system online help. By default, the help system displays the
Contents in the navigation pane, located on the left, and the introductory topic in the topic
pane, located on the right. You can use the Contents to select and print specific help topics.
The navigation pane also provides a Search tab and an Index tab. These tabs let you search
for information by topic, index entry, and/or keyword.
Context-Sensitive Help - Click this icon and then on a menu item to open the Help file
related to the selection.
Dye Colors Toolbar
The Sequence Investigator module’s Dye Colors toolbar identifies the colors assigned to dyes
displayed in the trace data view and for the bases in the text view. To change any of these
color assignments, double-click the desired icon and use the Colors dialog box to choose
another color.
Figure 5.3 Dye Colors Toolbar
The following table describes the Sequence Investigator Dye Colors toolbar icons.
Table 5.8 Dye Colors Toolbar Icons, Sequence Investigator Module
Icon
172
Description
A
(red)
Red is the default color assigned to the Adenine (A) nucleotide in the data view.
C
(black)
Black is the default color assigned to the Cytosine (C) nucleotide in the data view.
G
(green)
Green is the default color assigned to the Guanine (G) nucleotide in the data view.
GenomeLab Genetic Analysis System User’s Guide
PN A29142-AB
Sequence Investigator Module
Sequence Investigator Procedures
Table 5.8 Dye Colors Toolbar Icons, Sequence Investigator Module
Icon
5.2
Description
T
(blue)
Blue is the default color assigned to the Thymine (T) nucleotide in the data view.
N
(gray)
Gray is the default color assigned to ambiguous nucleotides other than A, C, G or T.
Sequence Investigator Procedures
This section shows you how to use this module to investigate and compare sequence analysis
results.
To open the Sequence Investigator module, click the Investigator icon from the Main Menu:
Creating a Reference File
The reference file is a text file you can create using Notepad or any other text editor. It may be
composed of one or two sections: the sequence and, optionally, specific nucleotide or amino
acid mutations. To create the file, enter the text of the sequence starting in the first line of the
text editor. You may break the sequence text into several lines.
NOTE To create a reference file from the Sequence Analysis module, export the data in *.seq format or
choose *.txt with only Result Output checked.
To enter known protein or nucleotide mutations:
1.
On the line below the reference sequence, type an open bracket, followed by “KNOWN
AA MUTATIONS” and/or “KNOWN BASE MUTATIONS”, then type a closed bracket.
2.
On the next line, type the current reference amino acid or base, the position number
using the amino acid or base number, then the expected amino acid or base change.
The following example shows a sample reference:
GenomeLab Genetic Analysis System User’s Guide
PN A29142-AB
173
Sequence Investigator Module
Sequence Investigator Procedures
Figure 5.4 Sample Reference
NOTE The system creates a default Reference folder during software installation. You may store your
reference files in that location or in any other folder. When you create a new comparison, navigate to the
appropriate folder to select your reference.
Selecting a Reference and Sequence Results
174
1.
Open the Sequence Investigator module.
2.
Select File | New. An Open dialog box appears listing the contents of a reference folder.
GenomeLab Genetic Analysis System User’s Guide
PN A29142-AB
Sequence Investigator Module
Sequence Investigator Procedures
3.
Select the sample reference and click Open. The Open Sequence Results dialog box opens,
as shown in the following example.
Figure 5.5 Open Reference Dialog Box
4.
Select one or two results and click OK .
NOTE To select two results, left-click the first result, press and hold the Ctrl key, then left-click the second
result.
Figure 5.6 Open Sequence Results Dialog Box
5.
If two results are in different projects, select (none) as the Project Name to display all
available results files for a given database. A new window opens.
NOTE By default the standard, navigator, dye color, and discrepancy map toolbars appear docked. If they are
not displayed, select View | Toolbars and enable the desired toolbar.
GenomeLab Genetic Analysis System User’s Guide
PN A29142-AB
175
Sequence Investigator Module
Sequence Investigator Procedures
Numbering
Base and codon numbering start at the beginning of the reference sequence. The system uses
these numbers as a navigational reference point.
The column position numbering begins at the first base in the comparison. This may be a
reference base, a sample sequence base, or a consensus base, depending on the alignment of
the sequences being compared. The selected column number appears in the lower right-hand
corner of the status bar. The History Log records all edits made in the Sequence Investigator,
and their column number.
Viewing Reference Amino Acid Translations
When the system generates the comparison, it translates the nucleotide sequence of the
reference file into an amino acid sequence and displays it above the reference base sequence
line. From the beginning of the reference, the bases are separated into groups of three
nucleotides (codons). Each group is translated into an amino acid which is displayed above
the codon. Each codon is shaded to show its boundaries. (If an inserted space exists, signified
by a dash “–,” the space is included in the codon.)
The amino acid designation is left-justified above the codon. If two amino acids are possible,
the letters designating the possible amino acids appear. If the system detects more than two
possible amino acids at any location, it displays an asterisk instead.
To show or hide the reference amino acid sequence, select View | Reference Amino Acid
Translation . The screen displays or hides the reference amino acid translation, depending on
whether the item is checked or unchecked.
Viewing Sequence Traces
When you first perform a comparison, select one or two sequences to form the consensus.
After performing the comparison, the system displays the traces for these sequences. When
you click on any position in alignment view, the corresponding peaks in the traces move to
the center of the trace view, framed by two vertical lines.
When you first open or create a comparison, the system scales the traces to improve
readability.
r
To zoom each sequence pane individually and repeatedly, left-click and hold the mouse
button while dragging the pointer to form a box around the desired area, then release the
mouse button.
r
. The traces in both panes revert to
To unzoom both traces, click the Unzoom All icon
a completely unzoomed state, displaying the entire range of the sequence results.
r
To unzoom one of the two open data traces, right-click in the desired trace pane and
select Unzoom Pane . The selected trace displays the entire range of the result.
You cannot edit sequence traces in the Sequence Investigator. However, you may edit
sequence traces using the Sequence Analysis module. If you use an edited result for your
comparison, your edited bases appear in lower case.
176
GenomeLab Genetic Analysis System User’s Guide
PN A29142-AB
Sequence Investigator Module
Sequence Investigator Procedures
Viewing Consensus Amino Acid Translations
When the system generates the comparison, it translates the consensus nucleotide sequence
into an amino acid sequence and displays it below the consensus sequence. The amino acid
translation starts at the first base relative to a reference codon. The consensus is also
segmented into codons, which are translated into their amino acids.
If edits occur in the consensus, a re-translation of the consensus amino acid translation
occurs automatically and the system automatically updates the discrepancy map and the
differences line.
Each codon is shaded to show its boundaries. If a heterozygote occurs, the system notes up to
two possibilities; if more possibilities exist, an asterisk appears instead.
The consensus sequence is editable within the Sequence Investigator. Edited bases appear in
lower-case letters.
Using Quality Values
r If you are using a single sequence, the quality value assigned to each base in the
consensus match each base in the sequence.
r
r
When using two sequences and the bases agree, one of two calculations occur:
r
If the orientation of the two sequences is opposing, the system adds two quality
values.
r
If the orientation is the same, the system uses the higher quality value.
If the bases disagree, the system performs a calculation to determine the probability of
error for that position, providing a quality value which is the difference between the
higher and lower value.
To set the value at which bases in the consensus are considered low quality, select Edit |
Quality Threshold . Low quality bases are identified in the differences line, the navigator
toolbar, and the discrepancy map.
Viewing Sequence Investigator Differences
The system uses codes to denote the type of discrepancy encountered when performing the
comparison. These codes are shown in the differences section of the alignment pane. To turn
the differences line on or off, select View | Differences . The highest level code appears in the
differences line in the location where the discrepancy occurred.
NOTE Any consensus position may have multiple difference codes associated with it. The codes have a
hierarchy; the system displays the code with the highest precedence. To view all difference codes associated
with any position, display the navigator toolbar by selecting View | Toolbars | Navigator. The differences
text box in the navigator toolbar displays the difference codes in order of precedence.
Navigation and Editing
The navigator toolbar allows you to search for locations of interest in the consensus based on
attributes, as well as search for specific bases and view their associated quality values and
difference codes.
If the navigator toolbar is hidden from view, select View | Toolbars | Navigator. The system
displays the navigator toolbar (Figure 5.7). When docked, the toolbar appears to the left of
the screen display.
GenomeLab Genetic Analysis System User’s Guide
PN A29142-AB
177
Sequence Investigator Module
Sequence Investigator Procedures
If you need more space for your screen display, you may move the navigator toolbar so it
floats over the screen display.
r
To reposition a docked toolbar, select any background area of the dialog box, press and
hold the left mouse button while dragging the toolbar to a convenient position on the
screen, then release the mouse button.
r
To re-dock a floating toolbar, left-click the toolbar’s title bar, press and hold the left
mouse button while dragging the toolbar to the lower-left corner of the screen, then
release the mouse button.
NOTE For details on how to use the search and editing capabilities provided on the navigator toolbar, click
Help to open its context-sensitive help topic.
Figure 5.7 Navigator Toolbar - Floating
When editing the consensus, follow these guidelines:
r
Complete all trim operations before performing other types of editing. Using any other
editing operation disables the trim feature.
r
You may insert and delete spaces in the reference sequence, but not change bases.
r
Select a single consensus base if you want to perform base editing.
NOTE The system adds all editing operations to the history log along with the date, time, and position of the
operation.
Complementing the Sequence
When the system performs a comparison, it determines which orientation, forward or
reverse, to provide a better fit with the reference. If the system determines that the sequences
178
GenomeLab Genetic Analysis System User’s Guide
PN A29142-AB
Sequence Investigator Module
Sequence Investigator Procedures
generate a better comparison in the opposite orientation, it automatically reverse
complements the sequences.
To manually reverse complement a sample, right-click the desired trace data pane, then select
Reverse Complement. The trace and associated bases are reverse complemented.
Flipping the Traces
You may want to switch the order of sequence displayed. To move the sequence trace shown
in the top trace pane and exchange its position with the bottom trace, select Edit | Flip Traces
or right-click in one of the trace data panes and select Flip Traces. This exchanges the position
of the sequences in both the alignment pane and the trace panes.
Trimming the Bases
When you first open or create a compared sequence result, the sequences used in the
comparison appear in the alignment pane. You can then trim the ends of the sequences.
If sequences are not shown, select View | Sequences to display the sequences in the
alignment pane.
To trim the sequence:
1.
Select a group of sequence bases at either end of the sequence.
2.
Click the Trim
icon to remove unwanted bases from the alignment. This deletes the
bases from the text and trace data views.
NOTE You may only trim at either end of the sequence. You may not trim within the sequence.
After each trim, the system automatically aligns and redisplays the alignment text and traces.
NOTE The system adds trim operations to the history log, along with bases trimmed with date and time of
trim operation. To access the history log, select View | History.
Searching the Consensus for Specific Attributes
To search the consensus for specific attributes:
1.
Select the Consensus Attribute Search radio button.
2.
Select the attributes that you want to define as the search criteria.
3.
Click on the forward (>>) or reverse (<<) button to search the consensus in the specified
direction.
NOTE You may also press the Ctrl and the arrow (←, →) keys to perform the search.
When the search finds consensus bases that conform to the search criteria, it highlights them.
Searching the Consensus for Specific Bases
To search for a specific base or contiguous multiple bases:
1.
Select the Consensus Text Search radio button.
2.
Enter the bases in the text box.
3.
Specify the search criteria:
GenomeLab Genetic Analysis System User’s Guide
PN A29142-AB
179
Sequence Investigator Module
Sequence Investigator Procedures
r
To search for the exact match for text, select the Exact Match check box (). Use
the forward and back arrow buttons or press the Ctrl and arrow (←, →) keys to
search backwards and forwards through the base sequence for more text searches.
r
To search for a base without requiring an exact match, clear the Exact Match check
box. The search result includes all exact matches as well as all IUB codes with an
overlapping base.
For example, a search for the ambiguity code K not only results in the bases G or T,
but also result in any ambiguity code that contains G or T. The search stops on all
ambiguity codes other than M . (The bases represented by M are A and C .) Also,
searching for an A, C, G, or T matches any ambiguity codes containing the base. For
example, searching for A results in any ambiguity code containing A (specifically, M,
R, W, U, H, D, and N).
Editing the Consensus
To edit the base selected by the search, type the desired base or select Edit | Replace , then
select the desired base or ambiguity code.
To automatically jump to the next base that matches your search criteria once you have
completed the edit, select Forward or Backward on the Edit tab of the Preferences dialog box.
Displaying the Discrepancy Map
The discrepancy map toolbar allows you to look for areas of interest in relationship to the
reference. You may view the coverage of the consensus and sample sequences. You may also
view the color-coded locations in the experiment of any type of attributes of interest that you
specify.
➊
➋
➌
➍
Figure 5.8 Discrepancy Map Toolbar
r
The top bar, ➊, in the discrepancy map represents the reference sequence.
r
The second ➋ and third ➌ bar (if two sample sequences were selected) displays the
coverage of the sample sequences in relation to the reference.
r
The next area, ➍, represents the consensus and shows the color-coded regions of
interest associated with the specified attributes.
A red marker behind the reference, sample, and consensus bars corresponds to the selected
area in the trace data view and the selected base in the trace text view. You can use this toolbar
to navigate to desired areas by clicking on any point of interest. The alignment and trace data
panes refresh and display the area.
180
GenomeLab Genetic Analysis System User’s Guide
PN A29142-AB
Sequence Investigator Module
Sequence Investigator Procedures
For a global view of the desired attributes, select the corresponding check boxes located on
the right side of the map. For each selected attribute, the system adds a new bar to the
consensus area showing the locations where selected attributes exist.
To change the color code of the attribute display:
1.
Click on the color well at the left of the attribute. The color palette for the selected well
opens.
2.
Select a new color.
3.
Click OK. The discrepancy map uses the newly selected color.
Printing Reports
You may print a report for the active compared sequence result. To set up a report:
1.
Select File | Report Format .
2.
Select the default printer from the Printer Name down-down list.
3.
Set your preferred page layout by selecting Portrait or Landscape .
4.
Select the option elements you want displayed in your report (Table 5.9).
Element
Description
Header
Prints information such as the name of the compared sequence and
the name of the sample sequences as well as the database and project
where the sample resides.
Alignment
Prints the reference amino acid translation, the reference, the
sequences, the difference codes, the consensus, and the consensus
amino acid translation.
History Log
Prints a history of changes you performed in the alignment.
Statistics
Prints the statistics of the report, such as the number of
discrepancies before and after editing.
Mutations
Prints all mutations, including known and novel bases and amino
acids.
Exporting the Sequence
You may export the active compared sequence in either of three formats, as described in the
following table.
Table 5.9 Export Formats
Format
text (*.txt)
Description
Exports the base sequence of the consensus.
GenomeLab Genetic Analysis System User’s Guide
PN A29142-AB
181
Sequence Investigator Module
Sequence Investigator Procedures
Table 5.9 Export Formats
Format
Description
tab delimited
text (*.txt)
Exports data as a single line and all carriage returns (↵) are replaced
with tabs (→).
protein (*.pro)
Exports the amino acid sequence. To set the protein format, select File
| Preferences and choose one of the following format in the
Preferences dialog box.
d
Condensed: Provides all protein translations in the same
text line and designates heterozygotes between brackets.
d
Expanded: Includes all possible translations on different
lines.
The following example compares the differences between condensed
and expanded protein formats.
Condensed
Expanded
To export the active compared sequence:
1.
Select File | Export.
2.
Choose the desired format, as described in Table 5.9.
3.
Click OK to export the data.
NOTE If a file with the same name exists in the selected directory, the system prompts you to rename the
new file or confirm that you want to overwrite the existing file.
The system displays an hourglass while exporting the data.
Saving the Data
To save a new document:
1.
Select File | Save . A Save As dialog box opens, prompting you to enter a file name and
folder location.
2.
Select the folder location and enter a file name.
3.
Click Save . The system saves the data to the file for later retrieval.
NOTE If the document has previously been saved, select File | Save to save the document immediately.
To change the name or location of an existing file:
182
1.
Select File | Save As . A Save As dialog box opens, prompting you to enter a file name and
folder location.
2.
Select the folder location and enter a file name.
3.
Click Save .
GenomeLab Genetic Analysis System User’s Guide
PN A29142-AB
Fragment Analysis Module
Fragment Analysis Module Overview
6Fragment Analysis Module
The analysis of fragment or allele data is performed with the CE system software, by using
Studies. A Study represents a collection of quality sample results used for locus tag
generation, genotyping, quantitation, or AFLP profile generation. Ultimately, a Study contains
a common group of sample results that are analyzed and exported together.
This chapter provides an overview of the Fragment Analysis module, including its menu
options, toolbars, and dialog boxes. It shows how to use this module to work with Studies, to
run a fragment analysis, to set up parameters, to use result properties, and to display options.
It also describes how to work with, report, and export fragment analysis functions.
6.1
Fragment Analysis Module Overview
The Fragment Analysis module processes fragment data from the CE system platform and
provides size and allele information for detected peaks. The system organizes parameters that
identify alleles as locus tags that you can customize. You can then view, export, and print the
analysis results.
Analysis parameter sets provide parameters specific to an experiment, allowing size
calibration and locus tag assignment as necessary, when processing data.
Data analysis can be a manual function or set to run automatically. Edit and re-analysis
functions provide the capability to verify the accuracy of the data.
Graphically view, analyze, edit, compare, and print data of the following drop-down listing
types:
r
Raw Data*
r
Fragment Data
r
Fragment Lists
r
Information about locus tags and assigned alleles
Also available are Current Data* and Voltage Data*.
* These types of data cannot be edited.
GenomeLab Genetic Analysis System User’s Guide
PN A29142-AB
183
Fragment Analysis Module
Fragment Analysis Module Overview
Main Window
The following illustration identifies the areas on the Fragment Analysis module’s main
window that are described in Table 6.1.
Figure 6.1 Main Window, Fragment Analysis Module
The following table describes the items called out in Figure 6.1.
Table 6.1 Main Window, Fragment Analysis Module
Option
184
Description
A
Title Bar - Shows the module name (Fragment Analysis) and the name of the currently
open Study.
B
Menu Bar - See "Menu Bar Options" on page 185.
C
Display Area - Graphically displays the opened data.
D
Toolbar - See "Toolbar Icons" on page 190.
E
Dye Colors - Double-clicking on a dye color opens the Color dialog box. Change the dye
color displayed for that particular dye. Clicking on the dye name (D1, D2, D3, D4)
removes that dye trace from all traces.
F
Study Explorer - Displays and provides access to all of the parameters available in the
selected Study. These are divided into the tabbed sections: Analyses, Data, and Reports,
which you can select at the bottom of the Study Explorer frame.
G
Status Bar - Displays information concerning the current selection.
GenomeLab Genetic Analysis System User’s Guide
PN A29142-AB
Fragment Analysis Module
Fragment Analysis Module Overview
Menu Bar Options
The following example shows the Fragment Analysis module’s menu bar options.
The following topics describe each of these menus and their options.
File Menu
Click the File menu to display its drop-down menu, as shown in the following example.
Use the File menu to create, open, manage, and save Studies, or export, edit, and transfer
Fragment results. The following table describes the Fragment Analysis module's File menu
options.
Table 6.2 File Menu, Fragment Analysis Module
Option
Description
New Study
Starts a new Study from either raw data or analyzed results.
Open Study
Opens an existing Study.
Close Study
Closes the active Study.
Manage Studies
View and select all Studies saved to the database.
Save Study
Saves the new or edited Study.
Save Study As
Saves the current Study with a new name.
Add Raw Data to Study Select additional data (raw data) to add to the Study.
Add Result Data to
Study
GenomeLab Genetic Analysis System User’s Guide
PN A29142-AB
Select additional data (previously analyzed result data) to add to the Study.
185
Fragment Analysis Module
Fragment Analysis Module Overview
Table 6.2 File Menu, Fragment Analysis Module
Option
Export Results
Export Fragments /
Genotypes
Description
Export data in one of the following formats:
r
Text (Tab Delimited) (*.txt)
r
CEQ format (*.cq)
r
CRV (*.CRV)
Export the fragment / genotype data in one of the following formats:
r
CSV (Comma Delimited) (*.csv)
r
Linkage (Pedin)(*.pre)
r
Discovery Manager (DMPopulation)(*.txt)
r
Genotype Summary Report (Tab Delimited)(*.gsr)
Transfer Fragments for
GeXP
Export fragment data in a *.csv file compatible with the GeXP Analyzer.
Preferences
Set the following preferences:
r
Select whether to display the Study window when the Fragment Analysis
module is launched.
r
Specify whether to graph all electropherograms by size or time.
r
Set the number of egrams to be cached.
r
Select the initial view when selecting the Single Result View of a sample.
r
Specify whether to display a warning message before resetting all manually
included or excluded bins during an AFLP analysis.
r
Specify whether to display a warning message before reanalysis if old
results in the study will be replaced by new results.
Print Screen
Send an image of the computer desktop, application window, or main window to
the printer.
Recent Studies
Lists the most recently opened Studies.
Exit
Closes the Fragment Analysis module.
View Menu
Click the View menu to display its drop-down menu, as shown in the following example.
NOTE A " " next to an option indicates that the option is enabled.
186
GenomeLab Genetic Analysis System User’s Guide
PN A29142-AB
Fragment Analysis Module
Fragment Analysis Module Overview
The following table describes the Fragment Analysis module’s View menu options.
Table 6.3 View Menu, Fragment Analysis Module
Option
Description
Fragment List
Displays the Fragment List. The Fragment List contains information for all analyzed
fragments included in the Study, such as size, height, area, locus, and allele ID.
Results Set
Displays the Results Set View. The Result Set contains information for all of the
analyzed samples included in the Study.
Locus List
Editor
Opens a dialog box that create the LocusList.txt file used for the Genotype Summary
View (GSV).
Genotype
Summary
Displays a Study's genotype information (loci and alleles).
Status Bar
Toggles between displaying or not displaying the Status Bar.
Study Explorer
Displays the Study Explorer. The Study Explorer provides access to all of the
parameters available in the selected Study.
Toolbars
Select which toolbars to display. See "Toolbar Icons" on page 190.
Results Menu
Click the Results menu to display its drop-down menu, as shown in the following example.
NOTE This menu is available only when displaying the Result Set View.
The following table describes the Fragment Analysis module’s Results menu options.
Table 6.4 Results Menu, Fragment Analysis Module
Option
Description
Show Excluded
Shows fragment results that were excluded from the Fragment Results Grid.
Show Capillary
Summary
Displays a table that identifies the number of samples that are included and excluded
in the Result Set within each capillary.
Fragments Menu
Click the Fragments menu to display its drop-down menu, as shown in the following example.
GenomeLab Genetic Analysis System User’s Guide
PN A29142-AB
187
Fragment Analysis Module
Fragment Analysis Module Overview
The following table describes the Fragment Analysis module’s Fragments menu options.
Table 6.5 Fragments Menu, Fragment Analysis Module
Option
Description
Show Excluded
Shows fragments that were excluded from the Fragment List.
Manually Add
Peaks
Provides an option to manually select peaks to be included in the fragment list.
Save Fragment
Grid As CSV
Save the Fragment Grid as a comma delimited file (*.csv)
Analysis Menu
Click the Analysis menu to display its drop-down menu, as shown in the following example.
The following table describes the Fragment Analysis module’s Analysis menu options.
Table 6.6 Analysis Menu, Fragment Analysis Module
Option
Analysis Parameters
Description
r
View the current working analysis parameters.
r
Edit the working analysis parameters (maintained in memory for the
duration of the application session).
r
Select a previously saved parameter set to be used in the analysis.
New AFLP Analysis
Starts a new AFLP Analysis. See "Performing AFLP Analysis" on page 242.
New Binning Analysis
Starts a new Binning Analysis. See "Performing Bin Analysis" on page 233.
New Peak Ratio Analysis
Starts a new Peak Ratio Analysis. See "Calculating Peak Ratios" on page 239.
Run LOH Analysis
Runs a Loss of Heterozygosity Analysis. See "Performing LOH Analysis" on
page 246.
Reports Menu
Click the Reports menu to display its drop-down menu, as shown in the following example.
188
GenomeLab Genetic Analysis System User’s Guide
PN A29142-AB
Fragment Analysis Module
Fragment Analysis Module Overview
The following table describes the Fragment Analysis module’s Reports menu options.
Table 6.7 Reports Menu, Fragment Analysis Module
Option
Description
New Report
Select a template and context type for the report.
Refresh
Refreshes the display of the selected report.
Window Menu
Click the Window menu to display its drop-down menu, as shown in the following example.
The following table describes the Fragment Analysis module’s Window menu options.
Table 6.8 Window Menu, Fragment Analysis Module
Option
Description
Cascade
Cascades the open windows.
Tile Horizontally
Tiles the windows in a horizontal orientation.
Tile Vertically
Tiles the windows in a vertical orientation.
Close All
Closes all currently active windows.
Arrange Icons
Automatically arranges the icons.
1
Brings the selected window (#1) to the foreground.
Help Menu
Click the Help menu to display its drop-down menu, as shown in the following example.
GenomeLab Genetic Analysis System User’s Guide
PN A29142-AB
189
Fragment Analysis Module
Fragment Analysis Module Overview
The following table describes the Help menu options.
Table 6.9 Help Menu, Fragment Analysis Module
Option
Description
Help Topics
Select this option to display the CE system online help. By default, the help system
displays the Contents in the navigation pane, located on the left, and the
introductory topic in the topic pane, located on the right. You can use the Contents
to select and print specific help topics. The navigation pane also provides a Search
tab and an Index tab. These tabs let you search for information by topic, index entry,
and/or keyword.
Using Help
Select this option to display the Contents window on how to use the Windows Help
system.
About GenomeLab
System
Select this option to access software, instrument, and system information.
Beckman Coulter
Home Page
Select this option to access the Beckman Coulter Home Page on the Internet.
Toolbar Icons
The Fragment Analysis module provides three toolbars that activate some of the most
commonly used commands. Figures 6.2 identifies these toolbars.
Study Toolbar
Dye Colors Toolbar
View Toolbar
EgramBand Toolbar
Figure 6.2 Toolbars, Fragment Analysis Module
The following table describes these toolbar icons.
Table 6.10 Toolbar Icons, Fragment Analysis Module
Icon
Description
New - Create a new Study from either raw data or result data.
Open - Open an existing or recent Study.
Save - Saves the new or edited Study.
Study Explorer - Displays the Study Explorer.
Fragment List - Opens the Fragment List.
190
GenomeLab Genetic Analysis System User’s Guide
PN A29142-AB
Fragment Analysis Module
Fragment Analysis Module Overview
Table 6.10 Toolbar Icons, Fragment Analysis Module
Icon
Description
Result Set - Opens the Result Set View.
D1
(red)
D2
(black)
D3
(green)
D4
(blue)
Red is the default color assigned to Dye #1 in the fragment data pane and D1 is the default
name.
Black is the default color assigned to Dye #2 in the fragment data pane and D2 is the default
name.
Green is the default color assigned to Dye #3 in the fragment data pane and D3 is the
default name.
Blue is the default color assigned to Dye #4 in the fragment data pane and D4 is the default
name.
Table 6.11 EgramBand Toolbar
IMPORTANT Portions of this toolbar are only available when viewing Sample Results in Single Result,
Stacked Graph, and Overlay Graph View modes. Displaying the selected sample results in one of these
modes will automatically display the appropriate EgramBand components for the selected display mode.
Table 6.12
EgramBand Y Axis - Scale the Y axis.
EgramBand X Axis - Scale the X axis.
EgramBand Zoom tool - Allows you to zoom in on a
selected area of the Overlay Graph electropherogram
display. This option is the default selection when in Overlay
Graph mode.
EgramBand Subset Selection tool - Allows you to select a
subset of data to be displayed in Stacked Graph mode. This
option is only available when in Overlay Graph mode.
GenomeLab Genetic Analysis System User’s Guide
PN A29142-AB
191
Fragment Analysis Module
Fragment Analysis Procedures
6.2
Fragment Analysis Procedures
To open the Fragment Analysis module from the Main Menu, click the Fragment Analysis
icon.
Figure 6.3 Fragment Analysis: New Study Window
Performance Safeguards
Controller Resources
The system checks the available controller resources before it starts processing results. If the
system determines that the resources needed to complete the analysis are not available, it
displays a warning message (see Figure 6.5). If this occurs, close all applications, re-start the
Fragment Analysis module, and attempt the analysis again.
Figure 6.4 Controller Resources Warning
192
GenomeLab Genetic Analysis System User’s Guide
PN A29142-AB
Fragment Analysis Module
Working with Studies in the Fragment Analysis Module
Database Size Warning
If a database is selected that is greater than 1700 megabytes, the following warning message
will appear, if you try to perform additional data analysis steps:
Figure 6.5 Database Size Warning
6.3
Working with Studies in the Fragment Analysis Module
A Study is a set of multiple sample results together with the results of analyses performed on
the group of sample results. You can use the Study Wizard to create a new Study easily. The
Study Wizard guides you through the process of creating a new Study starting from either raw
data or previously analyzed fragment results.
The Study window opens automatically when you start the Fragment Analysis module. You
can open a new or existing Study immediately from this window or at any time while working
within the Fragment Analysis module.
GenomeLab Genetic Analysis System User’s Guide
PN A29142-AB
193
Fragment Analysis Module
Working with Studies in the Fragment Analysis Module
To access the Study window, select File | New Study or File | Open Study.
Figure 6.6 Study Window - Creating or Opening a Study
You can create a new Study from either Raw Data or previously Analyzed Results . Make your
selection using one of the option buttons and click OK to continue.
The Study Wizard guides you through the steps of creating a Study. After the system analyzes
the samples, you may include additional results in the new Study.
To open an existing Study, select it from the list of Study names available under either the
Existing Studies tab or the Recent Studies tab. The Date-Time column indicates when the
Study was created or last modified. When you have made your selection, click OK to open the
existing Study.
Selecting the Components of the New Study
The first step in creating a new Study involves manually filtering data from the database by
selecting the samples you would like to include in your Study. (This is first-level filtering.)
After the system analyzes these samples, you may further filter the sample results
(second-level filtering) in the Result Set View.
194
GenomeLab Genetic Analysis System User’s Guide
PN A29142-AB
Fragment Analysis Module
Working with Studies in the Fragment Analysis Module
Finally, you may filter the generated fragment and allele data (third-level filtering) in the
Fragment List. This leaves a collection of identified fragments and alleles that exactly match
the requirements of your Study.
Selecting Raw Data for the New Study
When you select the Raw Data option and click OK , the Study Wizard opens, displaying the
Select Raw Data window.
Figure 6.7 Select Raw Data Window - Selecting the Components of the New Study
Use this window to select the raw data to be analyzed from a database of samples that have
been run in a particular projects. The system includes the selected raw data in your Study and
analyzes it as described in the following steps.
NOTE To view an individual sample electropherogram and other collected parameters prior to adding the
sample to your Study, right-click on a highlighted sample and select Show Single Sample View.
The List View and Plate View tabs provide you with two ways to select raw data. Each
selection method provides the same sample information presented in different ways.
Selecting Raw Data from the List View Tab
The List View tab allows you to select from a list of samples contained in a specific database
and/or collected during a particular time frame.
1.
Select the List View tab in the Select Raw Data window.
2.
Select the project folder that contains the sample data that you wish to include in the
Study from the Project drop-down list.
NOTE If the desired project is not listed, it may be located in a different database. To enter a different
database, you must close all applications and set the working database. See "Setting the Working Database"
on page 328 or “Set Working Database” in the online help for more information.
GenomeLab Genetic Analysis System User’s Guide
PN A29142-AB
195
Fragment Analysis Module
Working with Studies in the Fragment Analysis Module
3.
Filter data: If the data of interest was run during a particular time period, you can filter
the data by selecting the Filter by date check box () and choosing a range of dates to
be searched. When enabled, the system displays only those samples that were run during
the specified time period.
4.
Select samples from the Raw Data / Available area:
r
To select the samples to be included in your Study, click to highlight the sample,
then click the right-arrow button to move the selection to the Raw Data / Selected
area.
r
To select all of the displayed samples to be included in your Study, click the
double-right-arrow button to move them to the Raw Data / Selected area.
r
To remove samples from your Study, click to highlight the samples in the Raw Data /
Selected area and click either of the left-arrow buttons to remove them from your
selected samples.
NOTE You may select data from multiple projects to be included in your Study as long as they are located in
the same database. Multiple results from multiple databases may not be combined into the same Study.
Continue making selections from the list of available projects and data until all of the desired samples have
been added to the Raw Data / Selected area.
5.
Click Next to proceed to the Analysis Parameters window.
Selecting Raw Data from the Plate View Tab
The Plate View tab allows you to make your selections from a visual representation of the
sample plate.
1.
Select the Plate View tab in the Select Raw Data window.
Figure 6.8 Selecting Raw Data from the Plate View Tab
196
GenomeLab Genetic Analysis System User’s Guide
PN A29142-AB
Fragment Analysis Module
Working with Studies in the Fragment Analysis Module
2.
Select the project folder that contains the sample data that you want to include in the
Study from the Project drop-down list.
NOTE If the desired project is not listed, it may be located in a different database. To enter a different
database, you must close all applications and set the working database. See "Setting the Working Database"
on page 328 or “Set Working Database” in the online help for more information.
3.
Select the plate from the Plates drop-down list. A visual representation of the plate
appears in the Current Plate area of the window.
r
To select the samples for your Study, click on the well location of the sample of
interest. The sample ID moves to the Current Plate / Selected Wells area of the
window, indicating that the sample will be included in the Study.
NOTE See the Raw Data Legend area of the window for information regarding sample well selection.
r
To remove samples from your Study, click on the well location of the sample you
would like to remove. The sample ID moves to the Current Plate / Selected Wells
area of the window, indicating that the sample has been removed from the Study.
r
To select or remove entire rows or columns of wells, click on the corresponding row
letters or column numbers.
r
To select the entire plate to be included in your Study, click on the red box in the
upper-left corner of the plate.
NOTE You may select Study data from multiple projects and/or multiple plates. Continue making selections
from the list of available projects and plates to add all of the desired samples to the Raw Data / Selected area.
4.
Click Next to proceed to the Analysis Parameters window.
Selecting an Analysis Parameter Set
The second step in creating a new Study from raw data involves defining the parameters to
use when analyzing selected samples. Analysis parameters are used to process the fragment
data to estimated fragment sizes and to identify alleles.
GenomeLab Genetic Analysis System User’s Guide
PN A29142-AB
197
Fragment Analysis Module
Working with Studies in the Fragment Analysis Module
Figure 6.9 Analysis Parameters Window - Selecting a Fragment Analysis Parameter Set
Use the Analysis Parameters window to create, select, or edit the analysis parameter set for
analyzing the data selected for the new Study. Your choice of a particular set of analysis
parameters depends on the particular fragments you are attempting to identify.
The CE system software has a set of default analysis parameters, used to estimate unknown
fragment lengths. The calibration curve is based on the migration times of the size standard
fragments. The default set of analysis parameters cannot be edited.
The default parameters are as follows:
r
DEFAULT FRAGMENT ANALYSIS PARAMETERS: Used for applications such as STR, AFLP,
etc
r
DEFAULT GeXP ANALYSIS PARAMETERS: Used for the Gene Expression application
r
DEFAULT SNP ANALYSIS PARAMETERS: Used for the SNP application
Selecting a Saved Analysis Parameter Set
In the Select Analysis Parameter Set area of the window, select the parameter set from the
drop-down list.
The Parameter Set Summary area of the window displays summary information about the
selected analysis parameter set. These include:
r
Date and time the analysis parameter set was created or last modified.
r
Selected size calibration standard, calibration curve, and optional dye mobility
correction.
r
Currently assigned locus tags that have been selected for this Study.
Click Next to proceed to the Analyze Data window.
NOTE If the available parameter sets do not apply to your Study, you can create a new set of analysis
parameters or edit an existing set to meet the requirements of your Study. Refer to "Defining Fragment
Analysis Parameters" on page 200 or the online help for more information.
Analyzing the Data
With the new data selected and the analysis method defined, the third step in creating the
Study is to analyze the data.
The Analyze Data window displays all samples selected for analysis, the date each was
collected, the status (unanalyzed) of each sample, and the parameter set being applied to the
Study (see Figures 6.10).
r
198
To begin the analysis, click Analyze . As the system proceeds with the analysis, the
progress bar becomes active and the lower dialog box displays the analysis log for each
sample as it is analyzed.
GenomeLab Genetic Analysis System User’s Guide
PN A29142-AB
Fragment Analysis Module
Working with Studies in the Fragment Analysis Module
r
To stop the analysis while it is in progress, click Stop . The system stops the analysis
when it has finished with the sample in progress.
Figure 6.10 Analyze Data Window - analysis currently in progress
When the analysis is complete, the status column indicates if the analysis succeeded or failed
for each sample included in the Study.
To review the analysis log, highlight a sample in the upper samples list and scroll through the
analysis information in the lower analysis log area of the window.
Click Next to proceed to the Select Result Data window.
Selecting Additional Results to add to the Study
Add result data to your new Study, in this fourth step. Additional result data may include
samples that were previously analyzed under a different set of analysis parameters than those
analyzed in the preceding steps of the Study currently being developed.
The Select Result Data window is identical to the Select Raw Data window displayed in the
first step of the Study Wizard.
NOTE Refer to the "Selecting Raw Data for the New Study" on page 195 for an explanation of the features
available in the Select Result Data window.
Select any additional results that you would like to add to the new Study and click Finish to
complete the Study.
To save your new Study, select File | Save or File | Save As .
GenomeLab Genetic Analysis System User’s Guide
PN A29142-AB
199
Fragment Analysis Module
Defining Fragment Analysis Parameters
6.4
Defining Fragment Analysis Parameters
The following sections describe how to edit a parameter set or create an entirely new set of
analysis parameters to meet the specific requirements for your samples.
You can create or edit parameter sets using the Fragment Analysis Parameters window. This
window contains a number of tabs in which you define the general parameter set information,
set locus tag parameters, select an analysis method, assign quantitation values, and define
several other factors that affect how your data is analyzed.
You can access the Fragment Analysis Parameters window either while developing a Study
from within the Study Wizard (see "Selecting Raw Data for the New Study" on page 195).
You can also access it at any time while working within the Fragment Analysis module by
selecting Analysis | Analysis Parameters.
Using either method, the Analysis Parameters window opens, showing the currently saved
parameter sets available for selection.
r
To create a new parameter set, click New.
r
To edit an existing parameter set, click Edit.
The following illustration shows the Edit Fragment Analysis Parameters window.
Figure 6.11 Edit Fragment Analysis Parameters Window - Creating or Editing a Parameter Set
200
GenomeLab Genetic Analysis System User’s Guide
PN A29142-AB
Fragment Analysis Module
Defining Fragment Analysis Parameters
General Tab
The General tab is the first tab displayed when you first open the Fragment Analysis
Parameters window. This tab contains general parameter set information and peak
identification properties.
Parameter Set Information
Parameter Set information depends on whether you are creating a new parameter set or
editing an existing parameter set:
r
If you are creating a new parameter set, enter a descriptive name in the Parameter Set
Name field and select the project where you want to save the parameter set.
r
If you are editing an existing parameter set, you may choose to save the edited
parameters under a different name. To do this, click Save As and enter the new name in
the Parameter Set Name field. You may also choose to save the edited parameters under the
original name. The default set of fragment analysis parameters cannot be edited.
The General tab’s Parameter Set area shows the date and time the parameter set was created
and modified.
Peak Criteria
You can edit the following Peak Criteria fields:
r
Slope threshold: Specify the minimum rate of the signal increase on the leading edge of
peaks in order for a peak (standard or unknown) to be detected.
r
r
Enter a value between 1 - 1000. The default value is 10.
r
The slope is proportional to the height of the peak and depends on the width of the
peak. You can set this parameter to detect peaks of interest while eliminating smaller
or broader peaks that may not be of interest.
r
The slope threshold is set relative to the baseline noise, as the baseline noise varies
for each dye trace. Although you can define only one slope threshold value, the
system adjusts for each dye, depending on the noise detected for that dye trace.
Relative peak height threshold (%): Set a minimum height criterion that unknown peaks
must meet before being displayed in the fragment list or annotated in an
electropherogram.
r
Enter a value between 0 - 100%. The default value is 1%.
r
The unknown peaks above this set value (%) relative to the second highest peak in
each dye trace will be displayed in the fragment list and the sizes will be displayed
in the electropherogram.
r
This value does not apply to standards.
r
To size the peaks only, clear the Allele Identification check boxes.
Allele Identification
The Allele Identification check boxes let you add either of the following parameters:
r
Identify STR Alleles: Select this option () to include allele identification as specified in
the allele lists of the selected Short Tandem Repeat (STR) locus tags.
GenomeLab Genetic Analysis System User’s Guide
PN A29142-AB
201
Fragment Analysis Module
Defining Fragment Analysis Parameters
r
SNP Analysis: Select this option () to include Single Nucleotide Polymorphism (SNP)
analysis in the parameter set.
NOTE You may include only one of these options in the same analysis.
Size Estimation and Allele ID Confidence
Confidence level: Set this level as required for your analysis. The confidence level (default value
95%) is equal to one minus the significance level of the built-in statistical tests used for allele
identification and for computing apparent fragment size confidence intervals.
Analysis Method Tab
Set the size standard and model. The model selected should be the best fit for the size
standard selected, as it is used to generate the size calibration model, which estimates sizes for
the unknown fragments.
Figure 6.12 Fragment Analysis Parameters Window - Analysis Method Tab
Size standards are sets of DNA fragments of known sizes, run with a sample and used to
create the size calibration model. The system uses this model to relate the known fragment
size to either migration time or mobility for estimating the size of the unknown fragments.
NOTE Refer to online help for information on creating size standards.
202
GenomeLab Genetic Analysis System User’s Guide
PN A29142-AB
Fragment Analysis Module
Defining Fragment Analysis Parameters
Setting Size Standards
To ensure the system finds the standards and makes correct associations between the
fragment peaks and the fragment list, size standards must meet the following two
requirements:
r
Fragments in the larger half of the size range should be spaced uniformly. For example,
the peaks in the range of 200 to 400 nucleotides of the SizeStandard-400 are 20
nucleotides apart.
r
Fragments in the smaller half of the size range should include a set of at least three
fragments that are spaced approximately half the distance of those that are in the larger
fragment size range. For example, in the SizeStandard-400, the peaks in the larger half of
the size range are spaced 20 nucleotides apart, while some in the smaller half of the size
range are spaced 10 nucleotides apart.
NOTE Custom Size Standards can be created and defined in the Data Manager module. See "Creating New
Size Standards" on page 332.
Setting the Analysis Method
To set the analysis method:
1.
Select the standard to run with the sample from the Size Standard drop-down list. The size
standards available are: SizeStandard-400, SizeStandard-600, and SizeStandard-80. Your
selection determines which size standards become available for selection in the Selected
Peaks list to the right.
2.
Select the peaks you want to use in the Selected Peaks list:
r
To use all fragments in the selected standard, click Select All.
r
To select individual fragments in the selected standard, select the check box next to
each of the fragment sizes you want to run with the sample.
r
If you do not want to use any of the standard sizes, click Deselect All.
NOTE If you do not use a size standard when analyzing the data, the unknown fragments will not be sized.
3.
Note the parameters provided in the following fields for the selected size standard:
r
Dye: displays the dye label on the size standard fragments.
r
Size Standard Fit Coefficient: displays the standard deviation of the differences between
the actual fragment sizes and the apparent sizes of the standard fragments
determined from a large number of repeated runs. This parameter is sometimes
called the “lack-of-fit”.
4.
Select the empirical model you want to use for generating the curve that best fits the
identified standard fragments from the Model drop-down list.
NOTE The relationship between fragment size and mobility (or migration time) in the CE system with
replaceable gels is non-linear, and is not described with sufficient accuracy with any theoretical model to
yield reliable fragment size estimates. However, polynomials of varying degrees serve as practical empirical
models that will accurately account for this non-linearity.
Based on the selected standard, you can use one of these following models:
r
Linear Fit is a straight line model, which is useful only for a set of size standards
spanning a very small range.
GenomeLab Genetic Analysis System User’s Guide
PN A29142-AB
203
Fragment Analysis Module
Defining Fragment Analysis Parameters
r
Quadratic Fit adequately accounts for the non-linear dependence of mobility on size
under some conditions, but usually over relatively short size ranges that are well
separated from the size limits of the separation system.
r
Cubic Curve generally represents the curvature in a time or mobility versus size plot
well enough that errors in estimated sizes are dominated by other factors, such as
effects of primary structure on mobility. This is usually the best choice for routine
use with the SizeStandard-400 set.
r
Quartic Curve is a fourth degree polynomial that provides more accurate size
estimates than a cubic curve when used for calibrations that span a long size-range
or extend into size areas where the size selectivity of the separation system is very
non-linear. This is usually the best choice for routine use with the SizeStandard-600
set.
r
Local Southern method estimates the size of a sample fragment from its mobility and
that of the four standard fragments closest in size. If you select this method, the X
Variable options are grayed-out and mobility is automatically selected.
5.
Set the Migration Variable fields to either migration time or mobility as the independent
variable for the Model. Size is the dependent variable.
r
Migration time: Select this option to use the average migration times and sizes of the
standard fragments to construct a size calibration.
r
Mobility: Select this option to use fragment velocity (cm/s) divided by the separation
potential (V/cm) with the sizes of the standard fragments to construct a size
calibration.
204
GenomeLab Genetic Analysis System User’s Guide
PN A29142-AB
Fragment Analysis Module
Defining Fragment Analysis Parameters
Quantitation Tab
The Quantitation tab allows you to set the parameters for calculating the quantity of all peaks
by comparing their heights or areas to a single peak of the same color whose quantity is
known.
Figure 6.13 Fragment Analysis Parameters Window - Quantitation Tab
Once you have entered the information for the known peak into this window, the system
looks for the reference peak in each trace using the specified size or time. Based on this
information, the system can then calculate the quantity of each of the remaining peaks in the
sample.
ID Standard
In the ID Standard area of the window, select one of the following options as the method the
system uses to identify your reference peak:
r
Size: Select this option to identify your reference peak based on the fragment size
specified in the Size field listed for each of the four dyes.
r
Time: Select this option to identify your reference peak based on the migration time
specified in the Time field listed for each of the four dyes.
Calculate Using
In the Calculate Using area of the window, select the method the system uses to calculate the
quantity of your reference peak:
GenomeLab Genetic Analysis System User’s Guide
PN A29142-AB
205
Fragment Analysis Module
Defining Fragment Analysis Parameters
r
Height: Select this option to calculate the quantity of your reference peak based on its
peak height.
r
Area: Select this option to calculate the quantity of your reference peak based on its peak
area.
Quantitation Values
Set the parameters for each dye. Enter values for each dye selection:
r
r
Size/Time: These fields depend on the selected ID Standard:
r
If you selected Size as the ID Standard, the first field next to the dye requires you to
enter the size of the reference peak (nucleotides) for that dye.
r
If you have selected Time as the ID Standard, the first field next to the dye requires
you to enter the migration time of the reference peak (minutes) for that dye.
+/- Window: Enter a variable quantity to consider when identifying the reference peak. For
example, if you listed the size of your reference peak as 90 nucleotides, you may enter a
value of '1' in the +/- Window field. This value should compensate for any variability that
might arise in identification of the reference peak.
NOTE The values entered in these fields are based on the ID Standard used, either +/- nucleotides (for Size)
or +/- minutes (for Time).
r
Amount: Enter the known quantity of your reference peak.
r
E: Enter this value as the exponential notation.
r
Units: Select the units for the quantity entered into the Amount field. Values may be any of
the following:
r
Moles (mol)
r
Grams (g)
r
Molarity (M)
r
(g/L)
STR Locus Tags Tab
The STR Locus Tags tab allows you to select the Short Tandem Repeat (STR) locus tags used
for allele identification with the current parameter.
NOTE Although the STR Locus Tags tab is similar in appearance and functionality to the SNP Locus Tags
tab, the two types of Locus Tags are used for different purposes. STR Locus Tags use size to define allele
fragments having a single specified dye label in a specified size range. SNP Locus Tags use multiple dye
labels for fragments of a single specified size to define specific SNP variants.
The system uses locus tags to define a particular locus of interest. Each available locus tag is
configured with a specific set of parameters that define the manner in which the system
identifies detected fragments as allele fragments. These parameters include the fragment size
range, repeat unit length, the dye used, and an allele list associated with the locus tag.
When you select a locus tag and perform an analysis, the system identifies the alleles present
within the locus region using the estimated size of the fragments and the allele list.
NOTE The system estimates sizes only if you specified a size standard (see "Analysis Method Tab" on page
202) and calls alleles only if an allele list exists for the selected locus tag (see "Locus Tab" on page 212).
206
GenomeLab Genetic Analysis System User’s Guide
PN A29142-AB
Fragment Analysis Module
Defining Fragment Analysis Parameters
You can choose STR locus tags from a list of available STR locus tags previously configured
for analysis. This tab also gives you access to the STR Locus Tag Editor, where you can edit
existing or create new STR locus tags to meet the specific requirements of your samples.
Figure 6.14 Fragment Analysis Parameters Window - Selecting STR Locus Tags
Selecting Locus Tags
Select one or more locus tags you want included in your parameter set:
r
To select an individual locus, select it in the Available list, then click the right-arrow (>) to
move the selection to the Selected list.
r
To select all available locus tags, click the double-right-arrow (>>) to move the selections to
the Selected list.
r
To remove locus tags from your parameter set, select the locus tag in the Selected list and
click either of the left-arrow buttons to remove them from your parameter set.
r
To edit a locus tag, highlight the selection and click Edit Locus to display the STR Locus
Tag Editor window.
r
To create a new locus tag, click New Locus to display the STR Locus Tag Editor window.
NOTE See "Using the STR Locus Tag Editor" on page 212 for information about creating or editing locus
tags.
GenomeLab Genetic Analysis System User’s Guide
PN A29142-AB
207
Fragment Analysis Module
Defining Fragment Analysis Parameters
SNP Locus Tags Tab
The SNP Locus Tags tab allows you to select the locus tags used for SNP analysis with the
current parameter set.
Use SNP locus tags to detect the presence of specific Single Nucleotide Polymorphisms
(SNPs) in the group of sample data selected for the Study. SNP locus tags are much the same
in many respects as STR locus tags. Each SNP locus tag is configured with a specific set of
parameters that tell the system what fragment size to “look for” and to assign an allele name
based on the color (dye label) of the identified fragment.
The results produced from a SNP analysis looks the same as those produced by an STR
analysis. Fragments identified as alleles of a locus are labeled as such in the fragment list. No
more than one fragment labeled with a given dye can belong to the same locus (up to four
peaks can be labeled as alleles of the same locus, but each must be labeled with a different
dye).
You can choose SNP locus tags from a list of available SNP locus tags previously configured
for analysis. This tab also gives you access to the SNP Locus Tag Editor, where you can edit
existing or create new SNP locus tags to meet the specific requirements of your sample.
Figure 6.15 Fragment Analysis Parameters Window - Selecting SNP Locus Tags
208
GenomeLab Genetic Analysis System User’s Guide
PN A29142-AB
Fragment Analysis Module
Defining Fragment Analysis Parameters
Selecting Locus Tags
Select one or more locus tags you want included in your parameter set:
r
To select an individual locus, select it in the Available list, then click the right-arrow (>) to
move the selection to the Selected list.
r
To select all available locus tags, click the double-right-arrow (>>) to move all of them to the
Selected list.
r
To remove locus tags from your parameter set, select each locus tag in the Selected list
and click either of the left-arrow buttons to remove them from your parameter set.
r
To edit a locus tag, select it and click Edit Locus to display the SNP Locus Tag Editor
window.
r
To create a new locus tag, click New Locus to display the SNP Locus Tag Editor window.
NOTE See "Using the SNP Locus Tag Editor" on page 219 for information about creating or editing locus
tags.
Running a SNP Analysis
The following list identifies the three tasks you must complete before running an SNP
analysis.
1.
Select the SNP Locus Tags as part of the analysis in the SNP Locus Tags tab of the Analysis
Parameters window (see "SNP Locus Tags Tab" on page 208).
2.
Select SNP Analysis in the General tab of the Analysis Parameters window (see "General
Tab" on page 201).
3.
Select an appropriate SNP Size Standard (Size Standard-80) in the Analysis Method tab of
the Analysis Parameters window (see "Analysis Method Tab" on page 202).
r
A size standard with exactly two fragments must be selected for SNP analysis to
succeed.
r
The size standards must bracket all expected SNP fragments.
r
Both of these fragments must be selected.
r
The only valid model for a two-fragment standard is the Linear model.
These three requirements enable you to successfully run the SNP analysis, even if you do not
select the mobility calibration, but the values obtained might vary slightly.
If you want to correct for the mobility differences between the reference fragments and each
of the four possible dye-labeled SNP fragments, use the Advanced tab of the Analysis
Parameters window to select the SNP Dye Mobility Calibration (see "Advanced Tab" on page
210).
NOTE The SNP Ver. 1 Dye Mobility Calibration is for use with the GenomeLab SNP Primer Extension Kit and
the SNP Ver. 2 calibration is for use with the GenomeLab SNPStart Primer Extension Kit.
GenomeLab Genetic Analysis System User’s Guide
PN A29142-AB
209
Fragment Analysis Module
Defining Fragment Analysis Parameters
Advanced Tab
Set additional fragment analysis parameters. From this window, you can assign dye mobility
correction values to compensate for the varying effects of different dyes on fragment mobility,
select a standard mobility reference, and indicate whether to use the dye spectra from sample
data or from saved system spectra.
Figure 6.16 Fragment Analysis Parameters Window - Advanced Tab
Mobility
Set up the mobility parameters for the current analysis.
r
Dye Mobility Calibration specifies the calibration from the options available in the list.
Based on your selection, this option adjusts migration times or mobility to compensate
for the varying effects of different dyes on fragment mobility. To choose a value, select
any of the following options from the drop-down list:
r
PA ver.1: Select this option when analyzing samples made from primers labeled with
the phosphoramidite dyes (D2-PA, D3-PA, or D4-PA).
r
AE ver.2: Select this option to improve calibration and size estimates for primers
labeled with the active ester dyes (D1, D2, D3, or D4).
r
AE ver.1: Select this option for the Fragment Analysis test sample.
r
SNP ver 1: Select this option when performing an SNP analysis using the GenomeLab
SNP Primer Extension. The SNP analysis can proceed if you do not select this
mobility correction, but the values obtained may vary slightly.
r
SNP ver 2: Select this option when performing a SNP analysis using the GenomeLab
SNPStart Primer Extension Kit.
210
GenomeLab Genetic Analysis System User’s Guide
PN A29142-AB
Fragment Analysis Module
Defining Fragment Analysis Parameters
r
No Correction: Keep this default value when you do not want the system to make any
compensation for dye effects on fragment mobility.
NOTE When performing a Fragment Analysis Test Sample, you must use the AE ver.1 dye mobility
calibration for correct sizing of the fragments.
Dye Spectra
Dye Spectra values are calculations of the relative emission intensities of each dye in each of
the four detection channels. The system calculates these values during each analysis and uses
them to transform the four electropherogram channels to dye signal traces for each of the dye
labels present in the sample.
When unable to calculate a dye spectrum from the sample, the analysis process terminates
unless system dye spectra are available.
The Dye Spectra options allow you to select an existing set of dye spectra to use instead of
estimating the dye spectra from each sample.
NOTE This option can shorten the analysis time by up to 50%.
The system stores only one set of system spectra, used automatically when the system cannot
estimate one or more of the needed spectra from the sample data.
Select one of these Dye Spectra options:
r
Use calculated dye spectra: This default setting specifies using the set of dye spectra
obtained from the sample data.
r
Use system dye spectra: When you select this option, you must also select each Dye check
box for the dye traces you want generated. This setting applies the system dye spectra to
the data, instead of estimating the dye spectra from the current sample being run.
NOTE The system dye spectra is established when running the Fragment Analysis Test Sample during
installation when viewing the Dye Matrices window for a sample result in which spectra for all four dye labels
were estimated.
After you run a Fragment Analysis Test Sample, the system displays a Spectral Matrix of this
sample in the single result view under the Dye Matrices tab, which provides a Save as System
Dye Spectra option.
GenomeLab Genetic Analysis System User’s Guide
PN A29142-AB
211
Fragment Analysis Module
Using the STR Locus Tag Editor
6.5
Using the STR Locus Tag Editor
The STR Locus Tag Editor allows you to create a new Short Tandem Repeat (STR) Locus Tag
or edit an existing one to be used for STR analysis. You can access this editor from the STR
Locus Tag tab of the Analysis Parameters window (see "STR Locus Tags Tab" on page 206).
Figure 6.17 Locus Tag Editor
The Locus Tag Editor contains two tabs for creating or editing locus tags: the Locus Tag tab
and the Allele ID Criteria tab. The top of the window displays the locus name and project.
You can save new or edited locus tags to a selected project for use in additional analyses.
Locus Tab
Use the Locus Tag tab to define the general locus and supplementary reporting information.
These parameters include the fragment size range, repeat unit length, and the dye to be used.
This is the minimum amount of information necessary to generate an allele list.
Locus Information
The Locus Information area of the window contains parameters used to generate a list of
expected alleles in your analysis. Locus Information includes the following fields:
212
r
Locus Name: Enter a locus identification in this field. This is an optional field.
r
Dye: Select the dye to be used for the locus from the drop-down list.
GenomeLab Genetic Analysis System User’s Guide
PN A29142-AB
Fragment Analysis Module
Using the STR Locus Tag Editor
r
Fragment length range between: Enter the fragment length range (the minimum and
maximum fragment size associated with the locus) in these two fields. This defines the
range in which the system searches for the particular fragment.
r
Repeat unit length: Enter the length of the repeat unit that represents the allele.
r
# of repeats in shortest Allele: Select the number of repeats in the shortest allele from the
drop-down list. Variant alleles that contain a particular repeat are designated by a
decimal, followed by the number of bases in the partial repeat. For example, a variant
allele with the designation 5.3 contains 5 complete repeat units and a partial repeat unit
of 3 nucleotides.
Naming Alleles
Select the method in which the system labels the identified alleles in the fragment list. For
example, you can label the alleles the same as their expected fragment size in nucleotides
(163, 164, 167,... etc.), in alphabetic order (A, B, C,...etc.), or in simple numeric order (1, 2,
3,...etc.).
Select the method in which to name the alleles in the fragment list:
r
Nominal size: Select this option to label the alleles by their nominal fragment size.
r
Alphabetic: Select this option to label the alleles in lettered order, then select the letter in
the Start at field.
r
Numeric: Select this option to label the alleles in numeric order, then select the number in
the Start at field.
NOTE With the exception of Ploidy, the following fields are not required for any part of the analysis. They are
used for supplementary reporting purposes only.
Ancillary Information
The Ancillary Information area of the window allows you to select any supplementary
reporting information to include with the locus tag parameters. This area includes the
following fields:
r
Primer set name: Enter the name of the primer set.
r
GenBank Accession: Enter the GenBank Accession Number.
r
Repeat unit sequence: Enter the sequence of the repeat unit associated with the locus tag.
r
Ploidy: Enter the number of alleles associated with the locus tag.
Primer Label (Optional)
The Primer Label area of the window allows you to indicate (for supplementary reporting
purposes) on which strand the primer is labeled with the dye. You may choose one of these
options:
r
Forward: Select this option if the primer is dye labeled on the forward strand.
r
Reverse: Select this option if the primer is dye labeled on the reverse strand.
r
None: Select this option if you do not want to indicate which strand the primer is dye
labeled.
GenomeLab Genetic Analysis System User’s Guide
PN A29142-AB
213
Fragment Analysis Module
Using the STR Locus Tag Editor
Primer Sequence (Optional)
The Primer Sequence area of the window allows you to indicate (for supplementary reporting
purposes) the specific sequence of the primer used. This can be up to 128 characters.
r
Forward: If you labeled the primer on the forward strand, enter the sequence of the
primer in the 5' to 3' direction.
r
Reverse: If you labeled the primer on the reverse strand, enter the sequence of the primer
in the 5' to 3' direction.
Generating an Allele List
After setting the locus values, click Generate Allele List to begin creating the allele list.
The system generates an allele list from the information provided. The allele list starts at the
low end of the fragment length range. It creates an allele at each perfect repeat length until it
reaches the end of the fragment length range.
The Allele List defines each allele under the following columns:
r
ID: Uses the allele naming convention described in the section above.
r
Nominal Size: Displays the generated fragment lengths as the initial integer values. You
can modify these values to represent the allele sizes that appear when the data is
analyzed. The nominal sizes are also displayed in the apparent size column, but these
will usually be edited or regenerated.
r
Apparent Size: Displays the fragment lengths, which are either entered using the locus tag
editor, generated by interpolation or regression from an incomplete list, or generated
from the automatic binning analysis feature (see "Performing Bin Analysis" on page
233).
When apparent fragment lengths are user-entered or generated by interpolation or linear
regression, you must enter the nominal sizes. When the apparent fragment lengths are
generated by binning analysis, the nominal sizes are automatically generated.
Refer to the following pages for more information regarding generation of the allele list
using interpolation or linear regression.
r
Std. Dev. and Num. Points: Describe the number of points included in each bin and the
sample standard deviation. Both of these columns are generated using the automatic
binning feature (see "Performing Bin Analysis" on page 233) and are empty for allele
lists not based on a bin analysis.
r
Comment: Displays any user comments associated with the allele.
Interpolation and Linear Regression
You can generate an allele list from a list of nominal sizes and a partial list of apparent sizes
using Interpolation and Linear Regression.
214
r
Interpolation calculates the apparent fragment sizes between two selected points.
r
Linear Regression calculates the “line of best fit” for the selected alleles. The system uses
this line to determine the apparent sizes for all points not selected. This option requires
you to select more than two apparent fragment sizes.
GenomeLab Genetic Analysis System User’s Guide
PN A29142-AB
Fragment Analysis Module
Using the STR Locus Tag Editor
To generate an allele list using one of these methods:
1.
Individually edit the apparent fragment sizes within the allele list from which you want
to generate interpolation or a linear regression line.
2.
Select the alleles you want to use for generating the allele apparent sizes:
3.
r
To select the rows within the allele list, click the row header of the allele list.
r
To select multiple consecutive alleles, press and hold the Shift key while dragging
through the headers.
r
To select non-consecutive rows, press and hold the Ctrl key while selecting each of
the rows with the left mouse button.
Right-click your selection and select Interpolate or Regression.
The Interpolation or Linear Regression function replaces existing or missing apparent
fragment sizes or supplies the generated values.
Allele ID Criteria
The Allele ID Criteria tab contains the parameters used to accurately identify your alleles and
to set these “true” alleles apart from various other anomalies identified in the fragment list.
A sample fragment represents a particular allele if its apparent size is similar to the size of a
particular allele fragment in the allele list. However, because both the sequence and size of a
fragment affects its mobility, the nominal allele size will not likely be the same as its apparent
size. Therefore, the system identifies the alleles based on their “closeness” to an apparent size,
using a user-defined confidence level.
Confidence Interval
You can either enter the confidence interval manually or generate it automatically using the
bin analysis. When automatically generated, the value displayed depends on the overall
standard deviation computed in the bin analysis and the user-specified confidence level
(default = 95%). When you manually enter the confidence interval, the system uses the
entered value and the confidence level to estimate an overall standard deviation.
Increasing the confidence interval increases the width of the bins. You should set the
confidence interval to a value less than 0.5 nt.
If you enter a value of zero in the Confidence Interval field, the system uses only the standard
deviation of the estimated sample fragment size in the statistical test used to identify a
fragment as corresponding to an allele.
When you enter the confidence interval, the allele identification will not correspond to an
error probability estimated from actual data, but is still a useful relative indicator of the
“goodness” of the match.
r
If would like to overwrite the confidence interval value generated by automatic binning,
select Overwrite system interval value check box.
r
If you are overwriting the system generated value, specify a confidence interval (number
of nucleotides (+/-)) in the field provided.
GenomeLab Genetic Analysis System User’s Guide
PN A29142-AB
215
Fragment Analysis Module
Using the STR Locus Tag Editor
Figure 6.18 Locus Tag Editor Window - Allele ID Criteria Tab
Stutter Definition
Stutter consists of small peaks, generally DNA amplification artifacts that form as a result of
halted polymerase activity. When this happens, allele fragments form that differ in length
from the true allele by an integral number of repeats (such as n-1, n-2, etc.). The absolute size
of a fragment is a function of the variety of repeats (for example, dinucleotides,
trinucleotides, etc.).
The Stutter Definition area of the window allows you to set the parameters for which the
system can identify these peaks as stutter and not as true alleles.
r
Search for Stutter: Select this option if you want the system to search for stutter. When
selected, you must also choose at least one of the stutter options below it.
r
Stutter detection window width: Select the number of repeats to specify the width of the
window around each allele in which the system detects the stutter.
r
Maximum relative stutter peak height: Enter the height percent of the stutter relative to the
true allele below which detected peaks are considered stutters. Peaks above this
threshold are considered unknown alleles.
r
Detect stutter shorter than allele: Select this option to detect stutters shorter than (occurring
prior to) the allele.
216
GenomeLab Genetic Analysis System User’s Guide
PN A29142-AB
Fragment Analysis Module
Using the STR Locus Tag Editor
r
Detect stutter longer than allele: Select this option to detect stutters longer than (occurring
after to) the allele.
Spurious Peak Detection
Spurious peaks are generally small trace artifacts detected as a result of sample contaminants.
These peaks tend to have a different shape than fragment peaks but often fall within the size
range of a locus tag and are detected. However, they generally do not meet the criteria to be
identified as known alleles and are therefore labeled as “spurious” peaks.
The Spurious Peak Detection area allows you to direct the system to look for spurious peaks
in your analysis. You can specify a height threshold under which the system identifies a peak
as a contaminant and not include it in your allele list.
To enable this option:
1.
Select Detect spurious peaks if you want the system to remove any peaks that are below the
maximum height threshold for spurious peaks.
2.
In the Maximum height for spurious peak field, enter the percent of the spurious peak
relative to the true allele below which detected peaks are considered spurious peaks.
+A Detection
+A Detection is an allele calling criteria used to compensate for a common DNA polymerase
phenomenon of adding a “non-template directed” deoxyadenosine to the ends of PCR
products. The result is a mixture of PCR products. Some of which are template “true length”
(called “-A” products) while others are one nucleotide longer (called “+A” products).
The ratio of these two types of products can vary greatly between different reactions and
primers. The result of having different fragment sizes from a single allele complicates the
interpretation of fragment analysis data. Instead of one peak for one allele, there may be two
that represent the same allele spaced one nucleotide apart.
The +A Detection area of the window allows you to specify how the system will differentiate
between the true allele and the +A allele product.
NOTE You can select more than one of these check boxes at a time. Read through the following descriptions
or refer to the tables below to see how these selections affect +A Detection and the allele peak assignments.
r
Apparent size includes +A: Selecting this check box indicates that the sizes entered into the
Apparent Size column of the allele list were for the +A fragments. The parameter affects
where the system looks for peaks when identifying alleles.
r
Detect +/- A: Selecting or clearing this check box determines:
r
r
When Detect +/- A is checked, the system identifies in the fragment list either the +A
or -A peaks. The system then identifies one of them as the true allele based on your
selection in the Use +A peak to call allele check box. It designates the other peak as
either +A or -A accordingly.
r
When Detect +/- A is not checked, the system identifies one of the two alleles as the
true allele based on the Use +A peak to call allele check box. It considers other peaks
on the fragment list as unknown alleles.
Use +A peak to call Allele: Select this check box if the +A form is expected to be the higher
peak and leave it unchecked if the -A form is expected to be the higher peak.
GenomeLab Genetic Analysis System User’s Guide
PN A29142-AB
217
Fragment Analysis Module
Using the STR Locus Tag Editor
r
If the Use +A peak to call allele box is checked, the system identifies the +A peak as
the true allele in the fragment list when the Detect +/- A box is also checked. It
designates the other peak as either +A or -A accordingly.
r
If the Use +A peak to call allele box is not checked, the system identifies the +A peak
as the true allele in the fragment list when the Detect +/- A box is also not checked.
The other peak will be included in the fragment list as an unknown allele.
r
If the Detect Spurious Peaks check box is selected and the peak falls below the
maximum height designation for spurious peaks, the other peak will be included in
the fragment list as a spurious peak.
NOTE The only time that Use +A peak to call allele is checked while the Detect +/-A is not checked is when
there is complete conversion of the PCR product to +A. When neither Use +A peak to call allele nor Detect
+/-A are checked, no +/-A labeling can occur.
In general, the reproducibility of size estimates is better for higher peaks than for lower peaks.
Therefore, it is good practice to direct the system to use the higher of the peaks associated
with the allele to identify the allele.
Additionally, it is generally a good idea to check the Detect +/- A option so the system correctly
categorizes peaks. If the option is incorrectly configured, the alleles are still identified, but the
+A and -A peaks are frequently categorized as unknown alleles and the system reports “Too
many alleles” in the Comment column of the fragment data table.
Table 6.13 Apparent Size Adjustments
+A Detection
Use +A Peak to Call Allele
Use +A Peak to Call Allele
Apparent Size Includes +A
Not Checked
Checked
No Size Adjustment
One nucleotide is subtracted from
the apparent size of the allele in
the allele list.
One nucleotide is added to the
apparent size of the allele in the
allele list.
No Size Adjustment
Checked
Apparent Size Includes +A
Not Checked
218
GenomeLab Genetic Analysis System User’s Guide
PN A29142-AB
Fragment Analysis Module
Using the SNP Locus Tag Editor
Table 6.14 Truth Table for Setting +A Allele Identification
+A Detection
Use +A Peak to Call Allele
Checked
Use +A Peak to Call Allele
Not Checked
6.6
Detect +/- A
Detect +/- A
Checked
Not Checked
All fragments assumed to be +A.
The +A fragment is identified as the
allele in the allele table.
Fragments without +A (if any) are
identified as -A peaks or spurious
peaks.
All fragments assumed to be +A.
The +A fragment is identified as
the allele in the allele table.
Fragments without +A (if any) are
identified as unknown alleles or
spurious peaks.
All fragments assumed not to be +A.
Any fragments without +A are
identified as the allele in the allele
table.
Fragments with +A are identified as
+A peaks or spurious peaks.
All fragments assumed not to be
+A.
Any fragments without +A are
identified as the allele in the allele
table.
Fragments with +A are identified
as unknown alleles or spurious
peaks.
Using the SNP Locus Tag Editor
Use the SNP Locus Tag Editor to create a new SNP locus tag or edit an existing one to be used
for SNP analysis. You can access this editor from the SNP Locus Tag tab of the Analysis
Parameters window (see "SNP Locus Tags Tab" on page 208).
Figure 6.19 SNP Locus Tag Editor Window - Creating a New Locus Tag
GenomeLab Genetic Analysis System User’s Guide
PN A29142-AB
219
Fragment Analysis Module
Using the SNP Locus Tag Editor
The Locus Tag Editor provides the following fields:
r
Locus Tag: Enter or edit the name of the locus tag in this field.
r
Project: Select the project to which the new or edited locus should be saved.
r
Locus Name: Enter the identification of the locus in the field. This is the locus tag name
that appears in the fragment list for all fragments that belong to this locus.
r
Apparent Fragment Size: Enter a real number greater than 0 and less than or equal to 150.
This represents the estimated size in nucleotides that the user expects for fragments
belonging to this locus.
r
Ploidy: This field is inactive for this system release.
r
Allele ID’s for: This area provides fields for Allele IDs D1, D2, D3, and D4. Each field accepts
8 character alphanumeric values used to label the Allele ID’s in the fragment list. The
default values are A, T, G & C. These fields cannot be blank.
r
Accession # and Primer Sequence fields are not used for analysis and are for supplementary
reporting purposes only. These fields are optional.
Apparent sizes of SNP probe fragments as estimated with SNP reference fragments often differ
more from actual sizes than the STR allele fragments do. This is due to the effects of primary
structure on fragment mobilities.
Therefore, it is important that the apparent size entered into the SNP locus tag definition is a
known value. This is best determined in preliminary runs as the average apparent size of all of
the possible variants that might occur in a Study.
Because the effects of different dye labels are relatively greater on shorter fragments, it is
essential that in include the Dye Mobility Calibration in the parameter set for an SNP analysis.
Result Set Filtering
The first steps in creating a Study involve applying a set of fragment analysis parameters to
analyze the raw sample data. These parameters are specifically configured to process the
fragment data for a particular sample or set of samples. The outcome of this analysis is a
result set of data consisting of characterized fragments and identified alleles.
You can then use specific filters to scrutinize and selectively isolate results based on the
parameters of the applied filters. In other words, the types of exclusions that you apply to the
data “filter-out” all unwanted results from your Study. This process is known as “result set
filtering.”
220
GenomeLab Genetic Analysis System User’s Guide
PN A29142-AB
Fragment Analysis Module
Using the SNP Locus Tag Editor
Accessing the Result Set View
You can view the Result Set View while working with a Study using one of these methods:
r
Select View | View Result Set.
r
Click the Results Set
toolbar icon.
Figure 6.20 Result Set View Window - Second Level Filtering
The Result Set View window provides three key elements:
r
Fragment Results table displays all analyzed samples, both included and excluded, that
have been selected for the Study. The displayed columns are user-defined and can be
modified to show a number of different system variables and information.
r
Exclusion Filter Set area is where the user-defined exclusion filters are selected and
applied to the data. Each column contains a menu of parameters to be applied as
exclusion filters. The system comes equipped with one pre-defined sets of exclusion
filters. You can create, modify, and save additional filter sets.
r
Summary area displays a table that identifies the number of analyses that have been
affected by the application of exclusion filters. As the result set is manipulated, you can
view the number of samples that have been excluded from your Study based on your
filter set parameters.
GenomeLab Genetic Analysis System User’s Guide
PN A29142-AB
221
Fragment Analysis Module
Using the SNP Locus Tag Editor
NOTE The Filter Sets applied to the Result Set data (2nd Level Filtering) are different from the Filter Sets
applied to the Fragment List data (3rd Level Filtering). In the Result Set, you apply filters to an entire sample
that might contain numerous fragments. In the Fragment List, you apply filters to individual fragments that
have been identified within the various samples. See "Using Fragment Lists" on page 231 for more
information.
Applying Exclusion Filters to the Result Set Data
A Filter Set is a collection of any number of filters that are either pre-defined by the system or
user-defined. The purpose of the Filter Set is to exclude any results that do not meet the
criteria of the Study and to include results that do.
For example, suppose that your result set contains multiple samples collected under two
different sets of fragment analysis parameters. One of these parameter sets used the
SizeStandard-400 to determine the fragment sizes while the second parameter set used the
SizeStandard-600 to make the determination.
To exclude any data that were analyzed with the SizeStandard-600:
1.
Open the drop-down list in the Name column of the Filter Set area and select SS (Size
Standard).
2.
Open the drop-down list in the Operator column of the Filter Set area and select =.
3.
Open the drop-down list in the Values column of the Filter Set area and type in
SizeStandard-600.
4.
Click Apply at the top of the Filter Set area.
All samples in the fragment results table that used the SizeStandard-600 are highlighted in teal
(visible by selecting this parameter for display). This indicates that they have been excluded
from the Study. The Excluded column in the Summary area has increased by the number of
samples using the SizeStandard-600.
There are many filters available. You must apply each one using an operator and a value. You
can apply any number of filters to a result set and save the filter sets for future use.
You can assign filter sets to filter out samples with excessive baseline noise, excessively broad
peaks, no size standard, out of calibration range, etc.
This “second level” filtering leaves only the results you are sure of and saves you the time of
removing unwanted fragment data later.
Finding Exclusion Filters
You can find all of the exclusion filters in the drop-down list available in the Name column of
the Filter Set area. Once you have selected the name of the filter to use, you must select an
operator (usually +, <, >=, etc.) and a value to be applied to the filter.
Refer to the online help for detailed descriptions of the available exclusion filters and their
use.
222
GenomeLab Genetic Analysis System User’s Guide
PN A29142-AB
Fragment Analysis Module
Using the SNP Locus Tag Editor
Viewing the Summary
The Summary area displays a table that identifies the number of samples that have been
affected by the application of exclusion filters. As you manipulate the result set, you can view
the number of samples excluded from your Study based on your filter set parameters.
The Summary displays the following:
r
The number of results that are included in result set within each sample capillary (A-H).
As samples are filtered out of the result set by the exclusion filters, they are moved from
this row to the “excluded” row.
r
The number of results that have been excluded from the result set by the exclusion
filters.
r
The total number of all samples, both included and excluded, that are part of the result
set.
Customizing the Result Set View
You can define the fragment result components available in the Result Set View. You can also
modify them using right-click commands. These commands allow you to select specific
columns to display in the fragment results, customize the arrangement of fragment results
information, and modify several other parameters of the fragment results.
For details on using the Column Selector window, the Column Sort window, and other
display parameters, see "Customizing the Results List" on page 248.
Viewing Electropherogram Data
You can view individual sample traces at any time, either individually or in selected groups
along with the parameters used or collected during the separation and analysis steps. Sample
traces can also be stacked or overlaid on top of one another for comparison purposes. All of
these features are available through the right-click menus whenever a single or collection of
samples is highlighted.
Single Sample View
Single Sample View displays all of the available information for an individual data sample,
including the collected trace views, fragment data, separation and analysis parameters, the
calibration curve, the run log, and more.
To access this information, right-click on the highlighted sample (or multiple samples) from
any of the data or fragment lists and select Show Single Result .
GenomeLab Genetic Analysis System User’s Guide
PN A29142-AB
223
Fragment Analysis Module
Using the SNP Locus Tag Editor
Figure 6.21 Single Result View
The top of the Single Result window displays the name of the individual data sample selected.
All of the information pertaining to the data sample is distributed under several different tabs
within this window.
Table 6.15 provides a brief description of the components of each of the tabs in the Single
Result View.
NOTE Refer to the online help for detailed descriptions of each of the available tabs in the Single Result
View.
Table 6.15 Information Available in the Single Result View
Tab
224
Description
Fragment Data
Displays a plot of the dye signal traces.
Raw Data
Displays a plot of the raw, four-channel electropherogram.
Fragment List
Displays a list of all fragments that meet the minimum relative height criterion
set in the parameter set. This view displays all available fragment properties.
Current
Displays a graph of the separation current versus time for the duration of the
separation event.
Inject Current
Displays a graph of the injection current versus time for the duration of the
injection event.
Voltage
Displays a graph of the separation voltage versus time for the duration of the
separation event.
GenomeLab Genetic Analysis System User’s Guide
PN A29142-AB
Fragment Analysis Module
Using the SNP Locus Tag Editor
Table 6.15 Information Available in the Single Result View
Tab
Description
Analysis Log
Displays the list of messages generated by the primary analysis program
during the analysis of the selected result. The analysis log contains
information that can help determine the cause of an analysis failure.
Run Log
Displays the list of messages generated by the instrument during the
pre-separation and separation events of the eight samples that include the
individual selected result. Use the Run Log to troubleshoot the data in the case
of a run failure.
Analysis Parameters
Displays a summary of the fragment analysis parameters applied to the raw
data in the selected result.
Quantitation
Displays a summary of the peak information used to estimate fragment
amounts within the selected result.
STR Locus Tags
Displays a list of STR locus tags that have been applied to the raw data in the
selected result.
SNP Locus Tags
Displays a list of SNP locus tags that have been applied to the raw data in the
selected result.
Size Calibration
Displays a description of the size standards and calibration curve used to
calculate the sizes of the unknown fragments in the selected result.
Dye Matrices
Displays the dye spectra and dye mobility calibration parameters used in
generating the selected result.
General/Notes
Displays a list of system and user-generated notes specific to the selected
result (for example, sample name, dates, database location, and hardware
information).
Property Set
Displays a list of user-defined property fields and the values associated with
the selected result. These parameters may be edited.
Method/Consumables
Displays a summary of the separation methods, consumable parts and lot
numbers that were used with the selected result.
GenomeLab Genetic Analysis System User’s Guide
PN A29142-AB
225
Fragment Analysis Module
Using the SNP Locus Tag Editor
Trace Copies
To copy a trace as an image to the clipboard, right-click on the trace and select Copy (see
Figure 6.22).
Figure 6.22 Copying a Trace to the Clipboard
226
GenomeLab Genetic Analysis System User’s Guide
PN A29142-AB
Fragment Analysis Module
Using the SNP Locus Tag Editor
The system copies subtitles with the image, as shown in Figure 6.23. To paste the image in
other software, use the Paste command.
Figure 6.23 Trace with Labels
Stacked Graph
The Stacked Graph function aligns the electropherograms of selected results by size or time.
Zooming and scrolling on the x-axis is synchronous between all plots selected while the
y-axis of each plot selected is independently scaled, based on the available data.
To access this function, right-click the selected results from any of the results or fragment lists
and select Show Stacked Graph.
Overlay Graph
The Overlay Graph function superimposes the electropherograms of selected results on a
single x/y plot. To access the Overlay Graph, right-click the selected results from any of the
results or fragment lists and select Show Overlay Graph.
This function has two different modes. The default mode, Zoom, allows you to draw a
rectangular box around a selected area to zoom into. The second mode, Subset Selection,
allows you to select a group of peaks and add them to a Stacked Graph view. To switch
between the two modes, select the appropriate icon button from the EgramBand toolbar.
Include/Exclude Results
You can exclude results automatically using filter sets or manually by selecting the Exclude
Results command. You can re-include any excluded results at any time using the Include
Results / Peaks command available in the right-click menu.
GenomeLab Genetic Analysis System User’s Guide
PN A29142-AB
227
Fragment Analysis Module
Using the SNP Locus Tag Editor
To re-include results that were excluded in the Study, right-click the selected samples from
any of the data or fragment lists and select Include Results.
When displaying excluded results, the screen uses a color code:
r
Teal shading identifies results excluded automatically using filter sets.
r
Maroon shading identifies results excluded manually.
r
Light gray shading identifies previously excluded results that have been re-included.
You can hide both filtered and manually excluded results from view by de-selecting the Show
Excluded command available in the right-click menu.
NOTE Refer to the online help for detailed descriptions of each of these and other display parameters.
Re-Analyzing Results
The Fragment Analysis module contains a Reanalyze Results feature that allows you to select
one or more samples from the Result Set view to be re-analyzed. This allows you to apply a
different set of fragment analysis parameters to a previously analyzed data set to pick up
missed peaks or to avoid picking up unwanted peaks. The data resulting from the re-analysis
automatically replaces the older Result Set data, allowing you to quickly continue with your
Study.
To re-analyze the results:
1.
Select one or more results from the Result Set View.
2.
Right-click the selected results and select Reanalyze Results.
Reanalyze presents the following options:
3.
228
r
From Sample Data replaces the previous analysis result with a complete new
analysis, from raw data
r
Using New Parameters allows you to modify the analysis parameters previously
used
r
Using Additional/Edited Locus Tags does not change the basis analysis, but allows
you to modify allele identification
When selected, a message box opens prompting you to verify that you want to replace
the selected results with re-analyzed results.
GenomeLab Genetic Analysis System User’s Guide
PN A29142-AB
Fragment Analysis Module
Using the SNP Locus Tag Editor
4.
Click Yes to proceed with the re-analysis. The appropriate Fragment Analysis Parameters
dialog window opens, allowing you to select a new or edited set of parameters to use for
re-analyzing the data.
Figure 6.24 Selecting a Parameter Set to be used for Re-Analysis
NOTE For details on selecting, creating, editing, and saving Fragment Analysis Parameter Sets, see
"Defining Fragment Analysis Parameters" on page 200.
5.
Select an Analysis Parameter Set.
6.
Click Next to proceed to the Analyze Data window.
GenomeLab Genetic Analysis System User’s Guide
PN A29142-AB
229
Fragment Analysis Module
Using the SNP Locus Tag Editor
Figure 6.25 Re-Analyzing the Data
NOTE For details regarding the data analysis process, see "Analyzing the Data" on page 198.
7.
Click Analyze. During analysis, the system activates a progress bar and displays an
analysis log for each sample analyzed. When finished, the status column indicates if the
re-analysis passed or failed for each sample selected for re-analysis.
NOTE To stop an analysis currently in progress, click Stop. The system stops the analysis after completing
the sample in progress.
8.
9.
Review the analysis log:
a.
Select a sample in the upper samples list.
b.
Scroll through the analysis information in the lower analysis log area of the window.
Click Finish to return to the Result Set View.
When finished re-analyzing the data, the system removes the initially selected results from
the Study and replaces it with the re-analyzed results. The screen refreshes the Result Set
View, including the Summary area, with the new data and reapplies the selected filters to the
entire set of data.
NOTE Refer to the online help for detailed descriptions of the Re-Analysis process.
230
GenomeLab Genetic Analysis System User’s Guide
PN A29142-AB
Fragment Analysis Module
Using Fragment Lists
6.7
Using Fragment Lists
The Fragment List window allows you to view and modify the results of the fragment data
identified in the Study. You may perform a third-level of filtering on this fragment list by
applying additional exclusion filters.
Accessing the Fragment List View
To access the Fragment List view, use one of these methods:
r
Select View | View Fragment List.
r
Click the Fragment List
toolbar icon.
The Fragment List window opens, as shown in the following example.
Figure 6.26 Fragment List Window
The Fragment List displays a table of all analyzed fragments included in the Study. You can
modify the columns displayed to show different system variables and information.
You can use the Filter Set area to define and select exclusion filters you want applied to the
fragment data. Create, modify, and save filter sets. Each Filter Set column provides a
right-click menu of parameters you can use to apply as exclusion filters.
NOTE The Filter Sets applied to the Result Set data (second-level filtering) are different from the Filter Sets
applied to the Fragment List data (third-level filtering). You can apply filters to the Result Set to filter an
entire sample that may contain numerous fragments. You can also apply filters to the Fragment List to filter
individual fragments identified within the various samples.
GenomeLab Genetic Analysis System User’s Guide
PN A29142-AB
231
Fragment Analysis Module
Using Fragment Lists
Applying Exclusion Filters to the Fragment List
Use the exclusion filter set is to exclude any fragments that do not meet the criteria of the
Study and to include fragments that do.
NOTE Refer to the online help for information and examples regarding the application of various filters to the
Fragment List.
The system provides many filters, which you can apply using an operator and a value. You
can apply any number of filters to a result set and save it for future use.
You can assign filter sets to filter out fragments in which no confidence interval was
estimated, those with asymmetric peaks, stutter peaks, etc.
This third-level filtering keeps only the sample data with fragments that you are certain of,
which saves you the time of “weeding out” inaccurate fragment data later in the analysis.
Available Exclusion Filters
You can find all of the exclusion filters using the drop-down list available in the Name column
of the Filter Set area. After selecting the name of the filter to use, you must select an operator
(usually +, <, >=, etc.) and a value to apply to the filter.
NOTE For details on using the Column Selector window, the Column Sort window, and other display
parameters, see "Customizing the Results List" on page 248.
Customizing the Fragment List
You can define and modify the Fragment List components using the right-click menus. These
commands allow you to select specific columns for display in the fragment list, customize the
arrangement of fragment list information, and modify several other parameters of the
fragment list.
For details regarding the Column Selector window, the Column Sort window, and other
display parameters, see “Customizing the Fragment List” sections of the online help.
Manually Selecting Peaks for the Fragment List
Manually select peaks you want to add to or clear from a fragment list or building a new one
from scratch.
To access this function, right-click within the fragment list and select Manually Select Peak.
When selected, the system asks if you want to clear the existing fragment list. Choose one of
the following:
r
Click No if you want to keep the list but add or remove peaks from it.
r
Click Yes if you want to discard the system-generated list and start over.
Exporting a Fragment List to CSV File
You can export the fragment list to other third-party spreadsheet programs. To export the
fragment list:
232
1.
Right-click the selected samples from any of the data or fragment lists.
2.
Select Export to CSV File. The Export window opens.
GenomeLab Genetic Analysis System User’s Guide
PN A29142-AB
Fragment Analysis Module
Performing Bin Analysis
3.
Select a name and location to save the file.
NOTE See "Exporting Fragment Lists or Genotypes from a Study" on page 259 for more information
regarding data export.
Showing a Stacked Graph
The Stacked Graph function aligns individual selected traces by size or time. Zooming and
scrolling on the x-axis is synchronous between all plots selected while the y-axis of each plot
selected is independently scaled, based on the available data.
To access this function, right-click the selected samples in the fragment list and select the
Show Stacked Graph.
Including, Excluding & Resetting Peaks in the Fragment List
You can individually include or exclude peaks from the existing fragment list:
r
To include a peak in the fragment list, right-click the selected fragments and select the
Include Peak.
r
To exclude a peak in the fragment list, right-click the selected fragments and select the
Exclude Peak.
An updated stacked trace view, from which you can select the peaks of interest:
1.
Left-click the peak of interest to select it.
2.
Right-click to display the peak menu.
r
r
To display all fragments excluded from the fragment list, select Show Excluded
Fragments.
To reset peaks modified in the fragment list to their original configuration, select
Reset Peak.
6.8
Performing Bin Analysis
“Binning” is a one-dimensional clustering, by size, of fragments compiled from multiple
samples. You can use bin analysis to generate an allele list that represents the population you
are studying. For example, you might want to use this to establish a database of information
on alleles and possible anomalies associated with them (such as imperfect repeats).
Binning of alleles from multiple samples allow you to create a new allele list or update an
existing allele list for a locus tag based on the collection of fragment results.
During bin analysis, the system groups fragments by size to form “bins” characterized by an
average apparent size and standard deviation of the fragments in the bin.
Setting up a Bin Analysis
Bin analysis requires an exiting result set, either from a previously saved Study or a new Study
created exclusively for this purpose.
To set up a bin analysis:
1.
Open the result set you want to analyze.
2.
Select Analysis | New Binning Analysis.
GenomeLab Genetic Analysis System User’s Guide
PN A29142-AB
233
Fragment Analysis Module
Performing Bin Analysis
NOTE As an alternative, you can access Bin Analysis from the Analyses tab of the Study Explorer.
The New Binning Analysis window opens, as shown in the following illustration.
Figure 6.27 New Binning Analysis Window - Bin Parameters
NOTE Bin Analysis requires a minimum of 10 samples.
Defining Parameters
The first step in creating a new bin analysis is to set the bin analysis parameters. These
parameters identify the fragment list data you want to include in the bin analysis. By setting
these parameters you define the appearance of the view generated. After they are set, the
system uses the information from the selected result set to generate a scatter plot. The plot
consists of all of the analyzed fragment data displayed as a function of the peak height
(y-axis) and fragment length (x-axis).
To set the bin analysis parameters:
1.
Select the dye used during the raw data analysis from the Dye drop-down list.
NOTE You can examine only one dye at a time during each bin analysis.
2.
Enter the fragment range (the minimum and maximum fragment size) in the Fragment
Range From and To fields.
234
3.
Enter the Maximum Bin Width (maximum difference between the smallest and largest
fragments within a bin) in nucleotides.
4.
Enter the Minimum Data Points Per Bin (the limiting number of points necessary to form a
bin in the scatter plot).
GenomeLab Genetic Analysis System User’s Guide
PN A29142-AB
Fragment Analysis Module
Performing Bin Analysis
5.
Enter the length of the repeat unit of the allele in the Repeat Unit Length field.
6.
Select the preferred allele naming convention (see "Naming Alleles" on page 213).
7.
Click Next. The system applies the new parameters to the scatter plot and assigns the bins
as specified.
Figure 6.28 New Binning Analysis Window - Bin Analysis View
Viewing Bin Analysis
After applying the bin analysis parameters to the selected data, the system displays the results
of the bin analysis. This bin analysis view is composed of three areas representing the selected
results.
Bin View
The Bin View consists of a scatter plot diagram showing the Fragment Size (x-axis) versus the
Relative Signal Strength (y-axis). The points plotted represent the results selected when you
created the Study. The bins are defined and visible with the majority of the result points
within their borders.
Allele List
The system develops the initial Allele List from information provided in the first window of
the Bin parameters plus the data from the fragment list (see previous). After completing the
analysis, you can correct the allele list using the following options:
r
Phase Shift: Enter an integer value (nucleotide) in either direction to move all identified
bins. This overrides the system-determined position of perfect repeat alleles.
GenomeLab Genetic Analysis System User’s Guide
PN A29142-AB
235
Fragment Analysis Module
Performing Bin Analysis
r
r
Minimum Relative Peak Height: Enter a value to exclude any data points generated from
small “noise” peaks. The relative peak height is calculated in the color and size range
specified in the initial binning parameters window.
Show Phantom Bins: Select Show Phantom Bins () to highlight the area of all
system-generated phantom bins.
The system generates phantom bins at all intervening positions for whole number
nominal sizes not already assigned to a bin. Phantom bins encompass expected fragment
sizes (based on other observed sizes) that may or may not be present in the data set.
To convert phantom bins to real bins (alleles), right-click the desired bin location and
select Create Allele. The system adds a line to the Allele List representing the new bin,
which you should check for consistency.
Trace Views
At the bottom of the Trace Views area, select Show Bins () to display the bins with each trace
shown in the stacked trace views.
Investigating Points
Position your mouse-pointer over any point in the Bin View plot and left-click to select it.
The Trace View displays a trace for the selected point. You can use this trace as a visual
comparison to other points. The visual comparison of the two traces help you confirm
assigning a data point to an already defined bin, or to a new bin of its own.
The system assigns a Name and Bin ID using the naming and ID conventions selected in the bin
analysis parameters window. The ID assigned by the system reflects the bin number with a
decimal point and the number of bases over that of the bins.
For example: ID = 5.2 indicates a fragment with 5 repeats and 2 extra bases. If you prefer a
different allele ID, you can click the system suggested ID and make changes. The final
classification is up to you.
Continue selecting points and viewing their traces until you are satisfied with all the points in
the histogram.
The system stores the information for a new allele or the modified information of an existing
one, which you can apply in later records. The system automatically recalculates the statistics
based on the edited results.
236
GenomeLab Genetic Analysis System User’s Guide
PN A29142-AB
Fragment Analysis Module
Performing Bin Analysis
Updating the Locus Tag and Allele List
After completing the bin analysis, the system generates an allele list based on the information
gathered during the analysis. It updates the list, but at this point has saved it to the database.
The system prompts you for the locus tag to save to the generated allele list.
Figure 6.29 New Binning Analysis Window - Updating Locus Tag
You can use this window to select an existing Locus Tag from the drop-down list or add any
Ancillary Information to the selected locus tag at this time.
Save the new data to the selected locus tag to update the allele list with Locus Information,
including Dye, Size, and Repeat Unit Length.
NOTE Refer to "Locus Tab" on page 212 or "Using the SNP Locus Tag Editor" on page 219 for more
information about locus tag parameters.
The system saves the following information:
r
Observed Size (bin mean)
r
Bin Minimum & Maximum
r
Standard Deviation
r
# of Data Points
r
Minimum Peak Height
r
X and Y coordinates of all the data points in the plot (stored as additional information)
GenomeLab Genetic Analysis System User’s Guide
PN A29142-AB
237
Fragment Analysis Module
Performing Bin Analysis
The system automatically updates the allele list with the new information obtained during the
bin analysis.
Reviewing the Source Data
After applying the Bin Analysis parameters to the data, selecting the reference and trace
points, and updating the locus tag and allele list, you can review the source data for all
included samples before completing the Bin Analysis.
The Fragment Results table and Summary area list all of the data samples included in the Bin
Analysis. You may view and compare individual samples manually to include or exclude
individual samples or groups of samples from the analysis and re-analyze selected samples.
Figure 6.30 New Binning Analysis window - Reviewing the Source Data
Click Finish to add the Bin Analysis to your Study.
238
GenomeLab Genetic Analysis System User’s Guide
PN A29142-AB
Fragment Analysis Module
Calculating Peak Ratios
6.9
Calculating Peak Ratios
After creating a Study, you can begin Peak Ratio calculations. Peak Ratio calculations analyze
a Study result to quantify the amount of DNA present in a fragment. The system calculates
the DNA quantity as a relative comparison to a user-defined reference peak.
Beginning a Peak Ratio Calculation
When viewing an exiting Study, select Analysis | New Peak Ratio to calculate peak ratios. The
Peak Ratios window opens.
Figure 6.31 New Peak Ratio Window
The Peak Ratios window displays all of the result data and the selected parameters used to
quantify the amount of DNA present in your sample.
Reference Result Peaks
This area shows the selected reference and test peak information. You select the reference
result, which contains the best reference and test peaks for the system to use for a relative
analytical comparison of trace peaks.
You may select any number of test peaks, but only one reference peak for each Peak Ratio
Analysis.
Analysis Parameters
r Use Peak Height: Select this option to perform a quantitation based on peak height
(Relative Fluorescence Units (RFU)).
GenomeLab Genetic Analysis System User’s Guide
PN A29142-AB
239
Fragment Analysis Module
Calculating Peak Ratios
r
Use Peak Area: Select this option to perform a quantitation based on peak area (mm x
RFU).
r
Reference Peak Known Quantity: (Optional) If desired, enter the known quantity of your
reference peak in the field. You must enter this value in scientific notation. Select the
units for the quantity from the drop-down list. The options are moles, grams, molarity, and
g/L. The system uses this information to calculate the quantity of DNA in the other
results.
Highlight Variation
r Highlight Variant Ratios: Select this option to enable the system to highlight any result
ratios that deviate from average values. The criteria for variant ratios are specified by
either the Standard Deviation about the mean or the % Error:
r
Standard Deviation: Select this option to base the system criteria for identifying any
variant ratios on the number of standard deviations from the mean. Enter the
standard deviation number as the value a ratio must meet before the system
considers the ratio a variant.
r
% Error: Select this option to enable the system to base its criteria for identifying any
variant ratios on the percentage of error. Enter the percent value of error the system
allows a ratio to reach before it considers the ratio to be variant.
Peak Ratio Result Table
The system performs the analysis based on the selected reference and at least one test peak.
r
Show Excluded: Select this option if you want the result table to display peaks excluded
from the analysis.
The Peak Ratio Result Table displays details in the following columns:
r
Status: Displays an R if the result has been selected as a reference.
r
Result Name: Displays the result name.
r
Ratio R/T: Displays the ratio of the reference peak to the test peak.
r
Ratio T/R: Displays the ratio of the test peak to the reference peak.
r
Timestamp: Displays the time the quantitation was performed.
r
Sample Name: Displays the sample name.
r
Reference Peak Height: Displays the height of the selected reference peak.
r
Test Peak Height: Displays the height of the selected test peak.
r
Test Peak Quantity: Displays the calculated quantity of the test peak based on user-supplied
reference values.
r
Comments: Displays any user comments associated with the result.
Mean, Data Points & Standard Deviation
The lower-left area of the Peak Ratio window displays system-generated values for each of the
calculated columns in the Peak Ratio Result Table. Based on the reference and test peaks
selected, the system calculates the Mean, the # of Data Points, and the Standard Deviation.
240
GenomeLab Genetic Analysis System User’s Guide
PN A29142-AB
Fragment Analysis Module
Calculating Peak Ratios
Selecting a Reference Trace
A reference trace is a user-selected trace assigned as a reference by the system for comparative
analysis of peak height and area. You can select the reference trace from either the Peak Ratio
Result Table or from the Fragment Result Set Traces areas of the window.
r
To select the reference trace from the Peak Ratio Result Table, right-click your selection
and select Set Result As Reference.
The system highlights the result trace with a dark background and moves the trace to the
top of the Result Set Traces area of the window to distinguish it as the reference result
trace. It marks the fragment result with an R in the left-most column to distinguish it as
the reference trace.
r
To de-select the reference result, right-click the reference result and select Set Result As
Reference again to toggle the command to the “off” position (unchecked).
The system removes the R from the de-selected trace and returns it to its original
highlight status and position in the Fragment Result Set Traces area of the window.
r
To select the reference peak from the Result Set Traces area, right-click your selection
and select Reference.
The system highlights the result trace with a dark background and moves the trace to the
top of the Result Set Traces area of the window to distinguish it as the reference result
trace. It marks the corresponding result with an R in the left-most column to distinguish
it as the reference peak.
r
To de-select the reference result, right-click the reference result trace and select Reference
again to toggle the command to the “off” position (unchecked).
The system removes the R from the de-selected trace returns it to its original highlight
status and position in the Fragment Result Set Traces area of the window.
Selecting a Reference Peak
A reference peak is a trace peak you select from the reference result trace. The system
compares the reference peak to the test peak, calculates a relative length, height, and area,
then adds the results to the Peak Ratio Results Table.
r
To select the reference peak, right-click an individual peak from the selected Result Set
Trace located at the top of the Fragment Result Set Traces area of the window and select
Reference Peak.
The system then calculates the length, area, and height of the test peaks by comparison
and enters this information into the Quantitation Result Table.
r
To de-select the reference peak from the Reference Result Peaks table, right-click the
reference peak and select Set Peak As Reference again to toggle the command to the “off”
position (unchecked).
r
To de-select the reference peak from the Fragment Result Set Traces area, right-click the
reference peak and select Peak | Reference to remove the check mark.
GenomeLab Genetic Analysis System User’s Guide
PN A29142-AB
241
Fragment Analysis Module
Performing AFLP Analysis
Selecting a Test Peak
A test peak is a trace peak that you select from the reference result trace. The system
compares the test peak to the reference peak, calculates a relative height and area, then adds
the results to the Peak Ratio Results Table.
r
To select the test peak, right-click an individual peak from the selected Result Set Trace,
located at the top of the Result Set Traces area of the window, and select Test Peak.
The system calculates the area and height by comparing it with the reference peak, then
enters this information into the Peak Ratio Result Table. It uses each selected test peak to
calculate ratios with the corresponding reference peak of the same trace.
r
Select test peaks in the same manner until all desired peaks are identified.
r
To de-select a test peak from the Reference Result Peaks table, right-click the test peak
and select Set Peak As Test to toggle the command to the “off” position (unchecked).
r
To de-select a test peak from the Fragment Result Set Traces area, right-click the test
peak and select Peak | Test to remove the check mark.
6.10 Performing AFLP Analysis
Amplified Fragment Length Polymorphism (AFLP) Analysis is a highly sensitive DNA
fingerprinting technique that relies on the selective amplification of restriction fragments
from a total digest of genomic DNA.
The CE system includes AFLP Fingerprint analysis, which allows you to rapidly score AFLP
fingerprints with output in a text format, which is compatible with most statistical and
pattern matching system. The AFLP analysis tool is a cluster analysis module that scores the
presence or absence of a fragment of a given size per sample.
Using the AFLP Feature
The AFLP feature takes all results from the Study and creates bins from fragments with sizes
that fall within a user-defined bin width.
For each of the possible fragments in the Study, the system assigns a “1” if it finds a fragment
in that sample and assigns it a “0” if the fragment is absent. It then creates a table of 1’s and
0’s. You can export the text to most other statistical analysis and spreadsheet software.
242
GenomeLab Genetic Analysis System User’s Guide
PN A29142-AB
Fragment Analysis Module
Performing AFLP Analysis
Setting the AFLP Analysis Parameters
To start a new AFLP analysis, select Analysis | New AFLP Analysis. The New AFLP window
opens.
NOTE You can also access this from the Analyses tab of the Study Explorer.
Figure 6.32 New AFLP Window
ALFP Analysis Parameters
The analysis parameters area allows you to set filtering parameters for including or excluding
fragment results in your AFLP analysis.
r
Maximum Bin Width: Sets the limiting value given to the width of the individual bins. The
default value is 1.0 nt. Enter the value in nucleotides.
Within each dye label, the system clusters the fragments with the sizes that fall within
the set bin width and creates a bin with the size rounded to the next integer.
r
Y Threshold: Serves as a exclusion filter, defining the lowest acceptable value (peak
height) for the y-axis. The default value is zero RFU. Set the y-threshold in relative
fluorescence units (RFU).
The system excludes fragments with heights less than this threshold value from the
clustering process.
r
Exclude Fully Populated Bins: Select this option to exclude bins represented in all samples
(such as non-polymorphic fragments).
r
Exclude Samples without Qualifying Peaks: Select this option to exclude samples that have no
qualifying peaks.
ALFP Dyes
The Dyes fields determine the dye colors the system uses during the cluster analysis.
If the results list contains samples with fragments that have more than one dye (either
multiple dye-labeled fragments pooled in a sample or multiple samples with single
dye-labeled fragments in each sample), you can select the appropriate dyes for export.
GenomeLab Genetic Analysis System User’s Guide
PN A29142-AB
243
Fragment Analysis Module
Performing AFLP Analysis
Starting a New AFLP Analysis
After setting the analysis parameters, click OK to generate the New AFLP Analysis.
Figure 6.33 New AFLP Analysis Window
Viewing the Cluster Analysis
After completing the clustering operation, the system displays a table showing the results of
the AFLP analysis. You can format this table as either rows or columns of data for easy export
to a third-party software program for further analysis (see sample axis below).
This table presents the data in rows or columns as follows:
r
Bin: Displays the bin number. It assigns bins with A and B suffixes if two adjacent bins
fall in the same integer after rounding the Bin X Mean.
r
Dye: Displays the dye included.
r
Samples: Displays the sample count within the bin.
r
Fragments: Displays the fragment count within the bin.
r
X-Min: Displays the minimum fragment size within the bin.
r
X-Max: Displays the maximum fragment size within the bin.
r
X-Mean: Displays the mean fragment size within the bin.
r
X-Var: Displays the fragment size variation within the bin.
r
Y-Mean: Displays the mean peak height within the bin.
r
Numbered headings: Show the number of sample components (peaks/fragments) within
each bin for each sample.
244
GenomeLab Genetic Analysis System User’s Guide
PN A29142-AB
Fragment Analysis Module
Performing AFLP Analysis
Setting Cluster Analysis Parameters
The selections available at the bottom of the AFLP Cluster Analysis window provides
additional settings that affect the values and output format of the fields displayed.
You can select one of the following Sample Bin options:
r
Fragment Count: Displays the number of components within each sample bin as either
zero components, one component, or multiple components.
r
r
Binary Presence: Indicates the binary presence or absence within each sample bin.
Fragments Max Y: Displays the absolute peak height of the fragments within each sample
bin.
Select one or more of the following options to modify the displayed details:
r
Exclude Fully Populated Bins: Excludes bins that are represented in all samples (such as
non-polymorphic fragments).
r
Exclude Samples without Qualifying Peaks: Excludes samples that have no qualifying peaks.
r
Show Excluded Elements: Highlights all fragment data that was excluded from the analysis.
r
Sample Axis: Arranges the table presentation by either Rows or Columns. As an alternative,
you can switch between these views using the right-click menu. To do this, select the
row or column heading, then select Transpose.
The following fields let you make additional adjustments to both the width and threshold:
r
Maximum Bin Width: Sets the limiting value given to the width of the individual bins. The
default value is 1.0 nt. Enter the value in nucleotides.
Within each dye label, the system clusters the fragments with the sizes that fall within
the set bin width and creates a bin with the size rounded to the next integer.
r
Y Threshold: Serves as a exclusion filter, defining the lowest acceptable value (peak
height) for the y-axis. The default value is zero RFU. Set the y-threshold in relative
fluorescence units (RFU).
The system excludes fragments with heights less than this threshold value from the
clustering process.
NOTE You can reduce the chance of finding multiple components in a bin by decreasing the bin width.
GenomeLab Genetic Analysis System User’s Guide
PN A29142-AB
245
Fragment Analysis Module
Performing LOH Analysis
Customizing the AFLP Table
The components of the cluster analysis are user-defined. You can modify them using the
right-click menus. These commands allow you to select specific columns for display in the
fragment list, customize the arrangement of fragment list information, and modify several
other parameters of the fragment list.
NOTE See "Customizing the Results List" on page 248 for details regarding how to use the Column Selector
window, the Column Sort window, and other display parameters.
Exporting the AFLP Analysis Results
To export the AFLP analysis results:
1.
Select File | Export AFLP. The Export AFLP window opens.
2.
Select a file name and destination folder for the data.
3.
Click Save.
Some third-party software may require that you export the sample information in a specific
format. When choosing to display the sample names in rows, you can display the alleles in
separate columns or in one column. You can include the Bin Labels in the file by checking the
appropriate boxes in the Export File Format for file export.
The Dyes parameters determine the dye color the system uses during the cluster analysis. If
the results list contains samples with fragments that have more than one dye (either multiple
dye-labeled fragments pooled in a sample or multiple samples with single dye-labeled
fragments in each sample), you can select the appropriate dyes to be exported.
6.11 Performing LOH Analysis
The Fragment Analysis module comes equipped with a macro that is intended to detect Loss
of Heterozygosity (LOH) between alleles from Normal (reference) samples and those from
other samples.
In LOH Analysis, pairs of samples to be compared must have the same “root” names followed
by characters that allow the distinction between reference and test samples or loci. All data to
be analyzed reside in a temporary file created by the System Fragment Analysis application.
The macro scans the fragment results contained in the Study to determine the loci to include
in the LOH analysis. For each result in the Study, a list of alleles is then generated at each
locus. The peak heights of alleles identified in similarly named samples are then compared
and their status determined (LOH, AI, MI, Homozygous, NoNorm Alleles).
246
GenomeLab Genetic Analysis System User’s Guide
PN A29142-AB
Fragment Analysis Module
Performing LOH Analysis
To start LOH Analysis:
1.
Select Analysis | Run LOH Analysis to launch Microsoft ExcelTM . The LOH.xml file
opens, displaying the START sheet.
Figure 6.34 Run LOH Analysis
NOTE You must select Enable Macros to run the LOH Analysis; otherwise, a prompt reminds you to enable
this feature.
2.
From the LOH.xls START sheet, set the LOH Threshold (and the AI Threshold if desired).
3.
Specify the unique character combination used to identify Normal samples or loci (i.e.
Norm).
4.
Specify whether Normal and Tumor samples are in the same well:
5.
r
If you are running Normal and Tumor samples are run in the same well, select the
corresponding check box.
r
If Normal and Tumor samples are in different wells, clear this check box.
Click Start .
NOTE Do not use the keyboard or the mouse during LOH analysis.
6.
If desired, save the results when the processing is complete.
NOTE To save the data correctly, you must save the LOH Analysis results as a Microsoft Excel Workbook
(*.xls) file type. You must also change the file name from the default name displayed in the Save As... dialog
box; otherwise, the system saves result as a temporary file, which it will overwrite in the next LOH Analysis.
NOTE If more than two alleles are found for a locus, the last allele listed for the locus will be followed by an
asterisk (“*”).
GenomeLab Genetic Analysis System User’s Guide
PN A29142-AB
247
Fragment Analysis Module
Customizing the Results List
6.12 Customizing the Results List
The components of the results list are user-defined. You can modify them using the right-click
menus. These commands allow you to select specific columns to display in the results list,
customize the arrangement of information, add or remove columns, and modify several other
parameters of the results displayed. Customized lists are available in the Result Set View, the
Fragment List, AFLP Analysis, and Peak Ratio tables.
Selecting Columns for Display
The Column Selector window contains a list of all possible columns that you can display in
the list. You can select these columns individually or in groups, arrange them in any order,
and lock them so they always remain in view when scrolling through the fragment list.
Accessing the Column Selector Window
To access the Column Selector window, right-click the column header area of the list to
display, then select Select Columns. The Column Selector window opens, as shown in the
following example.
Figure 6.35 Column Selector window - Selecting Columns for Display in the Table
NOTE The application area in which you select the Column Selector window (such as Result Set View,
Fragment List, or AFLP Cluster Analysis) determines which columns are available for display.
NOTE Refer to the online help for detailed descriptions of the available columns and their use.
Selecting Columns for Display
r Highlight the column selection in the Possible Columns area of the window and click the
right-arrow to move the selection to the Selected Columns area of the window.
r
248
To select all columns for display in the list, click the double-right-arrow.
GenomeLab Genetic Analysis System User’s Guide
PN A29142-AB
Fragment Analysis Module
Customizing the Results List
r
To remove columns from the Selected Columns area, highlight the column selection and
click the left-arrow to move the selection back to the Possible Columns area.
r
To remove all columns from the list, right-click the header and select the Hide Column.
Arranging the Column Display
You can arrange the left-to-right order of columns in the list by ordering the columns
top-to-bottom in the Selected Columns area of the Column Selector window:
r
Highlight the column selection in the Selected Columns area and click either the
up-arrow or down-arrow buttons to move the column to the selected location.
r
Order the columns top-to-bottom in the Selected Columns area relative to the
left-to-right order you want the columns to be displayed in the fragment result table.
Locking the Column Position
You can lock selected columns into position so they remain in view as you scroll across the
remaining columns in the list. This helps when the results list contains multiple columns of
data which require left-to-right scrolling and you want to keep a particular column (such as
the result name or status) always in view.
r
To lock a column, highlight the column in the Selected Columns area of the Column
Selector window and click Lock. A lock icon appears next to the selected column to
indicate that the column position is locked.
NOTE This also locks all columns positioned above the lock location in the Selected Columns area, and thus
to the left of the locked position in the list. If this includes columns that you do not want locked, use the
positioning arrows to move the columns out of the lock range.
r
If the view is filled with locked columns, you may not be able to scroll through the grid.
If this happens, reduce the number or widths of the locked columns
r
To move the lock position to a different column location, click up-arrow/lock or
down-arrow/lock in the Column Selector window.
r
To remove the column lock, click Unlock in the Column Selector window.
r
To lock and unlock columns directly from the fragment result table, right-click the
column header and select Lock Column or Unlock Column.
Sorting the Results List
You can sort the components of the results list in ascending or descending order for any of the
column parameters displayed. For example, you can sort the results list by ascending bin
number, descending bin fragment count, etc. You can sort columns in the Result Set View, the
Fragment List, AFLP Analysis, and Peak Ratios tables.
Sorting an Individual Column
r Right-click the header of the column you want to sort and select Sort Column. The system
sorts the column in either ascending or descending order, depending on the order in
which it was previously arranged.
r
To sort the same column in the reverse order, right-click the header and select Sort
Column again.
GenomeLab Genetic Analysis System User’s Guide
PN A29142-AB
249
Fragment Analysis Module
Customizing the Results List
Accessing the Column Sort Window
To access the Column Sort window, right-click the column header area of the fragment list
and select Sort Columns.
Figure 6.36 Column Sort Window - Sorting the Results List Data Columns
To sort a column:
1.
Select the column parameter you want to be sort from the drop-down list.
2.
Select the order in which you want the parameter sorted (Ascending or Descending).
3.
Repeat the first two steps for each additional columns that you want to sort.
4.
Click OK to sort the list.
NOTE See the online help for more information on these and other display modifications.
250
GenomeLab Genetic Analysis System User’s Guide
PN A29142-AB
Fragment Analysis Module
Reporting Results
6.13 Reporting Results
The CE system software includes a powerful suite of utilities for creating reports. It also
allows you to export data and results to other third-party software packages.
Figure 6.37 New Report Dialog Box
All of the reporting features available in the Fragment Analysis module are located under the
Reports tab of the Study Explorer. In addition, you can generate a new report using the
Reports menu located on the menu bar.
The New Report window allows you to select the type of report you would like to generate
from a list of available report templates (see "Using Report Templates" on page 252) and
saved data. You can access the New Report window from either the Report menu or the Study
Explorer.
To create a New Report from the Report menu:
1.
Select Report | New Report to display the New Report window.
2.
Select the type of report you would like to generate from the Template drop-down list.
The selections available depend on the data contained in the open Study.
3.
Select the saved data from which you want to generate a report from the Context
drop-down menu.
4.
Click OK to display the new report containing the selected information.
To create a New Report from the Study Explorer:
1.
Select the Reports tab available at the bottom of the Study Explorer frame of the window.
GenomeLab Genetic Analysis System User’s Guide
PN A29142-AB
251
Fragment Analysis Module
Reporting Results
2.
Right-click to highlight the type of report you would like to generate from the list of
those available in the Reports tab and select New. The New Report window opens,
displaying the Context Type for your selection.
3.
Select the report template from the Template drop-down menu. The selections available
depend on the Context Type.
4.
Click OK to display the new report containing the selected information.
Using Report Templates
There are several types of elements in each report template:
r
Header text for data, tables, or graphs. For example Bin Scatter plot
r
Regular Data Objects. For example: Context.Locus.Name (Locus)
r
Loop Delimiters. For example: BeginLoop: Allele = Context.Locus.Alleles
ID:
Allele.ID
Nominal Size:
FormatNumber(Allele.TrueSize, 0)
Apparent Size:
FormatNumber(Allele.ApparentSize, 2)
Standard Deviation:
FormatNumber(Sqr(Allele.FragmentSizeVariance))
Number of Data Points:
Allele.FragmentCount
Comment:
Allele.Comment
EndLoop: Allele = Context.Locus.Alleles
r
Table Delimiters:
TableLoop: Allele = Context.Locus.Alleles
ID
Nominal Size (nt) Apparent Size (nt)
Standard
Deviation (nt)
Allele.ID
FormatNumber
(Allele.TrueSize,
0)
FormatNumber
Allele.Fragment-Count
(Sqr(Allele.Frag-m
entSizeVariance))
r
252
FormatNumber
(Allele.ApparentSize, 2)
Num. Points
Comments
Allele.Comment
Graph Objects. For example:
Graph: Service.BinGraph (Context, Site, DisplayOptions)
GenomeLab Genetic Analysis System User’s Guide
PN A29142-AB
Fragment Analysis Module
Reporting Results
r
Graph Placeholder pictures, as shown in the following example.
Figure 6.38 Placeholder Pictures
You can edit or remove header text at will. Use the header text provided in the Report
Templates to identify the data objects that follow.
You can remove, but should not edit, the data object descriptions, highlighted in gray, because
they are specifically coded to extract data from the database. Do not overwrite the original
report template .doc files. They contain a compilation of all available data objects for
reporting.
Use loop delimiters or table iterations of similar data. While the data object names may
appear squashed in the report template, if the data fits in the space provided, the tables should
look normal in the report.
Graph objects and graph placeholders must remain together for proper graph display.
Editing Graph Displays
You can edit five features of the graph displays: 1) X scale type. 2) X-axis scale, 3) Y-axis scale,
4) Pane Count or Pane Width, and 5) Dyes displayed.
To edit the graph:
1.
Right-click the graph placeholder and select Format Object.
2.
Select the Web tab and create the following text:
<DisplayOptions
(Your commands will go here)
/>
X-Scale Type
The possible values for XScaleType are Default, BySize, and ByTime. XscaleType only applies to
electropherogram view. Default allows the graph type to determine whether to display by size
or by time. If you do not specify the XScaleType attribute, it defaults to Default.
GenomeLab Genetic Analysis System User’s Guide
PN A29142-AB
253
Fragment Analysis Module
Reporting Results
In the DisplayOptions section of the alternative text box, enter by size or time as follows:
<DisplayOptions
XScaleType="BySize"
/>
OR
<DisplayOptions
XScaleType="ByTime"
/>
X-Axis
X-axis values specify either the size or the time, depending on the XScaleType. If either or both
are not specified, they take on the minimum and maximum values from Unzoom all graph.
In the DisplayOptions section of the alternative text box, enter minimum and maximum values
as follows:
<DisplayOptions
XScaleType="BySize"
MinX="100"
MaxX="300"
/>
Y-Axis
In the DisplayOptions section of the alternative text box, enter minimum and maximum values
as follows:
<DisplayOptions
XScaleType="BySize"
MinX="100"
MaxX="300"
MinY="0"
MaxY="10000"
/>
If you do not specify either or both MinY and MaxY, they take on the minimum and maximum
values from Unzoom all graph.
Pane Count or the Pane Width
You may specify either PaneCount or PaneWidth:
r
If you specify PaneCount, it represents the number of panes in which to break the graph.
If you do not specify either PaneCount or PaneWidth, the system uses the default PaneCount
of 1. PaneCount is an integer.
r
If you specify PaneWidth, it represents either the size or time per pane, depending on the
XScaleType. The graph is broken into ((MaxX - MinX) / PaneWidth) full sized panes, as well
as one additional pane if required for the remaining data. PaneWidth is a float.
In the DisplayOptions section of the Alternative text: box, enter the desired number of panes to
distribute the X-axis range of data over as follows:
254
GenomeLab Genetic Analysis System User’s Guide
PN A29142-AB
Fragment Analysis Module
Reporting Results
<DisplayOptions
XScaleType="BySize"
MinX="100"
MaxX="300"
MinY="0"
MaxY="10000"
PaneCount="3"
/>
Dyes Displayed on the Graph
SelectedDyes are dye selection options. It allows the e-gram graph to select which dye to
report. The Fragment Analysis view dye visibility does not affect this option. The possible
value for SelectedDyes are all, 1, 2, 3, 4 or combination of 1, 2, 3, 4. All displays all four dyes.
By default, the display for the four dyes is: 1 = D1, 2 = D2 etc.
In the DisplayOptions section of the alternative text box, enter the desired dyes as follows:
<DisplayOptions
XScaleType="BySize"
MinX="100"
MaxX="300"
MinY="0"
MaxY="10000"
PaneCount="3"
SelectedDyes="1,4"
/>
GenomeLab Genetic Analysis System User’s Guide
PN A29142-AB
255
Fragment Analysis Module
Exporting Results
6.14 Exporting Results
When exporting a fragment result in text format, you can include all properties. You can then
open the exported file in any text editor or MS Excel to preview the file prior to printing.
To export results:
1.
Open the Fragment Analysis module.
2.
Select File | Export Results. The Export Results window opens, as shown in the following
example.
Figure 6.39 Export Results
3.
Select the results you want to export from a list of available results located in various
projects:
a.
Select the Project that contains the sample data that you want to export from the
Project drop-down list.
b.
In the Available list, select the samples to export, then click the right-arrow (>) to
move the selection to the Selected list.
NOTE The functionality of this window is very similar to that of the Select Raw Data window described in
"Selecting the Components of the New Study" on page 194.
4.
256
When you have finished making your selections, click Next to proceed to the Export
Options window.
GenomeLab Genetic Analysis System User’s Guide
PN A29142-AB
Fragment Analysis Module
Exporting Results
5.
Define the export parameters and options, including the file name and location, using
the Export Options window, as shown in the following example.
Figure 6.40 Export Options
The Export Results - Options window provides the following fields and options:
r
Export result as: Displays the selected export file, including its file path, file name,
and extension (which identifies the file format). This is a read-only field.
To change this selection, click Save As and enter the required details to save the file
using the application’s format extension. For details, see "Text File Format" on
page 258 or "CEQ File Format" on page 259.
r
Header: Select this option to include general information regarding the sample and
run conditions with the exported results.
r
Raw Data: Select this option to include raw data with the exported results.
r
Result Data: Select this option to include dye traces and data points with the
exported results.
r
Result Output: Select this option to include a fragment list with the exported results.
r
Remove CEQ Tracking Suffix: Select this option to remove the sample plate and date
from the exported file name.
r
Resolve Filename Conflicts: Select this option to automatically append a unique
sequence number to exported files of the same name.
6.
Click Finish to complete the export application.
GenomeLab Genetic Analysis System User’s Guide
PN A29142-AB
257
Fragment Analysis Module
Exporting Results
Text File Format
You can export the results file in a text file format. The data in this file are tab delimited and
the export format has the extension *.txt.
Figure 6.41 Fragment Analysis Export Dialog Box
To export the results as a text file from the Export Results - Options window:
1.
Click Save As. Use the folder navigation options next to the Save in field to locate and
select the folder in which you want to save the export file.
2.
Enter the desired file name in the File name field.
NOTE Do not use special characters in the file name: “/ : * ? \" < > |”.
3.
Select Text (Tab Delimited) (*.txt) in the Save as type text box.
4.
Click Save. The system returns to the Export Results - Options screen, displaying the file
path to the specified text file in the Export results as field.
5.
If desired, modify the fields that apply to the text file:
a.
Select Header and/ or Result Data in the Elements section.
b.
Select Remove CEQ Tracking Suffix to automatically remove the plate position
coordinates (*.A01, *.B01, etc.) as well as the time/date stamp from the sample
name. These are generated by the CE system software.
c.
Select Resolve Filename Conflicts to enable the system to increment the sample names
on export if it encounters samples with the matching names.
6.
Click Finish.
7.
Navigate to the target folder and double-click the exported file to open it in Excel,
Notepad, or any other text editor.
You can view the properties at the beginning of the file.
258
GenomeLab Genetic Analysis System User’s Guide
PN A29142-AB
Fragment Analysis Module
Exporting Results
CEQ File Format
The CE system offers the CEQ export option from the Fragment Analysis module. You can
select *.cq* as an export file type for exporting fragment results from the Fragment Analysis
module.
Figure 6.42 Fragment Result Export Dialog Box
To export fragment results in CEQ (*.cq*) format from the Export Results - Options window:
1.
Click Save As. Use the folder navigation options next to the Save in field to locate and
select the folder in which you want to save the export file.
2.
Enter the desired file name in the File name field.
NOTE Do not use special characters in the file name: “/ : * ? \" < > |”.
3.
Select CEQ (*.cq*) from the Save as type drop-down list.
4.
Click Save. The system returns to the Export Results - Options screen, displaying the file
path to the specified CEQ file in the Export results as field.
5.
If desired, modify the fields that apply to the CEQ file:
6.
a.
Select Remove CEQ Tracking Suffix to automatically remove the plate position
coordinates (*.A01, *.B01, etc.) as well as the time/date stamp from the sample
name. These are generated by the CE system software.
b.
Select Resolve Filename Conflicts to enable the system to increment the sample names
on export if it encounters samples with the matching names.
Click Finish to export the Result Data and the Result Output.
Exporting Fragment Lists or Genotypes from a Study
This feature allows you to export the opened Study’s fragment list or genotype data. The
pedigree and genotype data included in the export come from the results included in the
opened Study.
To export the properties with a fragment result:
1.
Open the Fragment Analysis module and open a Study.
GenomeLab Genetic Analysis System User’s Guide
PN A29142-AB
259
Fragment Analysis Module
Exporting Results
2.
Select File | Export Fragment/Genotypes. The Export Fragments / Genotypes As window
opens, as shown in the following example.
Figure 6.43 Exporting Fragment Lists and Genotypes
3.
Use the folder navigation options next to the Save in field to locate and select the folder
in which you want to save the export file.
4.
Enter the desired file name in the File name field.
NOTE Do not use special characters in the file name: “/ : * ? \" < > |”.
5.
6.
Select one of the four available export formats from the Save as type drop-down list:
r
CSV (Comma) *.csv
r
Linkage (Pedin) *.pre
r
Discovery Manager (DMPopulation) *.txt
r
Genotype Summary Report (tab delimited)*.gsr
Click Save to start the process and save the export file using your specified file
parameters.
The export status, along with a processing log, appears in a status window. This window
indicates when the export procedure is complete and any export errors that may occur.
Transferring Fragment Data to eXpress Profiler
Transfer fragment data from the GeXP System to eXpress Profiler for use with normalization
of gene expression.
260
1.
From the menu options, click Fragment Analysis.
2.
Open a set of analyzed GeXP data.
3.
Select File | Transfer Fragments for GeXP.
4.
Click Transfer Fragments for GeXP as.
5.
After the dialog box appears, name the file and browse to a transfer location.
6.
Click Save to save the exported file as a CSV file. A message box will display confirming
the export process.
7.
Click OK to confirm the completion of the process and close the message box.
GenomeLab Genetic Analysis System User’s Guide
PN A29142-AB
Fragment Analysis Module
Exporting Results
For additional information on using Fragment Data in eXpress Profiler, "Importing Fragment
Analysis Data" on page 300.
Format Descriptions and Requirements for Exporting Fragment List and Genotypes
Export data along with their export requirements, by using one of the following file formats:
CSV (Comma) *.csv
Contains the export parameters of a Study’s fragment list as selected, sorted, and ordered.
Each line in the output file represents a fragment. The data in this export are comma
delimited, suitable for viewing in most third-party spreadsheet applications. The export
format has the *.csv extension.
Linkage (Pedin) *.pre
Contains the export parameters of a Study’s pedigrees and genotypes. The Pedin file can be
imported into a Linkage application’s MakePed utility program. This file includes the pedigree
and genotype information from each result in the Study. It supports up to two alleles per
locus.
The export produces three files:
r
*.pre = the Pedin file.
r
*.log = the list of processing steps and errors encountered during the export.
r
*.debug = the text file with column headings and comma separated data to aid in the
correction of errors in the *.pre file.
The Pedin export requires a list of locus names, in a file named “LocusList.txt”. You must
store this file in the CE system ...\export or root directory. This text file must have only one
locus name per line. The order of the loci included in this file determines the order of the loci
in the Pedin file.
The Pedin export also requires that every result in the Study includes the pedigree
information (at least the individual ID). It also requires that at least one result per individual
has a complete pedigree (Pedigree ID, Individual ID, Father ID, Mother ID, and Gender).
Pedigree information is associated with samples through the sample plate editor, using the
sample property sets Pedigree template. As an alternative, you can associate the pedigree
information with results, using the single result view’s property sets tab.
Discovery Manager (DMPopulation) *.txt
Contains the export parameters of a Study’s pedigrees and genotypes. The DMPopulation file
is designed to be imported into Genomica’s Discovery Manager application. The
DMPopulation file can also be imported into Discovery Manager as a DMFastPopulation file.
The pedigree and genotype information from each result in the Study is included in the
DMPopulation file.
The DMPopulation export produces two files:
r
*.txt = the DMPopulation file.
r
*.log = a list of processing steps and errors encountered during the export.
GenomeLab Genetic Analysis System User’s Guide
PN A29142-AB
261
Fragment Analysis Module
Exporting Results
The DMPopulation export requires a list of locus names, in a file named “LocusList.txt”. This
file must be stored in the CE system’s ...\export or root directory. This text file must have only
one locus name per line. The order of the loci included in this file determines the order of the
loci in the DMPopulation file.
The DMPopulation export also requires that pedigree information (at least the Individual ID) be
included in every result in the Study. Additionally, at least one result per individual must have
a complete pedigree: Population ID (PopID), Pedigree ID (KinID), Individual ID (SubID), Mother ID
(MID), Father ID (FID), and Gender (Sex).
Pedigree information is associated with samples through the sample plate editor, using the
sample property sets “Pedigree” template. As an alternative, you can associate the pedigree
information with results, using the single result view's property set tab.
Genotype Summary Report (tab delimited) *.gsr
Accommodates Subject IDs, the occurrence of more than two alleles, and the absence of
alleles, as shown in the following illustration. Use the Locus List Editor to customize the
LocusList.txt file before exporting a Genotype Summary Report. (For details, see "Creating a
Genotype Summary Report" on page 263.)
The report layout is described below:
r
Column/Row Individual headings are replaced with the heading of Subject ID.
r
If the number of alleles is greater than two, the cell will indicate Too many.
When an allele is not found, the empty cell is replaced with Unknown Allele.
Figure 6.44 Genotype Summary Report
262
GenomeLab Genetic Analysis System User’s Guide
PN A29142-AB
Fragment Analysis Module
Exporting Results
Creating a Genotype Summary Report
The Locus List (LocusList.txt) is required to create the Genotype Summary Report (GSV) and
to perform some exports. Use the Locus List Editor to customize the LocusList.txt file.
Press the F7 key or select View | Locus List Editor. The Locus List Editor opens, as shown in the
following example.
Figure 6.45 Edit Locus List Dialog Box
Table 6.16 Locus List Editor - Legend
Loci in
Database
Lists the loci from the database that have not yet been moved to the Selected Loci list.
Other Loci
Lists the loci to be removed from the LocusList.txt file.
Selected Loci
Lists the loci to be added to the LocusList.txt file.
Moves all loci from the Loci in Database and Other Loci list to the Selected Loci list.
Moves only the selected loci from the Loci in Database and Other Loci list to the Selected
Loci list.
Moves all loci from the Selected Loci list to the Loci in Database or Other Loci list. If the
loci exist in the database, moves the loci to the Loci in Database list.
Moves the selected loci from the Selected Loci list to the Loci in Database or Other Loci
list. If the loci exist in the database, moves the loci to the Loci in Database list.
Use to rearrange the list order. Select an item and click the appropriate arrow to move it
up or down the list.
GenomeLab Genetic Analysis System User’s Guide
PN A29142-AB
263
Fragment Analysis Module
Exporting Results
264
GenomeLab Genetic Analysis System User’s Guide
PN A29142-AB
Gene Expression
eXpress Profiler Overview
7Gene Expression
7.1
eXpress Profiler Overview
The GenomeLab GeXP Genetic Analysis System (GeXP System) uses a patented,
highly-multiplexed PCR* approach to efficiently examine the expression of multiple genes,
with sensitivity and speed.
Perform a multiplex gene expression analysis by completing the following procedures:
r
Design a custom multiplex using the eXpress Profiler module
r
Perform the Reverse Transcription (RT) reactions
r
Perform the PCR reactions
r
Run the PCR products on the GeXP System
r
Analyze the data using the eXpress Profiler module
This flowchart depicts the GeXP System workflow.
*The PCR process is covered by patents owned by Roche Molecular Systems, Inc.
and F. Hoffman-La Roche, Ltd.
GenomeLab Genetic Analysis System User’s Guide
PN A29142-AB
265
Gene Expression
eXpress Profiler Overview
eXpress Profiler Suite
The eXpress Profiler controller runs the eXpress Profiler Suite of applications. These
programs can be used to perform multiplex primer design, gene expression analysis and data
visualization using the data that is collected by the GeXP controller.
Using the Controller
Third-Party Software
IMPORTANT Do not install third-party software on the GenomeLab GeXP controller or the eXpress Profiler
controller.
Accessing the Internet
An active internet connection must be established when the controller is turned on, as well as
maintained by the eXpress Profiler.
IMPORTANT Relaunch the software, if the internet connection is lost at any time.
Microsoft Updates
Although they are important to the Windows software security capabilities, automatic
Microsoft Updates should not be performed on these controllers. This default setting is
turned off.
Additionally, updates to JAVA, firewall settings or the SQL interface driver could be harmful to
the eXpress Profiler controller.
266
GenomeLab Genetic Analysis System User’s Guide
PN A29142-AB
Gene Expression
Software Administration
7.2
Software Administration
Prior to the initial use of this controller, eXpress Profiler user accounts must be configured on
the controller by the Administrator. The eXpress Profiler Administrator has access to some
administration tools that are not available to the eXpress Profiler users, such as establishing
user accounts, importing multiplex data, managing genes and making primers globally
available. See Table 7.1 on page 268 for more information.
IMPORTANT The Administrator does not have the ability to design or modify the multiplex, as an eXpress
Profiler user does.
1.
To access these administration tools, double-click the GeXP Launch desktop icon.
The GenomeLab eXpress Profiler login screen opens.
Figure 7.1 GenomeLab eXpress Profiler Login Screen
2.
Log in as the Administrator by entering the username and password. The default
username and password is administrator. To change the Administrator password,
see "Changing the Administrator Password" on page 271.
NOTE All usernames and passwords are case sensitive.
3.
Click Submit.
The eXpress Profiler Welcome screen will open. A menu on the left side of the screen will
display the menu options available to the Administrator, as shown in Figure 7.2.
GenomeLab Genetic Analysis System User’s Guide
PN A29142-AB
267
Gene Expression
Software Administration
Figure 7.2 eXpress Profiler Welcome Screen -- Logged in as Administrator
The Administrator can perform the software functions noted in Table 7.1.
Table 7.1 eXpress Profiler Administrator Menu Options
Option
Function
Users
Set up user accounts. See "Managing User Accounts" on page 269.
Account
Change the password assigned to the software Administrator account. See "Managing
User Accounts" on page 269.
Manage Genes
Enter sequences without GenBank accession numbers and edit all genes in the system.
See "Managing Genes" on page 272.
Manage Primers Add primers produced in third-party software and edit all primers in the system. See
"Managing Primers" on page 274.
Universal Tags
Define the Universal Tag sequences which are appended to primer sequences created in
the eXpress Designer. See "Managing Universal Tags" on page 276.
Import Multiplex Import newly developed gene set kits, as well as user-defined multiplexes from other
GeXP systems into the database. See "Importing a Multiplex" on page 276.
268
GenomeLab Genetic Analysis System User’s Guide
PN A29142-AB
Gene Expression
Software Administration
Managing User Accounts
Set up or edit user accounts.
Creating a New User Account
1.
From the menu options, click Users.
2.
Enter the user’s first, last name, username and password.
3.
Click Save User.
Figure 7.3 eXpress Profiler - User Management Screen
Table 7.2 User Management Screen
Item
Description
First Name
The user’s first name.
Last Name
The user’s last name.
Username
The name the user must enter each time they log into the GeXP application. The
username is case-sensitive and can be any combination of letters, numbers, spaces,
up to 256 characters.
Password
The password assigned to the user. The password is case-sensitive and can be any
combination of letters, numbers, spaces up to 256 characters.
NOTE The user can change this password in the user account.
GenomeLab Genetic Analysis System User’s Guide
PN A29142-AB
269
Gene Expression
Software Administration
Viewing and Editing User Accounts
View or edit the account of an existing user.
1.
From the menu options, click Users.
2.
Select the username from the drop-down list, then click Load User. The user’s current
information appears in the fields.
3.
Edit any of the fields as needed.
4.
Click Save User.
To display a new entry screen, click Reset Form.
NOTE The Administrator can edit an existing user primarily to change the user’s password.
NOTE To optimize database speed, a generic user account can be set up for each project.
270
GenomeLab Genetic Analysis System User’s Guide
PN A29142-AB
Gene Expression
Software Administration
Changing the Administrator Password
1.
From the Administrator Menu, click Account.
2.
Click Reset Form to clear the information.
3.
Enter the new password in the password field.
4.
Click Save User.
NOTE The password is case-sensitive and can be any combination of letters, numbers, and spaces.
IMPORTANT Care must be taken when changing the default Administrator password. If the new password is
lost, contact your local Beckman Coulter representative.
Figure 7.4 eXpress Profiler Account Screen for System Administrator
GenomeLab Genetic Analysis System User’s Guide
PN A29142-AB
271
Gene Expression
Software Administration
Managing Genes
Enter proprietary gene sequences without the use of GenBank accession numbers and edit the
user-defined genes that are stored in the system.
Figure 7.5 eXpress Profiler Manage Genes Screen
Table 7.3 eXpress Profiler Manage Genes Parameters
Parameter
272
Description
Display Name
Displays the user-defined name, which appears in the Gene list box when using
eXpress Designer or Analysis, and in reports.
Accession
Displays the user-defined accession number.
FASTA
Uses the GenBank FASTA header format:
>|||Example| + descriptor
where Example is the Accession Number and descriptor is text that describes the
gene.
Sequence
Shows the gene sequence.
Hide Gene
Indicates whether the gene will appear in the eXpress Designer Genes lists.
GenomeLab Genetic Analysis System User’s Guide
PN A29142-AB
Gene Expression
Software Administration
Entering Gene Sequences
When entering gene sequences, it is essential that the gene sequence format is correct.
IMPORTANT Sequences containing IUPAC nucleic acid codes other than A,C,G,T or N, cannot be saved into
the system. Any sequence that contains unrecognized nucleic acid code will be rejected.
1.
From the menu options, click Manage Genes.
2.
In the Display Name field, enter the name to be displayed for this gene in the eXpress
Designer, Analysis, and in reports.
IMPORTANT Do not use spaces or any special characters (!@#$%^&*()_+) in the Display Name. Use an
underscore (_) instead of a space.
NOTE To avoid potential confusion, do not simulate the NCBI accession number format.
3.
Enter the same name used for the Display Name in the Accession field.
IMPORTANT The display name MUST be the same name as the Accession number.
4.
In the FASTA field, enter the primer description using this format:
>|||Example| + descriptor
Where Example is the unique accession number and descriptor is text that describes the
gene.
NOTE Before you enter the sequence, strip the base pair numbers, alignment characters and other notations
from the sequence before it is submitted.
5.
Enter the sequence in the Sequence field.
6.
Determine whether this gene will be displayed in the Genes list for the eXpress Designer
Primer Design and Multiplex functions.
To hide a gene, or remove it from being viewed by other users, select the Hide Gene
option.
7.
Click Save to save the gene to the database.
To add more genes, click Reset Form to clear the form. Enter the information for the new gene.
The Cut and Paste keystrokes do not clear the form.
IMPORTANT All changes are GLOBAL. All users can view and use the entries created under the
Administrator function, unless the Hide Gene option is selected.
Viewing and Editing Genes
1.
From the Administration Menu, click Manage Genes.
2.
Select the gene of interest from the drop-down list and click Load.
3.
Edit or update any of the fields as necessary.
4.
Rename the gene or add a version to the name, if desired.
5.
Click Save to save the modified gene to the database.
GenomeLab Genetic Analysis System User’s Guide
PN A29142-AB
273
Gene Expression
Software Administration
Managing Primers
Add primers that were produced with third-party software, view and modify user-defined
primers, and make any primer set available to all users as Reference Primers.
NOTE Genes must be previously entered using "Managing Genes" on page 272 or by FASTA, in eXpress
Designer. See page 284.
Figure 7.6 Express Profiler - Manage Primers Screen
Table 7.4 eXpress Profiler Options
Parameter
274
Description
Name
Enter the accession number and primer description. Use this format:
Accession number (native PCR product size) (native left primer start,
length)-(native right primer start, length)
Parent Gene
Choose the gene from which primers are derived. This list is populated by the
Manage Genes option, Multiplex import or by FASTA in eXpress Designer.
Left Sequence
The forward gene-specific primer sequence.
Left Primer (start,
length)
The starting nucleotide position followed by the primer length.
GenomeLab Genetic Analysis System User’s Guide
PN A29142-AB
Gene Expression
Software Administration
Parameter
Description
Left Melting
Temperatures
(Celsius)
The melting temperature of the forward primer.
Right Sequence
The reverse gene-specific primer sequence.
Right Primer (start,
length)
The ending nucleotide position followed by the primer length.
Right Melting
Temperature
(Celsius)
The melting temperature of the reverse primer.
PCR Product Size
(excluding Universal
Tags)
The PCR amplicon size produced with these primers, without Universal Tags.
Set As Reference
Primer
This option indicates whether the primer is available for Global use as a Reference
Primer in a multiplex. If it is not selected, this primer will only be available to the
Administrator and original primer designer.
NOTE Primers are stored in the database only as their native sequence. Universal tags are only appended
when a multiplex is created and account for an extra 37 base pairs. The PCR Product Size is also native.
Creating a New Primer Set
1.
From the Administrator Menu, click Manage Primers.
2.
Select the Parent Gene from the drop-down list and enter its description in the fields as
shown in Figure 7.6.
IMPORTANT The Primer Name, Parent Gene, Left and Right Sequence and PCR Product Size fields must
be entered for the new Primer. The Left and Right Primer (start, length) and Melting Temperature field
entries are optional.
IMPORTANT When naming the Primer, do not use the parental gene Accession number. Include a primer
description to prevent confusion with other primers made from the same parental gene.
For example:
3.
Click Save.
Use Reset Form to clear the form and create another primer.
IMPORTANT Make sure to select the Set as Reference Primer option to allow Global access, if the primer
will be used by multiplier users.
Loading and Modifying an Existing Primer
View or modify an existing primer, including primers designed by users.
1.
Select the primer of interest from the drop-down list.
2.
Click Load.
3.
Change the primer parameters as necessary.
4.
Select Set As Reference Primer to allow Global access.
5.
Click Save to save the changes.
GenomeLab Genetic Analysis System User’s Guide
PN A29142-AB
275
Gene Expression
Software Administration
Managing Universal Tags
Define the Universal Tag sequence that will be appended to the primer sequences that are
created in the eXpress Designer.
IMPORTANT The current GeXP chemistry only works with the default sequences. Do not modify the default
sequences.
Figure 7.7 eXpress Profiler - Manage Universal Tags Screen
Importing a Multiplex
Import gene set kit multiplexes, as well as user-defined multiplexes from another GeXP
system, into the database.
If a multiplex of interest was not created using eXpress Designer on the current eXpress
Profiler controller or if a commercial gene set kit was used, the multiplex TDF (trace
definition file) file must be imported into the database before analysis can be performed.
NOTE Visit www.beckmancoulter.com/GeXPplex for the multiplex TDF files to use with the GenomeLab
multiplex gene set kits.
Figure 7.8 eXpress Profiler - Import Multiplex Screen
276
GenomeLab Genetic Analysis System User’s Guide
PN A29142-AB
Gene Expression
Software Administration
1.
From the Administrator Menu, click Import Multiplex.
2.
Click Browse to locate the multiplex TDF file.
3.
Click on the TDF file to select it.
4.
Click Import once and wait for a message window that will confirm the process was
successful.
5.
Click OK to close the message window.
IMPORTANT All imported multiplexes are GLOBAL. All users can view and use the entries created under this
Administrator function.
IMPORTANT Once a specific TDF file has been imported, another TDF file with the same multiplex name
cannot be imported. The multiplex names must be unique.
6.
To confirm that the TDF file has been imported, log out of Administrator mode.
IMPORTANT An Administrator must have a User Account in order to access the eXpress Analysis module of
the software.
7.
Log into eXpress Profiler as a User.
8.
Click eXpress Analysis and log in, with your username and password.
9.
Click on the GeXP Analysis tab.
The multiplexes that have been saved in the database will be shown in the Multiplexes list.
Figure 7.9 Verification of the Multiplexes in GeXP Analysis
Make sure that the multiplex of interest is shown in the Multiplexes list, because gene
expression analysis relies upon the associated multiplex TDF file.
GenomeLab Genetic Analysis System User’s Guide
PN A29142-AB
277
Gene Expression
Logging in as an eXpress Profiler User
7.3
Logging in as an eXpress Profiler User
IMPORTANT User Accounts must be set up by the Administrator, prior to user login.
The eXpress Profiler Administrator creates accounts and can grant access to users to specific
projects. eXpress Profiler users log in under these non-administrative accounts and have
access to the eXpress Designer, eXpress Analysis, and eXpress Map tools.
1.
To log into the software, double-click the GeXP Launch desktop icon.
The GenomeLab eXpress Profiler login screen opens.
Figure 7.10 GenomeLab eXpress Profiler Login Screen
2. Enter your Username and Password, then click Submit. The eXpress Profiler Welcome
screen will open and display the menu options available to eXpress Profiler users.
Figure 7.11 eXpress Profiler Welcome Screen - User Login
278
GenomeLab Genetic Analysis System User’s Guide
PN A29142-AB
Gene Expression
Logging in as an eXpress Profiler User
Table 7.5 eXpress Profiler User Menu Options
Option
Function
eXpress Designer
Design custom multiplexes. See "eXpress Designer Module" on page 280.
eXpress Analysis
Visualize and analyze GeXP Multiplex Genetic Analysis data. See "eXpress
Analysis Module" on page 298.
eXpress Map
View gene expression data using visualization tools. See "eXpress Map
Module" on page 312.
Changing a User Password
NOTE The User password can also be changed by the Administrator. See "Managing User Accounts" on
page 269 for more information.
1.
To change your user password, click eXpress Designer.
2.
Click Account.
3.
Next, Reset Form to clear the information.
4.
Enter the new password in the password field.
5.
Click Save User.
NOTE The password is case-sensitive and can be any combination of letters, numbers, spaces, and special
characters.
GenomeLab Genetic Analysis System User’s Guide
PN A29142-AB
279
Gene Expression
eXpress Designer Module
7.4
eXpress Designer Module
Design a multiplex from accession numbers of target and reference genes and evaluate the
primer and amplicon sequences. Next, redesign individual primers and assemble a final
multiplex for Gene Expression profiling.
1.
From the eXpress Profiler menu, click eXpress Designer. The main screen of the eXpress
Designer will open.
Figure 7.12 eXpress Designer - Main Screen
Table 7.6 eXpress Designer Menu Options
Option
Function
eXpress
Design a “first-pass” multiplex by entering gene accession numbers. See "eXpress
Designer Module" on page 280.
FASTA
Enter and save accession numbers into the database as well as retrieve their
corresponding sequences from the database for Primer Design or for troubleshooting
purposes. See "Retrieving Gene Sequences with FASTA" on page 284.
BLAST
Confirm primer sequence quality and perform troubleshooting. See "Evaluating
Multiplex Primers" on page 286.
Primer Design
Provides advanced primer design tools. See "Creating a New Primer" on page 290.
Multiplex
Create custom multiplexes and modify existing multiplexes. See "Importing a
Multiplex" on page 276.
Account
Opens the Account screen to change the password associated with a user name. See
"Changing a User Password" on page 279.
eXpress Analysis Normalize and report gene expression data. See "eXpress Analysis Module" on page
298.
eXpress Map
280
View gene expression data in diagram form. See "eXpress Map Module" on page 312.
GenomeLab Genetic Analysis System User’s Guide
PN A29142-AB
Gene Expression
eXpress Designer Module
Designing a Multiplex with the eXpress Designer
Design a “first-pass” multiplex from accession numbers of target and reference genes.
Figure 7.13 eXpress Designer - eXpress View
Table 7.7 eXpress Designer Module Parameters
Parameter
Description
Multiplex Name
The identifier of the multiplex recognized by eXpress Profiler. The
multiplex name must be unique or else it cannot be saved to the
database. When the TDF file is opened in Excel, the multiplex name is
found in cell A2.
Minimum Separation Size
Set the minimum base pair separation size between PCR products. The
default is 7 bp. Optimal separation size is 5 to 7 bp.
NOTE The minimum separation size for multiplex design is 3 base pairs.
Maximum PCR Product Size
(excluding Universal Tags)
Set the maximum PCR product size (excluding Universal Tags). This
parameter automatically adjusts as needed to fit as many products in the
multiplex as possible. This parameter can be manually adjusted. The
maximum size is linked to the capillary electrophoresis size standards
used and should not exceed 400 bp.
Minimum PCR Product Size
(excluding Universal Tags)
Set the minimum PCR product size (excluding Universal Tags). It is
recommended to leave the default setting of 100 bp as the lowest size, to
avoid the loss of sizing of smaller products.
Universal Tags
Set in the software, by default.
WARNING Do not change the default setting. It will affect the chemistry.
Verbose Mode
GenomeLab Genetic Analysis System User’s Guide
PN A29142-AB
Use this option for troubleshooting multiplex design, such as when a
gene is excluded from a multiplex. Selecting this option provides more
detailed information regarding all available PCR products for each gene.
281
Gene Expression
eXpress Designer Module
Table 7.7 eXpress Designer Module Parameters
Parameter
Reference Primers
Description
Allows primers to be accessed by multiple users for inclusion in a
multiplex, e.g. KANr or housekeeping genes. Click on to highlight and
include this primer set in a multiplex.
NOTE New reference primers can only be added in the Administrator
mode. See "Managing Primers" on page 274 for more information.
Accession Numbers
Enter GenBank accession numbers for genes of interest. Type in as
needed or cut and paste.
NOTE Accession numbers are case sensitive.
Creating a Multiplex with Accession Numbers
Enter Accession Numbers to create a “first-pass” multiplex.
1.
Log into eXpress Designer, then click eXpress. The eXpress screen will open.
2.
Enter the information into each of the parameter fields.
NOTE Multiplex files cannot be deleted from the database. Make sure to name the multiplex so that it can be
easily identified.
For example:
First-pass Multiplex Name
Final Multiplex Name
HumanCancer_FirstPass
HumanCancer_Final
3.
Enter a multiplex name in the Save Setting field. This name represents the parameter
settings for this multiplex.
4.
Click Save Setting. The information will be saved to the database.
5.
Click Execute to generate the multiplex. The screen displays the multiplex primer data.
See Figure 7.14.
r
If the multiplex contains primers for every gene within the specified parameters,
click Save to Database.
r
If one or more genes and/or primers are not included, then reduce the minimum
separation size and click Execute to restart the multiplex formulation.
r
6.
If the single or multiple genes and/or primers are still not included, select
Verbose Mode and click Execute. Verbose Mode provides information regarding
the multiplex formulations and PCR products available for each gene. This
information can help to determine the reason why a particular gene and/or
primer was not included in the multiplex.
Click Download to save the multiplex to a TDF file.
The primer sequences can be viewed by opening the TDF file with Microsoft Excel.
Use the Load Setting drop-down list to load the multiplex settings at a later time or when
parameter adjustments are necessary.
Use Reset Form to clear the form and create another multiplex.
282
GenomeLab Genetic Analysis System User’s Guide
PN A29142-AB
Gene Expression
eXpress Designer Module
Figure 7.14 eXpress Designer - Multiplex Results
Loading Existing Multiplex Settings
1.
Log into eXpress Designer.
2.
Click eXpress. The eXpress screen will open.
3.
Click Load Setting. The screen will display a drop-down list that will include the
Multiplexes that have been previously saved.
4.
Click on and select the Multiplex of interest. The screen displays the saved multiplex
settings and the accession numbers.
5.
Make any changes as necessary and click Save Setting.
6.
Click Execute to generate the multiplex. The screen displays the multiplex primer data.
See "Modifying an Existing Multiplex" on page 296 for instructions on modifying an
existing multiplex with Multiplex Designer
GenomeLab Genetic Analysis System User’s Guide
PN A29142-AB
283
Gene Expression
eXpress Designer Module
Retrieving Gene Sequences with FASTA
Enter GenBank accession numbers to retrieve gene sequences and save them to the eXpress
Profiler database to be used for primer design. This function can also be used for
troubleshooting, by checking to make sure accession numbers match the desired gene and
have a valid sequence.
Figure 7.15 eXpress Designer - FASTA
To retrieve one or more gene sequences:
1.
Log into eXpress Designer.
2.
Click on FASTA.
3.
Enter one or more accession numbers in the text box provided.
WARNING Make sure to enter the accession number correctly. The entry of invalid accession numbers will
cause the return of incomplete results.
284
GenomeLab Genetic Analysis System User’s Guide
PN A29142-AB
Gene Expression
eXpress Designer Module
4.
Click Execute. The screen will return the single or multiple FASTA-formatted sequences,
as shown in Figure 7.16.
Figure 7.16 eXpress Designer - FASTA Sequence Results
5.
Click Save to Database, to save the sequence in the database for future use.
Viewing Existing Genes
To view a gene that was previously saved to the database, click View Existing Data. The
drop-down list will show on the screen. Genes that were previously saved can be selected and
viewed on the FASTA screen.
Figure 7.17 eXpress Designer - FASTA results
GenomeLab Genetic Analysis System User’s Guide
PN A29142-AB
285
Gene Expression
eXpress Designer Module
Evaluating Multiplex Primers
Use the BLAST function to evaluate “first-pass” multiplex primers and the resulting
amplicons, for undesirable sequences, including polymorphisms, repeats and homology and
troubleshoot primer sequences. The BLAST screen provides a direct interface with GenBank.
The parameters on the user interface are similar to those on the NCBI BLAST page.
Figure 7.18 eXpress Designer - BLAST Screen
286
1.
Enter the sequence into the Search field.
2.
Select the Mask Lower Case option (green circle) to mask repeat sequences in lowercase.
3.
Select the species from the from drop-down list (red circle).
4.
Click Execute.
GenomeLab Genetic Analysis System User’s Guide
PN A29142-AB
Gene Expression
eXpress Designer Module
The eXpress Profiler software will connect to the NCBI BLAST website and enter the queue
for BLAST results.
Figure 7.19 BLAST Screen (Searching)
The results of the BLAST search will be displayed. For more information on BLAST searches
and interpreting the results, see http://www.ncbi.nlm.nih.gov/BLAST/
Evaluating Primer and Amplicon Sequences with BLAST
Evaluate the multiplex primer and amplicon sequences from a preliminary multiplex design.
If any primer or amplicon sequence is determined to be unsatisfactory, then redesign the
primer(s) for the gene target using the Primer Design function of eXpress Designer.
Identifying Repeat Sequences
Use the BLAST function with repeat masking described above to examine the amplicon
sequence, generated by each set of primers, for repeat sequences that can led to Taq
polymerase slippage and result in stutter peaks. If repeat sequence(s) are found, redesign the
primer(s) such that a region without repeat sequence is targeted.
Identifying SNPs
Examine each primer for single nucleotide polymorphisms (SNP), especially at the 3' end,
that can lead to the preferential amplification of one allele over another. If a polymorphism is
found, redesign the primer to a more conserved region.
1.
Go to NCBI BLAST SNP website: http://www.ncbi.nlm.nih.gov/SNP/snp_blastByOrg.cgi
2.
Confirm that the Program is blastn and that Megablast will be performed.
3.
Choose a SNP BLAST Database based on the species of origin.
4.
Enter the amplicon sequence in FASTA format into the Query Sequence text box.
5.
Select the Human Repeats option to identify repeats in human gene sequences (optional).
6.
Click Submit Query. The query is entered into the NCBI queue and a Format Request page
appears.
7.
Under Format | Display, make selections for the Masking Character and Masking Color
options, to repeat mask the sequence (optional).
8.
Click View report.
10. Once the results page appears scroll down to Alignments to identify SNPs and repeats.
GenomeLab Genetic Analysis System User’s Guide
PN A29142-AB
287
Gene Expression
eXpress Designer Module
Identifying Homologous Sequences
r If a gene is a member of a gene family, has highly homologous regions or is an
alternative transcript, consider using the BLAST function (above) to verify that only
the desired gene product will be amplified with the designed primers.
r
If multiple, different genes are retrieved from the BLAST search, redesign the
primer(s) to target a region of low homology, especially at the 3' end of each primer.
Preventing Undesigned Peaks (UDPs)
Any set of primers that has the potential to generate an undesigned peak (UDP) within the
size range of the multiplex should be redesigned to prevent the production of a UDP in the
multiplex profile.
Once the primer and amplicon sequences have been reviewed, proceed with ordering and
testing the multiplex primers. Order the primers with the appropriate universal tag sequence.
IMPORTANT Do not order the KANr primers as they are included in the GeXP Start Kit Chemistry.
288
GenomeLab Genetic Analysis System User’s Guide
PN A29142-AB
Gene Expression
eXpress Designer Module
Designing Primers
Design individual sets of custom primers from difficult or proprietary gene sequences, target
or exclude a certain area of a sequence, or change the parameters to more tightly define PCR
product size for a selected gene. The Primer Design feature is useful for redesigning primers
that were rejected during primer evaluation or do not perform well within a multiplex.
In order to use Primer Design, the gene sequence must be previously entered into the
database individually or as part of a multiplex. See "Retrieving Gene Sequences with FASTA"
on page 284 or see "Managing Genes" on page 272, for more information.
NOTE The following parameters are shown on the Primer Design screen but are not used with the GeXP
system:
r
General Primer Picking Conditions
r
Other Per-Sequence Inputs
r
Sequence Quality
r
Objective Function Penalty Weights for Primers
r
Objective Function Penalty Weights for Primer Pairs
Table 7.8 Primer Design Options
Parameter
Description
Number to Return
Specify the number of primer pairs to return.
Genes
Contains all global genes (those entered by the Administrator as genes and
multiplexes) as well as all genes contained under the user’s account.
Product Size (excluding
Universal Tags)
Specify the minimum, maximum, and optimal product size to define a range
as needed.
Primer Length
Specify the minimum, maximum and optimal primer length.
WARNING Do not change the default setting (optimal 20 nt). It will affect the
chemistry.
Primer Tm
Specify the minimum, maximum and optimal primer melting temperature.
WARNING Do not change the default setting (optimal 60°C). It will affect the
chemistry.
User Left Primer Below
Specify the forward primer sequence.
Pick Hybridization Probe
Not applicable for GeXP Chemistry.
Use Right Primer Below
Specify the reverse primer sequence.
Target
Enter a region of sequence to be included in the amplicon sequence. This can
be an exon-exon junction or a single-base polymorphism.
Excluded Regions
Enter single or multiple regions to be excluded from the gene sequence, for
the purpose of primer design. This is useful for excluding regions that contain
repetitive elements, polymorphisms or a low quality sequence from being
used as primers.
GenomeLab Genetic Analysis System User’s Guide
PN A29142-AB
289
Gene Expression
eXpress Designer Module
Creating a New Primer
1.
Log into eXpress Designer.
2.
Click Primer Design. The Primer Design screen will open.
Figure 7.20 eXpress Designer - Primer Design screen - Main View
290
3.
Click and select a gene from the Genes list.
4.
Modify the primer design parameters or leave the default settings.
5.
Set the number of primer sets that are returned, by entering a number in the Number to
Return field.
6.
Click Execute.
GenomeLab Genetic Analysis System User’s Guide
PN A29142-AB
Gene Expression
eXpress Designer Module
Figure 7.21 shows an example of the Primer Design results.
Figure 7.21 eXpress Designer - Primer Design Results
7.
Click Save to Database, to save the primer pairs into the eXpress Profiler database,. These
primers become available for use in the eXpress Designer module in the Primer list box.
The primers will only become available after they have been saved.
IMPORTANT The primers entered into the database in this manner are only available for the current user. To
make a primer available for all users, see "Managing Primers" on page 274.
Entering Previously Designed Primers
Enter the previously designed primers into the eXpress Profiler database for use in multiplex
design.
1.
Log into eXpress Designer.
2.
Click FASTA.
3.
Enter the accession number for the gene of interest.
4.
Add the gene to the database by using FASTA. See "Retrieving Gene Sequences with
FASTA" on page 284 for instructions.
5.
Click on Primer Design.
6.
Choose the newly entered gene from the Genes list.
7.
Type the Left Primer and Right Primer sequences in the appropriate fields under
Advanced Options.
GenomeLab Genetic Analysis System User’s Guide
PN A29142-AB
291
Gene Expression
eXpress Designer Module
8.
Select the option to use the left primer and right primer, as shown below.
Figure 7.22 Primer Design - Selecting Primer Sequences
9.
Click Execute. The primer design results will be displayed.
10. Click Save to Database to save the results to the eXpress Profiler database.
Targeting Primer Design with Advanced Options
Include or exclude regions of a gene for primer design to prevent an undesirable sequence
from being included in the primer or amplicon sequence.
1.
Log into eXpress Designer.
2.
Click on Primer Design.
3.
Choose the gene of interest from the Genes list.
4.
Modify the primer design parameters or leave the default settings.
5.
Set the number of primer sets that are returned, by entering a number in the Number to
Return field.
6.
In the Target field, enter the region of sequence to be included in the amplicon sequence,
using the following format:
start,length
where start is the index of the first base of the target and length is the length of the
amplicon.
For example: an entry of 50,2 requires primers to surround the 2 bases at positions 50
and 51.
NOTE If a Target is specified, then it must be flanked by a legal primer pair.
7.
In the Excluded Regions field, enter a region of sequence to be excluded from primer
design, using the following format:
start,length
where start is the index of the first base of the excluded region and length is the
length of the excluded region.
For example: an entry of 401,7 68,3 excludes the selection of primers in the 7 bases,
starting at 401, as well as the 3 bases at 68.
8.
Click Execute.
9.
Click Save to database to save the results to the eXpress Profiler database.
Figure 7.23 Advanced Options - Targets/Excluded Regions
292
GenomeLab Genetic Analysis System User’s Guide
PN A29142-AB
Gene Expression
Multiplex Designer
7.5
Multiplex Designer
Modify existing multiplexes or create new multiplexes with more control over primer
selection. This feature is particularly useful for incorporating redesigned primers into a
previously designed multiplex.
Figure 7.24 eXpress Designer - Multiplex Screen
Table 7.9 Multiplex Parameters
Parameter
Description
Multiplex Name
The identifier of the multiplex recognized by eXpress Profiler. The multiplex
name must be unique or else it cannot be saved to the database. When the TDF
file is opened in Excel, the multiplex name is found in cell A2.
Minimum Separation
Size
Set the minimum base pair separation size between PCR products. The default
is 7 bp. Optimal separation size is 5 to 7 bp.
NOTE The minimum separation size for multiplex design is 3 base pairs.
Maximum PCR
Product Size
(excluding Universal
Tags)
Set the maximum PCR product size (excluding Universal Tags). This parameter
automatically adjusts as needed to fit as many products in the multiplex as
possible. This parameter can be manually adjusted. The maximum size is linked
to the capillary electrophoresis size standards used and should not exceed 400
bp.
Minimum PCR
Product Size
(excluding Universal
Tags)
Set the minimum PCR product size (excluding Universal Tags). It is
recommended to leave the default setting of 100 bp as the lowest size, to avoid
the loss of sizing of smaller products.
Universal Tags
Set in the software, by default.
WARNING Do not change the default setting. It will affect the chemistry.
GenomeLab Genetic Analysis System User’s Guide
PN A29142-AB
293
Gene Expression
Multiplex Designer
Parameter
Description
Verbose Mode
Use this option for troubleshooting multiplex design, such as when a gene is
excluded from a multiplex. Selecting this option provides more detailed
information regarding all available PCR products for each gene.
Reference Primers
Allows multiuse primers to be included in the multiplex, e.g. KANr or
housekeeping genes. Click to highlight and include this primer set in a multiplex.
NOTE New reference primers can only be added in the Administrator mode. See
"Managing Primers" on page 274 for more information.
Load Multiplex
Select previously saved multiplex parameter settings from the drop-down list.
Timeout (in minutes)
Adjust the multiplexing algorithm run time. The default setting is 5. If the
multiplex has more fixed points (for example, previously created primers), the
software will take a longer time to bin the products together. Enter 10 or more
minutes if this is the case.
NOTE This is not an option in the eXpress function.
Genes
The list of accession numbers available for use in a multiplex.
Primers
The list of primers available for use in a multiplex.
Creating a Multiplex with Genes and Primers
1.
Log into eXpress Designer.
2.
Click Multiplex.
3.
Enter a unique mulitplex name in the Multiplex Name field.
4.
Enter PCR product specifications for the following:
r
Minimum Separation size
r
Maximum PCR Product size
r
Minimum PCR Product size
NOTE If the multiplex contains more than 25 genes, extend the Minimum Product Size Range to 100 and
increase the Maximum Product Size range to 350.
Since Verbose Mode is used for troubleshooting, it is not necessary to select this option for the
initial process.
5.
Select the Reference Primers that will be included in the multiplex.
IMPORTANT The KANr primers must be selected and highlighted for inclusion in the multiplex.
6.
Choose genes from the Genes list and/or primers from the Primers list to be included in
the multiplex.
NOTE The Genes option allows the algorithm to freely design new primers for that gene. The Primers option
forces the previously designed primers into the mulitplex. For any particular gene only select one option. Do
not select both.
7.
Enter a setting name for this set of parameters in the Save Setting field, and then click
Save Setting.
By using the Load Settings drop-down list, the parameters can be selected, opened and
modified in the future.
294
GenomeLab Genetic Analysis System User’s Guide
PN A29142-AB
Gene Expression
Multiplex Designer
8.
Click Execute to begin the multiplex formulation. The results will be displayed on the
Multiplex Design screen. See Figure 7.25 for a sample of the represented Multiplex
information.
Figure 7.25 eXpress Designer - Multiplex Execute Results
9.
Review the results and confirm that all of the genes and primers have been included in
the Multiplex.
r
If all of the genes and primers are included, click Save to Database to save the
multiplex data.
r
If one or more genes and/or primers are not included, then reduce the minimum
separation size and click Execute to restart the multiplex formulation.
r
If the single or multiple genes and/or primers are still not included, select the
Verbose Mode option and click Execute. Verbose Mode provides information
regarding the multiplex formulations and PCR products available for each
gene. This information can help to determine the reason why a particular gene
and/or primer was not included in the multiplex.
10. After the multiplex has been saved to the database, click Export and browse to the desired
location, then save the new multiplex TDF file.
Open the TDF file in Excel to view the information. The primer sequence data from this TDF
file can be used to order oligonucleotides.
NOTE Do not order KANr primers. They are included in the GeXP Start Kit chemistry.
Use the Reset Form option to restore the default settings and clear any selected genes or
primers.
GenomeLab Genetic Analysis System User’s Guide
PN A29142-AB
295
Gene Expression
Multiplex Designer
Viewing and Exporting Existing Multiplexes
View existing multiplex primer data and export the sequences to order primers for multiplex
formulation.
1.
Log into eXpress Designer.
2.
Click Multiplex.
3.
Click View Existing Data to view the primer sets of multiplexes that are currently saved in
the database.
4.
Select the multiplex from the drop-down list.
5.
Click Load. The multiplex primers list will open.
6.
Click Export to export the multiplex TDF file and save the file to the desired location.
Modifying an Existing Multiplex
Modify a previously-designed multiplex that was saved in the database, to replace primers or
include new genes.
1.
Log into eXpress Designer.
2.
Click Multiplex.
3.
Click on the Load Multiplex drop-down list, then select one of the multiplexes stored in
the database.
4.
Click Open Analysis to load primers from the selected multiplex. The Primers list will
show the selected primers that are contained in the loaded multiplex.
5.
Use the CTRL+Click function to select or clear a primer from the collection of primers in
the Primers list.
6.
Use the CTRL+Click function to select the genes from the Genes list, for inclusion in the
multiplex.
7.
Click to select the reference primers from Reference Primers list, for inclusion in the
multiplex.
8.
Set the Minimum Separation Size to ≥3. Optimal separation is 5 to 7 nucleotides.
NOTE When modifying an existing multiplex, it may be necessary to adjust the default parameters, such as
the Minimum Separation Size, in order to successfully generate a new multiplex, particularly if more gene
products are being added to the multiplex.
9.
Enter a unique multiplex name in the Multiplex Name field.
10. Name the new settings in the Save Setting field and click Save Setting to save the
parameter changes. By using the Load Settings drop-down list, the parameters can be
selected, opened and modified in the future. This step is optional.
11. Click Execute to generate a new multiplex. See Figure 7.25.
12. Click Save to Database to save the new multiplex to the database.
13. Click Export to export the new multiplex TDF file, and save the file to the desired
location.
The GeXP chimeric primers containing gene-specific and universal tag sequences can be
retrieved from the TDF file. Use these sequences to order oligonucleotides.
NOTE Do not order KANr primers. They are included in the GeXP Start Kit chemistry.
296
GenomeLab Genetic Analysis System User’s Guide
PN A29142-AB
Gene Expression
Multiplex Designer
Performing a Gene Expression Analysis with the Multiplex Design
At this point the individual multiplex primers are ready to be combined into forward and
reverse multiplexes. For instructions on how to build the primer multiplexes, see the
GenomeLab GeXP Chemistry Protocol (A29143).
Once the multiplexes are built and optimized, gene expression assays are performed and
analyzed with the GenomeLab GeXP Genetic Analysis System. The data is analyzed using
Fragment Analysis and the fragment data is transferred to eXpress Profiler Analysis module
for normalization.
GenomeLab Genetic Analysis System User’s Guide
PN A29142-AB
297
Gene Expression
eXpress Analysis Module
7.6
eXpress Analysis Module
Import fragment data from the GenomeLab GeXP Genetic Analysis System into the eXpress
Analysis module of eXpress Profiler for normalization and statistical analysis. Create and
export a report of the normalized gene expression data.
1.
Log into the eXpress Profiler and click eXpress Analysis in the Menu.
2.
Enter your username and password, then click OK to log into the software.
The eXpress Analysis application opens, as shown below.
Figure 7.26 eXpress Analysis Desktop
Table 7.10 eXpress Analysis Tabs
Option
298
Function
GeXP Analysis
Set up a new analysis or open a previously created analysis. Import
fragment data.
Plate Setup
Connect Fragment Analysis data with existing multiplex information in
the database.
GeXP Analysis Normalization
Normalize peak data to a reference gene. Export the results.
GenomeLab Genetic Analysis System User’s Guide
PN A29142-AB
Gene Expression
eXpress Analysis Module
Creating a New Analysis
Create a new analysis for gene expression.
1.
Click on the GeXP Analysis tab.
2.
Click New Analysis on the GeXP Analysis tab.
3.
Name the analysis in the Analysis Name field and click OK.
4.
In the Multiplex list, select and highlight a multiplex.
NOTE If the multiplex of interest is not listed, the eXpress Profiler Administrator must log in and import the
missing multiplex TDF file. See "Importing a Multiplex" on page 276, for more information.
5.
In the Users list, select and highlight a user name.
IMPORTANT A user MUST be selected with a multiplex for Analysis to function properly.
NOTE Multiple users can be selected in the Users field, to allow their access to the Analysis Setup and
Results.
The Goal, Comments, and Property field entries are for ancillary information and are optional.
They serve to provide user-entered information that is specific to the analysis. To better
represent the information entered into these fields, click on the Property text above the field,
to rename the Property.
6.
After entering the information for this multiplex analysis, click Save.
IMPORTANT When entering data in the eXpress Analysis module, click Save to update the data in the
database, before going to the next tab or function.
Figure 7.27 GeXP Analysis Setup Screen
NOTE Do not attempt to delete properties from any of the fields on the GeXP Analysis Setup tab. Though the
properties can be deleted from the view, they will reappear when the application is restarted.
GenomeLab Genetic Analysis System User’s Guide
PN A29142-AB
299
Gene Expression
eXpress Analysis Module
Opening a GeXP Analysis File
Work with or modify a previously created analysis file, while in eXpress Analysis.
1.
Log into the eXpress Profiler and click on eXpress Analysis in the Menu.
2.
Enter your username and password, then click OK to log into the software.
3.
Click Open Analysis.
4.
Locate the desired analysis in the Analyses List.
5.
Select and highlight the name of the desired analysis and click OK. The plates assigned to
the analysis will be listed in the Plates field.
6.
Make any changes to the analysis and click Save to save the modified file.
Importing Fragment Analysis Data
Import GeXP Fragment Analysis data into eXpress Analysis in order to normalize gene
expression relative to a reference gene.
Figure 7.28 GeXP Import Screen
Table 7.11 GeXP Import Options
Option
Function
Plate ID
Identifies the Plate ID from the GeXP fragment export file. The Plate ID must be
unique.
Duplicate Found
This option is selected if a Plate ID is not unique (the database already contains
an entry with the same Plate ID). If a plate with a duplicate ID is added, a warning
dialog will open to confirm the replacement of the existing plate in the database.
If it is not desirable to replace an existing plate in the database, the Plate ID must
renamed.
NOTE The Profile report (statistics) keeps the original Plate ID.
300
GenomeLab Genetic Analysis System User’s Guide
PN A29142-AB
Gene Expression
eXpress Analysis Module
Option
Add Plate
Function
This option must be selected to add the plate.
NOTE To remove plates you do not want to add to the database, clear this option.
Include Sample Names Select this option to import the sample names from the RN column of the GeXP
fragment export file. This automates the plate setup process while sample names
(properties) are pre-associated with wells.
1.
Log into the eXpress Profiler and click on eXpress Analysis in the Menu.
2.
Enter your username and password, then click OK to log into the software.
3.
Click on the GeXP Analysis tab to create a new analysis or open a previously created
analysis. See "Creating a New Analysis" on page 299 and "Opening a GeXP Analysis
File" on page 300.
4.
Click on GeXP Import. The GeXP Import tab will open.
5.
Click Browse to navigate and select the files (CSV) exported from the GenomeLab
application for this analysis.
6.
Select the CSV file, then click Open.
Several plates can be imported for the same analysis at once. These plates can be grouped
in the same CSV file or in separate files.
To add more plates to the analysis, open each CSV file and add it to the plate list before
the next step.
7.
Click Add Plates to Database to save the selected plates to the database under the present
analysis. A dialog box will confirm that the import is complete and that the number of
plates were added to the database.
IMPORTANT Make sure to import all of the plates to be included in a study in the first-pass. If more plates
are added in the second round import, the first set of plates will be deleted from the study.
8.
Click OK to continue.
9.
Click Save to save the changes to the Analysis Setup. The data is now ready for Plate
Setup.
GenomeLab Genetic Analysis System User’s Guide
PN A29142-AB
301
Gene Expression
eXpress Analysis Module
Setting up a Plate
Assign an analysis, multiplex and sample names for grouping purposes.
1.
Log into the eXpress Profiler and click on eXpress Analysis in the Menu.
2.
Enter your username and password, then click OK to log into the software.
3.
Click on the Plate Setup tab. The Plate Setup screen will open.
4.
Click on Open Analysis. The dialog box opens.
5.
Select the analysis and plate to view.
NOTE If the analysis includes multiple plates, click one plate to view. Follow the steps for plate setup and
binning for each plate. Save this information after each plate is set up. Then open the next plate. Once all of
the plates are completed, the analysis can continue to GeXP Analysis Normalization. "Normalizing Peaks" on
page 308.
Using the Sample Layout
6. Click Sample Layout. The Sample Layout tab opens with a sample plate display. The name
of this specific plate will show at the top of the screen. The yellow shaded wells shown
below indicate that data is associated with these wells.
To exclude a well from analysis (RTminus, No-Template Control or unwanted sample), click
on and select the well, and clear the Analysis option for the Analysis drop-down list. The well
color will change to White.
Figure 7.29 Sample Layout - First View
7.
Click on specific wells to select them for analysis. The selected drop-down lists under
Well Specific Settings display the analysis-specific information that has been applied to a
specific well.
IMPORTANT If multiple wells are selected, headers in red text indicate that the wells do not have the same
settings.The wells shown in Figure 7.31 have different sample names.
302
GenomeLab Genetic Analysis System User’s Guide
PN A29142-AB
Gene Expression
eXpress Analysis Module
Figure 7.30 Sample Layout - Well Selection
8.
Select a multiplex from the Analysis drop-down list to associate it with the selected wells.
When the multiplex is selected, the wells will display numerical values. These values
represent the number of genes in the selected multiplex and aid as a visual cue that the
multiplex has been assigned to the well, in case a well was missed.
Figure 7.31 Multiplex Selection of Multiple wells
9.
Select each well individually to view the sample name information that was assigned to
each well in the Plate Setup module of the GeXP Genetic Analysis System.
The sample name can be changed to another sample name in the same analysis, by
selecting the alternative name from the Sample Name drop-down list.
NOTE The feature of associating selected wells to an analysis is important, when technical replicates of the
same sample are given different Sample Names. Unless the replicates are all given the same name, each well
will be treated as an individual sample. For example: Sample 1-1, Sample 1-2, Sample 1-3 and Sample 1-4
are four technical replicates of the same sample, Sample 1. To combine these replicates, select each well that
contains Sample 1-2, Sample 1-3 and Sample 1-4, and convert these Sample Names to Sample 1-1 by
selecting the new name from the Sample Name drop-down list.
IMPORTANT When entering data in eXpress Analysis, click Save to update the data in the database, before
going to the next tab or function.
GenomeLab Genetic Analysis System User’s Guide
PN A29142-AB
303
Gene Expression
eXpress Analysis Module
Well Color Code
304
Description
Yellow/Gray
The Analysis name or Multiplex name is not associated with a well that contains
data. If the well will be included in the analysis, click on the well to select it and
use the Well Specific Settings to assign the well to an analysis and a multiplex.
Gray/Purple
The Analysis has been assigned.
Green/Purple
The Analysis and Multiplex have been assigned.
Bright
Green/Gray
The Analysis, Multiplex and Sample Name have been assigned.
White
No data was associated with the well, or the well was excluded from the analysis.
GenomeLab Genetic Analysis System User’s Guide
PN A29142-AB
Gene Expression
eXpress Analysis Module
Setting up Peak Binning
Align the expected PCR product sizes with actual peaks shown on the Peaks Graph.
1.
Log into the eXpress Profiler and click on eXpress Analysis in the menu.
2.
Enter your username and password, then click OK to log into the software.
3.
Click on the Plate Setup tab.
4.
Click Open Plate.
5.
Select an Analysis and the desired plate from the Open Plate dialog box and click OK.
6.
Click Peak Binning to view the Peak Binning tab. The first view does not show any data.
NOTE To view all of the fields on the Peak Binning tab, click on the Maximize button.
7.
Click on a colored well in the 96-well sample plate, to view the data associated with a
particular well.
NOTE If the range of data is more than three genes, it will be necessary to scroll down in the binning table to
view all of the fields associated with peak binning.
Figure 7.32 Peak Binning - First View
Table 7.12 Peak Binning Tab
Reference Item
Function
1. Sample Plate
Select a well from the plate and view the data associated with the well. This
data is displayed in the Peaks Graph and Binning Table.
2. Peaks Graph
Displays peaks that were detected in the Sample. The Y-axis represents the
peak height. The X-axis represents the fragment size.
3. Peaks Color Key
Shows the status of each peak using a color representation.
4. Binning Table
Identifies each designed and detected peak according to its size.
5. Binning Range
Defines a size range in which to identify a designed peak.
GenomeLab Genetic Analysis System User’s Guide
PN A29142-AB
305
Gene Expression
eXpress Analysis Module
Viewing Data for a Selected Well
Click on a gene from the Binning Table to show the binning range and highlight the
corresponding peak in the Peaks Graph. In Figure 7.33, notice that gene M12516 with an
expected size of 196.0 nt has been selected in the Binning Table.
Figure 7.33 Peak Binning - Showing the Range for a Selected Peak
Reading the Peak Binning Graph
The goal of peak binning is to align all of the expected, designed peaks with actual peaks
found in the data.
The peak binning graph replicates the electropherogram data from the GeXP System. The
TDF file created during multiplex is assigned to the Analysis and designates which peaks
should be present, by their size. Designed gene peaks that align with the imported sample
data are represented in green peaks. Unmatched or undesignated gene peaks are black.
Positions in which a designed gene peak is expected, but not detected, will show in red.
The X-axis represents the actual fragment size (nucleotides) and the Y-axis represents Peak
Height (RFU). The colors shown in the graph are explained in the color key.
Reading the Peak Binning Table
Peak Binning is the process of manually matching data peaks to the designed gene fragments.
The peak binning table represents the data from the GeXP System in a tabular form. A
designed gene that is associated with a peak or peaks in the data is highlighed in green. A
designed gene that is not associated with a data peak is represented in pink. An unmatched
peak, highlighed in white, is either a spurious, undesigned peak or a genuine gene product
that must be matched with a designed peak.
306
GenomeLab Genetic Analysis System User’s Guide
PN A29142-AB
Gene Expression
eXpress Analysis Module
Table 7.13 Peak Binning Table Parameters
Category
Gene
Function
Displays the name of the gene. The gene accession number will display by default,
unless the display name is changed in one of two ways:
r
Administrator function using Manage Genes option.
r
Under the user login in the eXpress Designer FASTA function, using the View
Existing Data option. "Viewing Existing Genes" on page 285.
Expected Size
The PCR product size expected by eXpress Analysis for a designed gene, based on the
information stored in the multiplex TDF file.
Actual Size
The PCR product size calculated by the GeXP Genetic Analysis System
Minutes
For non-GeXP-formatted files. This is not applicable to the GeXP Genetic Analysis
System.
Height
Peak height obtained from GeXP fragment export file
Area
Peak area obtained from GeXP fragment export file
NOTE It is helpful to use a printed or an electronic copy of the multiplex electropherogram from the GeXP
Analysis System Fragment Data to better verify the designed peak sizes. See "Viewing Electropherogram
Data" on page 223.
Binning Gene Peaks
1.
Identify the peak that should align with the specific gene, based on size and peak height.
2.
Click on the gene of interest in the Binning Table and perform one or both of the
following steps to align the gene with the correct peak.
a.
Change the Binning Range and increase the bin width to include the peak. The
default binning range is +/- 1.0 nucleotides (2 nt bin width to include a peak).
Changes to the Binning Range will affect all wells in the analysis for this gene peak
size.
NOTE If multiple peaks reside in a particular bin, the software will use the peak area associated with the
maximum peak height for normalization calculations.
b.
Adjust the expected PCR product size within the Binning Range window to align
the expected size of the gene with the actual size of the peak.
Important Considerations
r Modifications to the expected PCR product size will change the place where the
software will look for the designed peak.
r
Modifications to the bin width will change the area surrounding the expected PCR
product size, where the software will look for the designed peak.
r
Changes to the PCR product size and bin width are made across the plate and
throughout the analysis. Changes are not made on a well-by-well basis. Therefore,
peak binning in one well affects the peak binning of ALL of the wells in the analysis.
r
Changes to the expected PCR product sizes or bin widths should not be performed
arbitrarily, but rather connected with experimental data to verify that the gene sizes
and bins are accurate and reproducible.
GenomeLab Genetic Analysis System User’s Guide
PN A29142-AB
307
Gene Expression
eXpress Analysis Module
r
Changes to the expected PCR product sizes and bin widths are owned by the user
who is logged into eXpress Analysis. These changes do not affect the multiplex TDF
file that is available to all users. The adjusted PCR product size and bin width
parameters are applied to the current analysis and will be applied to future analyses
by this user when the same multiplex is used.
r
Changes to peak bins or PCR product sizes should be connected with experimental
data, to verify that the gene sizes and bins are accurate and reproducible.
r
When entering data in eXpress Analysis, click Save to update the data in the
database, or before going to the next tab or function.
r
Perform Plate Setup and Peak Binning for all plates in the Analysis, before
proceeding with Normalization.
Normalizing Peaks
Normalize gene expression data to a selected reference gene and obtain a final report.
1.
Log into the eXpress Profiler and click on eXpress Analysis in the Menu.
2.
Enter your username and password, then click OK to log into the software.
3.
Click on the GeXP Analysis Normalization tab.
4.
Click Open Analysis.
5.
Choose the analysis and click OK.
6.
Select the check box next to a potential reference gene in the Genes field. The graph will
plot the signal for that gene in relative fluorescence units on the y-axis. Raw peak area
values are displayed for data points within a treatment or sample type. The mean value
for each treatment is connected by a line.
This preview of the unnormalized gene expression can aid in choosing the proper
reference gene for normalization. Choose a gene that has relatively even signal intensities
across all of the samples within the sample capillary.
NOTE A reference gene that has constant expression, regardless of sample type (treatment or tissue), is
best suited as a normalization gene.
7.
After determining the gene to use for normalization, select that gene from the
Normalization Gene drop-down list.
8.
Click Save to save the normalized gene.
9.
Select the Display Normalized Data check box to view normalized data for each gene.
IMPORTANT When entering data in eXpress Analysis, click Save to update the data in the database, or
before going to the next tab or function.
Table 7.14 Graph Display Options
Option
Description
Display as zero value
expression levels
All data points, including zero-value expression levels, are displayed and
taken into consideration when this option is selected.
Display normalized values
Gene expression values that have been normalized to the selected
Normalization Gene are displayed for the replicate data points within a
treatment or sample type. The mean normalized value, represented by an X,
for each treatment is connected by a line.
NOTE When viewing normalized vs. relative fluorescence units data, the Y-axis label changes accordingly.
308
GenomeLab Genetic Analysis System User’s Guide
PN A29142-AB
Gene Expression
eXpress Analysis Module
10. View each gene expression profile by selecting the gene display name from the Genes list.
Figure 7.34 Normalized Gene Expression
GenomeLab Genetic Analysis System User’s Guide
PN A29142-AB
309
Gene Expression
eXpress Analysis Module
Viewing and Exporting a Report
View the quantitative results of the normalized gene expression data. The report includes data
from all plates contained within the open analysis. Export the data to Microsoft Excel or view
the data on the screen.
1.
Log into the eXpress Profiler and click on eXpress Analysis in the Menu.
2.
Enter your username and password, then click OK to log into the software.
3.
Click GeXP Analysis Normalization | Report View.
4.
Click Open Analysis. The dialog box opens.
5.
Select the analysis and click OK. The default setting reports the non-normalized data in
relative fluorescence units.
6.
Select the Display normalized data set option to view normalized data.
7.
Choose a report format from the Report drop-down list. The recommended report is
Profile (By Gene), since it contains the most pertinent statistics for the evaluation of
changes in gene expression.
Figure 7.35 Report View - by Gene
Option
310
Description
Profile (by Gene)
Gene-centric organization with basic statistics (Mean, %CV, and Standard
Deviation).
Profile (statistics)
GeXP Genetic Analysis System Traceability data available as a QC tool.
Profile (third-party)
Not suggested for use with the GeXP software, due to less than reliable results.
Compressed
Sample centric organization, offering different view based on sample-to-sample
comparison.
GenomeLab Genetic Analysis System User’s Guide
PN A29142-AB
Gene Expression
eXpress Analysis Module
8.
Click Export Data to export the report file. The data will be shown on the report view
screen.
9.
Rename the file as desired, then browse and save the CSV file to a user-designated folder.
This file can be viewed with Excel.
To view or hide the data for a particular gene on the Report View, select or clear the option
next to the gene name.
NOTE While a gene is cleared to prevent the gene from showing in the reports display, an exported report
includes all gene information, regardless of check box status.
Column Heading
Description
Technical Replicates
Two or more wells containing reaction products that were independently
derived from the same starting material (sample). Technical replicates
demonstrate the variability due to the GeXP process within a sample.
Expression Value
Given for each technical replicate within each sample for each gene within the
mulitplex. The raw gene expression value (peak area) is displayed by default. If
the Display Normalized Data Set option is selected, the normalized expression
values are displayed. The normalized expression value for each gene is
calculated by dividing the peak area of a gene fragment by the peak area of the
selected reference gene within the same reaction well.
Sample
Treatment or tissue-type from a particular organism. Three or more technical
replicates are recommended for each sample.
Mean Relative
Expression
The average of all the replicates for a particular sample type.
Standard Deviation (SD) Measures the spread of sample data around the mean.
% CV
Measures the variation among replicates by dividing the Mean by the Standard
Deviation for a particular sample.
Analyzing Data from Third-Party Software
1.
To use third-party software for gene expression analysis, first perform eXpress Profiler
data analysis through the peak binning step for each plate.
2.
Click on the Report View tab and select the desired report format.
3.
To export the non-normalized data, clear the Display normalized data set option.
4.
Click Export Data.
5.
Click Save to save the report file.
GenomeLab Genetic Analysis System User’s Guide
PN A29142-AB
311
Gene Expression
eXpress Map Module
7.7
eXpress Map Module
View gene expression data as a table, correlated to the expression of other genes or clustered
in similar expression patterns.
NOTE The information represented in the eXpress Map module cannot be saved, exported, or printed.
Viewing Table Data
1.
Log into the eXpress Profiler and click on eXpress Map in the Menu.
2.
Enter your username and password, then click OK to log into the software. The eXpress
Map Desktop will be displayed.
3.
Click Open Analysis from the database and select an analysis. This loads the data from all
plates within an analysis.
4.
Click Table to view the Table tab.
Figure 7.36 eXpress Map - Table
5.
Move the mouse over each block to see the normalized value for each sample/gene
combination.
The table represents the data in a heat map or Eisen plot. Color changes are formulated on a
per row basis, where each row represents a specific gene and each column represents a sample
set in the analysis. Warmer colors represent higher normalized values (higher expression),
while cooler colors represent lower normalized values (decreasing expression)
Editing the Color Scheme
Although the information in the Table cannot be modified, the color representation can be
changed for aesthetic purposes. The color scheme choices are Rainbow (blue, green, red,
yellow) blue to white, red to black and blue to yellow. The levels of gene expression are
represented by a blending of these colors.
312
1.
Click on one of the color scheme options in the toolbar. The eXpress Map will change
colors to reflect the selected option.
2.
Click Display Configuration (green check mark). The Table Configuration dialog opens.
3.
Use the Gamma and Threshold setting to adjust the color intensity.
GenomeLab Genetic Analysis System User’s Guide
PN A29142-AB
Gene Expression
eXpress Map Module
Creating a Profile Graph
Normalized expression values of selected genes within the same analysis are represented by a
Profile graph. This tool is similar to the graph that is created when using the Normalize Peaks
option in eXpress Analysis.
1.
Log into the eXpress Map and load the analysis to be viewed.
2.
Click Profile to view the profile graph.
3.
Select the genes to graph by selecting or clearing the Genes list options.
r
X-axis = sample names
r
Y-axis = normalized data values
The y-axis scale varies, based on the selected single or multiple genes.
Figure 7.37 eXpress Map - Profile Graph
Renaming the X and Y Axes
1.
Click Display Configuration (green check mark). The Chart Settings dialog opens.
2.
Enter a new name for the X axis label and Y axis label, to better represent the data
results.
GenomeLab Genetic Analysis System User’s Guide
PN A29142-AB
313
Gene Expression
eXpress Map Module
Creating a Correlation Graph
Generate a graph that depicts the correlation between gene expression data, for each gene in
the analysis.
1.
Log into the eXpress Map and load the analysis to be viewed..
2.
Click
3.
Click Display Configuration (green check mark) to choose whether to correlate genes or
sample types/treatments.
Correlation to generate the graph.
Figure 7.38 eXpress Map - Correlation Graph by Genes
4.
Move the mouse over each block to see the coefficient of correlation.
If the result is closer to 1.0, the correlation is stronger between the two data sets. Red
datapoints indicate a significant correlation. Grey data points indicate little to no correlation.
NOTE The data shown on these tabs is for viewing purposes only and cannot be saved, modified or printed.
314
GenomeLab Genetic Analysis System User’s Guide
PN A29142-AB
Gene Expression
eXpress Map Module
Creating K-Means Clusters
Group or classify data into a user-specified number of clusters (k) based on similar expression
profile attributes.
K-means clustering is an algorithm used to classify or group genes, based on patterns, into k
numbers of groups. k is a positive integer number. The grouping is done by minimizing the
sum of squares of distances between the data and the corresponding cluster centroid. Thus,
the purpose of K-means clustering is to classify the data based on similar gene expression
patterns.
1.
Log into the eXpress Profiler and click on eXpress Map in the Menu.
2.
Click K-Means. The parameters dialog box will open, to set the parameters for clustering.
3.
Set the number of clusters (K).
4.
Set the number of iterations.
5.
Change the cluster initialization.
6.
Select the distance measure means.
7.
Click OK to generate data clusters.
Figure 7.39 eXpress Map - K-Means
GenomeLab Genetic Analysis System User’s Guide
PN A29142-AB
315
Gene Expression
eXpress Backup and Restore
7.8
eXpress Backup and Restore
It is critical to save information to disk and back up system data. Use the eXpress Backup and
Restore program to back up database files, as well as recover the database and configuration
files used in the GeXP applications.
Database files include eXpress Profiler user information, multiplex TDF files, as well as gene
and primer information. Configuration files are settings and parameters saved by the user
during primer and multiplex design.
Saving the Backup Files
1.
From the Windows Start menu, select Start | Programs | GeXPAdmin | eXpress Backup and
Restore. A dialog box will open on the desktop.
2.
Select Backup/Restore Configuration Files and Backup/Restore Database Files option.
3.
Click Backup to start the backup process. A Database Backup dialog box opens.
4.
Enter a name for the backup file in the Filename field. The default File Type is Backup Files.
IMPORTANT Do not change the default folder, DBBackup.
5.
Click Save. If the backup was successful, a message box displays:
Database backup was successful.
6.
Click OK.
7.
Click Close to quit the program.
Restoring the Backup Files
If a system failure occurs, use the GeXP eXpress Backup and Restore to restore previously
saved database and configuration files.
NOTE If you saved both the database and recovery information in the same backup file, as described in
"Saving the Backup Files" above, then use this same backup file for the database recovery and configuration
recovery.
NOTE You may recover both the Database and Configuration files at the same time by selecting the options
for Backup/Restore Database Files and Backup/Restore Configuration Files. This requires that the
database and configuration files be backed up in the same backup file as described in "eXpress Backup and
Restore".
Restoring the Database
1.
From the Windows Start menu, select Start | Programs | GeXPAdmin | eXpress Backup and
Restore. A dialog box will open on the desktop.
2.
Select Backup/Restore Database Files ONLY.
IMPORTANT Make sure that the Backup/Restore Configuration Files option is not selected.
316
3.
Click Restore. The Database Restore dialog box opens.
4.
Select a backup file to restore from the file list.
5.
Click Open. A dialog box displays the message:
Are you sure? This will destroy ALL data currently stored and
revert to the data set existing when the selected backup was
taken. Do you wish to proceed?
GenomeLab Genetic Analysis System User’s Guide
PN A29142-AB
Gene Expression
eXpress Backup and Restore
6.
Click Yes to proceed. A Windows command dialog box displays the message:
Shut down message has been posted to the server. Server shut
down may take a while - check logfiles for completion. Press
any key to continue...
7.
Press any key on the keyboard to continue with the restore. A dialog box displays the
message:
Database backup/restore. Database restore was successful. You
must log off and back on or reboot in order to re-establish
database access.
8.
Click OK, then click Close to quit the program.
9.
Exit all programs and shut down the computer.
10. Reboot the computer and restart Windows.
11. Go to the Windows Start menu and select Start | Programs | GeXPAdmin | GeXP to start the
eXpress Profiler software.
12. Login to the program using your Username and Password.
13. Select Multiplex from the menu. The Multiplex drop-down list has items listed from the
recovered database. Since all of the settings have been deleted, the Load Settings
drop-down list will not have any items to select. To recover this list proceed to
"Restoring the Configuration" below.
Restoring the Configuration
1.
From the Windows Start menu, select Start | Programs | GeXPAdmin | eXpress Backup and
Restore. A dialog box will open on the desktop.
2.
Select the Backup/Restore Configuration Files option ONLY.
IMPORTANT Make sure that the Backup/Restore Database Files option is not selected.
3.
Click Restore. The Database Restore dialog box opens.
4.
Select a configuration file to restore from the file list.
5.
Click Open. A dialog box displays the following message:
Are you sure? This will destroy ALL data currently stored and
revert to the data set existing when the selected backup was
taken. Do you wish to proceed?
6.
Click Yes to continue with the restore. A dialog box displays the message:
Database backup/restore. Database restore was successful. You
must log off and back on or reboot in order to re-establish
database access.
7.
Click OK, then click Close to quit the program.
8.
Exit all programs and shut down the computer.
9.
Reboot the computer and restart Windows.
10. Go to the Windows Start menu and select Start | Programs | GeXPAdmin | GeXP to start the
eXpress Profiler software.
11. Login to the program using your Username and Password.
12. Select Multiplex from the menu and then click Load Settings. The drop-down list should
now include the restored items.
GenomeLab Genetic Analysis System User’s Guide
PN A29142-AB
317
Gene Expression
eXpress Backup and Restore
318
GenomeLab Genetic Analysis System User’s Guide
PN A29142-AB
Database Management
Data Manager Module Overview
8Database Management
8.1
Data Manager Module Overview
Create, save, and modify databases.
These databases can contain any of the following data types:
r
Filter Sets
r
Fragment Analysis Parameters
r
Fragment Results
r
Methods
r
Optical Scan Data
r
Sample Data
r
Sample Plates
r
Sample Plate Results
r
Sequence Analysis Parameters
r
Sequence Results
r
SNP Locus Tags
r
Standards
r
STR Locus Tags
GenomeLab Genetic Analysis System User’s Guide
PN A29142-AB
319
Database Management
Data Manager Module Overview
Main Window
The main window of the Data Manager module is shown in Figure 8.1 and described in
Table 8.1.
Figure 8.1 Main Window, Data Manager Module
The following table describes the items called out in Figure 8.1.
Table 8.1 Main Window, Data Manager Module
Option
Description
A
Title Bar - Shows the module name (Data Manager).
B
Menu Bar - Provides access to all drop-down menus ("Menu Bar Options" on page
320).
C
Toolbar - Contains the icons that execute pre-defined functions ("Toolbar Icons" on
page 325).
D
Display Area - Lists the files contained in the selected node.
E
Status Bar - Displays information concerning the current selection.
Menu Bar Options
The following example shows the Data Manager module’s menu bar options.
320
GenomeLab Genetic Analysis System User’s Guide
PN A29142-AB
Database Management
Data Manager Module Overview
The following topics describe each of these menus and their options.
File Menu
Click the File menu to display its drop-down menu, as shown in the following example.
Use the File menu to create a new project or database, open a selected database, delete a
project or database, rename database items, view properties, import/export database items,
and set the working database.
Table 8.2 File Menu, Data Manager Module
Option
Description
New
Create a new Project or Standard in a database.
New Database
Create a new database.
Open
Edit Fragment Results, Optical Scan Data, Sample Data, Sequence Results,
Sample Plate Results, or Standards.
Print
Prints a report of the selected item.
Print Setup
Define printer properties.
Print Screen
Send an image of the computer desktop or application window to the printer.
Delete
Deletes items, projects, and databases.
NOTE The working database cannot be deleted!
Rename
Rename items, projects, and databases.
Properties
Displays the current database and modification date as well as other sample
data collection information concerning the selected item in the same format
as Sequence Result Properties. See "Sequence Result Properties" on page
138.
Import
Import a file in one of the following formats:
d
Standard Chromatogram Format v2.10 and v3.00 (*.scf)
d
ESD (*.ESD)
d
CEQ (*.cq*)
NOTE You must select a project in which to import the items.
GenomeLab Genetic Analysis System User’s Guide
PN A29142-AB
321
Database Management
Data Manager Module Overview
Table 8.2 File Menu, Data Manager Module
Option
Description
Export
Export a file in one of the following formats:
d
Standard Chromatogram Format v2.10 and v3.00 (*.scf)
d
CEQ (*.cq*)
d
ESD (*.esd)
d
Tab Delimited ASCII Text (*.txt)
d
SEQ (*.seq)
d
FASTA (*.fasta)
d
PHRED (*.scf.phd.1)
d
CRV (*.crv)
Set as Working Database
Defines the currently selected database as the default database.
Exit
Closes the Data Manager module.
Edit Menu
Click the Edit menu to display its drop-down menu, as shown in the following example.
Use the Edit menu to cut, copy, paste, and find items in the database.
Table 8.3 Edit Menu, Data Manager Module
Option
322
Description
Cut
Copies the selected item to the clipboard and removes it from its
current location.
Copy
Copies the selected item to the clipboard without removing it from its
current location.
Paste
Inserts one or more copied or cut items from the clipboard to other
projects or databases.
Find
Opens a Find dialog box which you can use to locate a specific item,
project, or database.
Find Next
Searches for the next occurrence of the item or folder defined in the
Find dialog box.
Select All
Selects all items under the selected item.
GenomeLab Genetic Analysis System User’s Guide
PN A29142-AB
Database Management
Data Manager Module Overview
View Menu
Click the View menu to display its drop-down menu, as shown in the following example.
NOTE A " " next to an option indicates that the option is enabled.
Use the View menu to toggle the toolbar and status bar on and off, or to manage the database
view.
Table 8.4 View Menu, Data Manager Module
Option
Description
Toolbar
Toggles between displaying or not displaying the toolbar.
Status Bar
Toggles between displaying or not displaying the status bar.
Refresh
Rebuilds the window display to reflect the most recent changes.
Filter By
Filter the list (in the right-hand side window) by the dates modified.
Database
Displays all items in the selected database.
Sample Run History Displays a list of items that were run in a project during specified dates.
Tools Menu
Click the Tools menu to display its drop-down menu, as shown in the following example.
Use the Tools menu to back up, restore, and shrink a database, and to perform other database
management tasks.
Table 8.5 Tools Menu, Data Manager Module
Option
Description
Backup
Creates a backup copy of the selected database.
Restore
Restores a previously backed up copy of a database to the Data
Manager.
Shrink Database
Reduces the size of the currently selected database.
Associate Default Dye Spectra
Associates previously saved data with a new default dye spectra.
GenomeLab Genetic Analysis System User’s Guide
PN A29142-AB
323
Database Management
Data Manager Module Overview
Table 8.5 Tools Menu, Data Manager Module
Option
Description
Convert Individual ID to
Subject ID
Converts all sample data records that use Individual IDs to records that
use Subject IDs.
Administrative Tools | Add
CeqUsers Group to SQL Login
Adds the CEQUSERS group to the SQL login. Only members of the
CEQUSERS group are given access the CEQ databases.
Window Menu
Click the Window menu to display its drop-down menu, as shown in the following example.
The following table describes the Window menu options for Data Manager.
Table 8.6 Window Menu, Data Manager Module
Option
324
Description
New Window
Opens a new display window.
Cascade
Cascades the open windows.
Tile
Tiles the windows in a horizontal orientation.
Arrange Icons
Automatically arranges the icons.
Close All
Closes all currently active windows.
1
Brings the selected window (#1) to the foreground.
GenomeLab Genetic Analysis System User’s Guide
PN A29142-AB
Database Management
Data Manager Module Overview
Help Menu
The following table describes the Help menu options.
Table 8.7 Help Menu, Data Manager Module
Option
Description
Help Topics
Select this option to display the CE system online help. By default, the help system
displays the Contents in the navigation pane, located on the left, and the
introductory topic in the topic pane, located on the right. You can use the Contents
to select and print specific help topics. The navigation pane also provides a Search
tab and an Index tab. These tabs let you search for information by topic, index entry,
and/or keyword.
Using Help
Select this option to display the Contents window on how to use the Windows Help
system.
About GenomeLab
System
Select this option to access software, instrument, and system information.
Beckman Coulter
Home Page
Select this option to access the Beckman Coulter Home Page on the Internet.
Toolbar Icons
The Data Manager module provides one toolbar with icons that correspond to common menu
items. Figure 8.2 shows this toolbar.
Figure 8.2 Toolbar, Data Manager Module
Table 8.8 Toolbar, Data Manager Module
Icon
Description
Up One Level - Moves the directory structure tree up one level.
New - Create a new project or database.
Open - Opens and edit standards.
Cut - Deletes selected items, projects, and databases.
Copy - Copies a selected item, project, or database to the clipboard.
Paste - Inserts one or more copied or cut items from the clipboard to selected project or
database.
Print - Prints a report of the selected item.
GenomeLab Genetic Analysis System User’s Guide
PN A29142-AB
325
Database Management
Data Manager Module Overview
Table 8.8 Toolbar, Data Manager Module
Icon
Description
Delete - Deletes selected items, projects, and databases.
Properties - Displays the current database and modification date and other information
concerning the selected data file.
Backup Database - Creates a backup of the database.
Restore - Restores the database with the backup.
Help Topics - Displays the CE Instrument System Help. By default, the help system displays the
Contents in the navigation pane, located on the left, and the introductory topic in the topic pane,
located on the right. You can use the Contents to select and print specific topics in CE
Instrument System Help. The navigation pane also provides a Search tab and an Index tab.
These tabs let you search for information by topic, index entry, and/or keyword.
Context-Sensitive Help - Click this icon and then on a menu item to open the Help file related to
the selection.
326
GenomeLab Genetic Analysis System User’s Guide
PN A29142-AB
Database Management
Data Manager Procedures
8.2
Data Manager Procedures
Storing Methods and Parameters
The USERTEMPLATE database stores newly created methods and parameters. This database
is added when the during software installation.These methods and parameters are then
included in all subsequently created databases. Use the Cut, Copy, and Paste functions to add
methods and parameters to the USERTEMPLATE.
Although you cannot set the USERTEMPLATE database as the working database, you can
delete it. If this database is deleted, no template will be used for subsequent databases. If you
need a new template, create a new one named “USERTEMPLATE.”
Creating a Database
1.
Click Data Manager on the Main Menu.
2.
In the Data Manager window, right-click the GENOMELAB DBASE node and select New
Database. The New Database dialog box opens.
3.
Enter a name for the database and (if desired) select the Set As Working Database option
(Figure 8.3).
Figure 8.3 Setting Up New Working Database in the Data Manager Module
4.
Click OK .
GenomeLab Genetic Analysis System User’s Guide
PN A29142-AB
327
Database Management
Data Manager Procedures
Setting the Working Database
Program the database that contains all of the projects, and the location where the data are
stored until another database is set as the working database.
1.
Close all modules except for Data Manager module.
2.
If necessary, open the Data Manager module. How do they know
3.
Select the database you want to use as the working database. The system highlights the
selected database in blue.
4.
Select File | Set as Working Database. The name of the working database appears in bold to
indicate that it is the working database.
NOTE The database size is limited to approximately 1700 megabytes. However, we recommend that you
work with smaller databases to improve performance.
Creating and Naming a Project
To create and name a project:
1.
In the Data Manager window, select and highlight the database where the project will
reside then click File | New.
2.
Highlight the new project and click File | Rename .
3.
Enter a descriptive name for this project and press Enter.
NOTE Do not use special characters in the file name: “/ : * ? \" < > |”.
4.
Close the Data Manager module (File | Exit ).
Deleting a Project or Database
1.
In the Data Manager window, select and highlight the folder or database to be deleted.
2.
Select File | Delete . A Data Manager dialog box opens, prompting you to confirm
deletion.
3.
Click Yes to delete the folder or database.
NOTE You cannot delete the working database.
CAUTION Deleting a folder deletes all data contained within that folder.
Renaming a Project or Database:
1.
In the Data Manager window, select and highlight the project or database.
2.
Select File | Rename .
3.
Enter the new name for the database and press the Enter key.
NOTE Do not use special characters in the file name: “/ : * ? \" < > |”.
328
GenomeLab Genetic Analysis System User’s Guide
PN A29142-AB
Database Management
Data Manager Procedures
Checking the Database Size
Check the size of each database.
1.
Click Data Manager on the Main Menu.
2.
Left-click the GENOMELAB DBASE node at the top of the left pane. The size for each
database is shown in the right pane, as shown in Figure 8.4.
Figure 8.4 Checking the Database Size
NOTE If you recently removed data from the database, the size shown may not be accurate. See "Reducing
the Database Size" on page 329. for more information.
Reducing the Database Size
Manually reduce the size of the database to its new (smaller) size. After removing studies or
results from the database, the size of the database does not immediately reduce in size.
NOTE Always reduce the database size before backing it up. The database size cannot be reduced during
database back up.
1.
Open the Data Manager.
2.
Select and highlight the database that will be reduced.
3.
Select Tools | Shrink Database .
GenomeLab Genetic Analysis System User’s Guide
PN A29142-AB
329
Database Management
Data Manager Procedures
Backing Up a Database
Periodic backups are essential to reduce the risk of losing data. Save backups to any folder on
the local drive.
IMPORTANT If a database is deleted or damaged, only the data created since the last backup will be lost.
NOTE Shrink the database before backing up any database. For details, see "Reducing the Database Size"
on page 329.
1.
Open Data Manager.
2.
Left-click the GENOMELAB DBASE node at the top of the left pane.
3.
Select the database to be backed up. An example is shown in Figure 8.5.
Figure 8.5 Select Database to Back Up
4.
Select Tools | Backup Database .
5.
Browse to the location on the local disk where the file will be saved.
Figure 8.6 Backup Database Dialog Box
330
GenomeLab Genetic Analysis System User’s Guide
PN A29142-AB
Database Management
Data Manager Procedures
6.
Accept the file name or rename it as necessary.
NOTE Since databases are backed up frequently, you might want to add the date as part of the name to
prevent overwriting valuable backups and to ensure accurate database recovery.
7.
Click Save .
Restoring the Database
Recover a database that was previously saved using the backup procedure.
WARNING If you are restoring a database that has the same name as one already residing in the Database
Manager, you must either restore it with a new name or delete the existing database before restoring it.
THIS Option IS NOT Recommended.
1.
Open Data Manager.
2.
Select Tools | Restore Database .
3.
Browse to the location on the local disk, where the backup file was saved.
Figure 8.7 Restore Database Dialog Box
4.
Select and highlight the file to restore and click Restore .
NOTE If a database with the same name exists, a warning will appear (Figure 8.8).
Figure 8.8 Database Exists Warning Message
5.
If this occurs, click OK and either:
r
r
Delete the database in the Data Manager (NOT recommended), or
Rename the database being restored. This is done by entering a new name in the
Database To Restore field.
GenomeLab Genetic Analysis System User’s Guide
PN A29142-AB
331
Database Management
Data Manager Procedures
Converting Individual IDs to Subject IDs
Converts all sample data records with Individual IDs to records that use Subject IDs.
Before you begin, confirm that the present database is the Working Database. See "Setting the
Working Database" on page 328 for more information.
The Subject ID attribute applies to the sequence and fragment records that were generated
from the converted sample data record. Performing this action removes the Individual ID
column and adds a new Subject ID column to all existing studies within the database.
1.
Open Data Manager.
NOTE The working database cannot be changed while other modules are open.
2.
Select and highlight the database to convert and ensure that it is the Working Database .
NOTE This option is available only for the working database.
3.
Select Tools | Convert Individual ID to Subject ID . After the IDs are converted, the
following message is displayed in the status bar:
Conversion Completed Successfully.
Creating New Size Standards
332
1.
Open Data Manager.
2.
Select the Default or Project folder.
3.
Open the Standards sub-folder in the Default or Project folder.
4.
Select File | New to create a new standard item.
5.
Double-click on New Standard Item to begin defining the individual size standard
fragments.
6.
Select the appropriate dye label attached to the size standard fragments.
7.
Input the sizes of each standard fragment with one fragment per line.
8.
Select Save As to save the new Size Standard with a new name.
GenomeLab Genetic Analysis System User’s Guide
PN A29142-AB
Database Management
Data Manager Procedures
Exporting Database Files from the Data Manager
1.
Open Data Manager.
2.
Open a sequence result.
3.
Select File | Export to open the Export dialog box.
4.
Browse to the target folder, then select and highlight the file name.
5.
Select the desired format in the Save as type field, as shown in Figure 8.9.
Figure 8.9 Sequence Analysis Export Dialog Box
6.
Click Export .
GenomeLab Genetic Analysis System User’s Guide
PN A29142-AB
333
Database Management
Data Manager Procedures
Data Manager Export File Types
Table 8.9 describes the available export file types.
Table 8.9 Data Manager Export Options
Format
SCF (.scf)
Description
The SCF (Standard Chromatogram Format) format stores analyzed DNA sequence
or fragment data for a single sample. The format describes both public and private
data sections. The well-defined public data section contains trace data points, the
called sequence, or identified fragments and the positions of each called base or
fragment within the trace data. A public comment section is also defined. The
private section stores other information that most software packages ignore.
The CE system uses the private data section to store sample data (including raw
data along with current and voltage data). This may store sample data from either
sequencing or fragment analysis samples can be stored. The notes and property
sets are stored in the comment section. The CE system software supports SCF
versions 2.1 and 3.0. (You would use this format, for instance, to export analyzed
sequence data into Lasergene’s SeqMan from DNASTAR Inc.). Third-party packages
cannot currently view raw data, current, or voltage. However, custom applications
can be written to view the data.
Use the SCF format to transfer data from instrument to instrument, or to import data
from third-party software into the Sequence Analysis module. If you use SCF to
exchange data between instruments, you will lose informational data such as
sample plate name, capillary array serial number, etc. If you want to maintain exact
copies of data including header information, use the CEQ format and import and
export these data using the Data Manager.
Tab-Delimited Text
(.txt)
The tab-delimited format is valid for raw data, sequence results and fragment
results. Select the Raw Data check box to include raw data, as well as current and
voltage data. Select the Results Data and Results Output check boxes to include the
sequence results.
The format expresses the data points as text values, which can be viewed in any text
editor or in Excel.
PHRED (.scf.phd.1) The PHRED format produces two files – a PHRED file and an SCF file. A PHRED file
is a text file composed of a SEQUENCE section containing a COMMENT and DNA
section. The SEQUENCE section also contains the name of the Analyzed Result that
was stored.
The COMMENT section contains the file name of the associated SCF file
(CHROMAT_FILE) that was produced along with the PHRED file. The values for
ABI_THUMBPRINT and PHRED_VERSION are fixed text “N/A.” The values for
CALL_METHOD and QUALITY_LEVELS are fixed as “CEQ SEQUENCING” and “99”
respectively for the CE system. The TIME stamp is the current time at the time of
export.
The DNA section is composed of the base-call (always lower-case), PHRED Quality
Value, and the Peak Index (data point) of the analyzed data contained within the
associated SCF file. Values are separated by spaces.
334
GenomeLab Genetic Analysis System User’s Guide
PN A29142-AB
Database Management
Data Manager Procedures
Table 8.9 Data Manager Export Options
Format
Description
ESD (.esd)
The ESD, electropherogram sample data, format exports raw data from the CE
system to a third-party software package for analysis. This option exports only raw
data and does not include any other information.
SEQ (.seq)
The SEQ format only applies to the sequence results portion (such as text bases) of
analyzed data. You would use this format, for instance, to export data into
Lasergene’s SeqMan from DNASTAR Inc.
FASTA (.fasta)
The FASTA format only applies to the sequence results portion (such as text bases)
of analyzed data, and contains a comment line that is used to identify the data.
Along with the text file, a quality values file is also generated (*.FASTA.QUAL) which
lists the quality value for each base. (Quality values correspond to -10*log10[error
rate]). The range for the quality values is 1 to 99. Edited and inserted bases have a
value of 99.
You would use this format, for instance, to export data into PHRAP. For instance, in
PHRED, a quality value of 10 means 1 error in 10. A quality value of 20 means an
error rate of 1 error in 100. A quality value of 30 means an error rate of 1 error in
1,000. A quality value of 40 means an error rate of 1 error in 10,000, etc. Normally
PHRED would export these quality values into PHRAP. In the case of exporting from
the CE system, we bypass PHRED and export directly into PHRAP.
GenomeLab Genetic Analysis System User’s Guide
PN A29142-AB
335
Database Management
Data Manager Procedures
Table 8.9 Data Manager Export Options
Format
CEQ (.cq*)
Description
Selecting the CEQ format, the format native to our database, exports sample data,
sequence or fragment results, sample plate results, sequence or fragment analysis
parameters, sample plates, methods, locus tags (fragment data only), standards
(fragment data only), and optical scan data. The sample elements are automatically
selected in the Export dialog box, which would export all of the associated
information listed above. This format essentially takes a “snapshot” of the file and
can retain all of the information belonging to that file.
This format is available only when importing data into the Data Manager. This
format can also be used when exporting data from the Sequence and the Fragment
Analysis modules and the Data Manager.
When exporting as CEQ data, the various data types are exported to files with the
following extensions:
Sequence Analysis ParameterCQA
Sequence InvestigatorCQC
Fragment Size StandardCQD
Fragment Analysis ParameterCQF
Galvo Scan DataCQG
Fragment Locus TagsCQL
MethodCQM
SNP Locus TagCQN
Sequence ResultCQR
Sample DataCQS
Sample TableCQT
Fragment ResultCQU
Sample Table ResultCQX
336
Remove CEQ
Tracking Suffix
You may automatically remove the plate position coordinates (*.A01, *.B02, etc.)
and the time/date stamp from the sample name which is normally generated by the
CE system software on export. To do so, select the Remove CEQ Tracking Suffix
check box ().
Resolve Filename
Conflicts
If the system encounters the same sample name at the destination, it usually
overwrites the name (if you choose to remove the plate position coordinates and the
time/date stamp which ensures a unique name). If you select the Resolve Filename
Conflicts check box (), the system increments the sample names on export when
it encounters duplicate names. For example, if the system encounters the duplicate
sample name of “Fred” on export, it renames the file exported to “Fred_1”.
GenomeLab Genetic Analysis System User’s Guide
PN A29142-AB
Database Management
Data Manager Procedures
Table 8.9 Data Manager Export Options
Format
Description
Apply Trimming
Selecting this option removes the trims from the sequence before you export it and
replaces internal trims with the letter “x”.
CRV (*.crv)
The CRV export option from the Data Manager module exports the four colors
(dyes) as four separate files. When exporting batches, the resulting four files
contain separate dye colors for all the samples.
You can select *.CRV as an export file type for exporting fragment results from the
Fragment Analysis module.
Individual files are created representing individual colors:
{FileName}_D1.crvD1 contains dye 1 - red*
{FileName}_D2.crvD2 contains dye 2 - black*
{FileName}_D3.crvD3 contains dye 3 - green*
{FileName}_D4.crvD4 contains dye 4 - blue*
*Default dye colors. You may reassign the dye colors at any time.
Batch CRV Exporting
More than one result can be exported in a batch. If, for instance, more than one
result is exported in a batch, the export generates five files; one for each dye and
one to assist in determining the trace order. See the table below:
{FileName}_D1.crvD1 contains all dye 1 results in the batch
{FileName}_D2.crvD2 contains all dye 2 results in the batch
{FileName}_D3.crvD3 contains all dye 3 results in the batch
{FileName}_D4.crvD4 contains all dye 4 results in the batch
{FileName}_CRV_TRACE_ORDER.txtcreated for batch export files to assist in
determining trace order in the CRV files
See "Sequence Export File Types" on page 159 for additional information on
sample elements or refer to the Online Help.
Importing Database Files
To import files into the database:
1.
Open Data Manager.
2.
In the Data Manager window, browse and select the project where the imported file will
reside.
3.
Select File | Import . The Import dialog box opens.
4.
Browse to locate the folder where the file resides.
5.
Select the import format from the Files of type drop-down list.
6.
Select the filename.
7.
Click Import .
GenomeLab Genetic Analysis System User’s Guide
PN A29142-AB
337
Database Management
Data Manager Procedures
Generating a Sample Run History
1.
Select View | Sample Run History. The Sample Run History dialog box opens.
2.
Select a Project name from the drop-down list.
3.
Select Enable and enter a filtering start and end date.
4.
Click Compute .
5.
View the total number of runs during the specified dates in the Total Sum of Samples
Run field.
6.
If desired, print a report of all samples run during the specified dates by clicking the
Print button.
Administrative Tools
The System Administrator can access the database without logging onto the computer as an
Administrator. Before using the Administrative Tools, an Administrator must first set up a
group and assign to it the users to have access to the CE system databases.
Users and Groups
Adding Users and Groups is done outside of the CE system. After creating the CEQUSERS
group and adding users to it, you must activate the group within the Data Manager module.
Adding Users
1.
Select Start | Settings | Control Panel | Administrative Tools | Computer Management .
The Computer Management console opens (see Figure 8.10).
Figure 8.10 Computer Management Console - Selecting Users
2.
338
In the left-pane, click on the “+” symbol next to the System Tools item to expand its
contents.
GenomeLab Genetic Analysis System User’s Guide
PN A29142-AB
Database Management
Data Manager Procedures
3.
Click on the “+” symbol next to the Local Users and Groups item to expand its contents.
4.
Right-click Users and select New User. The New User dialog box opens (Figure 8.11).
Figure 8.11 New Users Dialog Box
5.
Enter the new User name (required) and edit the other fields as necessary.
6.
Click Create .
Adding Groups
To add a new group from the Windows desktop:
1.
Select Start | Settings | Control Panel | Administrative Tools | Computer Management .
The Computer Management console opens.
2.
In the left-pane, click on the “+” symbol to next to the System Tools item to expand its
contents.
3.
Click on the “+” symbol next to the Local Users and Groups item to expand its contents.
4.
Right-click Groups and select New Group . The New Group dialog box opens
(Figure 8.12).
GenomeLab Genetic Analysis System User’s Guide
PN A29142-AB
339
Database Management
Data Manager Procedures
5.
Enter CEQUSERS in the new Group name field and, if necessary, enter a description in the
Description field.
Figure 8.12 New Group Dialog Box
6.
Click the Add button to add the users created as described in "Adding Users" on page
338. The Select Users or Groups dialog box opens. The local computer appears as the
default location in the Look in field. If it isn’t, use the drop-down list and select the local
computer.
7.
Scroll down the Name list and select the user names created. If you created more than
one user, click on the first name, press and hold the Ctrl key, then select any additional
names to add to the group.
8.
Click Add and then click OK to add the selected users to the new group.
Figure 8.13 Select Users to the New Group
340
GenomeLab Genetic Analysis System User’s Guide
PN A29142-AB
Database Management
Data Manager Procedures
9.
Click Create to save the new group.
Figure 8.14 New Group Dialog Box
Activating the CEQUSERS Group
After creating the CEQUSERS group and adding users to the group, you must activate the
group within the Data Manager module. This is done only once and users can be
added/removed at any time thereafter.
To activate the CEQUSERS group:
1.
Open the Data Manager module.
2.
Select Tools | Administrative Tools | Add CeqUsers Group to SQL Login .
All users added to the group CEQUSERS now have access to the database.
GenomeLab Genetic Analysis System User’s Guide
PN A29142-AB
341
Database Management
Data Manager Procedures
342
GenomeLab Genetic Analysis System User’s Guide
PN A29142-AB
Maintenance and Diagnostics
Routine Maintenance
9Maintenance and Diagnostics
This chapter provides routine maintenance, replenishment, and biological waste disposal
procedures. It provides a list of the consumable materials used in the system. It also includes
some diagnostic procedures performed as needed.
9.1
Routine Maintenance
NOTE Use Figure 9.1 to locate hardware components referenced in this section.
GenomeLab Genetic Analysis System User’s Guide
PN A29142-AB
343
Maintenance and Diagnostics
Routine Maintenance
Figure 9.1 User Accessible Hardware Components
1. Sample Access Cover (extended)
7. Manifold Access Cover
2. Capillary Access Cover (extended)
8. Gel Waste Bottle
3. Status Indicators
9. Power Switch
4. Plate Holders/Sample Transport
10. Gel Pump
5. Capillary Temperature Control Cover
11. Gel Pump/Gel Cartridge Access Cover
6. Rubber Latches
Cleaning the Capillary Array
CAUTION The capillary array windows must kept free of any contaminants. Otherwise, high backgrounds
and/or drifting baselines will occur. All background levels should be below 6000 counts.
Water used during this procedure must be fresh, distilled, deionized water (18 Mohm/cm water).
344
1.
Select Replenish | Release Capillary Array in the Run module.
2.
Wait for the Remove Capillary Array dialog box to appear.
3.
Open the sample access cover (Figure 9.1) and lift it to the vertical locking position.
4.
Open the capillary access cover and lift it to the vertical locking position.
5.
Unlatch the two rubber latches holding the capillary temperature control cover and lift it
to the vertical locking position.
6.
Loosen the manifold access cover captive screw (Figure 9.2), remove the cover, and set it
aside.
GenomeLab Genetic Analysis System User’s Guide
PN A29142-AB
Maintenance and Diagnostics
Routine Maintenance
Figure 9.2 Manifold Access Cover
1. Capillary Temperature Control Cover
(open)
4. Captive Screw
2. Plenum Assembly
5. Manifold Access Cover (removed)
3. Manifold Access Cover
7.
Lift the eject lever (Figure 9.3) to release the array fitting.
8.
Grasp the array fitting tab (Figure 9.3) and then:
a.
Pull the fitting approximately one inch away from the manifold.
b.
Touch the tip of the fitting to the bottom of the optics base plate.
c.
Hold this position and wait five seconds for the gel strand to dry.
d.
Pull the fitting away from the instrument.
e.
Use a tissue to wipe gel strands off of the instrument.
GenomeLab Genetic Analysis System User’s Guide
PN A29142-AB
345
Maintenance and Diagnostics
Routine Maintenance
1
2
3
4
5
6
901597L.AI
Figure 9.3 Removing/Replacing the Array Fitting
9.
1. Guide Pins
4. Gel Strand
2. Eject Lever
5. Optics Base Plate (bottom)
3. Array Fitting
6. Array Fitting
With the array fitting in hand, blow dust and debris off of the windows with compressed
gas (Texwipe Microduster III, PN: TX2511).
10. Using a water-moistened swab (Texwipe Swab, PN: TX754B), gently wipe the detection
window by stroking in one direction only as shown in Figure 9.4
346
GenomeLab Genetic Analysis System User’s Guide
PN A29142-AB
Maintenance and Diagnostics
Routine Maintenance
1
2
3
901589L AI
Figure 9.4 Cleaning the Detection Window
1. Detection Window
3. Array Fitting
2. Stroke in one direction ONLY!
11. With a new water-moistened swab, repeat wiping on the other side of the window.
12. With a dry swab, gently wipe the windows to remove excess water, again repeating on
the backside with a new, dry swab.
13. Blow compressed gas on the windows to remove all excess water.
CAUTION Make sure not to invert the compressed gas bottle; otherwise, propellant will contaminate the
capillary windows.
14. If dried gel or other debris remains on the window, repeat this procedure.
GenomeLab Genetic Analysis System User’s Guide
PN A29142-AB
347
Maintenance and Diagnostics
Routine Maintenance
15. In the Remove Capillary dialog box (Figure 9.5), select the Clean Capillaries radio
button and click OK .
Figure 9.5 Remove Capillary Array Dialog Box
16. While holding the array fitting tab, align the array fitting with the manifold opening and
guide pins. Push the fitting into the manifold until it is completely seated against the
bases of the guide pins (Figure 9.3).
17. Replace the manifold access cover and tighten the captive screw.
18. Lower the capillary temperature control cover and secure the two rubber latches.
19. Lower the capillary access cover and sample access cover to their closed/locked
positions.
348
GenomeLab Genetic Analysis System User’s Guide
PN A29142-AB
Maintenance and Diagnostics
Routine Maintenance
20. Click Done in the Install Capillary Array dialog box (Figure 9.6).
Figure 9.6 Install Capillary Array Dialog Box
CAUTION After cleaning the detection windows, perform the optical alignment procedure and monitor the
baseline. If background levels are above 6000 counts, repeat the cleaning process.
Replacing the Gel Waste Bottle
NOTE This procedure assumes that you are replacing a used (full) waste bottle with an empty waste bottle.
Use the Run module to ensure the instrument is ready and follow these procedures to change
the bottle.
1.
In the Run module, select Replenish | Empty Waste Bottle. The following dialog box
displays a warning as the instrument prepares for removal.
Figure 9.7 Empty Waste Bottle Dialog Box - Stop
GenomeLab Genetic Analysis System User’s Guide
PN A29142-AB
349
Maintenance and Diagnostics
Routine Maintenance
2.
Wait until the dialog box displays the “GO” message in green text. At this time, it is safe
to open the sample access door. Leave this dialog box open.
Figure 9.8 Empty Waste Bottle Dialog Box - Go
3.
Change the waste bottle, as described in the following steps.
4.
Remove the cap from the new (empty) waste bottle.
5.
Open the sample access cover (Figure 9.1) and lift to the vertical locking position.
6.
With the gel waste bottle 80-90% full, remove the cap and pull the bottle out of the
instrument.
7.
Place the cap from the new bottle over the full waste bottle and secure.
8.
Thread the new bottle onto the cap attached to the instrument and set the bottle into
position.
9.
Close the sample access cover.
10. Dispose of the full waste bottle according to procedures found in "Disposal of the Gel
Waste Bottle" on page 377.
11. In the Empty Waste Bottle dialog box, click Done.
Replacing the Wetting Tray
Removing the Wetting Tray
1.
Select Replenish | Replace Wetting Tray.
2.
Click OK when prompted to verify this action.
3.
Wait until the dialog box message displays “GO” with a green text message.
4.
Open the sample access cover (Figure 9.1) and lift to the vertical locking position.
5.
Remove the sample plate and set it aside.
6.
Rotate the wetting tray retainers outwards to release the wetting tray.
7.
Lift the wetting tray vertically.
Cleaning the Wetting Tray
350
1.
Remove the wetting tray lid assembly from the wetting tray reservoir.
2.
Rinse the wetting tray lid and reservoir with deionized water and dispose of the rinse
into a hazardous liquid organic waste container.
GenomeLab Genetic Analysis System User’s Guide
PN A29142-AB
Maintenance and Diagnostics
Routine Maintenance
3.
Dry the lid assembly and reservoir.
To fill with D.I. water:
1.
Remove the lid of the wetting tray and fill it with D.I. water to the indicator line.
2.
Replace the wetting tray lid.
CAUTION You should process no more than one 96-well plate for each wetting tray without replenishing the
wetting tray.
Periodically check the liquid level in the wetting tray. The liquid level should NEVER be
allowed to rise into the eight recesses of the wetting tray lid, nor drop below the fill level
indicator line (9 mL minimum). The top surface of the wetting tray lid must remain clean and
dry under any and all circumstances.
Installing the Wetting Tray
1.
Select Replenish | Replace Wetting Tray.
2.
Click OK when prompted to verify this action.
3.
Open the sample access cover (Figure 9.1) and lift to the vertical locking position.
4.
Rotate the wetting tray retainers outward. Insert the wetting tray into the receptacle
between the Sample and Buffer plates (Figure 9.9) and then gently press it down into the
well.
5.
Rotate the wetting tray retainers inwards to lock the wetting tray in place.
NOTE If a sample plate is installed in the system, you must remove it before installing the wetting tray to
allow movement of the wetting tray retainers.
3
4
6
5
2
1
901598L.AI
Figure 9.9 Replacing the Wetting Tray
1. Front Location
4. Wetting Tray
2. Wetting Tray Well
5. Wetting Tray Retainers
3. Wetting Tray Lid
6. Sample Plate Holder
GenomeLab Genetic Analysis System User’s Guide
PN A29142-AB
351
Maintenance and Diagnostics
Direct Control and Replenishment
6.
Close the sample access cover.
7.
Click Done on the Replace Wetting Tray dialog box (Figure 9.10).
Figure 9.10 Replace Wetting Tray Dialog Box
9.2
Direct Control and Replenishment
The following procedures provide system replenishment procedures using the Run module’s
Direct Control functions. To access these functions, use the Run module’s Direct Control
menu, the Replenish menu, and the selectable areas of the Direct Control window.
NOTE Use Figure 9.1 to locate hardware components referenced in this section.
352
GenomeLab Genetic Analysis System User’s Guide
PN A29142-AB
Maintenance and Diagnostics
Direct Control and Replenishment
Accessing the Direct Control Window
Launch the Run module to open the Direct Control window, then select the Direct Control
tab.
Figure 9.11 Direct Control Window
Loading the Sample Plate and Buffer Plate
To load the sample plate or buffer plate:
1.
Select Direct Control | Access Plates .
Figure 9.12 Access Plates Dialog Box
GenomeLab Genetic Analysis System User’s Guide
PN A29142-AB
353
Maintenance and Diagnostics
Direct Control and Replenishment
2.
Click Start . The Capillaries Exposed dialog (Figure 9.13) opens.
Figure 9.13 Capillaries Exposed Dialog Box
3.
Wait until the dialog box message displays “GO” with a green text message.
4.
Open the sample access cover (Figure 9.1) and lift to the vertical locking position.
Loading the Sample Plate
1.
Make sure the Wetting Station is installed or perform the procedure "Installing the
Wetting Tray" on page 351, then return here.
2.
Align the sample plate guide pin with the notched corner of the sample plate and gently
lower the plate into position (Figure 9.14).
1
4
2
3
5
6
901600L.AI
Figure 9.14 Loading the Sample Plate
1. Sample Plate
354
4. Sample Plate Notched Edge
GenomeLab Genetic Analysis System User’s Guide
PN A29142-AB
Maintenance and Diagnostics
Direct Control and Replenishment
2. Wetting Tray Retainers
5. ALIGN together
3. Sample Plate Holder
6. Sample Plate Guide Pin
3.
When finished positioning the sample and buffer plates, close the Sample Access Cover
and then select the position from which the plates were loaded (left or right).
4.
Click the Load on the Capillaries Exposed dialog box (Figure 9.15).
CAUTION The separation gel within the capillaries will dry out if the capillaries are left exposed to the air for
more than 15 minutes.
Figure 9.15 Capillaries Exposed Dialog Box
Loading the Buffer Plate and Evaporation Cover
1.
Align the notched corner of the buffer plate with the alignment line on the buffer plate
holder (Figure 9.16).
2.
Gently push the buffer plate towards the front of the instrument and then set the plate
into the transport.
3.
At the rear of the buffer plate holder, align the buffer evaporation cover guide pin with
the buffer evaporation cover alignment notch and then gently lower the cover over the
buffer plate.
GenomeLab Genetic Analysis System User’s Guide
PN A29142-AB
355
Maintenance and Diagnostics
Direct Control and Replenishment
2
3
4
5
9
Figure 9.16 Loading the Buffer Plate and Buffer Evaporation Cover
1. Front Location
4. Buffer Evaporation Cover Alignment
Notch
2. Buffer Evaporation Cover
5. Wetting Tray Retainers
3. Buffer Plate
4.
When finished positioning the sample and buffer plates, close the Sample Access Cover
and then select the position from which the plates were loaded (left or right).
5.
Click Load on the Capillaries Exposed dialog box (Figure 9.15).
Specifying Capillary Temperature
1.
356
Select Direct Control | Capillary Temperature . The Capillary Temperature dialog box
opens, as shown in the following example.
GenomeLab Genetic Analysis System User’s Guide
PN A29142-AB
Maintenance and Diagnostics
Direct Control and Replenishment
Figure 9.17 Capillary Temperature Dialog Box
2.
Enter a capillary holding temperature value in degrees centigrade.
3.
Select Wait for temperature to be reached .
4.
Click Start .
Denaturing a Sample
1.
Select Direct Control | Denature Samples . The Denature Samples dialog box opens.
Figure 9.18 Denature Samples Dialog Box
2.
Enter a time duration in seconds.
3.
Identify the position of the Sample Set.
4.
Click Denature .
Injecting a Sample
1.
Select Direct Control | Inject . The Inject dialog box opens.
Figure 9.19 Inject Dialog Box
2.
Enter a value for the voltage in kV.
3.
Enter a time duration in seconds.
4.
Identify the position of the sample using the Sample Set spin controls.
5.
Select Inject .
GenomeLab Genetic Analysis System User’s Guide
PN A29142-AB
357
Maintenance and Diagnostics
Direct Control and Replenishment
Performing a Separation
1.
Select Direct Control | Separate . The Separate dialog box opens.
Figure 9.20 Separate Dialog Box
2.
Enter a value for the voltage in kV.
3.
Enter a time duration in minutes.
4.
Identify the position of the buffer using the Buffer Set spin controls.
5.
Select Separate .
NOTE Data will not be saved.
Replenishing the Capillaries with Gel
1.
Select Direct Control | Gel Capillary Fill . The Gel Capillary Fill dialog box opens.
Figure 9.21 Gel Capillary Fill Dialog Box
2.
Select the Buffer Plate or Wetting Tray radio button to identify the position where waste
will be expelled from the capillaries.
r
If you select Buffer Plate , use the Buffer Plate spin controls to identify the waste
position in the buffer plate, then click Fill .
r
If you select Wetting Tray, click Fill .
Purging the Manifold
1.
358
Select Direct Control | Manifold Purge . The Manifold Purge dialog box opens.
GenomeLab Genetic Analysis System User’s Guide
PN A29142-AB
Maintenance and Diagnostics
Direct Control and Replenishment
Figure 9.22 Manifold Purge Dialog Box
2.
Enter a volume in milliliters (mL) (0.1mL default).
3.
Enter the number of cycles.
4.
Click Purge .
Performing an Optical Alignment
To align the lasers with the detection windows of the eight capillaries:
1.
Select Direct Control | Optical Alignment . The Optical Alignment dialog box opens.
Figure 9.23 Optical Alignment Dialog Box
2.
3.
Save the alignment data:
a.
Select the Autosave check box.
b.
Enter a name in the Name field.
c.
Select a Project from the drop-down menu.
Select Align .
NOTE Prior to performing an Optical Alignment, it is advisable to purge the Array Manifold and fill the
capillaries with fresh gel (in that order). See "Purging the Manifold" on page 358 and "Replenishing the
Capillaries with Gel" on page 358.
Viewing Capillary Information
To view or change capillary information:
1.
Select Replenish | Capillary Information . The Capillary Information dialog box opens.
Figure 9.24 Capillary Information Dialog Box
2.
View the following information:
r
Part Number: Displays the part number of the installed capillary array.
GenomeLab Genetic Analysis System User’s Guide
PN A29142-AB
359
Maintenance and Diagnostics
Direct Control and Replenishment
r
Serial Number: Displays the serial number of the installed capillary array. (The serial
number is used to track the capillary array along with the samples that have used
the array.)
r
Date Installed: Displays the date the capillary array was installed.
r
Time Installed: Displays the time the capillary array was installed.
r
Number of Runs: Specify the desired number using the spin-control. (Set more than
the recommended number of separations to be performed before the system alerts
you that the recommended number of runs has been exceeded.)
r
Days on instrument: Specify the number of days on the instrument using the
spin-control. (This allows the capillary array to reside on the instrument longer
than the recommended length of time before the system alerts you that the
recommended number of days on the instrument has been exceeded.)
r
Advanced: Click this button to display the Capillary Advanced Information dialog
box. This dialog box displays the length and diameter of the installed capillary array
based on the part number entered in the New Capillary Array dialog box. The fields
are read-only and cannot be edited. Click OK to enter the information and close the
dialog box.
3.
When finished, click OK to close the windows.
Viewing Gel Information
1.
Select Replenish | Gel Cartridge/Buffer Information . The Gel Cartridge/Buffer
Information dialog box opens.
Figure 9.25 Gel Cartridge/Buffer Information Dialog Box
2.
360
Use the Gel Cartridge/Buffer Information dialog box (Figure 9.25) to view the following
information:
r
Part Number: Displays the part number of the installed gel cartridge.
r
Lot Number: Displays the lot number of the installed gel cartridge. (The lot number is
used to track the gel lot along with the separations that have used the gel.)
r
Gel Name: The name of the gel.
r
Date Installed: Displays the date the gel cartridge was installed.
GenomeLab Genetic Analysis System User’s Guide
PN A29142-AB
Maintenance and Diagnostics
Direct Control and Replenishment
r
Time Installed: Displays the time the gel cartridge was installed.
r
Hours on Instrument: Displays the number of hours that the gel cartridge has remained
on the instrument.
3.
When finished, select OK to close the window.
Viewing or Changing Buffer Information
1.
Select Replenish | Gel Cartridge/Buffer Information from the Run Module menu bar.
2.
Use the Gel Cartridge/Buffer Information dialog box (see the figure above) to view or
change the buffer lot number.
NOTE The buffer lot number can only be changed when the instrument is not performing a separation.
Removing and Replacing the Capillary Array
CAUTION Take care when installing/removing the capillary array to prevent damage and maintain low
background signals. Clean all gel residues thoroughly.
NOTE This procedure assumes that an expended capillary array is being replaced with a new capillary array.
1.
Select Replenish | Release Capillary Array. After the system prepares for release of the
capillary array, the Remove Capillary Array dialog box opens.
Figure 9.26 Remove Capillary Array Dialog Box
2.
Open the Sample Access Cover (Figure 9.1) and lift to the vertical locking position.
3.
Open the Capillary Access Cover and lift to the vertical locking position.
4.
Unlatch the two rubber latches holding the Capillary Temperature Control Cover and lift
to the vertical locking position.
5.
Loosen the Manifold Access Cover captive screw (Figure 9.27), remove the cover and set
it aside.
GenomeLab Genetic Analysis System User’s Guide
PN A29142-AB
361
Maintenance and Diagnostics
Direct Control and Replenishment
Figure 9.27 Manifold Access Cover
1. Capillary Temperature Control Cover
(open)
4. Captive Screw
2. Plenum Assembly
5. Manifold Access Cover (removed)
3. Manifold Access Cover
6.
Loosen the two plenum assembly captive screws (Figure 9.28), pull the plenum
assembly straight back and away from the instrument and set it aside.
CAUTION Slowly remove the plenum assembly as the electrode block may disengage from its mounting
posts and become damaged.
362
GenomeLab Genetic Analysis System User’s Guide
PN A29142-AB
Maintenance and Diagnostics
Direct Control and Replenishment
Figure 9.28 Plenum Assembly Removal
1. Captive Screw
3. Plenum Assembly
2. Rubber Latch
4. Captive Screw
7.
Lift the plenum assembly (Figure 9.28) to release the Array Fitting.
8.
Grasp the Array Fitting tab (Figure 9.28) and then:
a.
Pull the fitting approximately one inch out of the manifold.
b.
Touch the tip of the fitting to the bottom of the optics base plate.
c.
Hold and wait five seconds for the gel strand to dry.
d.
Pull the fitting away from the instrument.
e.
Wipe gel strands off of the instrument using a damp tissue.
NOTE Note the number of runs and days on the instrument for this capillary array for reference. If this
capillary array is to be re-installed, this information is necessary. A label has been provided on the back of
the array packaging container so that this information may be recorded.
GenomeLab Genetic Analysis System User’s Guide
PN A29142-AB
363
Maintenance and Diagnostics
Direct Control and Replenishment
1
2
3
4
5
6
901597L.AI
Figure 9.29 Removing/Replacing the Array Fitting
9.
1. Guide Pins
4. Gel Strand
2. Eject Lever
5. Optics Base Plate (bottom)
3. Array Fitting
6. Array Fitting
Grasp the electrode block tab (Figure 9.29) and pull the block out and away from the
instrument. If removal of the block tab is difficult, use the eject lever to assist.
10. From the Remove Capillary Array dialog box (Figure 9.26), select the Replace Capillary
Array option and click OK .
364
GenomeLab Genetic Analysis System User’s Guide
PN A29142-AB
Maintenance and Diagnostics
Direct Control and Replenishment
1
2
901602.AI
Figure 9.30 Removing/Replacing the Electrode Block
1. Guide Block Pins
2. Electrode Block
CAUTION Always grip the capillary array fitting near the end during removal or installation of the tip cap to
prevent flexing and possible breakage of the capillary array as shown below.
900654L.AI
GenomeLab Genetic Analysis System User’s Guide
PN A29142-AB
365
Maintenance and Diagnostics
Direct Control and Replenishment
Figure 9.31 Array Fitting
11. While holding the Array Fitting tab (of the new capillary array), align the Array Fitting
(Figure 9.31) with the manifold opening and guide pins. Push the fitting into the
manifold until it is completely seated against the bases of the Guide Pins. Make sure that
the fitting tab is placed downward when inserting the capillary array into its slot.
12. While holding the electrode block tab, align the electrode block (Figure 9.30) with the
guide block pins and gently push it in until resistance is met. (The resistance is from the
spring-loaded contacts.)
13. When installing the capillary array, carefully route the capillaries through the hole in the
plenum assembly (Figure 9.28) and straight across into the guide block pins (Figure
9.30).
Figure 9.32 Plenum Assembly - Capillary Routing Hole
NOTE When reinstalling the plenum assembly, gently gather the capillaries between your thumb and
forefinger to make sure they pass through the hole in the plenum assembly without any constriction.
14. Replace the plenum assembly and tighten the two captive screws (Figure 9.32).
15. Replace the manifold access cover and tighten the captive screw (Figure 9.27).
16. Lower the capillary temperature control cover and secure the two rubber latches.
17. Lower the capillary access cover and sample access cover to their locking positions.
366
r
If you are installing a new capillary array, in the Install Capillary Array dialog box
(Figure 9.33), select the correct part number, enter the serial number, click Set to
New, then click Done . The number of runs and days on instrument will revert to “0.”
r
If you are installing the previous capillary array, do not change the serial number,
number of runs, or the number of days on the instrument as they will be correct.
r
If you are installing a capillary array that was previously used, but not the last
capillary array on the instrument, enter its part number (if applicable) serial
GenomeLab Genetic Analysis System User’s Guide
PN A29142-AB
Maintenance and Diagnostics
Direct Control and Replenishment
number, and adjust the number of runs and the previous cumulative days on the
instrument. Then click Done .
NOTE Note the number of runs and days on the instrument for this capillary array for reference.
Figure 9.33 Install Capillary Array Dialog Box
18. The Confirm Capillary Array Selection dialog will appear. Read it and make the selection
Yes to continue, or No to abort the capillary installation.
Removing and Replacing a Gel Cartridge/Gel Pump Plug
CAUTION Care must be exercised when installing/removing a gel cartridge due to the viscosity of the gel
mixture.
NOTE This procedure assumes that an expended gel cartridge is being replaced with a fresh gel cartridge or
that a used gel cartridge is being removed (for storage purposes) and being replaced with the gel pump plug.
1.
Select Replenish | Release Gel Cartridge . When the system is ready to release the gel
cartridge, the Release Gel Cartridge dialog box will be displayed. Wait until the lead
screw is completely disengaged.
2.
Open the Gel Pump/Gel Cartridge Access Cover by gently pushing in on the top of the
cover. (The cover is spring-loaded and will pop open.)
3.
Pull on the Cartridge Locking Lever. (The barrel will swing outwards to approximately a
90° angle from its locked position.)
GenomeLab Genetic Analysis System User’s Guide
PN A29142-AB
367
Maintenance and Diagnostics
Direct Control and Replenishment
Figure 9.34 Removing/Replacing the Gel Cartridge
1. Gel Pump/Gel Cartridge Access Cover
4. Cartridge Locking Lever
2. Cartridge Locking Lever
5. Cartridge Barrel
3. Cartridge Barrel
4.
Grasp the wings of the gel cartridge/gel pump plug and pull it out of the barrel.
NOTE Always note the lot number and the hours on the instrument for a gel cartridge if you are planning to
use it for more than one session.
5.
368
If necessary, use a tissue to wipe gel strands off of the instrument.
GenomeLab Genetic Analysis System User’s Guide
PN A29142-AB
Maintenance and Diagnostics
Direct Control and Replenishment
1
3
2
4
901603L.AI
Figure 9.35 Removing/Replacing the Gel Cartridge - Continued
1. Cartridge Wings
3. Cartridge Locking Lever (open)
2. Gel Cartridge or Gel Pump Plug
4. Cartridge Barrel
6.
Remove any air pockets from the gel cartridge by grasping the cartridge wings between
your first two fingers, and pressing the plunger with your thumb until a small amount of
gel is pushed out of the cartridge tip.
7.
Insert the new cartridge or the gel pump plug into the barrel and lock it into position by
aligning the cartridge wings with the cartridge holder and pushing in.
8.
Push the cartridge locking lever towards the back of the instrument (approximately a 90°
angle) into its locked position.
9.
Close the Gel Pump/Gel Cartridge Access Cover.
10. In the Remove Gel Cartridge dialog box (Figure 9.36):
r
Click Install Cartridge to indicate that a gel cartridge was installed.
OR
r
Click Install Plug to indicate that the gel pump plug (or empty cartridge) was
installed.
GenomeLab Genetic Analysis System User’s Guide
PN A29142-AB
369
Maintenance and Diagnostics
Direct Control and Replenishment
Figure 9.36 Remove Gel Cartridge Dialog Box
11. If Install Plug was selected in step 10, proceed to step 12.
If Install Cartridge was selected in step 10, use the Install Gel Cartridge dialog box
(Figure 9.37) to enter the following information:
a.
If you are installing a new gel cartridge, click New. The system will automatically
update the date and time installed and set the Hours on Instrument to “0.”
b.
Next, enter the lot number.
c.
If you are installing a used Gel Cartridge, select Used.
d.
r
If you are installing the previous gel cartridge, do not change the lot number, or
the hours on the instrument, as they will be correct.
r
If you are installing a previously used gel cartridge, but it was not the last one
on the instrument, enter its part number and/or lot number, and adjust the
hours to properly reflect the hours this cartridge has been on the instrument.
Click Done on the Install Gel Cartridge dialog.
NOTE Always note the lot number and the hours on the instrument for a gel cartridge if you are planning to
use it for more than one session. The lot number is an alphanumeric text box for your own identification
purposes.
370
GenomeLab Genetic Analysis System User’s Guide
PN A29142-AB
Maintenance and Diagnostics
Direct Control and Replenishment
Figure 9.37 Install Gel Cartridge Dialog Box
12. Dispose of the used tissue and spent gel cartridge in accordance with the procedure. See
"Biological Waste Disposal" on page 373.
Removing the Manifold Plug
The Manifold Plug is installed during shipping and when the instrument is not in use, to
prevent drying of gel.
NOTE This procedure assumes that the Manifold Plug is being removed in preparation for Capillary Array
installation.
1.
Select Replenish | Release Capillary Array from the Run Module main menu.
2.
Wait for the Remove Manifold Plug dialog box to appear.
3.
Open the Sample Access Cover (Figure 9.1) and lift it to the vertical locking position.
4.
Open the Capillary Access Cover and lift it to the vertical locking position.
5.
Unlatch the two rubber latches holding the Capillary Temperature Control Cover and lift
it to the vertical locking position (Figure 9.38).
6.
Loosen the Manifold Access Cover captive screw, remove the cover and set it aside.
GenomeLab Genetic Analysis System User’s Guide
PN A29142-AB
371
Maintenance and Diagnostics
Direct Control and Replenishment
Figure 9.38 Manifold Access Cover
1. Capillary Temperature Control Cover 4. Captive Screw
2. Plenum Assembly
5. Manifold Access Cover (removed)
3. Manifold Access Cover
372
7.
Lift the Eject Lever to release the Manifold Plug.
8.
Grasp the Manifold Plug tab (Figure 9.39) and then:
a.
Pull the plug approximately one inch out of the manifold.
b.
Touch the tip of the plug to the bottom of the Optics Base Plate.
c.
Hold and wait five seconds for the gel strand to dry.
d.
Pull the plug out and set it aside for future use.
e.
Wipe gel strands off of the instrument using a damp tissue.
GenomeLab Genetic Analysis System User’s Guide
PN A29142-AB
Maintenance and Diagnostics
Biological Waste Disposal
1
2
3
4
5
6
901597L.AI
Figure 9.39 Removing the Manifold Plug
9.
1. Guide Pins
4. Gel Strand
2. Eject Lever
5. Optics Base Plate
3. Array Fitting
6. Array Fitting
Click OK on the Remove Manifold Plug dialog box.
10. To install the capillary array, see "Removing and Replacing the Capillary Array" on page
361.
9.3
Biological Waste Disposal
WARNING The GenomeLab Genetic Analysis system has been designed to minimize exposure to hazardous
chemicals and biological waste. However, care must still be exercised when removing used chemicals and
biological samples from the instrument. The information below provides the minimum protocols to use
when handling hazardous chemicals and biological waste.
GenomeLab Genetic Analysis System User’s Guide
PN A29142-AB
373
Maintenance and Diagnostics
Biological Waste Disposal
Disposal of Formamide from the Sample Plate
Multi-Channel Pipettor
Table 9.3-1
WARNING
When performing this procedure, use an exhaust ventilation unit that
meets TLV requirements.
1.
Aspirate 40 µL of formamide from the thermo-cycling
plate.
2.
Dispense the formamide into a hazardous liquid organic
waste container.
3.
After all wells are clear, allow the empty plate to sit in the
ventilation unit for 24 hours.
Table 9.3-2
WARNING
Dispose of formamide in accordance with all applicable federal, state,
and local environmental regulations concerning hazardous liquid waste.
Bulk Disposal
Table 9.3-3
WARNING
When performing this procedure, use an exhaust ventilation unit that
meets TLV requirements.
1.
Using a 1L side arm flask as a trap, connect the trap to a
vacuum.
2.
Attach a pipette to the trap using chemical resistant
tubing.
3.
Aspirate the formamide from each well and dispose of it
in a hazardous liquid organic waste container.
4.
After complete removal of all formamide from the plates,
allow the empty plate to sit in the ventilation unit for 24
hours.
5.
Dispose of the plate in a solid waste container.
Table 9.3-4
WARNING
374
Dispose of formamide in accordance with all applicable federal, state,
and local environmental regulations concerning hazardous liquid waste.
GenomeLab Genetic Analysis System User’s Guide
PN A29142-AB
Maintenance and Diagnostics
Biological Waste Disposal
Disposal of Buffer/Gel Mixture from the Buffer Plate
Multi-Channel Pipettor
Table 9.3-5
WARNING
When performing this procedure, use an exhaust ventilation unit that
meets TLV requirements.
1.
Aspirate 400 µL of buffer/gel mixture from the 96-well
plate.
2.
Dispose the buffer/gel mixture into a hazardous liquid
organic waste container.
3.
Rinse the plate wells with water and dispose of the rinse
in the liquid waste container.
4.
After all wells are clear, allow the empty plate to sit in the
ventilation unit for 24 hours.
5.
Dispose of the plate in a solid waste container.
Table 9.3-6
WARNING
Dispose of buffer/gel mixture in accordance with all applicable federal,
state, and local environmental regulations concerning hazardous liquid
waste.
Bulk Disposal
Table 9.3-7
WARNING
GenomeLab Genetic Analysis System User’s Guide
PN A29142-AB
When performing this procedure, use an exhaust ventilation unit that
meets TLV requirements.
1.
Using a 1L side arm flask as a trap, connect the trap to a
vacuum.
2.
Attach a pipette to the trap using chemical resistant
tubing.
3.
Aspirate the formamide from each well and dispose of it
in a hazardous liquid organic waste container.
4.
After complete removal of all formamide from the plates,
allow the empty plate to sit in the ventilation unit for 24
hours.
5.
Dispose of the plate in a solid waste container.
375
Maintenance and Diagnostics
Biological Waste Disposal
Table 9.3-8
WARNING
Dispose of buffer/gel mixture in accordance with all applicable federal,
state and local environmental regulations concerning hazardous liquid
waste.
Disposal of the Capillary Array
Table 9.3-9
WARNING
After removing the expended capillary array from the instrument,
dispose of it in a solid hazardous waste container.
Disposal of the Gel Cartridge
Table 9.3-10
WARNING
After removing the expended gel cartridge from the instrument, use a
lab spatula or wooden dowel to push any remaining gel into a liquid
hazardous waste container. Dispose of the empty cartridge in a solid
hazardous waste container.
Disposal of D.I. Water/Gel Mixture from the Wetting Tray
Table 9.3-11
WARNING
376
When performing this procedure, use an exhaust ventilation unit that
meets TLV requirements.
1.
Pour the D.I. water/gel mixture into a hazardous liquid
organic waste container.
2.
Rinse the Wetting Tray with water and dispose of the
rinse in the liquid waste container.
GenomeLab Genetic Analysis System User’s Guide
PN A29142-AB
Maintenance and Diagnostics
Biological Waste Disposal
Table 9.3-12
WARNING
Dispose of D.I. water/gel mixture in accordance with all applicable
federal, state, and local environmental regulations concerning
hazardous liquid waste.
Disposal of the Gel Waste Bottle
Table 9.3-13
WARNING
When performing this procedure, use an exhaust ventilation unit that
meets TLV requirements.
Dispose of buffer/gel mixture in accordance with all applicable federal,
state, and local environmental regulations concerning hazardous liquid
waste.
GenomeLab Genetic Analysis System User’s Guide
PN A29142-AB
377
Maintenance and Diagnostics
Consumable Items List
9.4
Consumable Items List
Table 9.14 provides a list of the required consumable items for the Sequence Analysis system.
Table 9.14 Consumable Items Required for Sequence Analysis
Item
Method
Development Kit
(DNA Sequencing
RXN Kit)
QTYa
P/N
608000
1
or
DTCS Quick Start
Kit
608120
1
Description
Dye Terminator Cycle Sequencing Kit for 96 reactions.
Includes:
r
DNA polymerase
r
Dye Terminators (ddUTP, ddGTP, ddCTP, ddATP)
r
dNTP (I) Mix Solution
r
dNTP (G) Mix Solution
r
Sequencing Reaction Buffer
r
pUC18 Control Template
r
-47 Sequencing Primer
r
Glycogen
r
Mineral Oil
r
Sample Loading Solution (SLS)
Dye Terminator Cycle Sequencing Kit for 96 reactions in a single
tube containing:
r
DNA polymerase
r
Dye Terminators (ddUTP, ddGTP, ddCTP, ddATP)
r
dNTP Mix Solution
r
Sequencing Reaction Buffer
r
pUC18 Control Template
r
-47 Sequencing Primer
r
Glycogen
r
Mineral Oil
r
Sample Loading Solution (SLS)
Sequencing Test
Sample
608070
1
Prepared pUC18 sequencing control sample in sample loading
solution. Sufficient to perform 24 separations.
Separation Gel
LPA 1
391438
1
20 mL of gel in CE system compatible container. Sufficient to run
two 96 well plates.
Separation Buffer
608012
1
Each container has a screw top and pour tip. The container has
enough buffer (30 mL) to fill a 96-well, flat bottom buffer plate.
(Each well being 3/4 full.) 4/pack
DNA Separation
Capillary Array
33-75B
608087
1
Eight capillaries, 75 µm i.d., 33 cm long, 200 o.d. complete with
electrode block and detector array fitting.
Buffer Plates
609844
Box
Package of 100 flat-bottom polystyrene plates, nonsterile, without
lids. Required for use as the separation buffer plate.
Sample Plate
609801
Box
Package of 25 V-bottom thermal cycler-compatible polypropylene
plates with 200 µL volume capacity. Required for use as the CE
system sample plate. 25 plates/box
378
GenomeLab Genetic Analysis System User’s Guide
PN A29142-AB
Maintenance and Diagnostics
Consumable Items List
a. Contact your local Beckman Coulter representative for specific consumable material requirements based on
your application and frequency of use.
Table 9.15 provides a list of the required consumable items for the Fragment Analysis system.
Table 9.15 Consumable Items Required for Fragment Analysis
Item
QTYa
P/N
Description
DNA Separation
Capillary Array
33-75B
608087
1
Eight capillaries, 75 µm i.d., 33 cm long, 200 o.d. complete with
electrode block and detector array fitting.
Separation Gel
LPA 1
391438
1
20 mL of gel in CE system compatible container. Sufficient to run
two 96 well plates.
Separation
Buffer
608012
1
Each container has a screw top and pour tip. The container has
enough buffer (30 mL) to fill a 96-well, flat bottom buffer plate.
(Each well being 3/4 full.) 4/pack
DNA Size
Standard Kit 80
608395
1
Contains fragments of 13 and 80 nucleotides designed to
accommodate a wide range of sizes for multiplexed and
poolplexed SNP fragments.
DNA Size
Standard Kit 400
608098
1
DNA size standard for analysis of fragments up to 400
nucleotides. Includes:
DNA Size
Standard Kit 600
608095
SNPStart Primer A23201
Extension Kit
GenomeLab Genetic Analysis System User’s Guide
PN A29142-AB
1
1
r
Mineral Oil
r
DNA fragments of the following sizes labeled with WellRED
fluorescent dye: 60, 70, 80, 90, 100, 120, 140, 160, 180,
190, 200, 220, 240, 260, 280, 300, 320, 340, 360, 380, 400,
and 420 nucleotides
r
Sufficient for 96 fragment analysis separations
DNA size standard for analysis of fragments up to 600
nucleotides. Includes:
r
Mineral Oil
r
DNA fragments of the following sizes labeled with WellRED
fluorescent dye: 60, 70, 80, 90, 100, 120, 140, 160, 180,
190, 200, 220, 240, 260, 280, 300, 320, 340, 360, 380, 400,
420, 440, 460, 480, 500, 520, 540, 560, 580, 600, 620, and
640 nucleotides
r
Sufficient for 96 fragment analysis separations
Dye Terminator SNP Primer Extension Kit for 96 reactions in a
single tube containing:
r
SNPStart Master Mix
r
Control
r
Mineral Oil
r
Sample Loading Solution (SLS) (PN 608082)
379
Maintenance and Diagnostics
Consumable Items List
Table 9.15 Consumable Items Required for Fragment Analysis
Item
GeXP Start Kit
GeXP Human
ReferencePlex
QTYa
P/N
A21019
A21055
1
1
Description
Kit contents include:
r
RT Buffer 5X, 480 µL (green)
r
Reverse Transcriptase, 120 µL at 20 units/µL (red)
r
PCR Buffer 5X, 480 µL (amber)
r
KANr RNA with RI, 600 µL (yellow)
r
DNase/RNase Free H2O, 1200 µL (white)
r
DNA Size Standard-400, 55 µL
r
Mineral Oil, 5 mL
r
GenomeLab Sample Loading Solution, 6 mL
r
RT Rev Primer Plex Human Reference Plex, 240 µL
(orange)
r
PCR Fwd Primer Plex Human Reference Plex, 240 µL (blue)
r
Control RNA Templates Human Reference Plex, 30 µL at
100 ng/µL (from human source) (gray)
Sample Loading
Solution (SLS)
608082
1
Sample Loading Solution (SLS), 6.0 mL
Buffer Plates
609844
Box
Package of 100 flat-bottom polystyrene plates, nonsterile, without
lids. Required for use as the separation buffer plate.
Sample Plate
609801
Box
Package of 25 V-bottom thermal cycler-compatible polypropylene
plates with 200 µL volume capacity. Required for use as the CE
system sample plate. 25 plates/box.
a. Contact your local Beckman Coulter representative for specific consumable material requirements based on
your application and frequency of use.
380
GenomeLab Genetic Analysis System User’s Guide
PN A29142-AB
Maintenance and Diagnostics
Consumable Items List
The following table identifies the materials that are required for either Sequence Analysis or
Fragment Analysis, but do not come with the product.
Table 9.16 Materials Required but not Supplied
Sequence
Analysis
Fragment
Analysis
Refrigerated microfuge
✔
✔
Molecular Biology Grade: sterile dH2O, 95% (v/v) ethanol/dH2O, 70%
(v/v) ethanol/ dH2O
✔
✔
Sterile tubes - 0.5 mL microfuge, 0.2 mL thin wall thermal cycling tubes
or plates with caps
✔
✔
Thermal cycler with heated lid
✔
✔
Sample Loading Solution (SLS)
—
✔
Mini Alpha Swab from Texwipe, P/N: TX754B (VWR)
✔
✔
Microduster III AccTech, P/N: 58019-538 (VWR)
✔
✔
20 mg/mL Glycogen - Boehringer Mannheim Cat. # 901 393
—
✔
3M Sodium Acetate pH5.2 - Sigma, Cat. # S7899
✔
✔
100mM Na2-EDTA pH8.0 (500 mM Sigma Cat. # 7889)
✔
—
PCR enzyme and buffer
—
✔
Labeled primers (contact your local Beckman Coulter representative for
information on vendors carrying the appropriate primers)
—
✔
Thermal cycling plates and caps
—
✔
Item
Table 9.17 Materials Required but not Supplied with this Kit - Reagents
Item
Part Number
Thermo-Start® DNA Polymerase with separate 25 mM MgCl2
ABgene AB-0908
Nuclease-Free H2O, non-DEPC Treated
USB 71786 or Invitrogen
10977-015
1M Tris-HCl pH 8.0
USB 22638
GenomeLab Separation Buffer
608012
GenomeLab Separation Capillary Array
608087
GenomeLab Separation Gel for single-plate systems such as CEQ 8000
20 mL (391438) or
10 mL (608010)
GenomeLab Genetic Analysis System User’s Guide
PN A29142-AB
381
Maintenance and Diagnostics
Diagnostics
Table 9.18 Equipment and Supplies
Item
Part Number
GenomeLab GeXP Genetic Analysis System
A26572 or A28130
Sample Microplates, 96-Well
609081
8-Well Cap Stops
BioRad TCS-0803 or
Corning/Costar 0556
Buffer Microplates, 96-Well
609844
1.5 mL and 0.65 mL Microtubes
Pipettors, P10, P20, P100, P200, and P1000
Aerosol Resistant Tips for P10, P20, P100, P200 and P1000
Microtube Centrifuge
365603
Microplate Centrifuge
Thermocycler with Heated Lid for 96-Well Plates
Vortex Mixer
Non-Frost-Free Freezers (-80°C and -20°C)
9.5
Diagnostics
This section provides some common diagnostic procedures you may perform as needed on
the GenomeLab GeXP system.
Re-Initializing the System
To re-initialize the system, select Run | Reset in the Run module.
Homing the Plates and/or Gel Pump
To re-establish the position of the plates and/or gel pump:
1.
Select Run | Diagnostics in the Run module. The Diagnostics dialog box opens.
2.
Select the Home Plate and/or Gel Pump check box.
3.
Click OK .
4.
Monitor the Tests dialog box and verify that the final results is “Test passed.”
5.
Click the Close button.
Viewing PC Settings
To view the computer settings:
382
1.
Select Run | Diagnostics in the Run module. The Diagnostics dialog box opens.
2.
Click the PC Settings button. The PC Communication Settings dialog box opens.
3.
View the settings the system uses to communicate with the instrument, then exit the
dialog box.
GenomeLab Genetic Analysis System User’s Guide
PN A29142-AB
Maintenance and Diagnostics
Diagnostics
Viewing Instrument Status
To view the instrument status:
1.
Select Run | Diagnostics in the Run module. The Diagnostics dialog box opens.
2.
Click Status .
3.
View and/or change the settings in the Run Control Monitor dialog box.
4.
Click OK .
Viewing Optical Scan Data
To view the optical scan data in either the Sequence Analysis or Fragment Analysis module:
1.
Select File | Open from the desired analysis module. The Open dialog box opens.
2.
Select the Optical Scan Data tab, highlight the desired sample name, then click OK .
3.
Verify that the Optical Scan window is displayed.
Monitoring the Baseline
To ensure that the optics are working correctly and that the capillaries are clean, view the
baseline after installing a new capillary array, filling with gel for the first time, or performing
an optical alignment. The baseline trace should be low and relatively flat.
NOTE You must perform the optical alignment procedures prior to monitoring the baseline ("Performing an
Optical Alignment" on page 359).
To monitor the baseline:
1.
Select Run | Monitor Baseline. The Monitor Baseline dialog box opens.
Figure 9.40 Monitor Baseline Dialog Box
NOTE If you select Autosave on this dialog box, the system stores baseline data under the Sample Data
node (for the selected project) in the Data Manager. If you do not manually end the Monitor Baseline, it
collects baseline data until you run a sample plate or until six hours have elapsed from the start of the
baseline monitoring process.
2.
3.
In the Monitor Baseline dialog box:
a.
Select the Enable Monitor Baseline check box.
b.
Click OK.
Select the Data Monitor tab to view the baseline trace.
To view the baseline trace:
GenomeLab Genetic Analysis System User’s Guide
PN A29142-AB
383
Maintenance and Diagnostics
Diagnostics
1.
Access the desired analysis module.
2.
Select File | Open .
3.
Select the Sample Data tab and select the desired baseline data (the baseline data is
displayed).
After reviewing the baseline trace, disable Monitor Baseline. To do this:
384
1.
Select Run | Monitor Baseline.
2.
In the Monitor Baseline dialog box:
a.
Select the Enable Monitor Baseline check box to clear the check mark.
b.
Click OK.
GenomeLab Genetic Analysis System User’s Guide
PN A29142-AB