1
Setup and Troubleshooting Procedures for the
Klein 5500 Sidescan Sonar
Colin Andrew and Amy Young
Maritime Operations Division
Systems Sciences Laboratory
DSTO-GD-0372
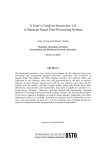
ABSTRACT
This document outlines in detail all facets associated with the set up and usage of the
Klein 5500 sidescan sonar. In particular this document outlines: (1) the different types
of hardware that are required, how they need to be set up and networked, (2) how to
set up and use the acquisiton software packages Isis and SonarPro, and (3) how to
detect, analyse and troubleshoot incorrect set up and malfunctions in the hardware and
software.
RELEASE LIMITATION
Approved for public release
Published by
DSTO Systems Sciences Laboratory
PO Box 4331
Melbourne Victoria 3001 Australia
Telephone: (03) 9626 7000
Fax: (03) 9626 7999
© Commonwealth of Australia 2003
AR-012-851
November 2003
APPROVED FOR PUBLIC RELEASE
Setup and Troubleshooting Procedures for the
Klein 5500 Sidescan Sonar
Executive Summary
Setting up the Klein 5500 sidescan sonar involves numerous steps and techniques that
a new operator may not know and which may be daunting and appear overwhelming.
This document was borne from two stimulations: (1) the need to increase the rate at
which new operators learn how to set up and use the Klein 5500 sidescan sonar and (2)
to illustrate the possible problems which may arise in the setup and how they can be
circumvented.
By creating a document of this nature it should be possible to more quickly set up the
Klein5500 sonar, so that the DSTO tasks of research and development surrounding this
sonar can be attempted sooner.
The topics covered in this document include the: (1) hardware required, its correct
setup and network architecture, (2) set up of the data acquisition computer, (3) usage of
the sonar computer (the Transceiver and Processing Unit (TPU)), (4) set up and usage
of the acquisition software packages Isis and SonarPro, and (5) trouble-shooting the
overall installation.
Contents
1 INTRODUCTION - SIDESCAN SONAR AND DSTO............................................... 1
1.1 Background Information ......................................................................................... 1
2 PHYSICAL SETUP ............................................................................................................ 20
2.1 The Klein 5500 Sidescan Sonar At DSTO .......................................................... 20
2.1.1 The Klein 5500............................................................................................. 21
2.2 Basic hardware setup.............................................................................................. 23
2.2.1 PC Hardware............................................................................................... 24
2.2.1.1 General PC................................................................................................ 24
2.2.1.2 Isis PC........................................................................................................ 25
2.2.2 Network Hardware .................................................................................... 27
2.3 Acquiring Accurate Position Information.......................................................... 29
2.3.1 Hardware Required ................................................................................... 30
2.3.2 Towfish Position ......................................................................................... 30
2.3.2.1 Towed Sonars........................................................................................... 30
2.3.2.2 Bow-mounted Sonars.............................................................................. 32
2.3.3 Navigation Inputs....................................................................................... 33
2.3.4 Cable Type................................................................................................... 36
2.3.5 Cable-out Values......................................................................................... 37
3 HOST COMPUTER SETUP............................................................................................. 39
3.1 Introduction ............................................................................................................. 39
3.2 Host Computer IP Address ................................................................................... 39
3.2.1 Windows 95................................................................................................. 40
3.2.2 Windows 2000............................................................................................. 40
3.3 FTP Servers .............................................................................................................. 41
3.3.1 Windows 95................................................................................................. 41
3.3.1.1 FTP server “ServU” ................................................................................. 42
3.3.1.2 Setting up Serv-U..................................................................................... 42
3.3.2 Windows 2000............................................................................................. 45
3.4 Network Duplex settings ...................................................................................... 48
3.4.1 Isis PC Network Settings ........................................................................... 49
3.4.2 Windows 2000............................................................................................. 49
3.5 Virtual Memory Settings....................................................................................... 50
3.6 Screen settings: ........................................................................................................ 51
3.6.1 Sonar Acquisition Software....................................................................... 51
3.6.2 Dual Screen Mode ...................................................................................... 52
4 TPU OPERATIONS .......................................................................................................... 54
4.1 Boot Sequence of TPU ........................................................................................... 54
4.2 Altering TPU Setup ................................................................................................ 59
5 CONFIGURING AND RUNNING THE ACQUISITION SOFTWARE................. 61
5.1 Introduction ............................................................................................................. 61
5.2 ISIS Setup................................................................................................................. 61
5.2.1 Sonar Setup.................................................................................................. 63
5.2.2 Serial Port Setup in Isis .............................................................................. 64
5.2.2.1 Isis Templates........................................................................................... 67
5.2.3 File Format................................................................................................... 69
5.2.4 Sentinel Querying....................................................................................... 70
5.2.5 Keeping a Log in Isis .................................................................................. 71
5.2.6 Isis Server Software .................................................................................... 72
5.2.6.1 Isis Server software (Klein5000.exe) for the Klein 5000 ..................... 72
5.2.6.2 Klein 5000 System Control (ss.exe) ....................................................... 75
5.2.7 Displaying/Saving Data in Isis ................................................................ 77
5.2.8 Optional Settings ........................................................................................ 77
5.2.8.1 Bow-mounted Sonar Depth ................................................................... 78
5.2.8.2 Layback Setting........................................................................................ 78
5.2.8.3 Sonar Altitude Alarm.............................................................................. 80
5.2.8.4 Coverage Map.......................................................................................... 81
5.2.8.5 Sound Velocity ......................................................................................... 84
5.2.8.6 Save setup ................................................................................................. 84
5.2.9 Isis Window Configuration....................................................................... 85
5.2.9.1 Parameter display window .................................................................... 86
5.2.9.1.1 Navigation ................................................................................................ 86
5.2.9.1.2 Telemetry.................................................................................................. 87
5.2.9.1.3 Range Scale............................................................................................... 88
5.2.9.1.4 Display Units............................................................................................ 88
5.2.9.1.5 Cursor Data .............................................................................................. 88
5.2.9.1.6 Current (Data) File .................................................................................. 89
5.3 SonarPro Setup........................................................................................................ 90
5.3.1 Introduction................................................................................................. 90
5.3.2 Getting Started ............................................................................................ 90
5.3.3 Alarms.......................................................................................................... 92
5.3.4 Layback ........................................................................................................ 93
5.3.5 Towfish Yaw Estimation ........................................................................... 95
5.3.6 Target Management ................................................................................... 96
5.3.7 Survey Lines ................................................................................................ 97
5.3.8 Saving Data................................................................................................ 100
5.4 Master and Slave Setup ....................................................................................... 101
6 CONNECTING TPU, ACQUISITION COMPUTER AND SONAR..................... 103
6.1 Introduction ........................................................................................................... 103
6.2 Connecting Acquisition Computer and TPU .................................................. 103
6.2.1 Power.......................................................................................................... 103
6.2.2 TPU Bootup ............................................................................................... 103
6.2.2.1 TPU Evidence......................................................................................... 104
6.3
6.4
6.2.2.2 Terminal Emulation Software.............................................................. 104
6.2.2.3 Evidence on the Acquisition PC .......................................................... 105
Towed Configuration........................................................................................... 107
6.3.1 Moving Sonar onto back of boat............................................................. 107
6.3.2 Sonar Deployment Setup......................................................................... 107
6.3.2.1 Attaching Tail Fins ................................................................................ 108
6.3.2.2 Attaching Coaxial Sonar Cable............................................................ 108
6.3.3 Testing Connection Between TPU and Sonar....................................... 109
6.3.3.1 Acquisition software ............................................................................. 109
6.3.3.2 Rub Test .................................................................................................. 110
6.3.4 Towfish Deployment ............................................................................... 111
Bow-mount Configuration.................................................................................. 112
6.4.1 Setup towfish for bow-mount................................................................. 112
6.4.2 Put Bow-mount on Boat .......................................................................... 114
7 DATA COLLECTION..................................................................................................... 116
7.1 Meta Data ............................................................................................................... 116
7.1.1 OH and S Committee Requirements ..................................................... 116
7.1.2 Testing the Sonar ...................................................................................... 116
7.1.3 Survey Information .................................................................................. 117
7.1.4 Miscellaneous............................................................................................ 117
7.2 Collecting Data...................................................................................................... 117
7.2.1 Media Selection......................................................................................... 118
8 POST-PROCESSING...................................................................................................... 120
8.1 Introduction ........................................................................................................... 120
8.2 File Playback.......................................................................................................... 120
8.2.1 ISIS .............................................................................................................. 120
8.2.2 SonarPro..................................................................................................... 120
8.3 Cursor Position Estimation ................................................................................. 123
9 TROUBLE SHOOTING ................................................................................................. 124
9.1 Introduction ........................................................................................................... 124
9.2 TPU not booting correctly ................................................................................... 124
9.3 TPU Error Light ..................................................................................................... 127
9.4 TPU Crashes........................................................................................................... 128
9.5 Incorrect usage of SonarPro ................................................................................ 128
9.6 Error Messages generated in Isis ....................................................................... 129
9.6.1 Demo Mode ............................................................................................... 129
9.6.2 CSC Error................................................................................................... 129
9.7 Serial Port Lock-up on Laptops.......................................................................... 130
9.8 IP Address Conflict .............................................................................................. 132
9.8.1 Windows 95............................................................................................... 132
9.8.2 Windows 2000........................................................................................... 132
9.9 Waterfall Display Errors/Quirks........................................................................ 132
9.9.1
9.9.2
9.9.3
Symmetrical Waterfall Display in Isis ................................................... 132
Jerky Waterfall Scroll Speed.................................................................... 133
Echosounder Interference........................................................................ 133
10 CONCLUSION ................................................................................................................ 134
11 REFERENCES................................................................................................................... 135
Appendix A: Installing software.......................................................................................... 136
Section 1 Hawkeye.............................................................................................................. 136
Section 2 ServU ................................................................................................................... 137
Section 3 Windows 2000 FTP Server ................................................................................ 140
Section 4 Isis......................................................................................................................... 142
Section 5 SonarPro .............................................................................................................. 143
Appendix B: TPU Bootup Files............................................................................................. 145
Appendix C: Klein 5500 Pressure Transducer Calibration............................................... 148
Appendix D: Formatting Magneto-Optical Disks ............................................................. 149
Section 1 Backing-up M-O disks:...................................................................................... 149
Section 2 Low-level Format ............................................................................................... 149
Section 3 High Level Format ............................................................................................. 150
DSTO-GD-0372
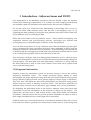
1 Introduction - Sidescan Sonar and DSTO
One requirement of the Maritime Operations Division (MOD), within the Defence
Science and Technology Organisation, is to evaluate new and emerging methods that
are available which can characterise the seabed and to also test new techniques.
For several years now, MOD has been maintaining its knowledge base of how to
operate the Klein 5500 sidescan sonar with the aim of investigating ways of: (1)
optimising the data gathered (2) fusing the data gathered with other forms of data and,
(3) the different ways of archiving the data.
DSTO has several aims involving sidescan sonars. These include investigating new
acquisition software and post-processing software, developing new software and
investigating ways of maximising the usefulness of the data gathered.
As it can take several hours to set up a sidescan sonar, then the stimulus for this report
was to document the setup procedures that have been established at DSTO, and the
techniques needed to circumvent known problems. By documenting such information
it should enable the investigations which need to be performed with the sidescan sonar
to be conducted more quickly than would otherwise be the case.
This document will begin with some background information on how sidescan sonar
works and what makes it a useful tool for object detection and determining changes in
bottom texture. This document will, most importantly, outline how to set up and run
the Klein 5500 sonar as well as some of the common errors that can be expected and
ways of circumventing them.
1.1 Background Information
Sidescan sonars are instruments which use acoustic energy to survey the seafloor,
displaying backscatter levels.
The images produced appear similar to aerial
photographs, the major differences being that they have been rendered using acoustic
energy instead of light and from lower grazing angles (or larger angles of incidence).
They also have the difference that aerial photographs are generated using passive
means of sensors where as sidescan sonars are active. The resolution achievable by
sidescan sonars in recent years is sub-meter, approximately ten to twenty centimetres.
By displaying the backscatter levels of the seafloor, sidescan sonars have been used
successfully to provide information on the locations of objects on the seafloor. The
objects they are often used to find include wrecks, reefs, debris fields and sediment
boundaries. Sidescan sonars can also provide position information of objects as well as
their length, breadth and if any, their height above the seafloor.
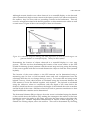
Sidescan sonars use a horizontal line array of transducers mounted either side of a tow
body called a towfish to generate an acoustic beam which is narrow in the along-track
1
DSTO-GD-0372
direction and which is wide in the across track direction (see Figures#1a and 1b,
respectively). The acoustic beam is orientated orthogonal to the towfish so the sound
pulses generated propagate away from either side of the towfish being reflected from
any surfaces they ensonify. At a predefined time delay after each ping, the
transducers switch from being acoustic generators to acoustic receivers, inverting the
acoustic signals being backscattered into electrical energy which the sonar can
display. By moving the towfish along and displaying each successive acoustic return
(or ping) a swath can be generated showing changes in seafloor acoustic backscatter. It
is by analysing this accumulation of neighbouring acoustic returns for contrasts in
backscatter that objects and sediment boundaries can be easily identified.
(a)
(b)
Figure 1 (a) Plan view of the acoustic beam generated by a sidescan sonar showing its narrow
along-track characteristic. (b) Cross-sectional view of a sidescan sonar’s acoustic
beam showing the relatively large coverage achieved in the vertical which spreads
out in the across-track direction. The sonar is travelling into the page.
The acoustic energy which is generated by the transducers on either side of the towfish
is not a pulse of constant frequency but is a pulse whose frequency increases linearly
over the length of the pulse. This slide in frequency is called a chirp and the pulses
generated called chirped pulses or Linearly Frequency Modulated waves (abbreviated
to LFMs). Such pulses have the characteristic of achieving longer ranges whilst
retaining the same resolution that would be achieved using pulses of constant
frequency. Some sonars permit the pulse width (also called pulse length) of the LFMs
to be altered. This can be warranted if different ranges or resolutions are required than
those being used. In particular the longer the pulse width the more energy being
imparted to the water column (assuming the peak power is not altered) and hence the
longer the range scales that can be achieved, but the downside is that the resolution in
the across track direction decreases with increasing pulse width (assuming the
frequency bandwidth is not altered).
2
DSTO-GD-0372
When an acoustic pulse propagates through the water column its sound pressure
decreases the further it propagates because of three different processes. In order of
decreasing magnitude these include:
•
Spherical spreading caused by the outgoing pulse occupying larger volumes
the further it propagates. This causes the intensity to drop in proportion to the
squared distance of the pulse from the transducers.
•
Absorption of sound energy due to two distinct processes. There is absorption
of sound energy as a result of shear viscosity and volume viscosity: The latter
represents “the flow of water under pressure into lattice holes in the crystal
structure” (Urick, 1991). In salt water there is additional absorption below
500kHz due to the disassociation of some of the minor salt constituents. This
type of absorption increases with increasing frequency and below 2kHz occurs
as a result of the dissociation of boric acid (H3BO3), whereas from 2kHz to
500kHz it is caused by the dissociation of magnesium sulphate ions (MgSO4).
Above 500kHz the pressure changes too rapidly for dissociation to occur and
the only mechanism of absorption is by viscosity.
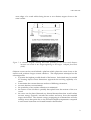
In addition to being strongly related to frequency, the absorption of acoustic
energy is also governed by the temperature of the fluid. Water pressure (or
equivalently depth) and salinity have less of an affect (Waite, 2002). Figure 2
shows the relationship between the absorption and frequency for fresh and salt
water.
Figure 2 The empirical relationship determined by Francois and Harrison (1982) between the
o
absorption coefficient of acoustic energy and frequency for fresh (10 C) and
o
saltwater (10 C and 35parts per thousand).
•
Decrease in sound pressure due to scattering by objects within the water
column. These can include suspected sediment particles, air bubbles and
marine life. This scattering not only decreases the intensity of the wave front
that is needed to ensonify the seafloor but also generates a background acoustic
3
DSTO-GD-0372
intensity that the sonar is constantly sampling and which the backscatter from
any surface needs to be above in order for it to be detected. In modelling the
decrease in acoustic energy caused by scattering it is normally assumed that
there is an even distribution of scatterers in the swath.
Unless this decrease in sound pressure is taken into account, from the transducers to
the seafloor and return, before the data is displayed, then the artefact will be created
that the seafloor at the outer extremities of the swaths have lower acoustic backscatter
characteristics than those closer to the sonar. The other artefact will be that for those
areas with visibly differing contrast, the contrast will appear to be less than it actually
is.
To account for spherical spreading, absorption of sound intensity and the scattering of
sound by suspended matter, the gain of the returning signals is increased to account
for the sound intensity that has been lost.
In any survey the range the sonar is required to display backscatter data from, for the
port and starboard sides, needs to be selected. This is the maximum distance from the
sonar to the seafloor and is termed slant range. For surveys in which object detection is
required small slant ranges are employed whereas large ranges are employed for
sediment boundary detection. The slant ranges employed by sidescan sonars used in
the coastal zone are typically between 50m and 150meters.
The slant range in conjunction with the sound speed of the water (nominally 1500m/s)
enables the sonar to calculate the time window over which it needs to sample the
acoustic backscatter. Once the sonar has received the backscatter versus time data for
each pulse (or ping) it applies corrections for spherical spreading, absorption and
suspended matter and the data is ready to be displayed.
Port and starboard backscatter data for each frequency generated by a sonar are
displayed to the operator in what is known as a waterfall display. Such displays
consist of two regions of equal width placed side by side. The left hand region
displays the port backscatter versus slant range (or equivalently backscatter versus
time) data horizontally across the screen for each ping, originating from the centre of
the display, and the right hand side displays the corresponding starboard backscatter
versus time data. Each ping’s echoes are placed beneath the former creating a picture
which shows the regional acoustic backscatter characteristics across the width of the
swath. Figure 3 shows as example of a water fall display.
Acoustic backscatter data is displayed in waterfall displays with dark regions
representing high acoustic returns, and whiter regions representing low acoustic
returns, although sometimes “inverse video” mode is invoked in which this scheme is
reversed. Acquisition packages permit operators to alternate between these two
modes. However, as the mode invoked determines how the waterfall display is
4
DSTO-GD-0372
interpreted, then an operator needs to be aware of the convention being used at any
time.
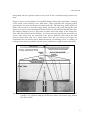
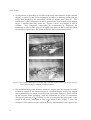
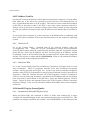
Figure 3 shows a real example of a waterfall display during data acquisition. Starting
at the centre of the display is two dark lines. These represent the outgoing pulses
generated by the sonar on the port and starboard side. The following white regions on
either side are the low acoustic energy being received by the sonar during the time
taken for sound to travel through the water column to the seafloor beneath the sonar.
The display changes colour to greyscale on either side at the edges of the white area.
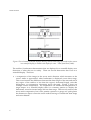
This is the first return from the seafloor. If a sonar is located close to the sea surface, as
occurs with sonars that are mounted to the survey platform, then before the first
bottom return there may be a weak return from the sea surface (see Figure 4).
Sometimes the sea surface can be detected because of breaking waves or raining, as
both processes inject air bubbles into the water which have a high acoustic reflectivity.
Figure 3 A diagram showing a waterfall display and the two-dimensional cross-sectional
geometry. Top schematic adapted from Kleinrock (1991). The bottom image adapted
from Klein (1985).
5
DSTO-GD-0372
Figure 4 Two schematic waterfall displays showing how the slant range of a weak surface return
in a waterfall display is related to the depth of a sonar. Taken from Klein (1985).
The seafloor’s backscatter characteristics that are displayed in a waterfall display are a
distortion of what they are in reality. There are several distortions that occur in a
waterfall display. These are:
• a compression of the image in the across track direction which increases as the
sonar’s nadir is approached, when backscatter is displayed versus slant range.
This occurs because the differences between the slant ranges of the start and end of
any region of the seafloor is less than the region’s horizontal length, with this
discrepancy, or compression, decreasing across the track. Figure 5 shows an
example of this compression. As compression can inhibit the interpretation of
target shapes in a waterfall display then it is common practice to display the
backscatter versus horizontal range and not slant range. This not only removes the
across track compression, but it also permits operators to gauge at a quick glance
the distance an object is from the sonar without having to consider the slant range
and sonar altitude.
6
DSTO-GD-0372
Figure 5 A schematic showing the across track compression that occurs in waterfall displays
when backscatter levels are displayed versus slant range and how this compression
can be circumvented by displaying backscatter levels versus ground range and not
slant range. Adapted from Klein (1985).
Often the seafloor is a fairly flat surface and by making this assumption, the
horizontal distance each backscatter pixel (or picture element) is from the nadir of
the track can be calculated using the slant range of the pixel and the height of the
sonar above the seafloor. If it is known that the seafloor is not flat in the across
track direction, and bathymetry data is available, then more complicated methods
exist which permit the horizontal distance of each pixel to be calculated (see 9, 39,
41, 61 and 62 of Kleinrock).
7
DSTO-GD-0372
•
A compression or stretching of an object in the along-track direction of the waterfall
display is caused by the sonar ensonifying an object at differing speeds and the
sonar then displaying the backscatter results at regular time intervals. The
ramification of this compression is that it generates the artefact that targets appear
larger or smaller than they really are. Figure 6 shows an example of such a
scenario. This along-track compression is circumvented by displaying the
backscatter results for each ping not at regular time intervals but at intervals which
are directly proportional to the speed or distance the sonar has transversed.
Figure 6 Two waterfall displays of a sunken ship collected at three knots (top image) and six
knots (bottom image). Adapted from Klein (1985).
•
8
The minimum along-track distance which two targets must be separated in order
for them to appear as two distinct targets in a waterfall display and not be merged
and represented as one target, increases in the across track direction. This is caused
by the acoustic beam spreading, with the beamwidth for a line of transducers
directly proportional to ( λ ), where λ is the wavelength of the pulse and L is the
L
length of the array, and equal to 50.6 ( λ ) (Klein, 1985). Figure 7 shows an
L
example of this artefact for two targets which are represented as one target on the
DSTO-GD-0372
outer edges of a swath whilst being shown as two distinct targets closer to the
sonar’s nadir.
Figure 7 A schematic diagram showing how beam spreading as the across track distance
increases can result in two targets appearing as one target. Adapted from Klein
(1985).
Sidescan sonars can be towed behind a platform which places the sonar closer to the
seafloor and produces longer acoustic shadows. This deployment technique has the
advantages that:
• It permits the highest possible detail of the bottom. Such detail may be needed
for locating objects whose dimensions approach the resolving capability of a
sonar.
• It maximises the contrast between surfaces of differing orientation,
• acoustic shadows are maximised.
• the possibility of any surface reflections is minimised.
• the motion of the towfish is partially decoupled from the motions of the tow
vessel.
• the sonar can be placed beneath any diurnal thermoclines that would refract
acoustic energy upwards, towards the surface and away from the intended
target, the bottom. The acoustic energy propagating in a thermocline will also
undergo more absorption due to the associated higher temperatures compared
to an acoustic beam that was located beneath a thermocline.
9
DSTO-GD-0372
The disadvantages with towing a sonar is:
•
•
•
special equipment is needed to deploy and recover the sonar, with such
steps made difficult and treacherous in rough weather.
that the operator cannot see what is approaching and the pilot may need to
make quick changes to avert losing the sonar on a rocky outcrop or wreck.
If the pilot does know that the depth of the sonar needs adjusting then the
depth can be decreased by increasing the speed of the towing vessel, if a
depressor wing is not being used, however if a wing is attached then the
depth of the sonar can be decreased by decreasing speed.
that the exact location of the sonar in the horizontal plane is difficult to
determine. This is attributable to inaccurately measuring the length of cable
used, its shape under tow and also because of difficulties in modelling how
the sonar “follows” the towing platform.
Sidescan sonars can also be mounted to their support platforms (as a hull-mounted or
bow-mounted (see Figure 8). Such a configuration has the major advantage of accurate
position information for any objects, as the exact location of the sonar is known. Bow
or hull-mounted sonars have the disadvantage that the backscatter detail that can be
resolved in the across track direction of a waterfall display is lower that is resolvable
when a sonar is towed and because of this they are normally only used in shallow
areas.
Figure 8 An example of a sidescan sonar mounted to the bow of the survey platform. The sonar
in this picture was the Klein 5500.
Object detection in a waterfall display proceeds by identifying areas of contrasting
backscatter. Such areas maybe localised and appear as regions of high acoustic
backscatter backed by low acoustic backscatter. This would be typical of rocks proud
of a seafloor composed of soft sediment. Or the areas of contrasting backscatter maybe
over much larger areas, indicating sediments of different composition. After an object
10
DSTO-GD-0372
has been detected in a waterfall display, its shape can give an indication as to the
origin of the object. Those objects that often have easily identifiable shapes include
wrecks, metal drums, shipping containers, cables or pipelines, car bodies, rocks and
reefs. The identification process of unidentifiable objects can be improved by
ensonifying any features from different bearings. In this way the two-dimensional
shape of an object is more accurately determined.
The characteristics of an object that determine the degree to which it reflects acoustic
energy ensonifying it back to the sonars transducers, are the orientation of the object’s
surface with respect to the orientation of the wavefront and the acoustic impedance of
the materials used in construction the object. The acoustic impedance is the product of
the materials density, ρ m , and the speed of sound, cm, in the material. The higher the
impedance the more acoustic energy will be reflected back to the sonar. A more
helpful quantity, which indicates the amount of energy reflected back to the sonar is
the reflection coefficient (R), expressed as a percentage. This is defined as the ratio of
the reflected acoustic intensity to the acoustic incident intensity and may be calculated
using the approximate relationship:
2
⎡ ρ c − ρ s cs ⎤
I
R= R =⎢ m m
⎥ × 100% (1)
I i ⎣ ρ m cm + ρ s cs ⎦
Where:
1. IR is the acoustic intensity of the reflected pulse.
2. Ii is the acoustic intensity of the incident pulse.
3. ρ s is the density of sea water .
4. Cs is the speed of sound in sea water.
5. ρ s Cs is the acoustic impedance of sea water.
Some materials for which the reflectivity coefficient is often needed are cited below
together with their acoustic impedance.
Table 1 A list of materials often located by sidescan sonars and their associated acoustic
impedances and reflection coefficients.
Material
Air
Fresh Water
Seawater
Wood (Pine)
Wood (Oak)
Concrete
Steel
Acoustic Impedance (kg/m2s) (x106)
0.000428
1.48
1.54
1.57
2.90
8.0
47.0
Reflection Coefficient (%)
99.9
0.04
0
0.0009
9.4
46
88
11
DSTO-GD-0372
It can be seen from Table 1 that air has a relatively large impedance, reflecting virtually
all the acoustic energy impinging on the seawater-air interface. This is the reason why
surface waves breaking and injecting air bubbles into the water can cause a surface
return to be visible in a waterfall display. It is also the reason why animals containing
air pockets (for example humans, dolphins) can be detected by sidescan sonars. It can
also be seen from Table 1 that some materials have unusually low impedance, such as
wood. This example raises the important point that sidescan surveyors trying to locate
specific objects, for example wrecks which have been constructed out of wood, which
have low impedance and which may be difficult to detect, need to consider the
impedance of the material to be located and choose the ranges accordingly.
The areas identified as having differing backscatter than the surroundings may have
an associated acoustic shadow on their leeward side, indicating they are proud of the
seafloor. Acoustic shadows occur because the orientation of the outgoing acoustic
pulse wave front compared to a target does not permit the pulse to ensonify a section
of the seafloor leeward of a target (see Figure 9). Although it is often stated that the
acoustic shadow represents a time window in which no acoustic energy is being
scattered back to the sonar, they really represent a time window in which the sonar is
detecting the small acoustic energy that has been scattered off particulate matter within
the water.
Figure 9 A schematic diagram showing how an acoustic shadow occurs behind a target that is
proud of the seafloor. Taken from Kleinrock (1991)
12
DSTO-GD-0372
Although acoustic shadows are often observed in a waterfall display on the leeward
side of anomalously high acoustic returns with objects proud of an otherwise relatively
flat seafloor, they can exist with no preceding contrast in the backscatter. This can
occur for troughs associated with buried pipelines or telecommunication cables as well
as sand waves. Figure 10 shows an example of these two features.
Figure 10 A schematic diagram showing how both depressions as well as prowd targets can
generate shadows in a waterfall display. Taken from Klein (1985).
Determining the location of objects observed in a waterfall display is a two step
process. The first involves determining the location of the sonar relative to the GPS
(Global Positioning System) antenna with the second step involving using the bearing
of the sonar together with the horizontal distance the object is from the sonar (termed
layback).
The location of the sonar relative to the GPS antenna can be determined using a
measuring tape for bow or hull mounted sonars and such configurations have the
advantage that they do not change during a survey. For sonars that are being towed
behind a survey vessel, their location is calculated using the horizontal distance the
GPS antenna is from the fairlead together with layback. The layback is calculated
using the cable-out values in conjunction with the depth of the sonar below the
fairlead, which has the two components; the height of the fairlead above the waterline
and the depth of the sonar. Sidescan sonars have built in pressure transducers so their
depth beneath the waterline can be determined.
The horizontal distance (Rh) an object is from the sonar is calculated using the altitude
of the towfish above the seafloor (Hf), making the assumption the seafloor is flat from
beneath the sonar (the nadir) to the object, and using the slant range to the object (Rs)
(see Figure 11). Another important characteristic of objects is their height (Ht), or
altitude for floating objects, above the seafloor. This can be determined by invoking
13
DSTO-GD-0372
similar triangle relationships because the triangle generated by the height of the object,
the length of the object’s shadow and the slant range from the object’s crest to shadow
end (Ls), is similar to that generated using the altitude of the sonar, the slant range to
the object’s shadow (Rs) and the horizontal length from the nadir to the shadow, as
their three angles are equal. By virtue of the fact that for two similar triangles the ratio
of any two corresponding sides is equal, it can be stated that the ratio of the height or
altitude of the object to the altitude of the sonar is equal to the ratio of the slant range
from the sonar to the end of the shadow to the length of the shadow from the object.
By virtue of similar triangle characteristics it follows that
Ht
LS
=
Hf
R S + LS
(2)
By rearranging equation#2 for the unknown object height (Ht) it happens that
Ht =
H f LS
R S + LS
(3)
This argument is outlined in Figure 12.
Figure 11 A schematic diagram showing how the horizontal distance of a target from the nadir
of the sonar is calculated. Taken from Klein (1985)
14
DSTO-GD-0372
Figure 12 A schematic diagram of a sidescan’s across track geometry showing how a target’s
height above the seafloor is calculated. Taken from Klein (1985).
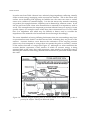
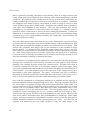
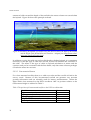
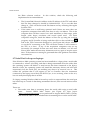
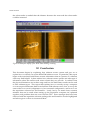
Sidescan sonars can be used quite successfully to infer sediment boundaries. Figure 13
shows sidescan sonar data gathered at Middle Head in Sydney Harbour. The red line
indicates the shoreline and a rocky outcrop can be seen protruding out from Middle
Head. Also clearly evident are two strong sediment boundaries, one between the
rocky outcrop and soft sediment (probably sand) to the northeast of it with a second
boundary to the north between two types of sediment, one harder, with a different
composition than the other and which runs out from the shoreline in the bottom left of
the figure.
Figure 13 An example of sidescan sonar data collected at Middle Head, Sydney Harbour
showing differing sediment types.
15
DSTO-GD-0372
Due to spherical spreading, absorption and scattering, there is an upper limit on the
swath width that can be employed by a sidescan sonar whilst maintaining a desired
resolution. If a sidescan sonar is being used to survey an area where more than one
swath is needed then an operator will need to construct a set of tracklines. Tracklines
are imaginary lines which a survey vessel needs to follow in order to survey an area
whose width is larger than a swath width. Tracklines are normally drawn parallel to
each other and orientated in one direction. The only time tracklines may not be
orientated in one direction is when they follow the shape of a coastline (such as
estuaries), when a sonar needs to survey an area of changing bathymetry, or when the
dimensions of a target needs to be checked and instead of one set of tracklines being
constructed, two sets of perpendicular tracklines are constructed. Such tracklines are
sometimes called cross-lines.
As some objects have aspect ratios that are non-unity, meaning that one axis is longer
or shorter than the other, then it can occur that the bearing of the ensonification is such
that the sonar ensonifies the smallest possible cross-sectional area of a target. This
induces the possibility that simply due to the orientation of the trackline a target
maybe missed. To circumvent this possibility some conservative surveys, not only
have a 200% coverage but have a second set of tracklines that are orthogonal to the first
set. Then if any targets do have non-unity aspect ratios and the first set of tracklines
causes the sonar to ensonify the smallest cross-sectional area then the second set will
have the maximum possibility of detecting the target.
The construction of tracklines can be achieved by some sidescan sonar data acquisition
packages (for example Isis and SonarPro) and there are some purpose built software
packages (for example Hypack) which can construct them. In either case what is
commonly displayed to the pilot is an electronic nautical chart of the region being
surveyed, superimposed with the chosen survey lines, and either the vessel location or
sonar location. If a sonar location is given then the area of the seafloor the sonar is
ensonifying is also often displayed. The survey vessel then uses GPS or DGPS to
determine its location and the pilot continually alters the course of the vessel so as to
keep as close to the trackline as possible whilst maintaining a reasonable speed.
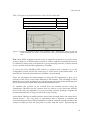
One of the key parameters in constructing tracklines is to establish the line spacing, or
horizontal distance between neighbouring survey lines. This is governed by the aim of
the survey and for complete coverage must be less than half of the swath width. For
surveys which are trying to locate large targets (relative to the pixel size) on a smooth
seafloor and in non-turbid waters, Fish and Carr (1990) recommend using a line
spacing which is 75% of the total swath width. This line spacing equates to any two
contiguous swaths overlapping by 25% or a seafloor which has a coverage of 150%;
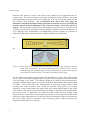
100% for the lane proper and 25% from each neighbouring lane. Figure 14a shows the
area of the seafloor ensonified when this recommendation is employed. When small
targets are being searched for consideration should be made to the fact that there is
limited resolution beneath a towfish (encompassing the nadir). For this case an
operator will circumvent the low nadir resolution using the outer ranges of an
16
DSTO-GD-0372
adjoining swath line. This approach equates to a line spacing which is 50% of the
swath width or a coverage of 200% for all lanes which are encompassed by the two
outside lanes and which is 150% for the two outside lanes. Figure 14b illustrates the
concept of 200% coverage.
(a)
(b)
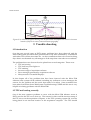
Figure 14 A cross-sectional illustration showing the concept of a line spacing which is (a) 25%
of the swath width and which equates to a 150% coverage, and (b) a line spacing
which is 50% of the swath width and which equates to a coverage of 200%. The
black dots represent the sonar, the yellow regions the area of the water column which
is ensonified when the sonar follows each trackline and the bright yellow areas
represent the overlap of each swath with their neighbours.
If the aim of a survey was to simply locate one or more objects along one or more
tracklines, then if high quality sidescan sonar data and navigation data have been
collected, and the object(s) has been found then the survey is complete. On the other
hand if the aim of the survey was to locate or identify features which spanned more
than the width of one swath, then the sonar data needs further manipulation.
In the early 1960’s and 1970’s only relatively low frequency sidescan sonars were in
usage and they permitted large swath widths of several kilometres to be used but this
was at the cost of low resolutions (several meters). Such sidescan sonars are still in
operation today. In the late 1980’s much higher frequency sonars were being
manufactured and they were achieving high resolutions of sub-decimeter but this was
at the cost of much smaller swath widths (approximately 300meters). Mosaics are a
way of retaining the high resolutions whilst displaying the backscatter results over
areas that were of comparable size to the swath widths of the lower frequency and
lower resolution sonars. A mosaic is a picture showing the acoustic backscatter from
one or more swaths that have been geo-referenced onto a projection of a region of the
globe.
17
DSTO-GD-0372
Mosaics are generated for a wide variety of reasons. These include: (1) showing
sediment boundary locations, (2) showing debris fields from downed aircraft, (3)
showing the location and coverage of geological features such as boulders and reefs (4)
showing ship wrecks which span more than the width of one swath, (5) surveying
bottom habitats, (6) archaeological surveys, (7) pipeline inspecting. To increase the
readability of a mosaic it maybe placed on top of an electronic nautical chart of the area
or the mosaic may simply have an outline of the coastline. Their readability and
interpretation can be also be enhanced by having contours of bathymetry or magnetic
anomaly draped over them (Fish and Carr, 2002).
The resolution of the final mosaic is determined by the operator and can be as high as
the original sonar data. There is however a trade-off between the resolution of the
mosaic and the size of the graphic files generated; the higher the resolution, the bigger
the graphics file and the more computer room that is needed, whilst for lower
resolution mosaics (which have bigger grid cell sizes) the smallest targets that can be
detected will be bigger than the high resolution case but the advantage is that the files
generated will be smaller.
Figure 15 An example of a mosaic of several sidescan sonar swath data.
Once a mosaic has been rendered it is possible to classify the backscatter levels in terms
of differing sediment types. There are two main ways this can be achieved. There are
textural methods (or pattern recognition) which needs only sidescan sonar data to be
implemented. This approach first requires the texture where the sediment is known
(so-called “training regions”) and then incrementally scans the whole sidescan sonar
mosaic trying to match the textures observed against those from the training regions
(Bell, Chantler and Wittig, 1999). Textural approaches have the flaw that they do not
use the process that generated the sonar image. There is also the problem that sidescan
sonar data, and hence the texture, can be dependent upon the ensonifying bearing
angle. For example, sand waves are unlikely to be detected if the sonar track is
orthogonal to their orientation (that being parallel to the wave crests) whereas they will
18
DSTO-GD-0372
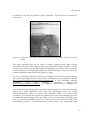
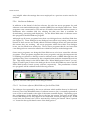
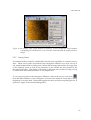
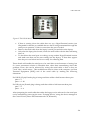
be detected if the track is parallel to their orientation. Figure 16 shows an image of
sand waves.
Figure 16 A sidescan sonar image showing the presence of sand waves. Altered from Klein
(1985).
The other approach that can be used to classify sidescan sonar data, exploits
information on the grazing angle to derive the backscatter angular response. As the
grazing angle needs to be calculated then this technique can only be used on sidescan
sonar data that has accompanying bathymetry data (which may or may not have been
collected when the sidescan data was) (Bell et al, 1999).
The act of classifying sidescan sonar data is normally performed in post-processing.
The software packages that can perform this classification are the SeaClass module
(http://www.tritonelics.com/tritonPDF/SeaClass.pdf) of the TritonElics package
DelphMap,
and
the
package
Classiphi
(http://www.
http://www.qinetiq.com/classiphi/), by QinetiQ.
Both software packages use
textural based approaches.
Once sidescan sonar data has been classified and the locations of rocks and man-made
objects have been identified, then tasks like identifying routes for laying
telecommunications cables and pipes, and merchant traffic, can proceed with
confidence. The factors which need to be taken into account when identifying routes
for cables and pipes laying include: (1) where is there rock, (2) where do steep slopes
exist, (3) and by considering these two factors where can the burial safely and
economically proceed. An important factor which needs to be considered when
19
DSTO-GD-0372
choosing safe shipping lanes, during times of conflict, is where is the bottom made up
of rock. This characteristic is important because this type of sediment has high
backscatter characteristics, which makes locating mines difficult. Hence, a shipping
lane should be placed in an area where the sediment has low backscatter
characteristics.
2 Physical Setup
This chapter outlines the individual components that are normally used at DSTO to
conduct a sidescan sonar survey and describes how to connect them ready for
operation. In particular, section 2.1 outlines the characteristics of the Klein 5500
sidescan sonar. Section2.2 is a basic summary outlining all the hardware that is
required to acquire data and how to set it up, but with no navigation or cable-out
inputs to the software. In this case, the system will function and display data, but for
most purposes, navigation and cable-out are required for geo-referencing the imagery.
Section 2.3 describes the hardware required in the acquisition computer and outlines
the components of the ruggedised Isis® PC. Section 2.4 describes the hardware needed
for obtaining accurate position information, and section 2.5 discusses cable-out
measuring.
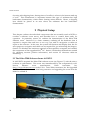
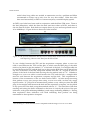
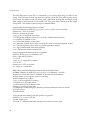
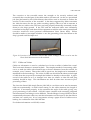
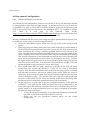
2.1 The Klein 5500 Sidescan Sonar At DSTO
In 1995 DSTO acquired the Klein 5500 sidescan sonar (see Figure 17) with the aim to
evaluate its performance. This sonar was manufactured by the comparatively wellknown
sidescan
sonar
manufacturer,
Klein
Associates,
Inc.
(http://www.kleinsonar.com) in the U.S.A. Twice Klein Associates, Inc. has upgraded
the Klein 5500 with the last in 1991 being extensive and upgrading the sonar from the
Mark I to a Mark II.
Figure 17 The Klein 5500 sidescan sonar shown in its “towed” configuration.
20
DSTO-GD-0372
2.1.1
The Klein 5500
The Klein 5500 is coined a multi-beam sidescan sonar because, depending upon the
speed of the towfish, up to five acoustic beams on the port and starboard side of the
towfish will be generated. These beams, instead of forming a beam which is less
focussed across the track (see Figure 7), as is normally the case, generate a beam which
is more focussed as slant range increases, and it is this feature which permits the Klein
5500 to achieve the high resolution of 20cm up to survey speeds of 10 knots. The
towfish has a depth rating of 200m and has sensors outputting hydrostatic pressure,
water temperature, pitch, roll, yaw and altitude above the seafloor.
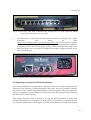
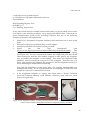
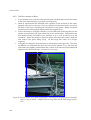
The Klein 5500 has three fins, which stabilise the motion of the towfish when it is being
towed. An operator can easily remove these fins and to reduce the possibility of
snagging, and losing the towfish on unforeseen objects. The back yellow nose cone,
where the fins are housed, is designed to separate and break-off from the towfish when
under extreme load. Figure 18 shows this feature in detail.
The fins should be removed when the sonar is being used in its bow-mounted
configuration. The reasons are that it would place a lot of unnecessary stress on the
tail fins and they are not needed as the sonars yaw and pitch characteristics are
already stabilised by the sonar being directly attached to a large platform.
Figure 18 The Klein 5500 sidescan sonar showing where the rear yellow nose cone, housing the
tail fins, will separate (indicated by a red line) from the stainless steel body when the
tail fins become snagged on any bottom objects.
The Klein 5500 must be used in conjunction with a sophisticated computer known as
the Transceiver and Processing Unit (TPU) (see Figure 19). The TPU has several major
functions. These are (1) multiplexing the commands, and sending them, to the sonar,
(2) controlling the number of transducers to be used in beam forming, (3)
demultiplexing the data coming from the towfish (5) parsing the sonar data through a
digital signal processor and (6) data format generation.
21
DSTO-GD-0372
The TPU does not have a hard disk and needs to download its operating system from
another computer. This computer is normally the acquisition computer with the
operating system being a single file called vxworks. The location of this file and the
correct set up of the host computer to enable the TPU to download it are outlined in
section 3.3. Although it has not been normal practice to use the latest version of
vxworks, this is possible, with the latest version encompassed within the latest
compressed version of the acquisition software SonarPro, which is downloadable from
the web site (http://www.kleinsonar.com/tech/sonarpro#.#html). In the past Klein
has provided upgrades to SonarPro and vxworks free of charge to the DSTO sidescan
sonar group. Old versions of vxworks should be kept until the operator is satisfied
that any new versions boot and execute the TPU correctly.
(a)
(b)
Figure 19 The (a) front view and (b) back view of the Klein 5500 TPU.
As the TPU controls the number of beams to be activated in the Klein 5500, then the
TPU needs to know the speed of the towfish (or the platform). To achieve this GPS
navigation data needs to be routed into the TPU using the serial port on the back of the
unit marked “navigation”. The form the GPS data takes is outlined in section 2.4.3. If
the TPU does not receive any GPS data then the TPU will activate all five beams on the
port and starboard side of the towfish and oversample the seafloor’s backscatter
characteristics. This will cause the data files to be over-saturated and larger than
necessary.
22
DSTO-GD-0372
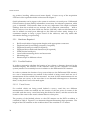
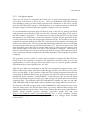
2.2 Basic hardware setup
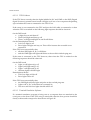
Physical Components of the basic Klein 5500/Isis Sidescan System
Hardware
Function
1. Klein 5500 towfish
Generate and receive acoustic signal at 455kHz
2. Fins for towfish
Stabilise towfish motion
3. K-wing depressor for Stabilise motion, increase ratio of towfish depth/cable-out
towfish
4. Transceiver
Controls towfish, send information from towfish to Isis computer
Processing Unit (TPU)
5. Armoured cable
Transmit signals between towfish and TPU
6. Isis computer
Record sonar and navigation data, controls TPU and controls
data display.
7. Isis dongle
Allow access to the Isis software.
8. LAN/Optical cables
Transfer data between TPU and Isis computer. (See below for
and hubs
standard configuration, and Appendix 1 for other options)
9. Slip ring for winch
Allow winch to turn while data is being transferred.
10. Short black cable
Connect slip ring to deck cable
11. Deck cable (blue –
Connect short deck cable to TPU
20m)
12. Power cables, for 3, 5,
Supply 240V power to equipment as required
6, 7. Power boards and
extension leads
A schematic of the basic physical setup is shown below. For optimal positioning of the
towfish, navigation inputs and cable-out information are required. The hardware for
navigation inputs is discussed in 2.3, and correct software settings are discussed in
Sections 4 and 5.
Figure 21 A flow diagram showing the hardware setup for the Klein 5500 sidescan sonar.
23
DSTO-GD-0372
2.2.1
PC Hardware
This section outlines what computer hardware is required in the acquisition PC to
obtain data from the Klein 5500 sidescan sonar, and if necessary, how such hardware
needs to be set up and tested. This section is broken up into two sections. The first
outlines hardware that is required by any computer so that it can acquire data, with the
second section outlining the hardware that is present in the ruggedised Isis PC, and
how some of this specialised hardware is installed and tested.
2.2.1.1 General PC
To accept data from the Klein 5500 sonar a 100Mbit Ethernet network card is required
in the acquisition PC. If the software acquisition program Isis is being used then the
second hardware that is required is the Isis dongle. Isis is produced by Triton Elics
International (TEI).
The Isis Rainbow dongle (serial #PR-1/97100) is needed so the Isis data acquisition
software can be executed and needs to be attached to the printer port of the acquiring
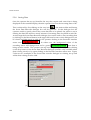
PC. Under Windows NT and Windows 2000 the Isis dongle will not be recognised and
the correct drivers must be installed before it can be used. This is achieved using the
program RainbowSSD5.39.2.exe, which can be located at (X:\Drivers and Third Party
Applications\Sentinel Driver\, where X is the drive name of the CD) on the Isis
Installation CD. If the dongle is not in place, the connection is faulty or the appropriate
drivers have not been installed, then the Isis software will not be able to detect the
dongle and as a result Isis will run in demonstration mode: Data acquisition during
this time will not be possible although data file playback is possible.
TEI, in addition to making Isis, makes a ruggedised Isis PC that has been designed to
withstand the large knocks and bump that are common with the marine environment.
If the acquiring PC is the ruggedised Isis PC, then the Isis dongle can, in addition to
being attached externally to the printer port, be attached internally. This can be used to
protect the dongle from being accidentally broken off during transit and normal
operations, and can also be used to hinder the dongle being stolen. The ruggedised Isis
PC will be outlined in more detail in the next section.
Note, if the dongle is lost or stolen, TEI could request DSTO to purchase another
software licence and not to simply post a replacement free of charge.
Other than the Isis dongle and a 100Mbit Ethernet network card it is beneficial if the
acquisition computer has:
•
a video graphics card that supports a second virtual monitor or a second
monitor.
•
two serial ports.
•
256 megabytes or more of RAM.
24
DSTO-GD-0372
•
•
A second hard disk for data collection. It is a recommendation from Triton Elics
International that the Isis acquisition program be executed from a different hard
disk than that where data is being stored.
removable media, such as removable hard disk bay, or a magnetic optical disk
drive.
•
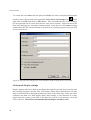
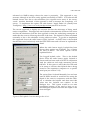
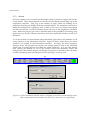
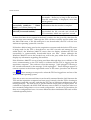
2.2.1.2 Isis PC
The Isis PC is simply a ruggedised PC made by Triton Elics International
(http://www.tritonelics.com/) and runs the Windows 2000 operating system. Figure
21 shows this PC. This PC was purchased in 1998 and in the past has been the main PC
used in DSTO to acquire sidescan data in conjunction with the software Isis®
(http://www.tritonelics.com/isissonar.html),
although
SonarPro
(http://www.kleinsonar.com/sonarpro/index.html) has been used to a small degree.
Any PC can be used to acquire sonar data provided the PC’s processor is fast enough
and there is an Ethernet network card.
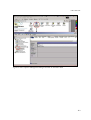
Figure 21 an illustration of the ruggedised ISIS PC which has been the main PC used by DSTO
to acquire sidescan data.
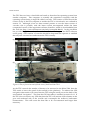
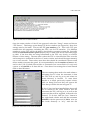
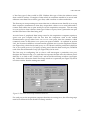
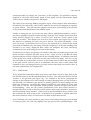
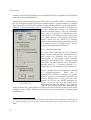
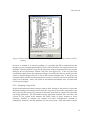
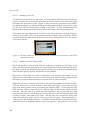
The Isis PC has a number of peculiarities which the general PC would not have and
which may not be evident to a new user. Most of these are evident by looking at the
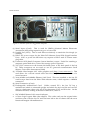
back of the unit (see Figure 22). From Figure 22, scanning from the right to left, the
operator should notice the following characteristics:
25
DSTO-GD-0372
Figure 22 The back of the Isis ruggedised computer.
(1) Serial Input (Com2). This is used for NMEA (National Marine Electronics
Association) 0183 string inputs from gyro or Leica GPS.
(2) Parallel Port (LPT1). This is used almost exclusively to attach the Isis dongle (or
sentinel).
(3) DB-15 DC power output for the Klein 595 Sidescan Sonar SIU4 (Signal Interface
Unit). Note: to power the SIU4 this way requires a DB 15 male to 3.5mm stereo
plug cable.
(4) Centronix SCSI (Small Computer System Interface) output. Useful for attaching a
magnetic optical disk drive, when extra storage space is required.
(5) Two PS/2 connectors in the bottom left hand corner of the back panel of the Isis
PC. These connectors are not used on our PC (personal communication Geoff
Shipton, Triton Elics International, 2002)
(6) “Number Nine Imagine 128” video graphics card (http://www.nine.com/). This
card allows for a second virtual screen but does not permit the attachment of a
second monitor.
(7) 3com 10Mbit and 100Mbit Ethernet LAN Card. This was installed so the Isis PC
could accept data from the Klein 5500 sidescan sonar, which requires a 100Mbit
connection.
(8) Serial Connection (Com1).
(9) Exchangeable Motherboard Card. Unlike normal PC’s, the Isis PC has a
motherboard which is orientated upright and which fits into one ISA and one PCI
slots on a backpane whose only role is for placement of PCI and ISA slots. On the
motherboard card, looking at the back of the Isis PC, there is:
•
•
26
NIC 10Mbit Ethernet LAN network adapter.
a Cirrus Logic Laguna 4564 video adapter. This video card was the original video
card that came with the Isis PC and has been left in the off chance that the more
functional Imagine 128 malfunctions.
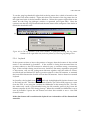
DSTO-GD-0372
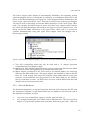
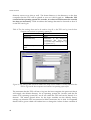
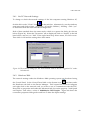
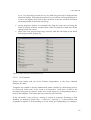
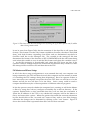
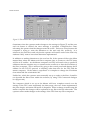
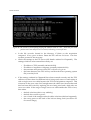
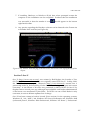
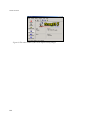
The Cirrus Laguna video adapter is automatically disabled by the operating system
when the Imagine 128 is in use and this is evident by an exclamation mark next to this
device in the Device Manager (see Figure 23). If the Imagine 128 does malfunction, the
Cirrus Logic video card can be used. This can be achieved by removing the Imagine
128 card as well as the flange around the DB12 connection of the Cirrus Logic Video
card. The operator should be aware however, that the Cirrus Laguna video card has
less video ram than the Imagine 128 and does not support a second virtual screen. The
flange around the DB15 connection of the spare Cirrus video card is to prevent an
operator unintentionally using this spare VGA adapter when the Imagine 128 is
functioning correctly.
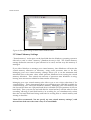
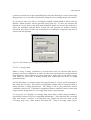
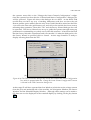
Figure 23 The device manager display for the Isis PC under the windows2000 operating system.
•
Two PS/2 connections which can only be used with a “Y” adaptor (personal
communication Geoff Shipton, 2002)
(10) 40pin PC31 DSP (Digital Signal Processor) card for retrieving data from the Klein
595 sidescan sonar. See Appendix A for details about this card.
(11) 40pin adaptor (connected to the PC31 card by an internal ribbon) for retrieving
data from the Klein 2000 sonar. This input adaptor was installed in 1999 so that the
Isis® PC could acquire data from the analogue, Klein 2000 sidescan sonar (the
successor of the Klein595 and the precursor of the Klein 5500) for the Shallow
Survey Conference in 1999. As DSTO does not have a Klein 2000 sonar then this
adaptor has not been used since 1999.
2.2.2
Network Hardware
The hardware required to set up the Local Area Network (LAN) between the TPU and
the acquisition computer, for the Klein 5500 sonar, in addition to the network card in
the acquisition computer, is either:
•
•
one, cross-over, twisted pair, category 5 (Cat5), network cable, or
two, straight, twisted pair, Cat5 cables with an Ethernet hub. The use of a hub is
simply to stop the data packets and retransmit them along the cable. Hubs are
27
DSTO-GD-0372
useful when long cables are needed, as attenuation can be a problem and Klein
recommends to always use a hub, even for very short cables. Hubs have also
been used successfully at DSTO to circumvent jittery waterfall display speeds.
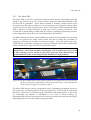
At DSTO two hubs have been used in conjunction with the Klein 5500 sonar. There is
the Intel InBusiness, which has been the hub used most often at DSTO, and there is
also the Dual E-Switch. Both hubs can output data to 8 ports and accept baud rates of
10 or 100Mbits/s. Figure 24 shows these two hubs in detail.
(a)
(b)
Figure 24 The (a) Intel InBusiness and (b) Dual E-Switch hubs used at DSTO in conjunction
with acquiring sidescan sonar data from the Klein 5500.
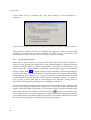
To use a hub(s) between the TPU and the acquisition computer, either a cross-over
cable is used between the TPU and the hub, in which case the RJ45 plug of the cable
needs to be placed in the slot marked “X”1 at the back of the hub, or a straight cable can
be used between the TPU and the hub, but in this case the RJ45 plug can be placed into
any slot of the back of the hub except that marked with the “X”. Figure 25 shows a
picture of the back of the Intel hub showing the slot marked with an “X”. Whether a
straight or a cross-over cable is used between the TPU and the hub, a straight cable
must be used between the acquisition computer and the hub. This requirement is
because of the construction of the two hubs used at DSTO. As hubs accept incoming
data packets on any port (except when using a cross-over cable, as then only accept
input from the “X” port) and re-transmit these packets on any other port, then the RJ45
plug of the straight cable between the hub and the acquisition computer, can be placed
in any spare slot of the hub, except that marked with an “X”. The baud rate of the data
entering and exiting the hub is indicated on the front of a hub by the colour of the port
indicators, with green indicating 100Mbits/s and orange indicating 10Mbits/s. During
data acquisition these indicators will flash indicating data packets are being
transmitted to the acquisition computer.
1
28
The marking “X” means that this slot is compatible with the usage of a cross-over cable.
DSTO-GD-0372
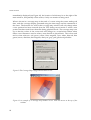
Figure 25 The back of the Intel In-Business hub, showing the “X” RJ45 input slot, which
accepts input data from a cross-over cable.
•
two fibre-optic to Cat5 network cable media converters (see Figure 26). These
converters
were
made
by
IMC
(http://www.imcnetworks.com/products/mcbasic.asp) and are used to replace
LAN cables with fibre optic cables in areas of high electromagnetic radiation
conditions, such as exists on sea going vessels. These converters can accept sonar
data from both cross over cables or straight LAN cables, using the switch to the
left of the RJ45 plug.
Figure 26 A fibre optic to Cat5 network cable media converter.
2.3 Acquiring Accurate Position Information
One of the fundamental roles played by a sidescan sonars is to be able to determine the
locations of any features or objects detected by the sonar. If it is not possible to specify
the location of any objects then the usefulness of the data gathered by these expensive
pieces of equipment is much reduced, and for some roles (for example object locating)
the data is not worth collecting.
This section discusses what is needed to set up the initial hardware to make sure
position information of a towfish is of a high quality. In particular, it will discuss how
to set up the hardware for serial inputs of position information to the sidescan system
29
DSTO-GD-0372
(eg position, heading, cable-out and water depth). Correct set up of the acquisition
software is also required and this is discussed in chapter 5.
Serial information can be input to the system in real time via serial ports. Differential
Global Position System (DGPS) information is necessary for sidescan operations, while
gyro, is desirable. Echosounder data can be very important if the depth or altitude
readings from the towfish are not accurate, but is otherwise unnecessary. With a
device such as Over the Stern Cable-out Device (OSCAD), cable-out information can
also be added via serial ports although as the cable-out values rarely change it is
sometimes simpler to keep a paper record of the cable-out, and only utilise this
information during post processing.
2.3.1
•
•
•
•
•
•
•
•
Hardware Required
Rs232 serial cables of appropriate lengths with appropriate connectors.
Digiboard card (in recording computer, if required)
Digiboard 8 serial port cable (if required)
Digiboard driver disks and instructions (if required)
PCMCIA dual serial port
Oscad cable measuring device and accessories
Measuring tape
Electrical tape in different colours
2.3.2 Towfish Position
In order to accurately calculate the location of any objects or features observed in the
waterfall display, the location of the sidescan sonar (in the Cartesian co-ordinate
system) needs to be accurately known in relation to the Differential GPS Antenna.
In order to estimate the location of any sonar relative to the Differential GPS antenna,
two sets of measurements are needed if the towfish is being towed and one set of
measurements if the towfish if bow-mounted. As most of these measurements do not
change from one survey to the next then it was deemed advantageous to document
them, so they don’t have to be made again.
2.3.2.1 Towed Sonars
For towfish which are being towed behind a survey vessel the two different
measurements which are needed are the location of the last point of contact of the
towcable with the survey vessel, this being the fairlead or shieve, and the second is the
location of the sonar in the water column relative to this point.
The position of the fairlead relative to the GPS antenna on the DSTO workboat is
outlined in Table 2. Figure 27 is a schematic diagram illustrating these quantities. The
height of the GPS antenna on the workboat above the waterline is 2.77 meters.
30
DSTO-GD-0372
Table 2 The position of the fairlead rollers on the DSTO workboat 440.
Variable
Towed
X (port or starboard)
0m
Y (along vessel)
-4.3
Z (height, negative=> below antenna)
-1.47
Figure 27 Schematic diagram of the DSTO workboat “440”, showing the major length and
width attributes (in metres) in comparison to the GPS antenna (marked by the red
dot).
Note: Most DGPS equipment can be set up to output the position of any point whose
position relative to a DGPS antenna is known. Hence, instead of entering the location
of a fairlead or shieve into an acquisition or post-processing software, it can be entered
as zero, and left with the GPS equipment to calculate.
To set up the Leica MX420/8 GPS receiver to perform such a function, go to the
configuration screen and use the cursor key to scroll down to the Datum item. It is
here that the “Position offset relative to WGS-84” can be entered.
There are advantages and disadvantages of using the GPS equipment to give you a
position on the survey vessel other than that of the antenna. The advantage is that it
limits the set up of the acquisition or post-processing software, but the disadvantage is
that it increases the amount meta data and documentation level.
To calculate the position of the towfish from the fairlead involves using the
Pythagorean Theorem, but the operator does not need to worry about this, because
most of the time the acquisition or post processing software package computes the
position automatically as long as it has been set up correctly.
As the Klein 5500 has an inbuilt pressure sensor then its depth below the water line is
already known. The only piece of information that is required to calculate the
horizontal distance the towfish is behind the workboat (which is termed layback) is the
amount of cable-out from the last point of contact with the vessel. By knowing the
31
DSTO-GD-0372
amount of cable-out and the depth of the towfish in the water column one can calculate
the layback. Figure 28 shows this principle in detail.
Figure 28 Estimating the layback of a towfish using the cable-out value, the depth of the towfish
and the height of the fairlead above the waterline. Adapted from (http://www.navalminesonar.com/optips/optips.html)
In addition to using the cable-out and towfish depth to deduce layback, it is sometimes
necessary to take the type of cable into account, as this will influence the curvature of
the cable. The affect of the type of cable on layback calculations is minor and the
operator need not be concerned with the fine details, only that some software packages
can take the effect into account.
2.3.2.2 Bow-mounted Sonars
For a bow-mounted towfish, there is no cable-out value and the towfish is fixed to the
survey vessel. Because of this, bowmounted towfish can generate very accurate
position information and are normally used for latency measurements. When the
Klein 5500 is bow-mounted on the DSTO workboat “440” its position relative to the
GPS antenna height is outlined in Table 3
Table 3 The position of a bowmounted towfish on the DSTO workboat 440.
Variable
X (port or starboard)
Y (along vessel)
Z (height) (negative => fish below antenna)
Height of GPS antenna above waterline
Static depth of towfish below waterline
32
Bow-mounted
0m
7.8m
-3.72
2.77
0.95
DSTO-GD-0372
2.3.3 Navigation Inputs
There are two forms of navigation data that need to used when acquiring sidescan
sonar data, if the data is to be of any use. These are Differential GPS data from the
Leica MX420/8, and gyro data (which represents the orientation of the survey vessel)
from the KVH Fluxgate Compass. Although there is a compass inside the towfish, the
fluxgate compass is used because the magnetic compass is not very accurate.
It is recommended from Klein that GPS data be sent to the TPU by placing the RS232
cable from the Leica MX420/8 GPS unit into the 9 pin male serial plug on the back of
the TPU labelled “navigation”. The main reason for this is that the TPU uses the speed
information in the GPS data to control the number of beams that are generated in the
towfish, and hence to keep the along-track resolution at 0.2m. If GPS data is sent to the
acquisition computer instead, then the TPU will activate all five beams, and sample the
seafloor at its fastest rate. This causes the data files being collected to be over-saturated
and much larger than they would otherwise need to be. The second reason why GPS
data should be sent to the TPU is that the data fusion of GPS and sonar pings occurs
more quickly than if GPS data was sent to the acquisition computer. The longer it
takes for the GPS data to be fused with the ping data the longer will be the latency and
it also introduces another computer into the data acquisition, that being the acquisition
computer.
The gyro data is sent to com1 or com2 of the acquisition computer and like GPS data
being sent to the acquisition computer, the acquisition software needs to be set up
appropriately to receive the gyro data. See sections (4.1, 4.6, 4.8) for specific software
requirements for correct operation (4.1, 4.6, 4.8).
GPS and gyro data are transmitted to the TPU and acquisition computer using 9 pin,
RS232 serial cables, with a Baud rate of 4800 bits per second, with 8 data bits, no parity
and 1 stop bit (8N1). If the operator wishes the TPU and the acquisition software can
accept data at different Baud rates; (1) the Baud rate the TPU accepts GPS data at is
determined by the variable “set BAUDRATE” in the startup.ini file, (2) with the Baud
rate the acquisition computer accepts gyro data at being set inside the software before
acquiring data. The different values the BAUDRATE variable can take are 300, 600,
1200, 2400, 4800, 9600, 19200, 38400, with the default value being 4800 bits per second.
The format of the GPS and gyro data is called NMEA0183. This format has been in use
since the 1980’s and is an ASCII format made up of many different data strings, each
representing different marine data. Some of the marine data that can be represented as
NMEA strings include position, heading, waypoints, depth and date (see
http://www.xs4all.nl/~erkooi/YL/nmea0183.html for a more complete listing).
NMEA strings begin with a dollar sign ($) and end in a carriage return linefeed
(<CR><LF>).
33
DSTO-GD-0372
The GPS data sent to the TPU is comprised of two strings and the gyro data of one
string. The GPS data is made up of the two strings, GGA and VTG, although the string
GGA could be replaced with the string GGL, with Klein stating that the single string
RMC could be used instead of GGA and VTG. The gyro data is made up of the single
string HDT. The format of these strings is outlined below.
GGA=Global Positioning System Fix Data
$GPGGA,hhmmss.ss,llll.ll,N,yyyyy.yy,W,x,xx,x.x,x.x,M,x.x,M,x.x,xxxx*hh
hhmmss.ss = UTC of position
llll.ll,N = latitude of position
yyyyy.yy,W = Longitude of position
x = GPS Quality indicator (0=no fix, 1=GPS fix, 2=Differential GPS fix)
xx = number of satellites in use
x.x = horizontal dilution of precision
x.x = Antenna altitude above mean sea level M = units of antenna altitude, meters
x.x = Geoidal separation M = units of geoidal separation, meters
x.x = Age of Differential GPS data (seconds)
xxxx = Differential reference station ID
GLL=Geographic Position latitude, Longitude
$GPGLL,lll.ll,a,yyyyy.yy,a,hhmmss.ss,A
llll.ll = Latitude of position
a = N or S
yyyyy.yy = Longitude of position
a = E or W
hhmmss.ss = UTC of position
A = status: A = valid data
RMC=Recommended Minimum Specific GPS/TRANSIT Data
$GPRMC,hhmmss.ss,A,llll.ll,N,yyyyy.yy,W,x.x,x.x,ddmmyy,x.x,W*hh
hhmmss.ss=Universal Time Co-ordinate of position fix (hourminsec)
A=Data Status (V=navigation receiver warning)
llll.ll,N=Latitude of position
yyyyy.yy,W=Longitude of position
x.x=speed over ground in knots
x.x=track made good in degrees true
ddmmyy=Universal Time date
x.x=Magnetic variation degrees (Easterly variation subtracts from true north)
W=East or West
*hh=Checksum
VTG=Actual track made good and speed over ground
$GPVTG,t,T,,,s.ss,N,s.ss,K,*hh
t=Track made good
T=Fixed “T” indicates that track made good is relative to true north
34
DSTO-GD-0372
s.ss,N=speed over ground in knots
ss.s,K=speed over ground in Kilometers per hour
*hh=checksum
HDT=Heading Degrees True
$GPHDT,x.x,T
x.x = Heading, degrees true
If any other serial data (for example echosounder data) is to be recorded, it also needs
to be input to the recording computer via an appropriate RS232 cable. If there are no
spare communication ports on the recording computer then one of the following
scenarios will need to be implemented:
•
•
•
•
Install a PCI (Peripheral Computer Interface) card which has one or more serial
ports,
Purchase a USB (Universal Serial Bus) to serial adapter.
Purchase a USB hub with a built in serial port built.
Install
the
ISA
“digi
classicboard”
card
(http://www.digi.com/solutions/mportserialcards/classicboard.shtml).
This
card provides eight 25-pin male ports, available through an “octopus” cabling
(see Figure 29a). As any computer will number the 8 digiboard ports after all the
other serial ports, then the port number assigned to each port by the computer
may not match the numbers on the cabling. This means the digiboard cable
labelled 1 will not usually be com port 1 on the computer. However once you
know what number the computer has assigned to the first digiboard serial port,
those remaining are numbered consecutively.
Note that the installation of this board into a PC running Windows2000 was
attempted but failed. It was hypothesised that its installation would have been
simpler if it was a PCI card instead of an ISA.
•
If the acquisition computer is a laptop, then there exists a “Socket” PCMCIA
(Personal Computer Memory Card Interface Accessory) card with two serial
ports (see Figure 29b).
(a)
(b)
Figure 29 (a) Digiboard Classic, 8 serial port PCI card. (b) Dual serial PCMCIA card from
Socket Communication (http://www.socketcom.com/product/serial_dual.htm).
35
DSTO-GD-0372
Under the Windows 2000/NT operating system, if an RS232 cable is connected to the
serial port when the operating system is booted then the operating system thinks the
operator is trying to attach a mouse and will try and install the appropriate drivers.
The operating will also, most importantly, lock the serial port so it can no longer be
used and unpredictable mouse behaviour may result.
This idiosyncrasy of
Windows2000/NT usually happens if the serial cable being used is not fully
implemented. For example, there are only two, or three wires connected (Pin2, Pin3
and Pin5/7). The solution is to wire the serial cable so that it does not “look” like a
serial mouse. This modification must be done at the computer end of the cable, by
making the following alterations on the back of the serial connector:
For DB-25 (25 pin) solder a link between these pins.
pins 4 - 5
pins 6 - 8 - 20
For DB-9 (9 pin) solder a link between these pins.
pins 7 - 8
pins 1 - 4 - 6
After jumpering the serial cable remove the extra “Pointing Devices” using the device
manager in the Control Panel and the serial port should now be capable of accepting
data (Triton Elics International CD, Winter02).
2.3.4
Cable Type
In order to estimate the towfish position whilst it is being towed, some software
programs require the type of the cable to be entered (see section 5.3.4 for an example).
There is one type of cable used at DSTO although it comes in two versions. The tow
cable is a 10.5 mm (0.413 inches) coaxial copper, Kevlar reinforced cable which has a
breaking strength of 2270kg and a working load 454kg. This cable is termed a
Lightweight Coaxial Cable, is easily identified by its blue polyurethane jacket and is
useful for low stress situations, such as when the sidescan sonar is bowmounted to the
workboat. When the sidescan sonar is being towed, however, a stronger form of this
cable needs to be used. On the workboat there is a drum of this cable in which the blue
jacket has been covered by a double layer of counter helical, galvanized plow steel.
This cable is termed an Armoured Coaxial Cable and has the much higher breaking
strain of 4990kg and the working load of 1247kg.
In the past, the first thirty to forty centimetres of armoured cable leaving the towfish
has experienced considerable rusting when the cable has been left in seawater for more
than a day; This normally occurs when the towfish is being towed or tested over
several days and is left in its deployed configuration behind the DSTO workboat to
save deployment time each day. Figure 30 shows an example of such corrosion.
36
DSTO-GD-0372
The corrosion to the towcable causes the strength to be severely reduced and
eventually the corroded part of the cable needs to be removed. As this is a specialized
job (last performed by Mr Collin Mason) then efforts need to be made to reduce the
severity of the corrosion of the towcable. It has been suggested by Klein Associates
Inc. that the reason for the tow cable corroding quickly when it is left in seawater is
because the tow cable or the TPU have not been properly electrically connected (via the
drum) to the ships ground. If the TPU and the armoured cable were electrically
connected to the ships earth then all the equipment would be at the same potential and
corrosion would not occur (personal communication Vince Horan, 2002). Efforts
should be made to investigate whether or not the grounding of the steel drum to the
ship’s ground could be improved.
Figure 30 Corrosion of the armoured coaxial cable (black rectangle) which is used to tow the
Klein 5500 sidescan sonar on the workboat.
2.3.5
Cable-out Values
Cable-out information is used to calculate how far the towfish is behind the vessel.
This horizontal distance is termed layback. The simplest method of measuring cableout is to mark the cable with electrical tape at known distances from the towfish, for
example, every 5 metres. Then as the cable is payed out, the length can be estimated or
measured from the markings. The value of cable-out should be the taken as the length
of cable from the towpoint (for example the fairlead or sheath) to the towfish. A paper
record of the cable-out as it is changed over time (or relative to data file and ping
number) should be kept. This information can then be taken into account in postprocessing of data.
The Over the Stern Cable Angle Device (OSCAD) is a tool that can be used to measure
cable-out automatically. A small wheel resting on the cable measures the length of
cable-out. If mounted properly, it also measures the angle of the cable, giving very
good positioning of the towfish. OSCAD comes complete with mounting diagrams
and instructions, but fitting it can be difficult. The advantage of using OSCAD is that it
automatically measures cable-out, and this information can be input to the data files in
real time via a serial port. It is a wise practice to keep a paper record of cable-out as a
backup, for verification of the OSCAD data.
For further information on OSCAD, contact
37
DSTO-GD-0372
Dr Roger Neill
Maritime Platforms Division
(03) 96268651
38
DSTO-GD-0372
3 Host Computer Setup
3.1 Introduction
There are a number of settings that need to be made to the host computer before data
can be recorded. If a dedicated data-logging computer is being used then these
settings do not need to be altered for each survey. However, if the data logging
computer has been used for other purposes since a sidescan survey, then it is wise to
check and make sure that the settings described in this chapter have not been altered
before starting a survey.
This section will outline the correct settings when using Windows 95 and Windows
2000, as well as giving some explanation as to why these settings are required, how the
different software involved works, and how the different parts of the sidescan system
interact.
Most of the settings that need to be made to the computer acquiring the data relate to
setting up the Local Area Network between the TPU and the host computer. As the
TPU does not have its own hard disk, then when it is switched on it requests its
operating system file (called vxworks) and also a file that changes the default settings
of the operating system (called startup.ini). The file vxworks must be downloaded by
the TPU from the host computer for it to boot properly. If the file startup.ini cannot be
found then the TPU will still boot, but all of its settings will take on default values. It
turns out that all the default settings of the operating system on the TPU correlate with
the needs of DSTO and the file startup.ini is not needed.
As the file vxworks is very important, Klein Associates Inc. is continually fixing bugs
and updating old versions. Although it is not necessary to use the latest version of this
file,
if
the
user
wishes
he/she
can
find
it
at
http://www.kleinsonar.com/tech/download.html.
An FTP (File Transfer Protocol) server is required on the host computer to control the
initial transfer of the boot files from the computer to the TPU. For correct transfer, the
IP (internet Protocol) and FTP settings on the host computer must be compatible with
the TPU configuration settings. If the operator wishes, the setup of the TPU as well as
where it looks for its operating system on the host computer can be changed (see
Chapter#4).
3.2 Host Computer IP Address
The computer which the TPU will try and log onto needs to be assigned a specific IP
address. In the past this address has been 160.64.181.221. If the host computer does
not have an IP address assigned or the IP address that it has been assigned is not
compatible with what the TPU expects, then data transfer of the boot files will not be
possible, and the TPU will not boot. The following two sections will outline how to set
39
DSTO-GD-0372
the IP address of the host computer for the two operating systems, Windows95 and
Windows2000.
3.2.1 Windows 95
To set the IP address of the host computer under the Window 95 operating system,
select Start | Control Panel | Network. Select the “Identification” tab, and make a note
of the “Computer name”, which should be “Survey”. If it is not, select “Edit |
Change” and rename as “Survey.
To set the IP address, select the “Configuration” tab of the “Network” window, and
select the TCP/IP (Transmission Control Protocol/Internet Protocol) link from the
network components list. Click the “Properties” button below this list, and then in the
new window select the “IP address” tab. “Specify an IP address” should be checked.
Make a note of the IP address. It should be 160.64.181.221, and the subnet mask should
be 255.255.255.0. If it is necessary, this is the place where you could change the IP
address of the host computer. To do this, click “Let me specify my own address”, and
type in the address 160.64.181.221. Now the IP address of the host computer has been
set to what the TPU expects. The IP address of the TPU is set at 160.64.181.222.
3.2.2 Windows 2000
To set the IP address of the host computer under the Windows 2000 operating system,
go to the Control Panel and click on Network and Dial-up Connection. Then rightclick on Local Area Connection. This will make the Local Area Connection Properties
window to be spawned and it is here that the IP address of the host computer can be
set. Figure 31 shows the Local Area Connection Properties Window.
Once the Local Area Connection Properties window has been spawned then highlight
TCP/IP (Transmission Control Protocol/Internet Protocol) and click on Properties.
Then the Internet Protocol (TCP/IP) Properties window is displayed. To set the IP
address of the host computer click on “Use the following IP address” and enter in the
IP address of the host computer as 160.64.181.221 with a subnet mask of 255.255.255.0.
Leave the Default gateway window empty. Figure 32 shows the Internet Protocol
(TCP/IP) Property window with these necessary settings. Click on OK and the IP
address and subnet mask of the host computer will now be set.
40
DSTO-GD-0372
Figure 31 The Local Area Connection Properties window under Windows 2000.
Figure 32 The Internet Protocol (TCP/IP) Properties window and the necessary settings needed
by the host computer.
3.3 FTP Servers
3.3.1 Windows 95
Of all three computers in the sonar group that have been used to acquire sidescan
sonar data only one has the relatively old Windows 95 operating system. This PC is the
Isis workstation. Under Windows 2000, no FTP server is installed when the Windows
41
DSTO-GD-0372
95 operating system is installed. Hence, so the TPU can download its operating system
file vxworks, the Windows 95 operating system will need an FTP server program to be
installed onto it.
In the DSTO Environmental Assessment group, the preferred FTP server is called ServU 4.0. This ftp server is available from Rhinosoft (http://www.rhinosoft.com) and
because the DSTO group in Sydney was one of the first customers of this software
package then all upgrades are free of charge. There is a site licence for this product of
20, held by Lesley Hamilton, MOD, Sydney. Upgrades and information about this
software are available on the web at http://www.serv-u.com/. Instructions for
installing and/or upgrading ServU are given in Appendix A. Information provided
about Serv-U is taken from emails from the software company, documents from their
website, and experience.
3.3.1.1 FTP server “ServU”
The discussion that follows assumes Windows 95 as the operating system, although
Serv-U can be installed and used on Windows NT and Windows 2000. Information
and recommendations for setting up Serv-U come from the documents “System 5000
Host/TPU Setup and Configuration” provided by Klein Associates Inc and “LAN
Configuration Notes, Klein 5000 with LAN, Triton Isis workstation with NT 4.0”
provided by TEI.
3.3.1.2
Setting up Serv-U
When a PC is booted that had Serv-U installed on it (see Appendix A for installation
details) Serv-U should start by itself and be shown, minimised, in the taskbar by the
green icon
. This indicates that Serv-U FTP server is running in the background
and capable of FTP logins by any networked computers provided Serv-U and the
networked computer have been set up appropriately.
To set up Serv-U 4.0 so the TPU can retrieve its operating system file, vxworks, first the
Serv-U main application window needs to be visible (see -). This can be achieved by
either double clicking on the green “U” icon on the task bar or, if there is no such icon,
use the Windows Start menu to spawn the application by selecting Start | Programs |
ServU FTP Server | ServU, or, thirdly, browse for and run “servu32.exe” using the
Start Menu|Search|For Files or Folders.
42
DSTO-GD-0372
Figure 33 The Serv-U main window.
Once the main window of ServU has spawned, select the “Setup” menu and choose
“FTP Server”. This brings up the Setup FTP Server window (see Figure 34). Here four
settings need to be made. First set the FTP port number to 21. This is the TCP port
number that all computers, including the TPU, use for FTP transfers. If a different
number is set the TPU will not be able to download its operating system file. Secondly
check the maximum transfer speed (Kbytes/sec) to make sure it’s set reasonably high,
eg 1200. If the boot files are being transmitted to the TPU very slowly, it could be
because of this setting. The time that it takes the TPU to download the files vxworks
and startup.ini is indicated in the Serv-U main window and should be approximately
one or two seconds. Time values more than this should be considered excessive and
efforts made to increase the speed. It is recommended to set the number of users to 10,
and in the U/D (Up-Side/Down-Side or (Potential Gain versus Risk of Loss)) ratio
options to set timeout to at least 200 sec. Once these four settings have been entered
click on the OK button.
The next settings that need to be made relate to
informing Serv-U what the username is that
the TPU will try and log in as and where its
home directory is located. To enter these
details or to check previously entered values,
click on Setup|User and this will spawn the
User Setup window shown in Figure 35.
If Serv-U has just been installed then there will
be no entries in the Users window and the
username the TPU will log in as, as well as the
password that will be supplied, will need to be
entered. To do this, click the “new” button in
the right hand column and add the username
SONAR, with the password of klein. Also set
the home directory to “C:\” with the file
Figure 34 The ServU FTP Server window.
43
DSTO-GD-0372
directory access set to this as well. The home directory is the directory on the host
computer that the TPU will be placed as soon as it has logged in. When the TPU
cannot find its operating system file vxworks, it is often caused because this variable
has been set incorrectly. Table 4 outlines the settings that need to be made to Serv-U
so the TPU can log in.
Table 4 The four settings that need to be made to Serv-U so the TPU can log into the host
computer and retrieve its operating system file.
User name
Password
Home directory
File/Directory
rules.
SONAR
Klein
Pathname of the directory
containing the boot files
‘vxworks’ and ‘startup.ini’, eg
C:\klein or C:\ .
access As above
Figure 35 The settings that need to be made to the Setup Users window in ServU that allow the
TPU to log into the host computer and retrieve its operating system files.
The username that the TPU will use to log into the host computer, the password that it
will supply, the default directory for its operating system file vxworks, and the file
name of its operating system file, are all set within the TPU and can be altered, if so
desired. The names quoted above for the login variables are the default, factory
settings, set when the TPU was returned to Klein Associates, Inc. in 1991. In Chapter#4
details will be given which will outline how to change the values of these variables if
44
DSTO-GD-0372
the operator so wishes. The operator is warned however, that any changes should be
clearly marked on the TPU, as new users may not know how to check the TPU to
establish how it has been set up.
From experimentation with the directory settings, it seems that the Home directory
field cannot be left blank; otherwise the TPU will not be able to log in to the Isis
computer. The directory containing the files “vxworks” and “Startup.ini” must be
either in the directory listed under “File/directory access rules”, or in a subdirectory of
it. Without this, the TPU will be denied permission to access the file. For example, if
the file “vxworks” is located in C:\klein, the file/directory access rules must include
either C:\ or C:\klein.
3.3.2 Windows 2000
For any PC running the Windows 2000 operating system, there is a built in FTP server,
however it is not installed by default and most of the time needs to be installed from
the original CD. The ability to use a built in FTP server is very beneficial because it
saves time having to purchase such servers from external companies and then having
to worry about compatibility setup irregularities as well as upgrades.
If a “Default FTP Site” does not appear under Internet Information Service, under
Computer Management, then it needs to be installed from the original CD. If this is the
case then refer to Appendix A Section 4.
Once the Windows 2000 FTP server has been installed then it needs to be set up
appropriately. To do this, go to the Control Panel and click on Administrative
Tools|Computer Management.
This will spawn the Computer Management
window, and if the FTP server has been installed correctly, then under the Internet
Information Service icon
the Default FTP Site
should be visible. Figure
36(a) shows the Computer Management window with the Default FTP Site.
To set up the FTP server so the TPU can retrieve its operating system file (Vxworks),
right click on the default FTP Site icon and click on properties. This will spawn the
Default FTP Site Properties window (see Figure 37). In this window click on the FTP
Site tab (see Figure 37a) and in the Identification section, enter in VxBoot in the
Description area, 160.64.181.221 in the IP Address, and 21 for the TCP Port. Then click
on the Home Directory tab (see Figure 37b) and for the option “When connecting to
this resource, the content should come from:” click on “a directory located on this
computer”. Then in the FTP site directory set the local path to C:\ with read and log
visit attributes set. Then click on OK and the FTP server has been set up correctly (see
Figure 36b).
The last settings which need to be made before the TPU can use the FTP server is to
create the user “sonar” with the password “klein”. This user is needed because the
45
DSTO-GD-0372
TPU will try to log into the FTP server as this user with this password and unless this
user exists the TPU will not be able to log in.
Note: the Klein document (Klein Series 5000 Trouble Shooting Guide) specifies that
the user is klein instead of sonar, but this is incorrect.
(a)
(b)
Figure 36 The Computer Management window under Windows 2000 (a) before and (b) after the
Default FTP Server has been set up for the TPU.
46
DSTO-GD-0372
(a)
Figure 37 The Default FTP Site Properties window under the Windows 2000 operating system
showing the settings that need to be entered to the (a) FTP Site tab and (b) the Home
Directory tab, in order to set up the FTP server on the host computer for the TPU to
log into.
(b)
Figure 37 (Continued) The Default FTP Site Properties window under the Windows 2000
operating system showing the settings that need to be entered to the (b) Home
Directory tab, in order to set up of the FTP server on the host computer for the TPU
to log into.
47
DSTO-GD-0372
To create the user sonar with the password klein, leave the Computer Management
. Then
window active (Figure 36b) and expand the Local Users and Groups icon
right click on Users and click on New User… This will make the New User dialogue
box be spawned and it is here that the new user can be created. Figure 38 shows the
New User dialogue box with these details entered. Once the new user sonar has been
created then the TPU should be able to download its operating system using the FTP
server set up above.
Figure 38 The New User dialogue box under Windows 2000 creating the new user sonar.
3.4 Network Duplex settings
Duplex settings affect how data is transferred through the network that exists between
the recording computer and the TPU. Full duplex means that communication can take
place in both directions through the Ethernet cable at the same time, which can cause
collisions and data loss. Half duplex limits data transfer to one direction at a time,
which suits this system, as the bulk of the data flow will be in one direction, from the
TPU to the Isis. Triton Elics recommends that half duplex should be used.
48
DSTO-GD-0372
3.4.1
Isis PC Network Settings
To change or check the network settings of the Isis computer running Windows 95,
double click on the “3Com” icon
on the task bar. Alternatively, use the windows
start menu and click on Start | Programs | 3Com Nic Utilities | 3nicdiag. Click “yes”
to disconnect from the network and run diagnostics.
Both of these methods have the same result, which is to spawn the dialog box shown
below (Figure 39). Select the “Properties” tab as displayed, click on “duplex” in the left
hand menu, and set it to “half” in the right hand drop down menu, not full or auto.
Then click on OK and the settings have been made.
Figure 39 The network settings for the 3com network card in the Isis ruggedised PC under
Windows 95.
3.4.2 Windows 2000
The network settings under the Windows 2000 operating system can be altered using
and then under
the Control Panel. In the Control Panel click on the System icon
the Hardware tab click on the Device Manager. Then expand the Network Adapters
and right click on the network card you want to use to communicate with the TPU.
Here click on properties and under the Advanced tab, choose the property “Link Speed
and Duplex” and select a value of 100Mbits/sec Half Duplex. Figure 40 shows the
connection properties dialogue box and how to alter the duplex settings.
49
DSTO-GD-0372
Figure 40 The duplex settings window under Windows 2000.
3.5 Virtual Memory Settings
“Virtual memory” is the space on the hard disk that the Windows operating system is
allowed to write to when “memory” (Random Access) is full. The Virtual memory
settings define the amount of space allowed to be used, and the way this memory is
managed.
If you allow Windows to manage your virtual memory, then Windows will resize the
virtual memory allocation as necessary, using some processor time to do this.
Managing your own virtual memory settings allows you to set the minimum and
maximum size to the same value, which prevents Windows from resizing the virtual
memory allocation. This reduces the amount of processor time Windows is using,
leaving more resources available for data transfer and storage.
Managing your own virtual memory also allows you to use a drive other than C for
virtual memory. This is important if there is not sufficient space (250 Mb) available for
virtual memory on C drive (the Windows default). Managing your own memory can
also be useful if there are 2 physical hard drives available (not just partitions of the one
hard disk). Then you can use one hard disk for virtual memory and the other for data
recording, allowing 2 hard disk heads to be working for you simultaneously, rather
than the one hard disk head being used both for writing data to virtual memory and
writing to data files.
Triton Elics recommends “Let me specify my own virtual memory settings”, with
min and max both set to the same value, of at least 250Mb.
50
DSTO-GD-0372
To access the virtual memory settings under Windows 95 or Windows 2000 follow the
following procedures:
Windows 95: Click on “Start|Settings|Control Panel|System, and select the
“Performance” tab from the system properties window. Click on the “Virtual
memory” button to access virtual memory settings and select “Let me specify my own
virtual memory settings”. Type in “250” next to “Minimum” and “Maximum”, and
choose a drive from the drop down list that has at least 250 Mb of space available (This
is usually D:\ on the Isis computer).
Windows 2000: Click on “Start|Settings|Control Panel| System”, and under the
Advance tab click on the “Performance Options” button. Then in the performance
options window click on the change button in the Virtual Memory area. Then in the
Virtual Memory window choose the drive you would like to be partially used as
virtual memory and enter “250” next to “Minimum” and “Maximum”.
If available, choose a drive that is on a different hard disk than that on which data is
being recorded. Once you have made your selections click “OK”. You will be given a
warning message that managing your own memory settings can be problematic, and
“Are you sure you want to continue?”. Click “Yes”. If you have made changes to the
settings you will be asked to restart your computer. Make sure you do this before
trying to record data.
3.6 Screen settings:
3.6.1 Sonar Acquisition Software
Unlike SonarPro, which does not require the user to set the screen resolution or colour
depth to any specific values, early versions of Isis did. In particular, Isis version 4.54
and earlier required the colour depth to be set to 256 colours or 8 bit. If it was set to the
commonly used much higher values of 16 bit or 32 bit then an error message would
have been spawned when Isis was first executed. Figure 41 shows this error message.
This quirk in Isis was fixed after version 4.54, so it is no longer a problem. However, as
version 4.54 is still being used by DSTO then it was thought beneficial to highlight this
problem.
Figure 41 The error spawned by the Isis® software, version 4.54, when the colour depth has not
been set to 256 colours.
51
DSTO-GD-0372
3.6.2 Dual Screen Mode
As the software acquisition packages, Isis and SonarPro, use up a lot of screen area,
then it is beneficial to use two monitors or invoke a second virtual screen. A second
virtual screen is when one monitor has access to the screen area which would normally
be available if two monitors were in use, with the area of the second monitor accessed
by simply moving the mouse to the right hand side of the screen and continuing to
move the mouse towards the right until the user can see the screen background slide
towards the left.
As a virtual second screen is not as beneficial as two monitors then it would rarely be
chosen if the latter was available, but unfortunately the Isis PC’s video graphics card
(Number 9 Imagine 128) does not have the capability to output to two monitors and
the ISA Matrox graphics card, which was purchased to circumvent this limitation, was
not compatible with the Windows 95 operating system installed on the Isis PC. The
Number 9 Imagine 128 graphics card currently installed on the Isis PC however, does
support a second virtual screen. To access this, go to the bottom right hand corner of
the screen and click on the Hawkeye for Windows 95 icon
. Hawkeye for
Windows 95 is a software package which came with the Number 9 Imagine 128
graphics card and provides more features than would otherwise be available
(Appendix A Section#2 details the installation instructions). To invoke the second
virtual screen option click on the Resolution Exchange tab and choose the virtual
screen that is desired. Optimum results have been obtained by setting the virtual
screen to 2048 by 768 and the monitor resolution to 1024 by 768. Figure 42 shows an
example of the Hawkeye for Windows 95 graphics card enhancement software. Note,
the Isis PC sometimes crashes when the Hawkeye software is being used.
Figure 42 The Hawkeye for Windows 95 enhancement software and how the settings of the
second virtual screen are set.
52
DSTO-GD-0372
The other newer computers used to acquire sidescan sonar data in DSTO’s
Environmental Assessment group use the Windows 2000 operating system and this
permits the usage of the high quality Millennium G450 Matrox Dual Head Graphics
Card. These types of graphics card permit two monitors to be attached to any
computer simultaneously. To invoke the usage of two monitors from the matrox cards,
click on Display in the Control Panel, then click the Settings tab in the Display Property
window and then click on “Advanced”. Then click on the “Dual Head” tab and click
“Dual Head Multi-display” (see Figure 43). Then click on OK and it should be possible
to attach two monitors to the acquisition computer.
Figure 43 The Millennium Matrox G450 Dual Head graphics card setting dialogue box.
53
DSTO-GD-0372
4 TPU Operations
As outlined in section 2.1, the TPU (Transceiver and Processing Unit) is a fairly
sophisticated computer that is essential to the operation of the Klein 5500 sidescan
sonar. There is normally only one concern with the TPU and this is to make sure that it
has downloaded its operating system file vxworks from the host computer and to
make sure that it has booted properly. Although it has never been performed in the
past it is also possible to alter the setup or configuration of the TPU.
This chapter will begin by outlining the procedure that needs to be followed to observe
the boot sequence of the TPU and this chapter will end by outlining the procedure to
change the set up of the TPU. As it is harder and more daunting to interrogate and
alter the set up of the TPU, coupled with the fact that any incorrect setups that cannot
be fixed will require the TPU to be sent back to Klein Associates. Inc., then it is ill
advised to change any settings on the TPU. But, if it is necessary to perform this
function then the procedure outlined in section 4.2 can be followed.
4.1 Boot Sequence of TPU
The TPU is set up so that the progress of its boot sequence is output to the Com1 port
at the front of the TPU (see Figure 44). By using a terminal emulation program and an
external computer, the bootup sequence of the TPU can be viewed. Such a sequence is
very helpful because it shows if the TPU is acquiring its bootup files vxworks and
startup.ini. Figure 45 shows an example of the bootup sequence of the TPU and how it
would appear in a terminal emulation program.
Figure 44 The Front panel of the TPU showing the Com1 serial input port (marked with a
yellow circle).
54
DSTO-GD-0372
VxWorks System Boot
Copyright 1984-1996 Wind River Systems, Inc.
CPU: Motorola MVME2600 - MPC 604e
Version: 5.3.1
BSP version: 1.1/4
Creation date: Feb 3 1998, 11:23:14
Press any key to stop auto-boot...7,6,5,4,3,2,1,0
auto-booting...
boot device
processor number
host name
file name
inet on ethernet (e)
host inet (h)
gateway inet (g)
user (u)
ftp password (pw)
flags (f)
target name (tn)
startup script (s)
:
:
:
:
:
:
:
:
:
:
:
:
dc
0
survey
\klein\vxWorks
160.64.181.222
160.64.181.221
255.255.255.0
sonar
klein
0x0
VxTarget
\klein\startup.ini
Attaching network interface dc0... done.
Subnet Mask: 0xffffff00
Attaching network interface lo0... done.
Loading... 1378116
Starting at 0x100000...
Attaching network interface dc0... done.
Attaching network interface lo0... done.
NFS client support not included.
++++++++++++++++++ Wicked Excellent Sonar ++++++++++++++++++++
+
+
+
*****
*
*
*****
********* ******* *
* +
+ *
*
*
*
*
*
*
*
* *
* * +
+ *
*
*
*
*
* * * * +
+
*
*
*
*
*****
*
*
* +
+
*
*
*
*
*
*
* +
+
*
*
*
*
*
*
* +
+ *
*
*
*
*
*
*
*
* +
+
*****
*
*****
*
******* *
* +
+
+
+
5555555555
000000000
000000000
00000000
+
+
5
0
0
0
0 0
0
+
+
5
0
0
0
0 0
0
+
+
5
0
0
0
0 0
0
+
+
555555555
0
0
0
0 0
0
+
+
5
0
0
0
0 0
0
+
+
5
0
0
0
0 0
0
+
+
5
0
0
0
0 0
0
+
+
5
5
0
0
0
0 0
0
+
+ 555555555
000000000
000000000
000000000
+
55
DSTO-GD-0372
+
+
++++++++++++++++++ Wicked Excellent Sonar ++++++++++++++++++++
$M
$TA1
$TA1
$TA1
$TW0
$TW0
$TW0
$TDF
$TDF
$TDF
$TR7
$TR7
$TR7
Figure 45 The boot-up sequence of the TPU as it would appear in a terminal emulation program
on an external computer which is connected to the Com1 port of the TPU.
In the seabed mapping group the external computer that is normally used to view the
boot sequence of the TPU is an old laptop. Although it is certainly possible to use the
acquisition computer to view the boot sequence this has not been adopted in the past
because the computer which the TPU downloads it operating system file from is
normally the acquisition computer, and on this computer it is beneficial to leave the
com ports free for auxiliary data such as gyro or depth data. This approach is also not
adopted because it is likely to mean that the null modem cable connecting the TPU to
the computer will need to be removed before data can be collected.
The terminal emulation software which is often used to view the boot sequence of the
TPU and which can also be used to interrogate and alter the setup the TPU, is
HyperTerminal
(Windows
95,
NT,
2000)
although
Procomm
(http://www.symantec.com/procomm/) has sometimes been used. HyperTerminal
has the advantage that it comes with Windows and so is free but has the disadvantage
that it takes slightly longer to set up compared with Procomm. HyperTerminal also
has the disadvantage that on several occasions it has inexplicably not been able to
communicate to a com port and Procomm has had to be used. The advantage of
Procomm is that it is easy to setup but has the drawback of not being free of charge.
The following procedures will assume HyperTerminal is being used to investigate the
TPU.
To spawn HyperTerminal, either click on Start | Programs | Accessories |
Communications|HyperTerminal or browse for, and run the executable, hypertrm.exe.
Before HyperTerminal can be used to display data arriving at a com port it needs to be
setup for the com port in question. Making a note of the com port that the null modem
cable is connected to on the computer that is connected to the TPU, spawn
hyperterminal. When this is performed a prompt will appear asking if a new
connection will be made (see Figure 46a). This is simply requesting a name to be given
56
DSTO-GD-0372
for the connection to the com port (assuming one has never been made) that is
receiving data from the TPU and to enter the attributes of the data being received.
Figure 46a The “New Connection” dialogue box in HyperTerminal.
If a connection has previously been created, click on Cancel in the New Connection
window and simply open the connection to the com port by clicking on File|Open and
selecting the session file. If a connection does not exist then type in a name for the new
connection in the New Connection window, such as TPU, and click on OK. Then the
Connect To window will be displayed (see Figure 46b). As it is one of the com ports
that Hyperterminal is trying to retrieve data from and not an outside telephone, then
click on the “Connect using” variable and select the com port that the null modem
cable from the TPU is connected too. Click on OK and the last, and most important
window to be displayed, is the Com Port settings window (see Figure 46c). It is here
that the baud rate, data bits, parity, stop bits and flow control of the data coming from
the TPU need to be set.
By default the baud rate of the data coming out of Com1 on the TPU is set to 9600 bits
per second, although this can be changed using the variable SET BAUDRATE in the
file startup.ini. For the other variables in the Com Port settings window these must
take the values of 8 data bits, no parity, 1 stop bit (abbreviated to 8N1) and with the
flow control being Xon/Xoff. If these settings are entered incorrectly then the data will
not be legible, but data will still be displayed. Once the attributes of the data have
been entered into the Com Properties window click on OK and immediately
HyperTerminal will try and connect to the com port just chosen. If data is being sent
up from the TPU then it should be visible on the screen. When all the necessary data
has been received from the TPU, then click on the disconnect icon
and if this was
a new connection then save the settings that have just been made by going to File|Save
As and chose a name that will make it clear what the reason was for the connection.
57
DSTO-GD-0372
For simplicity TPU could be chosen but this is not compulsory. Now that a
hyperterminal session file has been created then the next time the boot sequence of the
TPU needs to be displayed then it is a simple matter of going to File|Open and
choosing TPU.ht.
(b)
(c)
Figure 46 The (b) Connect To and (c) Com Properties windows in HyperTerminal.
Even though a HyperTerminal session may display the message shown in Figure 45
and indicate that the TPU has booted up correctly there is more convincing evidence
that the TPU is working correctly. Such evidence is by the flickering of the light
labelled “vme2” located at the front of the TPU on the DSP board, irrespective of
whether or not the Klein 5500 has been connected to the TPU. If the Klein 5500 sonar is
attached to the TPU then when the TPU boots up the light sequence on the TPU’s DSP
board should proceed as A on and then off, then B on and then off, then C on and then
off, then all will light and will stay on whilst the vme light starts flickering. The green
light emitting diodes labelled A,B,C and vme can be seen in Figure 44 on the DSP
printed circuit board.
It has been known for the TPU to sometimes crash during a survey. Such crashes will
be indicated by blank waterfall displays as well as the vme light, either staying on
permanently or being completely off. If this does happen the TPU will need to be
rebooted. This can be easily achieved by depressing the white reset (RST) button at the
front of the TPU on the CPU board, or the TPU can be fully rebooted using the green
on/off switch.
2 VME is defined as VersaModule Eurocard and is a computer bus network just like ISA and
PCI. See (http://www.ee.ualberta.ca/archive/vmefaq.html) for more details.
58
DSTO-GD-0372
4.2 Altering TPU Setup
The procedure used to interrogate and if necessary alter the setup of the TPU is very
similar to the procedure used to view the TPU’s boot up sequence.
When it is desirable to interrogate, and if needed alter the settings of the TPU, then
instead of viewing the TPU’s boot sequence, the approach needed is to stop the TPU
from successfully booting. This is because the TPU is set up so that if it is either
stopped from booting or cannot boot, the prompt “[VxWorks Boot]:” appears in the
terminal emulation program and the TPU is placed in edit mode, ready for its settings
to be changed. The TPU can be stopped from booting by simply hitting any key when
the message “Press any key to stop auto-boot” appears in the terminal emulation
program or the TPU will be placed in edit mode if it cannot download its operating
system file vxworks.
When the prompt “[Vxworks Boot]:” appears, the setup of the TPU and how to alter it
can be displayed by typing “c” and hitting the enter key. Hit “Enter” to move the
cursor through the various fields. To change a field, type in the new value and hit
enter. When you have seen all the options you will again see the [VxWorks Boot]:
prompt. Type “@” then enter to resume booting, or type “c” then enter to access the
settings again.
When you have finished viewing and changing settings, and have typed “@” and hit
enter, the TPU will continue booting. If everything is set correctly, file transfer of
“vxworks” and “startup.ini” should occur and the HyperTerminal window on the
laptop or acquisition computer will scroll information about the booting sequence, as
shown in Figure 45. The TPU lights should light correctly, and the acquisition software
should be able to record data from the sonar.
The following table describes what seems to be the most reliable way of configuring
settings on the TPU. The settings on the TPU must match the settings on the
acquisition computer as described in 6.1 and 6.2.1. In particular, note that the
“filename” field on the TPU is set to “vxworks”, with no pathname.
Table 5 The variables which need to be set on the TPU and the acquisition computer and the
correct values that they need to be set to.
Field name on Acquisition computer TPU field name
Computer name
(in Control Panel | Network |
Identification)
IP address
(in ControlPanel | Network | Configure |
TCP/IP | Properties | IP address)
Subnet mask
Field value
Host name
Survey
Host inet new
name
160.64.181.221
255.255.255.0
59
DSTO-GD-0372
N/A
User name
(in ServU | Setup | Users)
Password (in ServU | Setup | Users)
60
Address of TPU
File name
Pathname of the
directory
containing the
file ‘vxworks’,
C:\ .
sonar
User
Location
startup.ini
ftp password
of
klein
DSTO-GD-0372
5 Configuring and Running the Acquisition Software
5.1 Introduction
At the time of this report there were two software programs being used at DSTO to
acquire sidescan data from the Klein 5500 sonar. There was the Isis package, which has
been used for several years, and then there is the less used, Klein software package,
SonarPro. Isis has been used very successfully for several years but it has the flaw that
the data file formats, namely eXtended Triton Format (XTF), cannot be read by
SonarPro. This makes liasing with Klein regarding sonar problems difficult.
To aid communication with Klein it was thought beneficial if some expertise was
gained in using the software package that Klein supports. This software is SonarPro
http://www.kleinsonar.com/sonarpro/index.html and has been used successfully
since mid 2001.
Particularly for Isis, there are many settings that affect the quality of the data being
acquired and the stability of sonar system. These settings do not normally need to be
re-entered for each survey, unless a different sonar is being used than was used
previously or if newer versions of the software are being used.
This chapter discusses the rudimentary settings which need to be made to Isis and
SonarPro so high quality data can be acquired and saved. This chapter however, does
not cover all the intricacies of how to setup and tweak these two software packages.
Such a chapter is not needed as both Isis and SonarPro have very good manuals
covering all facets of usage. Full details of Isis and SonarPro are given in their
respective manuals (see Isis Sonar User Manual, Volume 1.pdf and Sonarpro version
5.3 cd manual.pdf).
5.2 ISIS Setup
Isis can be launched by either double clicking on the Isis icon on the desktop, or
clicking on Start|Programs|TEI|Isis or use Start|Search|For Files and Folders and
search for the executable Isis.exe.
Once Isis has spawned its main window, if an error message is displayed informing
the operator that Isis is in demo mode (see Figure 47) then this means that Isis has not
detected the Isis dongle (outlined in section 2.2.1.1). It is important to head this
warning because in demonstration mode Isis cannot save data to disk and can only
play data files back. This error message comes about because either the Isis dongle has
not been attached to the printer port (LPT1) or is attached but does not sit correctly
(which has occurred in the past). For the first scenario simply attach the dongle whilst
for the second, remove the dongle and reattach it firmly. Both scenarios must be
followed by rebooting the acquisition computer. If, upon rebooting the acquisition
computer with the Isis dongle attached, Isis does not detect it, either keep on removing
61
DSTO-GD-0372
and reattaching the dongle, or if the Isis ruggedised computer is being used then
mount the dongle internally. Again the acquisition computer must be rebooted. Only
after Isis has detected the Isis dongle correctly and Isis has been spawned with the
error message in Figure 47 not appearing, can Isis be setup.
Figure 47 The warning that Isis generates when it is first spawned and cannot detect the Isis
dongle.
To set up Isis so that it knows which sonar it will be acquiring data from, which data
channel from the selected sonar it needs to display backscatter and which channels
need to be saved to disk, click on the File menu and select the Record Setup. This will
cause the Record Setup Options window (see Figure 48) to be spawned. In this
window there are three choices: Sonar Setup, Serial Ports, and File Format. These three
dialogue boxes are fundamental to setting up Isis ready for data collection, because
they control:
•
•
•
•
The sidescan sonar or multibeam echosounder that Isis will be receiving data
from.
Channel setup for the sonar chosen (each channel represents a particular
frequency on either the port or starboard side of the towbody. For example the
dual frequency, Klein 595 sidescan sonar has four channels, whilst the single
frequency, Klein 5500 only has two.
The serial ports (com1, com2, etc.) that auxiliary data needs to be acquired over
as well as the attributes of this data.
The file format that will be used, if any data is to be saved.
Figure 48 The Record Mode Setup window in Isis.
These three options will now be outlined in detail.
62
DSTO-GD-0372
5.2.1 Sonar Setup
To inform Isis which sidescan sonar data it will acquire data from, click on Sonar Setup
in the Record Setup Options window and in the Select Sonar dialogue box that is
spawned (see Figure 49) click on the sonar of choice. In this dialogue box the sidescan
sonar that is likely to be chosen is the Klein 5000. As Isis saves its setup from the
previous session then it may happen that in the Currently Selected sonar box, located
in the bottom left of the Select Sonar dialogue box, the sonar that is going to be used
appears in this window (for example “Klein 5000-Digital Mulitbeam Sidescan (5
beams)). If this is the case then it is superfluous to still select the sonar from the list
available. It should be noted that it sometimes happens that the button “Standard
Analogue” is highlighted in the Select Sonar dialogue box even though the sidescan
sonar an operator wants Isis to display data from appears in the Current Selection.
This scenario is just a quirk of Isis and an operator need only be concerned with the
sonar displayed in the Currently Selected Sonar.
Figure 49 The Select Sonar dialogue box in Isis.
When the Klein 5000 series of sidescan sonars is chosen from the Select Sonar dialogue
box a second window will be displayed asking if bathymetry will be logged (see Figure
50). This query arises because the Klein 5000 series of sidescan sonar could have been
purchased with an interferometric bathymetry option. As the Klein 5500 sidescan
sonar at DSTO does not have this option then click on NO.
63
DSTO-GD-0372
Figure 50 The dialogue spawned by Isis asking if the Klein 5500 will be used to log bathymetry.
After the bathymetry logging option for the Klein 5500 has been cancelled, Isis will
spawn the Sidescan Sonar Information dialogue box (see Figure 51). This new
dialogue box is somewhat misleading because although it lends the operator into
thinking that it has some control over the waveform output of a sidescan sonar, it does
not. The information supplied in the Sidescan Sonar Information dialogue box should
reflect what the current settings are for the sonar and as at DSTO the same sonar is
used then it has never needed to be altered. The only time the information in this
dialogue box may need changing is when the characteristics of the sonar have been
altered (external to Isis) and the information that appears in the Sidescan Sonar
Information dialogue box reflects the settings used in a previous session. Click on OK
and control will be returned to the Record Mode Setup window.
Figure 51 The Sidescan Sonar Information dialogue box used in Isis.
5.2.2
Serial Port Setup in Isis
When sidescan sonar is being collected there is peripheral data that, either needs to be
incorporated into the data files if the data is to be useful, or is peripheral data that is
normally not saved with sonar data but is needed for a particular occasion. Examples
64
DSTO-GD-0372
of the first type of data would be GPS. Without this type of data the sidescan sonar
data would be useless. Examples of data which is sometimes needed to be saved with
sidescan sonar data files could be gyro data, cable-out data or echosounder data.
The first step in incorporating non-sonar data into a sidescan sonar data file is to set up
their respective instruments so that they output their values over a serial cable and to
connect such cables into a spare serial port on the acquisition computer. The next step
is to set up Isis so that it knows what type of data to expect, from a particular com port
and the baud rate of the data being sent.
As each form of peripheral data being routed to the acquisition computer requires a
spare com port coupled with the fact that the computers used in the seabed
characterisation group either have one or two com ports, then the situation which
commonly arises is that there is no spare com ports available. As outlined in section
2.4.3, the avenues available to circumvent this problem are to use the Digiboard Classic
(see Figure 29a), which has 8 serial ports, or a PCI board could be purchased which has
one or two serial ports or, if a laptop is being used, then the dual serial port, PCMCIA
card of the Environmental Group (see Figure 29b) can be used.
The first step in configuring Isis so that it will interrogate a particular com port,
decipher the data arriving on it, and then incorporate the data into the sidescan sonar
data file, is to click on the “Serial Ports” tab in the Record Setup window (see Figure
48). When this is done the Serial Port Setup window is spawned (see Figure 52) and it
is in this window that the settings are made.
Figure 52 The Serial Port Setup window used in Isis.
For each port on the acquisition computer that data is coming in on, the following steps
need to be followed for the Serial Port Setup window:
65
DSTO-GD-0372
•
•
•
Click on the radio button next to the com port over which data is being
received.
Then click in the “on” box under the status area of the Serial Port Setup
window. This enables the rest of the Serial Port dialogue box to become active.
NOTE: In some older versions of the Isis software, for ports that have status
selected as “on” but either do not exist, or have no serial inputs, a message that
the serial port is not available will be given when Isis is opened. To stop these
messages occurring, turn off any serial ports that are not in use.
Then, using the drop down lists in the Port Settings area, set the baud rate, data
bits, parity and stop bit of the data in question.
These settings are very important. The reason for backscatter data needing to
be discarded is often because these values have been incorrectly entered.
For GPS and Gyro data the Port Settings are normally 4800 bits per second,
with 8 data bits, no parity and one stop bit.
•
Now choose the appropriate Navigation/Telemetry Template. Templates
inform Isis of the format of the data being received and either a predefined
template can be used or one can be constructed. Constructing a template is
particularly needed when cable-out or echo sounder data is being read.
Section#5.2.2.1 will outline the construction of templates in detail.
There are a number of predefined templates available and the one that needs to
be used for the GPS and Gyro data is the NMEA0183. This is because the GPS
and Gyro data being incorporated into Isis are in the NMEA format. The
structure of this format for the GPS and gyro strings were outlined in section
2.3.3.
If a predefined template is selected then it will appear in the white edit box at
the bottom of the Navigation/Telemetry panel. If a template needs to be
constructed then click in the white edit box and enter it.
•
•
•
66
There are two other check boxes in the lower right of the dialog box. Leave
these unselected.
The last setting is the navigation latency. For details on how to calculate
navigation latency, see multibeam training course notes. If Latency has been
calculated then it can be entered here.
If data is being transmitted to the com port then it is possible to test that the
settings made above will save the data appropriately. This is possible by either
clicking on the Test button in the Serial Port Setup window or clicking on “Com
Port Test” from the “Tools” menu in the main Isis window. This displays the
Com Port Test window (see Figure 53) in which a panel exists for each com port
showing the activity on it and how Isis is deciphering this activity. The panel
will display “Com port not set up” if the status box for the port is not checked
DSTO-GD-0372
as on. For the serial ports that are on, any data being received is displayed and
should be legible. If the data that needs to be recorded is not being displayed or
is, but is not legible, then click on the OK button in the test window and check
the settings made in the Serial Port Setup.
•
•
At this stage the operator can complete the setup for each com port using the
Serial Port Setup window and then click on the Test button to make sure all the
settings made are correct.
When each com port has been setup correctly click the OK button in the Serial
Port Setup window (Figure 52).
Figure 53 The Com Port Test window in Isis.
5.2.2.1 Isis Templates
(Taken from emails and Isis Sonar Volume 2:Appendices to the User’s Manual
February 20, 2002)
Templates are created so that Isis understands which variables in a data string need to
be saved and which ones, if any, need to be discarded. Each piece of data in the
incoming string that an operator wants to be saved requires a corresponding token or
letter in the template. The tokens that are commonly used include:
D day, M month, Y year, H hour, I minute, S second, N northings, E eastings, h Fish
Heading (in degrees),J Julian Day, o cable-out, l layback, Y, x ship latitude and
longitude in degrees, G boat heading or course made good (depending on whether a
67
DSTO-GD-0372
gyro is used or GPS data), 0 (zero) sonar depth in meters, ship speed v, towfish speed
V, 8 sonar pitch, 9 sonar roll, (w) water temperature, a auxiliary altitude.
If a variable in a data string does not need to be saved then this can be indicated in the
template by putting an “X” in that position. Although each sentence in NMEA data
starts with the code $GPxxx, indicating the data type to follow, an X does not need
need be in the template to tell Isis to ignore this. If no further data fields need to be
saved from a data string arriving on the com port then Isis can be informed of this by
leaving the rest of the template blank.
For gyro serial input, a special template should be created instead of using the
NMEA0183 template. The reason is that Isis will alternate between gyro input and
course made good from GPS data if the predefined NMEA0183 template is used. This
creates the illusion that the sonar is yawing when a data file is played back even
though the sonars yaw characteristics may be quite smooth.
In the Environmental Assessment group at DSTO, templates have also been created so
cable-out or layback can be incorporated into sonar data files. Cable-out values have
been obtained in the past using the cable measuring device OSCAD (Over-the-Stern
Cable Angle Device). To inform Isis that cable-out or layback needs to be saved use the
tokens “o” for cable-out and “l” for layback. In some versions of the Isis software,
these data fields can only store integers. To store lengths including decimetres, create a
template that multiplies the incoming value by 10 before storing. Then, a cable-out of
10.3 metres, for example, will be stored as 103. Remember to convert back to metres
when post-processing.
In addition to creating templates to read all or part of any data string arriving at a com
port, it is also possible to create templates that perform mathematical operations on
serial data. To perform this, each separate operation is enclosed in curly braces (for
example {} ) and placed in the template immediately before the token that it will be
operating on. The operators that can be used are the common “+”,”-“,”/” and “×”.
As an example, if an operator wishes to convert magnetic heading from a magnetic
compass to true heading in the region they are located, an offset of +13° must be
applied. If the serial string starts out as
“$GPHDM, 36.4, ….”
where the magnetic heading is 36.4°, then the required template to convert the
magnetic value to true north is then
“{+13.5}G”.
If an entire serial string needs to be saved then this is accomplished by adding
“{saveraw}” to your template. In this situation the serial string will be written to the
data file as a separate data packet, after Isis has performed any functions outlined in
the template string. Another role this option can play is to store depth from an
echosounder. This is because the best option when wanting to store echosounder
68
DSTO-GD-0372
serial input data is to simply use “{saveraw}” as the template. It is possible to create a
template to store the echosounder depth as fish depth, but the echosounder depth
value will not usually correspond to fish depth.
The serial ports receiving NMEA navigation input, which contains time information,
should also have the string “NOCLOCK” added to the end of the template (in capitals,
no quote marks). This prevents the computer clock from syncronising its (local) time
to the (Greenwich Mean) time in the NMEA signal.
Similar to testing the set up of each com port when a predefined template is used, to
test that a template has been created correctly, click the “Test” button in the Serial Port
Setup window (Figure 52) or select “Com Port Test” from the “Tools” menu of the
main Isis window. This displays the Com Port Test window (see Figure 53) in which
the data Isis is obtaining for each com port is shown. The panel will display “Com
port not set up”, if the status box for a port is not checked as on, whilst for the serial
ports that are checked, any data being received is displayed. If the data needing to be
recorded is not being displayed then either the template has been incorrectly
constructed, or the port settings have been set incorrectly.
If sidescan sonar data is not going to be saved to disk, then no further steps need to be
taken and this completes the basic setup of Isis. Click on OK in the Record Setup
Options and Isis is ready to display data in the waterfall display. If sidescan sonar data
is also going to be saved to disk then another step needs to be taken. This is to set up
the file format of any data files, however as the format used at DSTO has not changed
in the past several years as well as its attributes, then this step is rarely taken and
assumed to have not changed from a previous session when data was saved to disk. It
has been outlined here for completeness.
5.2.3
File Format
To set up the file format that will be used if any sonar data is saved to disk, click on the
File Format button in the Record Mode Setup window. This will cause the File Format
window to be spawned (see Figure 54). As outlined in the above paragraph the
settings in this dialogue box will normally not need changing from one Isis session to
the next and it is common for an operator to quickly glance over these settings and not
make any alterations. At DSTO the settings which have been employed in the past
have been to use the XTF (eXtended Triton Format), with 16 bits per pixel and no
downsampling. Once the file format specifications have been either checked or
entered then click on OK in the File Format window and control should be returned to
the Record Mode Setup window. Click on OK in the Record Mode Setup window and
this completes the basic setup of Isis. It should now be possible to acquire data from
the chosen sidescan sonar, as well as save it to disk in the format chosen.
Note: Although a lot more shades or grey can be saved using 16 bits per pixel instead
of 8 bits per pixel, Isis will only display 8 bits per pixel in the waterfall display. The
69
DSTO-GD-0372
number of data bits Isis displays in the waterfall display is controlled by the Threshold
slide bar in the waterfall display.
Although the downsampling option has not been invoked at DSTO it arises because
the Isis analogue-to-digital processors usually digitise a greater number of samples
than Isis writes to disk and the number of data samples needs to be downsampled or
reduced. If the downsample option is invoked then the choice needs to be made as to
how the replacement samples are computed,
with the choices being to take the maximum
pixel value in a group or to calculate the rootmean-square. If a sidescan sonar is being used
in a search capacity, which dictates that small,
bright3 objects are not erased by a filtering
process, then the Max option should be chosen.
If a sidescan sonar is being used in survey
capacity then RMS should be chosen.
5.2.4 Sentinel Querying
As Triton Elics International has developed
many software packages then sometimes one of
their dongles (or sentinels) will need to be
interrogated to investigate which software
packages it will permit to run. A dongle would
also need to be interrogated if it was required to
provide access to a software package or a
module that it was originally not purchased for.
In Isis, a dongle can be interrogated by clicking
on Configure|Security… When this is
performed the software a dongle will permit
access to as well as any modules, is listed in the
Security dialogue box. Figure 55 shows this
security box for the Isis dongle purchased by
Figure 54 The File Format dialogue
DSTO. It can be seen that this dongle most
box used in Isis.
importantly permits the usage of Isis, with the
sidescan sonars Klein 5000, Klein 2000 and the
analogue Klein 595. Other sidescan sonars can be used with this dongle as well as the
packages Target Utility, Delpmap with Isis mosaic (with realtime mosaicking and
classification).
Keep in mind that objects exhibiting strong acoustic returns will be displayed as dark objects
in a waterfall display. If inverse video mode is employed, however, then they will appear as
white.
3
70
DSTO-GD-0372
Figure 55 The security dialogue box for the Isis dongle PR-1/97100 which resides at DSTO,
Sydney.
If access is needed to a software package or a module that TEI constructed but the
dongle was not originally purchased for it then TEI will need to be contacted and a key
obtained. This key will be a long ASCII string that needs to be entered into the security
dialogue box in the Feature Unlock Code area (see Figure 55). If the key has been
successfully entered then the software package or module that the key should provide
access to should change from No to Yes in the security dialogue box. If this is not the
case then either the key has been entered incorrectly or the key is incorrect and TEI will
need to be contacted. A key only needs to be entered successfully once, not each time
an Isis session begins.
5.2.5 Keeping a Log in Isis
In the first instance that data is being written to disk, during an Isis session or when the
filename changes, the settings that control the way data is stored are appended to the
end of the log file survey.log, located in the same hard disk in which sonar data files
are being generated. The information being appended includes date and time, Isis
version in use, system serial number, file name, name of sonar, number of sonar
channels, number of samples per channel and their configuration, number of
bathymetry channels, and the template for each serial port. Such information can be
71
DSTO-GD-0372
very helpful when the settings that were employed in a previous session need to be
checked.
5.2.6
Isis Server Software
In addition to the kernel of the Isis software, Isis also has server programs for each
sidescan sonar and multibeam echo sounder (MBES) Isis can display data from. These
programs were constructed by TEI and act as barriers between the sidescan sonars or
multibeam echo sounders and Isis, alerting Isis that new data is available for
downloading, processing and displaying. For the Klein 5000 series of sidescan sonar
this program is the KLN5000.exe program.
Although not all server programs have their own dialogue boxes, the Klein 5000 does
(see Figure 57). These dialogue boxes dialogue boxes allow easy testing of the servers
because if these servers are double clicked and their dialogue boxes are spawned then
this means they are working. All server programs which have their own dialogue
boxes, can be called from within Isis. Those server programs that do not have their
own dialogue boxes cannot be called from within Isis and run in the background.
Some server programs, one being the Klein 5000 server, also have controller software
programs. These programs augment the server programs, and play the important role
of enabling an operator to directly control a sidescan sonar or MBES although have the
quirk that they were constructed by the companies that made the instruments and not
TEI. That which exists for the Klein 5000 is the “Klein 5000 System Control” (ss.exe).
Figure 57 and Figure 56 shows the dialogue boxes for the KLN5000.exe server and the
Klein 5000 System Control (ss.exe) software, respectively. The peculiarities of these
two programs will be outlined in the following sections.
Figure 56 The Klein 5000 system control dialogue window.
5.2.6.1 Isis Server software (Klein5000.exe) for the Klein 5000
The dialogue box spawned by the server software which enables data to be delivered
from any one of the Klein5000 series of sidescan sonars to Isis, is normally spawned as
soon as Isis is and located to the right of the main waterfall display. Depending upon
the configuration of this dialogue box in the last Isis session, just prior to Isis being
closed, this dialogue box may appear in its condensed version (see Figure 57b). If this
occurs then the normal view can be activated by clicking the button “More Options
>>” located in the top left hand corner of the dialogue box.
72
DSTO-GD-0372
(a)
(b)
Figure 57 The dialogue box for the Klein 5000 server in (a) normal display and (b) condensed.
From Figure 57 it should be noticeable that because this dialogue box is located to the
right of the main window of Isis, then very little of it is viewable by an operator when
only one monitor is being used. This problem of not being able to see much of the
Klein 5000 server dialogue box when one monitor is being used is the reason why two
monitors or a second virtual monitor is used at DSTO. Section#3.6.2 outlines the
hardware and settings needed to set up a second monitor or a second virtual screen.
Although the role of the server programs is to deliver data from their respective sonars
to Isis, the dialogue boxes that some spawn need to have particular settings made to
them. The settings which need to be made to the Klein 5000 server dialogue box will
be outlined below.
Activate the following radio buttons:
• Sidescan-LAN Connection. This is needed as a Local Area Connection has been
created (if Chapter#3 has been followed successfully) between the TPU and the
acquisition computer.
• Under the “Save in Isis” section, the radio buttons for Sidescan, Roll, Yaw and
Echo channel 1 (as only the first echo is ever used). The radio button for hidden
beams can be activated. These are the beams that are not being used because
the sonar is moving less than its top speed of 10 knots. If the hidden beams are
saved the data files will be larger than normal. Those radio buttons for subbottom data should not be activated, as the sonar at DSTO does not have this
option.
• “Send K5000 Nav and Telemetry to Isis”. This radio button is normally chosen
instead of “Send only telemetry to Isis” because, as outlined in section 2.1.1,
73
DSTO-GD-0372
navigation data should be routed to the TPU. If navigation data is routed to the
acquisition computer then the radio button “Send only telemetry to Isis” needs
to be activated. The template to use for navigation data is yxNEX and that for
telemetry are h89(w)0aV. Refer to section#5.2.2.1 for token definitions.
It is important to note that Isis needs to be informed that it should ignore the
course made good, derived using the changes in GPS positions. If it does not
then Isis will be receiving two types of sonar orientation data, one being from
the KVH Gyro on the workboat and the second from the course made good.
These two forms of data will be recorded by Isis and in post-processing it may
appear as though the sonar was yawing badly. This can be seen by the value of
Gyro in the Ship window of the Parameter window oscillating between two
values, one being the course made good and the other being the orientation of
the platform. To stop this from happening the X token is needed in the
navigation template and not a G.
Deactivate the following radio buttons:
•
•
•
Bathymetry-Parallel connection. This button should be deactivated because the
Klein 5500 did not have the ability to simultaneously collect sidescan sonar data
and bathymetry data. Only the Klein 5400 and maybe the Klein 5800 could
have been purchased with this ability. An acquisition computer requires the
parallel
board
DT3010
(http://www.datx.com/dahwdetail.asp?Family=DT3010+Series), which is
made by Data Translations (http://www.datx.com/), to be able to receive
interferometric bathymetry data from the Klein 5400 or Klein 5800. Only
several Klein 5000 sidescan sonars exist for which activating the radio button
Bathymetry-Parallel would result in bathymetry data being collected (personnel
communication Geoff Shipton, TEI).
“Also store every Nth ping of raw I/Q”
if the sonar Standby button is activated then deactivate it. When activated this
simply stops the server kln5000.exe accepting data from the controller program.
The controller program ss.exe will be outlined in the next section.
The last setting which needs to be made is to enter the correct depth formula in the
area labelled “compute depth from voltage”. This formula in the Klein5000 server
dialogue box controls the Depth value in the Telemetry component of the Parameter
display window and arises because there is a pressure sensor inside the Klein 5500
sidescan sonar. If the pressure sensor has been recalibrated (see Appendix C for the
procedure), then enter the new coefficients calculated, otherwise use the values
calculated from the last calibration. These were:
Voltage * 13.730 -10.370 = Depth.
74
DSTO-GD-0372
During data acquisition the fields for Sidescan, Roll, Yaw and Echo Chan 1 in the
“Received from Sonar” area of the kln5000.exe dialogue box will be increasing, as will
the Trigger commands to the sonar. The number of beams the Klein 5500 is using at
any time will be displayed in the “Beams to Display” area of the dialogue box. The
number of beams will be determined by the speed of the sonar and will be between 1
and 5, the last occurring at 10 knots and the first at 1 knot.
The k5000.exe control program needs two dynamic link library files for it to function
correctly with the Klein5000 series of sonar and these are not normally installed with a
Windows installation. These files are OLDAAPI.DLL and OLMEM.DLL. The version
of these libraries is different under Win95/98 and WinNT/Win2000, although the
correct version of these files should be installed when Isis is installed. If these files are
not present then contact Klein Associates for them.
5.2.6.2 Klein 5000 System Control (ss.exe)
Up to this point, there have been no avenues by which the waveform generated by the
Klein 5500 could be changed from within Isis. Even the Sidescan Sonar Information
dialogue box (Figure 51) could not be used to alter the settings of the sonar, although
an operator could have mistaken it to do this. The only piece of software that enables
the settings of the Klein 5500 to be changed when Isis is running is the Klein 5000
system control dialogue box. This dialogue box is really three condensed into one, as
illustrated in Figure 58, and was created by Klein Associates Inc. and not TEI.
Figure 58 The three dialogue boxes of the controller software program ss.exe and how the last
two are spawned.
75
DSTO-GD-0372
At DSTO the system control dialogue box is mostly used to perform the functions:
•
•
•
Play or and stop playing sonar data from the Klein 5500 using the start and stop
and
respectively. Although these two buttons control
buttons,
whether or not sonar data is displayed in a waterfall display, they do not
influence whether or not the data is saved to disk. How Isis is set up so it saves
data to disk will be outlined in the following section.
change the slant range
change the pulse length (or waveform being used). This means changing the
pulse length of the chirp being output by the sonar. The values which
correspond to those outlined in the dialogue box are: 0 for the 50 microsecond
pulse length, 1 for the 100 microsecond pulse length, 2 for the 200 microsecond
pulse length, and 3 is a 200 microsecond pulse length two tone hop.
The waveform that the TPU will request the sonar to produce is determined by
the variable “set WAVEFORM” in the file startup.ini. The variables the file
startup.ini can set, so they do not need to be set from within the acquisition
programs, are outlined in Appendix B.
The system control dialogue box can also be used to perform the functions.
•
•
•
•
•
•
Select resolution.
Activate or deactivate the despeckle filter.
Enter sound velocity in the water column (Note that the units are cm/sec and
not meters/sec).
Responder division is the output frequency rate compared to the sidescan sonar
ping rate. This should be set to off as no responder is used with the Klein 5500
at DSTO.
Responder frequency. This is irrelevant. See responder division for details.
Manually enter the speed of the sonar. This would be needed if a GPS unit was
not available and appropriate if the speed of the sonar was relatively constant
and known.
The System 5000 Control dialogue box has the strange behaviour that to remove it at
the end of an Isis session an operator needs to click on it and instead of clicking the
close window cross hairs, the escape key needs to be used. Operators often forget this
peculiar feature. If an operator tries to close this window using the close window
function with the right mouse button or the close window cross hairs in the top right
hand corner this dialogue box will not respond and will be even harder to remove
using the escape key!
If the program ss.exe stops receiving sonar data then any error message will be
spawned stating, “DoPing event error”. It is important to understand that this
message is generated by the Klein 5000 system control program ss.exe and not the
Klein 5000 Isis server kln5000.exe. A likely reason why the program ss.exe stops
76
DSTO-GD-0372
receiving sidescan sonar data is because the TPU has crashed, and although the
architecture of the TPU is designed to be very stable, crashes have been observed after
a few hours of continuous operation. If the TPU has not crashed (indicated by the vme
indicator light on the digital signal processor board still flickering) then data is not
being received by the acquisition computer. The remedy is to check LAN cable
connections.
5.2.7 Displaying/Saving Data in Isis
After the sonar has been selected, the serial ports over which auxiliary data is being
sent have been chosen and configured, and the data format chosen, by using File->
Record Setup…, Isis is ready to record data. By clicking on the OK button in the
Record Mode Setup window (Figure 48) this window will disappear and the Start
Recording button under the File menu will become active. Click on File-> Start
Recording and a window will be displayed asking whether data will be displayed only
or whether data will be displayed and also written to disk. If the button Display only
is clicked then this window disappears and the dialogue window for the Klein 5000
controller software should be spawned at the bottom of the screen (if it does not
appear, then locate program ss.exe and double click on it). If the button Record Data is
clicked then prior to the Klein 5000 controller dialogue box being spawned Isis requests
a filename to be specified. When this is entered then data can start to be displayed, and
if requested, saved to disk, by clicking on the play button
in the system 5000
control dialogue box. When this is performed the indicator beneath the play button
should change from grey to green and that beneath the stop button
will change
from green to grey. At this stage the waterfall display should be displaying sidescan
sonar data for the port and starboard side.
Only the Klein 5000 System control dialogue box should be used to start and stop
acquiring data and not the record
or stop button
in the Isis tool bar. If
these buttons are used to acquire and stop acquiring data from the Klein 5500 instead
of their corresponding buttons on the system dialogue box then the stability of Isis as
well as the system control dialogue box cannot be guaranteed.
5.2.8 Optional Settings
All of the above settings are settings which need to be made to Isis before it can be used
to collect meaningful data from the Klein 5500 sidescan sonar. There are however
settings which are optional. Some of these aid the collection of data, whilst others
relate to sonar deployment. The optional settings that have been used at DSTO and
deemed helpful are outlined below.
77
DSTO-GD-0372
5.2.8.1 Bow-mounted Sonar Depth
As the depth of a sonar when it is bowmounted or hull mounted does not change then
it can be beneficial to instruct Isis to ignore the sonar depth indicated by the pressure
sensor and to use a known value. To do this in Isis,
click on the Configure menu and select “Transducer
Depth…”. This will make the Transducer Depth
window be spawned (see Figure 59) and it is here that
the depth of the sonar needs to be entered. As
outlined in section 2.3.2.2, the depth of the Klein 5500
below the water surface when it was bowmounted to
the DSTO workboat “440” was 0.95meters. When the
correct depth has been entered into the Transducer
Depth window and the OK button clicked, a test that
the value has been entered correctly as it should
appear in the Depth field of the Parameter display
window.
Figure 59 The Transducer Depth window in Isis.
5.2.8.2 Layback Setting
Whether a sonar is being towed behind a ship or mounted to its hull, there is a strong
likelihood that there will be a finite distance between the location of the GPS antenna
on the boat and the location of the sonar. As it is very important for a sidescan sonar
or a multibeam echosounder to be able to accurately specify the location of any objects
it ensonifies, then there is a real need to account for this distance.
In Isis, provision is made to specify the position of the fairlead relative to the GPS
antenna and to also calculate the layback of the sonar relative to the fairlead. Isis will
take into account Layback only when data is being acquired. Isis cannot be used to
alter incorrect layback values in data files already collected.
Although there is a provision in Isis to take into account the displacement of a sonar
from the GPS antenna and this approach can be used with bowmounted sonars by
using negative laybacks, TEI does not recommend this approach. They recommend the
GPS equipment be set up to output position at the bowmount location and not where
the antenna is located. Refer to the GPS manuals on how to set up the GPS equipment
this way.
To set up Isis so it calculates the layback of the sonar from a fairlead as well as
accounting for the position of a fairlead from the GPS antenna, click on View|Layback.
This will make the Layback Correction dialogue box be spawned (see Figure 60). In
this window there are two options for specifying the location of the sonar. Either a
responder is placed on the sonar and a pinger is attached to the boat and Isis is
78
DSTO-GD-0372
informed via NMEA strings where the sonar is preciously. This approach is very
accurate, although it has been rarely applied successfully at DSTO. It is believed this
limited success was due to the turbulence (low signal-to-noise ratio) of the survey
vessel. Another drawback of this approach is that it increases the complexity of a
survey. To implement this option, the radio button “Apply Delta X,Y (usually from
Trackpoint)” (http://www.ore.com/trackpoint.htm) needs to be chosen.
The second approach is slightly less accurate but has the advantage of being much
easier to implement. This approach uses layback to determine the location of the sonar
and has the distinction from the first approach in that the underlying assumption is
made that the sonar is following the track of the boat. The layback is either calculated
externally to Isis or Isis calculates it using cable-out values. To get Isis to implement
this approach choose the radio button Apply Layback. At DSTO this is the method
that has been used exclusively with the Klein 5500 sonar and will now be explained in
detail.
When the radio button Apply Layback has been
chosen three options are available. Two of these
are used at DSTO. The three options will be
explained below:
Use Logged layback value. This is the default
choice when the radio button Apply Layback is
chosen and has been used at DSTO in conjunction
with the cable-out and angle measuring device
OSCAD. If this option is used, then Isis will need
to be setup so it knows that layback data is being
routed to the acquisition computer on a specific
serial port (see section 5.2.2).
The option Enter Layback Manually, has not been
used at DSTO because it would involve using the
depth of the sonar in conjunction with the cableout to calculate the layback and then enter this
value into the Layback text window in the
dialogue box. This option would be too time
consuming because of the need to keep on recalculating the layback each time the depth of the
sonar changed.
Figure 60 The Layback Correction dialogue box in Isis.
79
DSTO-GD-0372
The third and final option, “Calculate Layback from Cable Out”, has been used at
DSTO by measuring the cable-out and obtaining the depth of the sonar from the built
in pressure transducer. To set up this dialogue box for use with the Klein 5500
sidescan sonar when it is being towed follow the instructions below:
•
•
•
•
•
•
•
•
Click Apply Layback
Click Compute layback from Cable out. This will make the check boxes for
Cable Out and Depth be enabled.
Click on the Cable Out check box and enter in the cable out.
As the Klein 5500 sonar has a built in pressure sensor, then the Depth window
should already display the depth of the sonar. As outlined in section 5.2.6, the
template token to instruct Isis that sonar depth values should be used is zero
(0).
Enter the Height of towpoint. This is the height of the rollers on the fairlead.
As deduced from sections 2.3.2.1 and 2.3.2.2, this is 1.34meters.
Enter the offset, which is the location of the last roller of the fairlead relative to
the GPS antenna location. This was also outlined in section 2.3.2.1 and is
4.38meters.
Now click the Apply button, and using the most recent cable-out and depth
values, the layback of the sonar should appear in the Current Value window.
Although there is a chance that the cable-out value will not change for at least
several minutes, the depth however, can change, almost exclusively because the
speed and pitch of the vessel will change. To account for changing sonar
depths and cable-out values, now click on Compute Automatically. This will
instruct Isis to account for any changes in sonar depth and cable-out values.
When any one of these values changes Isis will re-compute the layback.
Note, as it is physically impossible for the cable-out values to be less than the
depth of the sonar then Isis will spawn an error message if cable-out values are
entered with these attributes.
Whether the location of the sonar is being estimated by entering the layback
manually or by it being calculated in Isis using pressure and cable-out values,
once the Apply button has been clicked then the layback value will be used in
all further data acquisition. It can be a good idea to leave the Layback
Correction dialogue box spawned whilst data is being acquired, as it acts as a
reminder of what the layback value is. If sonar data is stopped from being
written then unfortunately the layback setup will be lost and will have to be reentered.
5.2.8.3 Sonar Altitude Alarm
When sidescan sonars are being towed relatively close to the bottom (for example
within several meters) then when the bottom shallows quickly it can happen that the
sonar gets very close to the bottom and there is a chance that it will hit it. Although an
80
DSTO-GD-0372
operator can easily see in the waterfall display when the altitude of a sonar is becoming
dangerously low, it can still be beneficial to setup Isis so an audible alarm is produced.
To set Isis up this way click on Configure|Audible Alarm|Shallow Alarm and the
Shallow Alarm window will be spawned (see Figure 61). To have Isis monitor the
altitude of a sonar click on the radio button Shallow Alarm On and use the slide bar to
select the minimum altitude below which Isis will generate an audible warning.
Obviously this alarm would only be beneficial on acquisition computers that have a
sound card and speakers.
Figure 61 The Shallow Alarm configuration window in Isis.
5.2.8.4 Coverage Map
When a survey is being conducted or several tests in the one location (like latency
testing) it can be very helpful to be able to see the sonar track and the coverage that has
been acquired. This is because coverage maps show where gaps in the data coverage
exist whilst for such tests as latency testing they enable the boat driver to repeat
particular tracks.
Isis has the ability to construct maps showing the track of a sonar and if instructed to
also show the coverage. This can be accomplished whether data is being recorded or
when old data is being played back. The ability of Isis to play data back will be
outlined in section 8.2.1. It should be emphasised that for sidescan sonars it is the slant
range which is being shown in a coverage map and not ground range.
To set up Isis so it displays a coverage map when data is either being recorded or
played back, click on Tools|Coverage Map and Mosiac… This will cause the “coverage
map and mosaic” window to be spawned (see Figure 62) and here click on the
“coverage map only” radio button and then OK. Then a coverage map will be
81
DSTO-GD-0372
immediately displayed (see Figure 63), the location of which may be to the right of the
main window, and partially off the screen, if only one monitor is being used.
What is shown in a coverage map is the track of a sonar using the course made good
data, with the coverage display generated using the slant range and the orientation of
the sonar. The location of a sonar in the coverage map window will only change when
a new position has been received from the TPU during record mode or when a new
position has been read from a data file during playback mode. The coverage map is set
up so that the colour of the sonar track will change in a round-robin fashion when
either a new filename is used or when a new data file is played back. The colour used
and in what order are: red, green, yellow, blue, magenta, cyan, white, dim red, dim
green, brown, dim blue, dim magenta, dim cyan, gray, pale green and pale blue.
Figure 62 The Coverage Map configuration window in Isis.
Figure 63 An example of a coverage map window in Isis. Note the menus at the top of the
window.
82
DSTO-GD-0372
When the coverage map window is spawned the sonar track and coverage should be
displayed by default, however there are some additional settings that are not default
but which can be helpful. The settings which were often used at DSTO are outlined in
the table below:
Table 6 Setup parameters for the Navigation Window in Isis.
Show|Trackline|Coverage
(default)/Without Coverage
Show|Grid
Nav|Co-ordinate display
Nav|Lock coverage map
Zoom|Zoom in (shotcut +)
Zoom|Zoom out (shortcut -)
Zoom|Best Fit (shortcut *)
Isis will by default show the coverage of a sonar, and
this setting lets the coverage be toggled on or off. It can
be helpful to remove the coverage when the tracks are
close and cannot be distinguished from overlapping
coverages.
This lets a grid be placed over the coverage map with
the options being, off and no grid lines shown or
showing grid lines spaced at intervals of 100m, 500m,
1km, 5km or 20km.
Lets an operator cho0se between either latitude and
longitude or northing and eastings for the grid display.
This prevents new position data being added to the
coverage map. This command could be helpful when a
boat deviates away from a planned survey line and
although data collection would be halted, unless this
command is used, the coverage will continue to be
updated by bad data.
Zooms in on the current position of the sonar. The
shortcut for this operation is the plus (+) sign.
Zooms out.
This places the current location of the sonar in the
centre of the window and either zooms in or out so all
the coverage fits into the current window. The short
cut is the asterisk key (*).
It is also possible to zoom in on any part of the
coverage map window using the right mouse button to
highlight a particular area and then releasing it. Upon
release the coverage map will be redrawn centred on
the selected area with the boundaries of the selected
area being remapped to the edges of the coverage map
window.
File|Save coverage points
File|Load coverage points
This enables the current coverage points to be saved to
a file. Of the three formats available the one that has
been used at DSTO is ASCII text.
When a survey is being conducted over more than one
day it can be helpful to see how the current day’s data
collection coverage map compares to any of the
83
DSTO-GD-0372
File|New Coverage
File|Save as tiff
Pan|Left/Right/Up/Down
previous days. This can be accomplished by using this
command to load the coverage map from a previous
day and then beginning surveying.
Remove any track and coverage maps currently being
displayed and display a new coverage map.
Enables the current display of the coverage map to be
saved as a tiff file.
Enables the arrow keys to be used to move the display
in the direction chosen.
5.2.8.5 Sound Velocity
If an accurate sound velocity reading has been made during a survey in an area where
it is approximately homogeneous in the vertical and horizontal then Isis can be
instructed to use this value rather than a default value. This enables Isis to make more
accurate slant range calculations; if the sound speed Isis uses is lower than what it
really is then any objects will appear closer than what they really are and if the sound
speed Isis uses is higher than what is really is then objects appear further away than
what they really are. The default sound speed value Isis uses is 1500m/s unless it has
been altered in a previous Isis session and the setup of such a session was saved.
To alter the sound speed value which Isis uses during data collection or during data
playback, click on Configure|Sound Velocity… and the sound speed dialogue box will
be spawned. Here enter the value measured. If data is being collected then this value
will be used and stored in the data files. If data is being played back then this value
will be used instead of that used during acquisition. In this last scenario the waterfall
display will take on a more realistic look than what would have appeared during data
collection, however such changes are only cosmetic with the original data file, in
particular the sound velocity used during data collection, not being altered.
5.2.8.6 Save setup
When Isis starts up it interrogates the configuration file isis.cfg and sets up the current
session using the information contained in it. As it is often necessary to setup Isis the
same way each time it is used, for example, to use the same sonar using the same data
format and the same serial ports, then it can be helpful to save the setup from one Isis
session so it can be used on later occasions.
The way Isis has been set up during a session can be saved to the configuration file
isis.cfg either during a session or upon the closing of a session (which occurs by exiting
Isis). The setup settings which are saved to this file are all those made using the main
menus. Settings made by clicking the right mouse button in any of the windows in Isis
(for example the waterfall display, the voltage window, the coverage map) are
normally not saved: they are lost when the respective windows are closed.
84
DSTO-GD-0372
To set up Isis so it automatically requests the setup to be saved or it prompts an
operator to save the current setup, click on Configure|Save Setup…This will make the
save setup dialogue box be spawned. Here the options are:
•
•
•
Save straight away by clicking on Save Now button.
Save setup automatically upon exiting Isis by clicking the corresponding radio
button.
Request operator to save setup upon exit of Isis by clicking the corresponding
radio button.
Note: even if the setup of the previous Isis session was saved and is identical to the
setup that is needed for the current session, it is still wise to quickly check that the
settings in the dialogue boxes, Sonar Information, Serial Port Setup, File Format and
Klein 5000 Server, are as required.
Also note that when the isis.cfg file is read only, so the current setup cannot be written
to it, Isis will not generate an error message indicating this. Hence, it is vital to check
that the file isis.cfg is not read-only.
5.2.9 Isis Window Configuration
When Isis is spawned a few basic windows are shown and there will be others which
some operators may require but which are not visible. Those windows which should
be visible upon Isis booting up are the following:
•
•
•
•
Isis server window for Klein5000
Signal (Voltage) window
Waterfall window
Parameter display window
The Isis server display window for the Klein 5000 series of sonar has already been
outlined in section 5.2.3 and its characteristics will not be repeated here. The voltage
signal window is easily configured by clicking on the right mouse button when the
cursor is placed over them. The dialogue box that is spawned when this action is
performed on the waterfall window has a slide bar that allows the level of threshold
(or contrast) to be adjusted. This changes the lightness or darkness of the displayed
data. Speed and Slant Range correction can also be applied to the data display using
this dialogue box, however these do not affect what is recorded.
The parameter display window is an important window critical to the collection of
good sidescan sonar data. As some data fields in the parameter display window
maybe unknown to a new operator as well as some of the buttons which appear in this
window then it was deemed helpful if the attributes of this window were explained.
The parameter display window will be outlined in the following section. Figure 64
shows a picture of the Parameter display window.
85
DSTO-GD-0372
Figure 64 The parameter display window in Isis.
5.2.9.1 Parameter display window
This window is displayed as soon as Isis is started and like many sidescan sonar and
multibeam echosounder acquisition software packages appears below the Waterfall
window.
The parameter display window displays information which has been
extracted from the data that is coming in to Isis and is a very useful tool for checking
that the data being acquired is what would normally be expected. If Isis has not been
correctly set up, the correct data may not be recorded, and one way to detect this is to
analyse some of the data fields in parameter display window. The parameter display
window is made up of several panels. The data displayed in each of these panels and
any settings that can be made will be discussed in the following sections.
5.2.9.1.1 Navigation
The first panel is Navigation, and displays the latest, sonar position, ship speed, and
ship heading. If the recommendation from Klein is followed that GPS data is routed to
the TPU and not the acquisition computer, then the latest position is extracted from
data coming from the TPU, whilst the ship speed and gyro are obtained from the gyro
(interfaced to the GPS), which is routed directly to the acquisition computer. It is
important to check that these reflect what is actually occurring. There are a few ways
to perform this, each dependent upon whether the boat is moored (prior to departure)
or underway. For example when the boat is moored
•
•
•
Compare the gyro data in the parameter display window and check it
compares closely with that of the wharf. The orientation of wharf17 at Pyrmont
is 39.7 degrees from true north, with the boat normally being between 31 and 38
degrees true. One easy way of determining the orientation of a wharf is to use
the chord function in the post-processing sidescan sonar software Sonarview
See Young and Anstee( 1999) for a detailed account of this package.
Check the ship’s speed indicates zero or 0.1 knots.
Check that the position data in the navigation panel compares with that
displayed in the Leica display and also that they both are not changing very
much.
When the boat is acquiring data the following comparisons should reveal any major
errors in the collection of data:
86
DSTO-GD-0372
•
•
The orientation of the boat should be close to the course made good (which is
derived using changes in position). The course made good and the orientation
of the boat should be within approximately 5 degrees, but this will depend on
the obliqueness and strength of any ocean currents. The course made good is
displayed in the bottom left hand corner of the Leica GPS unit and can have a
filter applied to it of between 2 and 10 seconds. The term crabbing is
sometimes applied when an oblique current is causing a boat to move in a
direction that is different from the boats orientation.
Check the ship speed compares closely to the speed over ground (SOG) data
field in the Leica display. A small time lag between these two values may be
noticed and should be expected. This is because it takes a finite time for the
SOG data from the GPS Leica unit to be meshed in with the sonar data by the
TPU and for this data to then be sent and displayed by Isis.
The format of the sonar position depends upon the type of position information Isis is
receiving. If the position data is in latitude and longitude then this data can be
displayed in the three formats of decimal degrees, or degrees:decimal minutes or
degrees:minutes:seconds, using the small tab key in the top right hand corner of the
Navigation panel. If the position data is in northings and eastings then such data is
displayed in this format in metres from an origin, with the small tab key in the top
right hand corner of the Navigation panel having no affect this case.
If ship speed is zero in the navigation panel it is likely to be caused by the gyro only
being set up to output HDG NMEA0183 strings and not VTG strings.
5.2.9.1.2 Telemetry
The next panel displays the telemetry information coming from the sensors on the
towfish. Pitch, roll, heading (or yaw), speed, depth and altitude are all displayed.
The heading displayed here will often not be very good, as the sensor is a magnetic
compass that is often not well calibrated. Instructions for calibrating it should be
available from Klein Associates. The uncalibrated data should not be used.
The Depth field displays the depth as recorded by the sensor on the towfish. This is
not the water depth, but the depth of the towfish below the water surface. The Klein
5500 operated by DSTO has a pressure depth sensor, and calibration values for this can
be calculated and applied to give a sufficiently accurate depth value. Calibration
values are entered in the “Isis Server for Klein 5000” window (section 5.2.6.1).
It can be seen in Figure 64 that there is an arrow tab pointing upwards ( ) located to
the left of the data fields Heading, Depth and Altitude. When this arrow tab is clicked
next to any one of these three data fields a window is spawned showing these values
much larger than they appear in the Parameter display window and these new
87
DSTO-GD-0372
windows can be placed anywhere on the screen. These windows can be helpful when
any one of these three data fields needs to be carefully monitored and those values
displayed in the parameter display window are a bit small to read often. This can be
particularly helpful for altitude.
5.2.9.1.3 Range Scale
The Range Scale is the ground range that is being achieved for a sonar and is calculated
using the slant range that is being implemented in conjunction with the altitude of the
sonar.
5.2.9.1.4 Display Units
The units that are used to display the length calculations in the Parameter display
window, are controlled by the Display Unit panel. The options available are metres,
feet or milliseconds. At DSTO metres was used exclusively.
5.2.9.1.5 Cursor Data
When sonar data is being collected or played back, it may be helpful to know the
location of a point in the waterfall display or what the attributes of the sonar were
when a particular echo was received. In Isis it is possible to display this information by
placing the cursor over the location of interest in the waterfall display and clicking the
left mouse button. The location of the point of interest using the format in the
Navigation panel, as well as the attributes of the sonar when the data was collected, are
immediately displayed in the Cursor Panel of the Parameter display window. The
location of the cursor is shown as well as the sonar attributes, depth, altitude, channel,
heading, ping number, slant range, and the time the echo was received. If this data is
important then the Log button can be clicked and this will make Isis save this
information to the ASCII file cursor.log. Once data is copied to the cursor.log the Log
button will dim. If data in the cursor.log file needs to be retrieved then this is possible
using any text editor (such a Notepad).
In the past, Isis has been solely used to acquire sidescan sonar data. However, the Log
button in the Cursor Data panel can greatly reduce the post-processing task of
identifying the location of any suspicious objects. In the past this process has been
performed shortly after the data has been collected, however this means that the data is
being viewed twice, first when it is collected and then a second time when it is
reviewed.
The Log button enables the locations of any objects that would normally be determined
in post-processing to be written to the Log file when the data is being acquired. Then
when a proper post-processing package is used to locate any suspicious objects the
locations of those already detected can be read off the cursor.log file, greatly reducing
the time it would take an operator to scan through the files on a second pass. In the
88
DSTO-GD-0372
past this functionality of the Log button has not been utilised but should be kept in
mind.
5.2.9.1.6 Current (Data) File
The Current File panel displays information about the data file being acquired or
played back. If sonar data is being acquired then an important button is the Switch
Now button. This button controls the writing of data to files by Isis so that data is not
lost when one file is closed and another begins being written to. When it is clicked on
the Switch File dialogue window is displayed (see Figure 65) and it is here Isis is setup
so that one of two scenarios occurs. These are:
•
To synchronise the change in media on which sonar data is being saved. This
would be needed when a medium becomes full, like a magnetic optical disk,
and data needs to be saved to another medium.
To set up Isis so this occurs, first type in the box “Record data to filename” the
filename (without the extension) of the new file and then click on the radio
button “Remaining storage less than 0.5% then ping-pong between the drives X:
and Y:”, where X is the drive that is getting full and Y is the drive data will start
being written to. Click on Switch Now and Isis will be instructed to perform
these functions when the change criterion is valid. The dialogue box, however,
will not disappear when the Switch Now button is clicked.
•
The switch command is also needed when a sonar data file being written is
getting large (normally 200 megabytes) and a new file needs to be created
without any data being lost.
To set up Isis so this occurs, first type in the box “Record data to filename” the
filename of the new file (without the extension) and then click on the radio
button “File grows larger than X MB”, where X is the size of the data files
required. Then, when the current file Isis is writing becomes larger than X
megabytes, Isis will create the new file using the filename entered.
It is unwise to allow sonar data files to become too large, as if they get
corrupted then it is likely that all the data in the file cannot be accessed. The
nominal file size often at DSTO was 200 megabytes.
89
DSTO-GD-0372
Figure 65 The switch file dialogue box.
The Note panel at the bottom of the Parameter display allows you to make a note
during a recording session. The note will be recorded in the data file at the point that it
is written, and reappear in the Note panel at the same position during replay.
5.3 SonarPro Setup
5.3.1 Introduction
SonarPro (SP) was written by Klein Associates Inc. and first released in 2000. It was
given to DSTO free of charge when the sidescan sonar and TPU were fixed in August
2001 and to date, all updates have been free. SP version 5.0, 5.3 and 6.2 were
downloaded from http://www.kleinsonar.com/tech/download.html.
Compared with Isis, SP is a user-friendly sidescan sonar data acquisition program. It is
easy to learn, easy to set up and has the large advantage over Isis that is specifically
designed for two Klein sidescan sonars, one being the Klein 5500. Also in comparison
to Isis, SP has the ability to mark the location of targets in the coverage map during
data collection. This can save a lot of time in post-processing. SP also has the ability to
set up survey lines on top of nautical charts and import measured, cable-out values.
5.3.2 Getting Started
Many of the settings in SP rarely need altering and once they have been set for the first
time they do not need to be reset for each survey.
To collect sidescan data using SP, the operator first needs to click on the towfish icon
. This will cause the TPU Connection dialogue box to be spawned (see Figure 66a).
Here the operator must chose the IP address of the TPU and whether or not the PC
connecting to the TPU will be the master or will connect to the TPU as a slave. Then
90
DSTO-GD-0372
the operator must click on the “Change the Sonar Channel Configuration” widget.
Once the operator has done this the “Channel and Sensor Configuration” dialogue box
will be spawned. Figure 66b shows this dialogue box in detail. As the Klein 5500
towfish does not have any way of tracking bathymetry and does not have the sub
Bottom profiler option added, then the only boxes which should be ticked are the Echo
1 (to receive the first echo) and Sensors yaw and roll (as the towfish does have sensors
meauring these quantities. Then click “OK” and the Survey Wizard dialogue box will
be spawned. The Survey Wizard was set up to guide the operator through setting up
parameters for maintaining an orderly survey data file structure. It has been observed
that the Survey Wizard is superfluous and is not needed. So when the dialogue box for
the Survey Wizard is spawned click on Cancel. At this stage SonarPro is ready to
display incoming data from the TPU.
(a)
(b)
Figure 66 (a) The TPU Connection dialogue box and (b) the Channel and Sensor Configuration
box, which is spawned when the “Change the Sonar Channel Configuration” button
is selected in the TPU Connection dialogue box.
At this stage SP will have spawned the Scan Window (which shows the voltage returns
from the port and starboard side of the towfish), the Navigation Window, the Sensor
Window and the Waterfall Display Window. Although other settings can be made to
SP, data can now be displayed in the waterfall display by clicking on the play button
.
91
DSTO-GD-0372
5.3.3
Alarms
In SP the operator can set numerous thresholds which if passed or tripped will invoke
visual alarms. These alarms pertain to towfish roll and altitude and the Ping Lag of the
acquisition computer. Ping Lag is the number of pings which are backing up in
memory before they are displayed in the waterfall display. For computers with a lot of
RAM (for example half a gigabyte) there is likely to be only a few unprocessed pings
but this can increase to several hundred when only 128 or 256 megabytes of RAM is
used. When the ping lag goes above 200 then there is the possibility of incoming ping
data being lost and the operator should try and close unneeded windows in SP or in
Windows.
To set the towfish roll and altitude alarm thresholds, right click in the altitude or roll
status windows in the Information Window. Figure 67 shows where these two status
windows are located in the Information Window. In doing this their respective
dialogue boxes will be spawned and the user simply needs to enter in the threshold
values and if wanted the user can check the audio alarm box. If at any time during
data capture the altitude or roll of the towfish exceed the threshold values, the
background of the altitude display will change from green to red and for the roll status
window the background will change from its normal grey to red as well.
(a)
(b)
(c)
Figure 67 (a) The Information Window which is displayed in SonarPro and the dialogue boxes
that are spawned when the altimeter (b) and roll (c) status boxes are right-clicked.
92
DSTO-GD-0372
To set the ping lag threshold, right-click in the lag status box, which is located on the
right side of the main window. Figure 68a shows the location of the Lag status box on
the right-hand side of the Information Window. When the operator right-clicks in the
status box the Ping Lag dialogue window is spawned (see Figure 68b). Here the
operator can alter the Lag Threshold and the time interval the computer waits before it
checks the threshold value.
(a)
(b)
Figure 68 (a) The top portions of the main window, in particular showing the Lag status
window on the right-hand side (circled in yellow). (b) The Ping Lag dialogue box.
5.3.4 Layback
If the operator wishes to know the position of targets, then the location of the towfish
needs to be calculated by SonarPro. If the towfish is being bow-mounted then its
position relative to the GPS antenna is relatively easy to measure using a measuring
tape. If the towfish is being towed however, SonarPro, like many acquisition programs
of this nature, will use the pythagorean theorem together with the cable-out values,
towfish depth and fairlead (or shieve) position relative to the GPS antenna, to estimate
the horizontal distance the towfish is from the GPS antenna. Such a distance is termed
Layback.
In SonarPro, the Layback icon (
) will only be highlighted if the data format is set
to 5kd and not sdf. The data format which SonarPro (as well as ISIS) expects to come
from the TPU, is set using the variable Set Oldheader in the startup.ini file; This file,
the reader may recall, is downloaded using the file transfer protocol (ftp) from the
Master computer by the TPU during bootup. When the variable Set Oldheader is set to
zero (0) SonarPro expects the sdf format and when this variable is set to 1 the 5kd
format is used.
If the data format sdf is used then the layback icon in SonarPro will be dimmed and
unusable.
93
DSTO-GD-0372
If the operator does need to know the location of any targets in the waterfall display
then the operator will need to provide SonarPro with the location of the fairlead, or
bow-mount, relative to the GPS antenna, the location of the GPS antenna above the
waterline, the amount of cable-out (measured from the fairlead), the cable type and
lastly the depressor type (if any). For the DSTO workboat the values of these variables
for a bowmounted and towed configurations are outlined in Table 7.
Table 7 The values that should be entered into the layback dialogue box of SonarPro for the
towed and bowmounted configurations. The conventions for X, Y and Z are
positive in the starboard direction, positive in the direction of the boat and positive
upwards, respectively.
Towfish Orientation →
Variable ↓
Towed
Bow-mounted
Cable-out
Shieve Offset X
Shieve Offset Y
Shieve Offset Z
GPS Height above water
Cable type
Depressor
Measured or calculated
0
0
0
7.8
-3.72
2.77
lightweight
none
2.77
0.5 inches armoured
Probably none
) before data collection and
To enter this information, click on the Layback icon (
the Layback dialogue box will be spawned. Figure 69 shows an example of this
dialogue box. Any adjustments made to this dialogue box will only take-effect when
the widget “Store Layback Parameters” has been clicked. This button sends the
information in the dialogue box to the TPU.
In the Layback dialogue box there are two parameters which a new operator may not
have much of a feel for; These are the Depressor Type and the Cable Type. At DSTO
the only depressor which is available is the small K-wing and it is very rarely used.
The operator is referred to section#2.3.4 for the different types of tow-cables used at
DSTO.
94
DSTO-GD-0372
Figure 69 The Layback dialogue box used in SonarPro.
The layback information in 5kd files cannot be changed in post-processing with the
in playback mode (see section 8.2.2). If the operator needs
layback icon dimmed
accurate position information (which is likely to be most of the time) then they will
need to accurately complete the layback dialogue box before the acquisition of any
data.
5.3.5 Towfish Yaw Estimation
In addition to entering the layback correctly, the method SonarPro uses to determine
the orientation (or yaw) of the towfish also needs to be entered, if position information
is to be accurate. Before version 6.2, the orientation of the towfish was determined
solely from the internal compass of the towfish. Unfortunately, this method is not
accurate when the towfish is bow-mounted as the steel present in the platform will
cause the towfish compass to be misaligned with the magnetic field of the earth.
With SonarPro version 6.2, the operator has the choice between using the internal
compass of the towfish or the course made good4, for ascertaining the orientation of the
towfish. To alternate between these two methods the operator needs to click on the
and then the Compass Preferences tab in the SonarPro User
user preference icon
Preferences dialogue box. Figure 70 shows this dialogue box in detail. Then the
operator can use the compass inside the towfish to determine the towfish orientation
by activating the “Use towfish heading in point calculations” preference, or can use the
The course made good is the orientation or bearing of the track mapped out by changes in the
location of the GPS antenna. This value is sometimes not the same as the output from the
internal towfish compass due to tidal currents causing the sonar platform to “crab”.
4
95
DSTO-GD-0372
course made good by activating the “Use ship heading in point calculations “
preference.
Figure 70 The SonarPro User Preferences dialogue box with the Compass Preferences activated.
This feature of SonarPro version 6.2 permitting the operator to alter how the towfish
heading is calculated has not been available in earlier versions of SonarPro and
unfortunately, as yet, SonarPro does not accept any input from a gyro.
5.3.6 Target Management
When data is being collected or played back (play back mode will be outlined in
section 8.2) the operator can double-click in the waterfall display to mark the location
of mines, mine-like objects or objects of significance. In doing so several things occur.
These are that: (1) a Target Window is spawned, (2) the target is logged into a database
and (3) a target mark (
) is placed in the Navigation Window. Of these three things it
is the last one that is the most beneficial. This is because with target locations being
marked during data collection (or “on the fly”) then this virtually eliminates the need
to methodically rescan the data files with SonarView looking for targets. It is simply a
case of going to those data files in which targets were observed, playing them in
SonarView and categorizing the targets for subsequent evaluation.
The Target Window spawned is a close up picture of the marked target. It displays the
location of the target and permits the operator to zoom in and out, pan and derive the
length, width and height of the target. If an operator wishes to delete a marked target
then he/she can do so by clicking on the delete button (
) in the top left-hand corner
of the Target Window. Lastly the data base of targets in SonarPro, although potentially
very helpful (and not available in ISIS) has not been used because SonarView has been
the main software package for marking and categorizing targets.
96
DSTO-GD-0372
Figure 71 An example of the Target window in SonarPro. In this example the Target window
is displaying the characteristics of an old chain located beneath the Sydney harbour
Bridge.
5.3.7
Survey Lines
As outlined earlier, SonarPro, unlike ISIS, does have the capability to construct survey
lines. These survey lines are plotted in the Navigation Window as a layer on top of
any nautical charts that are being used. When data is being collected the coverage area
of the sidescan sonar as well as the locations of the towfish are also plotted in the
Navigation Window. This ability of SonarPro to illustrate the towfish coverage, on top
of survey lines and nautical charts is a very helpful tool.
To set up survey lines in the Navigation Window, click on the survey route icon (
)
from the Main Window or the Navigation tool bar when sidescan sonar data is being
displayed or saved to disk. When this happens the Survey Route setup dialogue box is
spawned. Figure 72 shows this dialogue box.
97
DSTO-GD-0372
Figure 72 The survey route set up dialogue box used in SonarPro.
To set up survey lines, the operator needs to first establish the origin of the survey
route. This can be accomplished by typing it into the dialogue box, checking “Use
current trackpoint”, which will use the current location of the towfish, or by selecting
an origin using the mouse after clicking on the “Use Navigation window location”
icon. Then it is a matter of entering the survey line lengths, Line spacings, Maximum
Layback, Line Heading, Number of Lines and Cross Track Error. The only variables
that the operator may not understand or may have difficulty estimating is the Line
Heading, the Cross Track Error and the Line spacings.
•
98
The Line Heading is the angle between true north and the direction the lines
point, measured positively in the clockwise direction. As an example, if the Line
Heading is zero then the origin can be thought of as the bottom left hand corner
o
of a grid of survey lines and if the Line Heading is 180 then the origin will
represent the upper right hand corner of a group of survey lines. Figure 73
shows two examples of survey lines that have headings that differ by 180
degrees.
DSTO-GD-0372
•
(b)
(a)
o
o
Figure 73 Two examples of 5 survey lines created with line headings of (a) 45 and (b) 225 ,
respectively. In both examples the origin (as needs to be entered into the survey
route dialogue box) is at the waypoint #1, although because of the difference in line
heading this origin appears in opposite places of the survey grid.
•
•
•
The Cross Track Error is the maximum horizontal distance that the survey boat
can be from the survey line whilst maintaining the desired coverage.
The Line spacing, or horizontal distance between neighbouring survey lines, is
determined by the desired coverage. As survey lines would normally be
constructed for route survey work, and there is limited resolution beneath a
towfish (encompassing the nadir), then operators will normally employ 100%
coverage when using survey lines. This is because the low resolutions near the
nadir need to be circumvented using the outer ranges of an adjoining swath line.
As the operator is entering or adjusting the variables in the Survey Route set up
dialogue box, the corresponding survey lines should be displayed in the Navigational
Window. If at any time an operator wishes to turn off the survey lines then this can be
achieved by right-clicking in the Navigational window and then deselecting “Display
Survey Route” under the General Tab.
99
DSTO-GD-0372
5.3.8
Saving Data
Once the operator has set up SonarPro the way they require and sonar data is being
displayed in the waterfall display, then the operator can save the incoming data to file.
This is achieved by first clicking on the save icon
in the main toolbar and letting
the Sonar Data Recorder dialogue box will be spawned. In this dialogue box the
operator needs to specify where they want data files to be placed, the prefix to use in
naming the data files and how many minutes of incoming data are placed in each file.
At this stage the Sonar Data Recorder dialogue box can be used to start recording data
by clicking on the Record button in the upper left hand corner or this dialogue box can
be closed and data saved to disk by the operator clicking in the Recorder interface
status area
.
In either case, the background colour of the
recording status will change from red to green
when data is
being saved to media. The operator can stop recording at any time, by either clicking
on the Stop button in the Sonar Data Recorder dialogue (which is only available when
data is being saved) or by again clicking in the Recorder interface status area. Figure
74 shows two examples of the Sonar Data recorder dialogue box during set up and
whilst data is being saved to disk.
(a)
100
DSTO-GD-0372
(b)
Figure 74 The Sonar Data Recorder dialogue box (a) being set up for data capture and (b) whilst
data is being saved to disk.
It can be seen from Figure 74(b) that the extension of the data files is sdf (sonar data
format). This format is not the only format available in SonarPro; the other is 5kd (5000
data), with both formats originating from Klein and not determined anywhere in
SonarPro itself but in the startup.ini file. The variable in the startup.ini file that
determines the format of the data files is SET OLDHEADER with the sdf format being
used when this variable is set to 0 and the 5kd format used when this variable is set to
1. As the file startup.ini is downloaded only when the TPU boots up then if the
operator wishes to change between the formats sdf and 5kd then they will have to alter
the startup.ini file on the host PC and then reboot the TPU.
5.4 Master and Slave Setup
In all of the above setup configurations it was assumed that only one computer was
being connected to the TPU and that obviously this computer was the master (in terms
of controlling the TPU settings during data acquisition). But if an operator wishes to
have more than one computer accept data from the TPU then one will have to be the
Master and all the rest will have to be the Slave. Such a setup could be used to
compare the different styles of data acquisition of different software programs.
In Isis the operator controls whether the computer Isis is running on will be the Master
or Slave by using the Conf.exe (configure executable) file in the Isis directory. If the
operator double-clicks on this executable then they will see that this executable is
where the IP address of the TPU is set, whether the computer will be the Master or
Slave, and some other options. When the operator has made the necessary alterations
he/she should click on the “save and exit” button if they wish to save their changes,
otherwise the changes can be discarded by clicking on the “exit” button. Figure 75
shows the window that is spawned when the Conf.exe file is executed.
101
DSTO-GD-0372
Figure 75 The window that is spawned when the Isis file conf.exe is executed.
Sometimes when the operator makes changes to the settings in Figure 75 and the save
and exit button is clicked, the error message is spawned, ConfigFile::Save Data,
informing the operator that the changes cannot be saved. This error occurs because the
computer is trying to write the alterations to the read only file, sys5k.cfg. It is
unknown why this file is read only but the operator will need to remove the read only
attribute if they want to have their alterations implemented.
In addition to making alterations to the conf.exe file, if the operator follows the Klein
manual then when the Master and Slave computer tries to connect to the TPU there
will be an IP conflict. As the Master computer and TPU will need to have specific IP
addresses then the simplest way to circumvent the conflict is to alter the IP address of
the Slave computer. This is achieved by going to the control panel and altering the IP
address for the TCP/IP protocol to anything other than that for the TPU and the
master computer. In the author’s experience it is simplest to change the IP address
from 160.64.181.221 to 160.64.181.223.
Unlike Isis, which the operator must externally set up to make it the Slave, SonarPro
can be made the Slave from within the software, by using TPU Connection dialogue
box (Figure 66a).
The computer which is set up as the Master will have complete control over the
settings of the TPU, most importantly the slant range, the wave forms implemented,
the pulse length, resolution and mode of despeckle. When a change is made using the
master computer the changes will be replicated in any Slaves shortly afterwards. The
operator cannot make changes to the settings of the TPU from any Slave computers.
102
DSTO-GD-0372
6 Connecting TPU, Acquisition Computer and sonar
6.1 Introduction
This chapter will explain how to test that the TPU and the acquisition computer are
networked correctly. It will then go on to explain how to prepare the sonar for
deployment, test the connection from the sonar to the acquisition computer and then
explain how to deploy the sonar. It will be assumed that the setup procedures outlined
in Chapters#2,3 and 4 have been successfully implemented.
6.2 Connecting Acquisition Computer and TPU
6.2.1
Power
Make sure the TPU, acquisition computer and monitor, and any hubs you may be
using have power cables connected, plugged in and the power is on. Turn on any
navigation equipment (eg GPS, gyro) if it is not already and connect the TPU,
acquisition computer, and GPS and gyro serial cables, as outlined in chapter#2.
Switch the acquisition computer on. Remember that in with virtual resolution, the
display area is larger than the screen size. So if a window cannot be seen that should
be open, move the mouse to the edges of the screen. This will make other parts of the
virtual screen be displayed. See section 3.6.2 for details of how to set up a second
virtual screen.
Warning do not connect or disconnect the towcable to or from the TPU
while the TPU is on. Serious damage may occur to the sonar system
electronics and/or any operators of the sonar may be injured.
6.2.2
TPU Bootup
When the acquisition computer has been turned on and the operating system (either
Windows 95 or Windows 2000) has finished booting, turn the TPU on using the green
switch at the front of the TPU. Immediately the TPU should log onto the acquisition
computer and try to download, first its operating system file vxworks, and then the
initialisation file, startup.ini. This should take about a 25 seconds to conclude but it
may take up to 5 minutes, or not occur at all if the ftp server is not properly configured
(3.3). The operating system file vxworks is essential to the successful bootup of the
TPU whereas the TPU will still bootup successfully and be correctly networked to the
Klein 5500 sonar even if the initialisation file startup.ini is not downloaded.
There are several ways to determine whether the TPU has successfully downloaded
the file vxworks and booted up correctly. These will be outlined in the following
sections. The TPU will still boot correctly if the file startup.ini cannot be downloaded.
103
DSTO-GD-0372
6.2.2.1 TPU Evidence
If the TPU boots correctly then the lights labelled A,B,C and VME on the DSP (Digital
Signal Processor) printed circuit board will light up in one of two sequences depending
upon whether the sonar is connected to the TPU or not.
If the sonar is not connected to the TPU and just the LAN cable is connected to it then
when the TPU is switched on the following light sequence should be observed.
On the DSP board:
• A light first on and then off
• Then B will light and then go off
• Then C will light and lights A and B will flicker
On the Demultiplexer Board:
• Lock Loss light be off.
• Error light will light and stay on. This will be because the towcable is not
connected.
If the TPU boots successfully then
• all three DSP lights A, B, C will flicker.
• and the VME light will light and flicker at the towfish’s default ping rate.
If the sonar is connected to the TPU however, then when the TPU is swithed on the
following sequence should be observed:
On the DSP board
• Light A will light and go off
• Light B will light and go off
• Light C will light and go off
• All three lights will then light
Demultiplexer Board
• Lock Loss light will be off.
• Error light will be off.
If the TPU boots successfully then
• the VME light will also light and pulse at the towfish ping rate.
• Lights will A, B, C will almost be constantly lit.
• The error and lock loss lights should still be off.
6.2.2.2 Terminal Emulation Software
If a terminal emulation program is being run on a computer that was attached to the
com1 port on the front of the TPU using a serial cable, then the boot process should be
clearly evident and correspond to that shown in Figure 45.
104
DSTO-GD-0372
6.2.2.3 Evidence on the Acquisition PC
Although not as conclusive as observing the boot sequence on the terminal emulation,
there are two pieces of evidence that the TPU has received the files vxworks and
startup.ini. Obviously these pieces of evidence do not show that the TPU has booted,
only that the TPU has received these necessary files.
If Windows 95 is being used to acquire sonar data, then in the Servu FTP server four
lines should be displayed for each of the files vxworks and startup.ini, indicating that
the TPU has downloaded these files successfully. Figure 76 shows these four lines for
the file vxworks. Each of the lines tells us that one part of the process of the TPU
downloading these file has occurred successfully. An explanation for each of the four
lines appears in Table 8.
Figure 76 Evidence in Serv-U that the TPU had downloaded the file vxworks.
Table 8 An explanation of each of the four lines in the Servu display window
Statement
Explanation
“Connected to 160.64.181.222 (Local indicates that the TPU has logged into the Servu
address 160.64.181.221)”
FTP server on the local computer.
NOTE 1: There is sometimes an extra line after
this line saying “User SONAR logged in”,
which means that the login details for the TPU
are correct. This line seems to appear if the
login details are correct, but the required file(s)
cannot be found on the Isis computer.
“Sending file c:\klein\vxworks” shows that the TPU has located the requested
(or c:\klein\startup.ini)
file “vxworks” (or startup.ini) in the folder
“c:\klein” and has started downloading it.
NOTE 2: There are sometimes errors in the
transfer, with an error message displayed in
105
DSTO-GD-0372
ServU. There may be several attempts made at
file transfer. However, as long as the next line
“Sent file successfully” is displayed, error lines
can be ignored.
“Sent
file
c:klein\vxworks provides the baud data rate of the transfer and
successfully (889Kb/sec – 775426 confirmation that the transfer is complete.
bytes)” (or c:\klein\startup.ini)
“Closing connection for user indicates that the TPU has successfully
SONAR (Connected 00:00:01)”
downloaded the file vxworks and closed the
FTP connection, which was open for 1 second.
If these four lines do not appear in the ServU window for the given file, then that file
has not been sent correctly. Although the TPU will boot correctly and be usable with
the Klein 5500 sonar, if the file startup.ini is not downloaded, the TPU will not boot
without its operating system file vxworks.
If Windows 2000 is being used on the acquisition computer and the built in FTP server
is being used for the TPU to download its two files vxworks and startup.ini, then
unlike ServU, the Windows 2000 FTP server does not display whether the TPU has
successfully or unsuccessfully downloaded these two files. Hence although the
Windows 2000 FTP server has worked very well in the past, unlike ServU it does not
display any information regarding file transfers.
If the Windows 2000 FTP server is being used then although there is no evidence of the
server communicating to the TPU there is evidence that the TPU is logging into the
acquisition computer. The evidence is first the message “LAN plugged” following a
few seconds afterwards by the message “LAN unplugged”. These messages appear as
cartoon captions in the bottom right hand corner of the screen, just above the network
icon
. These messages correspond to when the TPU has logged into and out of the
Windows 2000 operating system.
If the above tests are successful then it can be safely assumed that the LAN between the
TPU and the acquisition computer has been set up correctly, that the TPU is locating its
operating system file vxworks, and that the TPU has no hardware malfunctions and is
booting correctly. The next step is to get the sidescan sonar ready for deployment. As
outlined in Chapter#2, the Klein 5500 sidescan sonar at DSTO is deployed either in a
bow-mounted configuration or in a towed configuration. As the set up procedures for
these two configurations have a lot more differences than similarities then each will be
outlined separately below.
106
DSTO-GD-0372
6.3 Towed Configuration
6.3.1
Moving Sonar onto back of boat
As the Klein 5500 sidescan sonar weighs 78 kilograms in air then this dictates that to
relocate it from any wharf to a boat will involve the use of a crane. As cranes have a
limit on the amount of cable they can deploy, then prior to arranging a boat to be wharf
side, it is important to make sure that the tide is not so low that the sonar cannot be
successfully lowered to the boat. Although the clearances required for a bow-mounted
or towed sonar will be different, the concept is the same. Information outlining tidal
predictions for major Australian and South Pacific ports can be found at the National
Tidal Facility web page (http://www.ntf.flinders.edu.au/TEXT/TIDES/tides.html).
There is also a software package at MOD, Sydney which shows the same information
this web page provides.
To relocate the Klein 5500 from any wharf to a boat using a crane follow the steps
below:
•
•
•
•
6.3.2
Remove the top half of the blue foam end pads from the Klein 5500 wooden
stowaway box and place these on the stern of the boat, in the location where the
sonar is to be rested on the deck (see Figure 18). If it is a windy day, then place
the foam ends in a nearby recess, until they are needed.
Attach the crane’s hook to the steel cable lanyard of the Klein 5500. As the
lanyard the crane will use is attached at the centre of the sonar then there have
been several occasions when the sonar has pitched badly when it was being
moved onto a boat. To prevent this happening, a rope should be attached to
one of the handles of the towfish (see Figure 17).
After finding a crane operator who has a licence, lift the sonar out of its
stowaway box and place it on the stern of the boat, on top of the blue foam pads
just placed there. Use the attached rope to control any pitching that develops in
the sonar during this relocation. To make deployment easier, when the sonar is
being lowered onto the foam pads, align it with the boat. That is, have the front
of the sonar closest the bow and the rear of the sonar (where the tail fins and
altimeter are housed) closest the stern of the boat.
Detach the crane’s skyhook from sonar’s steel lanyard and remove the rope that
was being used to inhibit any pitching. The sonar is now ready to be connected
to the TPU and be prepared for deployment.
Sonar Deployment Setup
Once the sonar resides on the stern of a boat there are only two more tasks to be
performed before it can be deployed. In a simplified version these two tasks are to
attach the tail fins and to attach the tow-cable. These two tasks will be outlined in
detail in the following two sections.
107
DSTO-GD-0372
6.3.2.1 Attaching Tail Fins
To attach the three tail fins to the sonar, use a long 4mm Allan key and an 8mm a/f
socket to remove the six bolts (two per fin) from the rear yellow nose cone of the sonar
and attach the fins one at a time. Figure 77 shows these two specialist tools at DSTO.
To inhibit the chance of a side fin working free during deployment, insert the two bolts
for the two side fins downwards instead of upwards. If this recommendation is
followed then if the nuts work free there is a lot less chance the bolts will drop out.
If downward or upward pressure is exerted on the dorsal fin then it may be enough to
cause the rear yellow nose cone to separate from the stainless steel sonar body. Such a
scenario should not raise alarm as the rear nose cone is designed this way. See section
2.1 for more details.
Figure 77 The 4mm Allan key and 8mm socket used to attach the three tail fins to the Klein
5500 sidescan sonar.
6.3.2.2 Attaching Coaxial Sonar Cable
Before the shackle of the co-axial steel tow-cable can be attached to the body of the
sonar, the steel securing brace plate (see Figure 18) needs to be screwed onto the top of
the sonar using nylon threaded steel screws and any two of the four available holes.
Once the brace plate is in place the shackle can be attached.
Before the co-axial steel tow-cable is attached to the securing plate check for any
broken wires, which often occur as a result of corrosion. Broken wires will place those
left under a lot more strain and there is a chance the tow-cable will break.
Make sure the pin is inserted at the end of the steel rod holding the shackle in place.
Coat the three pins on the tow-cable’s male Subconn® (http://www.subconn.com)
plug with silicon grease before connecting the Subconn plugs. If the Subconn plug
leaks then the silicon grease will act as a barrier between the contact points and any
seawater. The next step is to secure the steel lanyard to the co-axial steel tow-cable
using strong cable ties. This will create a loop at the top of the steel lanyard which will
be used to deploy and retrieve the sonar. The last step is to connect the safety steel
cable from the back of the sonar to the sock on the tow-cable. This attachment is a
backup in case the shackle works free. It should be noted that the sock of the steel towcable should not be handled without a good set of gloves. The sock has a lot of steel
108
DSTO-GD-0372
burrs protruding from it and running a hand along it can result in serious injuries to an
operators hands. Figure 78 shows the sonar setup ready for deployment.
Figure 78 A picture showing the correct set up of the Klein 5500 sidescan sonar. See text for
details. Operator Mr Collin Mason, formerly from MOD, DSTO.
Before the sonar is deployed the connection between the TPU and the sonar needs to be
checked for electrical continuity.
6.3.3 Testing Connection Between TPU and Sonar
6.3.3.1 Acquisition software
When the TPU has booted, start Isis or SonarPro by double-clicking on their respective
icons on the desktop, or find and run their executables, sonarpro.exe and isis.exe from
the folders klein and Tei, respectively.
The Isis and Klein software (see chapter#5) on the acquisition computer control
communication with the TPU, which in turn controls communication with the towfish.
Follow the directions outlined in chapter#5 so that the waterfall display is showing the
data being received by the sonar whilst it is in air sitting on the back of the boat.
109
DSTO-GD-0372
6.3.3.2 Rub Test
To make sure the sidescan sonar is working correctly before it is placed in the water a
test known as a Rub Test is performed. With the TPU pinging the towfish and the
acquisition program generating a waterfall display have someone rub their hand or a
piece of cloth up and down one side (one transducer stave) of the towfish. The
corresponding side of the waterfall display should show the presence of the sound
generated by the rubbing (see Figure 79). Perform this test on the other side of the
towfish to make sure the sonar is receiving data correctly. If the sonar does not appear
to be receiving any sound from the rubbing then right-click in the waterfall window,
increase the “Threshold” setting and repeat the rubbing. If the sonar fails the rub test
then this implies that although power is being transmitted to the sonar, the transducers
are not working. This can indicate one or more hardware or software components in
the sonar needs fixing.
The first approach when this happens is to contact the
manufacturer, Klein, and seek advice on how to implement further tests on the sonar
or enquire as to whether the sonar should be returned to them for fixing.
Figure 79 A waterfall display in SonarPro showing the presence of a rub test. Adapted from
(KLEIN SERIES 5000 SYSTEM TROUBLESHOOTING GUIDE).
After the rub test is complete, the activation of the sonar does not need to be stopped if
the towfish is being placed into the water straight away, however if the towfish is
going to be left use the stop button to stop the towfish operation and then restart the
towfish pinging when it is placed into the water at a later time. The reason for not
leaving the towfish running in air is because it is designed to be run in a water
environment, which has a much larger heat capacity than air. Hence, it is not unusual
for customers to damage the electronics inside the towfish by leaving them powered
up for too long whilst in air. Although the manufacturers of the towfish actually do
110
DSTO-GD-0372
not normally power up the towfish in air (personal communication Vince Horan, 2002),
they do recommend that as a rough guide the towfish should not be run in air for more
than 10 minutes. Leaving the towfish on the back of the boat during the summer
months can also make the towfish body increase in temperature considerably. So it is
recommended to cover the towfish with a tarpaulin when it is resting on the boat and
not being used.
6.3.4 Towfish Deployment
If the rub test is successful then deploy the towfish. The TPU can be left on at this
stage with the towfish pinging. There is no need to stop the towfish pinging whilst it is
being lowered into the water.
The process of deploying the Klein 5500 sidescan sonar requires a minimum of two
people: One experienced and suitably qualified person to operate the A-frame and the
winch and a second person to aid the sonar as it is placed into the water.
To deploy the Klein 5500 follow the procedure outlined below:
• Attach the snap shackle to the loop at the top of the steel lanyard and after
wrapping the rope around the winch raise the sonar off the stern deck. During
this time use the handle grips to stabilise the sonar and stop it pitching and
yawing.
• With one person controlling the winch and A-frame and a second supporting
the sonar, extend the A-frame so the sonar is slowing lifted over the fairlead
and over the water. Care should be taken that the belly of the sonar does not
scrape the fairlead rollers as the height of the sonar is comparable to that of the
fairlead.
• Making sure not too much tow-cable has been deployed out from the winch,
lower the sonar into the water. Before doing this however, slowly rotate the
sonar, otherwise when it is being lowered the yellow nose cone will hit the back
of the fairlead.
• Making sure the steel tow-cable is laid over the rollers of the fairlead, lower the
sonar several meters into the water until the slack of the tow-cable has been
taken up. This will have the sonar directly beneath the fairlead. To remove the
rope, use the winch to slower raise the sonar so the top loop of the steel lanyard
can be seen. Detach the snap shackle and lower the sonar back to several
meters. The sonar is now ready for operation.
WARNING: Do not let out too much cable as the towfish may hit the bottom
and be lost or damaged. Always be aware of the water depth in the area of
operation, and keep the towfish well clear by checking on the altitude value
in Isis or SonarPro.
Make sure an accurate record of cable-out is kept (see section 2.3.5)
111
DSTO-GD-0372
6.4 Bow-mount Configuration
6.4.1 Setup towfish for bow-mount
As with the towed configuration, before a bow-mount is set up, the tidal level should
be investigated to make sure it is high enough. If the tidal level is too low, it may not
be possible for a crane to lower the bow mount frame in place and several hours will
need to be waited until the tide reaches the minimum level. As outlined in section
6.3.1,
there
is
a
web
page
at
the
National
Tidal
Facility
(http://www.ntf.flinders.edu.au/TEXT/TIDES/tides.html) that shows the water level
predictions for the major ports of Australia and the South Pacific.
Having established that the water level is high enough to permit the bow-mount to be
lowered onto a boat, observe the following procedure:
• secure the aluminium support beam onto the top of the sonar using several
screws.
• Then loop the green lifting strop back onto itself under the top metal beam of
the steel bow mount and connect the crane’s hook into the loop that has been
made (see Figure 80). Using a suitably qualified person at the controls of the
crane, raise the steel bow-mount frame and manoeuvre it over the middle of the
sonar. Carefully lower the bow-mount frame onto the aluminium pole making
sure that the orientation of the frame and the towfish are in line (otherwise the
sonar maybe orientated back to front when it is mounted to the boat). Connect
the upper and lower parts of the bow-mount frame together using four screws
with four nylon-coated nuts. Use the crane to keep the frame upright. This will
permit the other set up procedures to occur more easily.
• Now get the short blue tow-cable, which has a shackle at one end, and using
strong cable ties, connect the shackle to a point on the sonar or bowmount
frame so that the male and female ends of the Subconn plug can be connected
and that this connection will not be placed under stress whilst the sonar is
underway. After coating the male ends of the Subconn plug with silicon grease
connect the Subconn plug. Now put the TPU end of the tow-cable up through
the centre of the frame as if the sonar was already in the water and using cable
ties mount the tow-cable flush against the centre poll of the frame.
• At this stage it is a good idea to test the electrical continuity of the Subconn
connection. This part can be postponed until the sonar is immersed in the
water although if the Subconn connection does not work then either the bowmount needs to be removed from the boat or a diver is required to reconnect
the Subconn plug underwater.
o To test the electrical continuity of the Subconn connection, connect the
tow cable to the back of the TPU located on the boat.
o Follow the rub test procedure outlined above for the towed
configuration.
112
DSTO-GD-0372
If the rub test fails then unscrew the Subconn plug at the sonar and reattach tightly. If the rub test still fails then check the connection of the
tow-cable at the back of the TPU.
When the electrical continuity of the Subconn connection at the sonar has been
tested and deemed successful, unscrew the tow-cable from the back of the TPU
and roll it up, using cable ties to keep the roll from unwinding. To prepare for
moving the bow-mount onto the bow of the boat, temporarily put the rolled up
tow-cable on one arm of the bow-mount (see Figure 80). This stops the towcable getting in the way when the frame is being put on the boat. Use another
cable tie to stop the rolled up tow-cable from falling off.
o
•
Figure 80 The final configuration of the bow-mount before it is lifted onto the workboat.
113
DSTO-GD-0372
6.4.2 Put Bow-mount on Boat
•
•
•
•
If not already done, put the solid steel bar that will hold the bow-mount frame
to the boat under the bow rope guide (see Figure 81).
With an experienced and licensed crane operator at the controls of the crane,
gingerly raise the bow-mount. Have an operator on the wharf and a second on
the bow of the boat controlling the movements of the frame. Make sure these
personnel are wearing safety helmets and steel capped boots.
Lower the frame to a height whereby it can be slid back under the cleat (or the
anchor point used for the ropes when the boat is wharf side). Pull back on the
bow-mount frame and slide it into position so it is rests on the bow of the
workboat. When the frame is resting in place, disconnect the crane’s skyhook
and remove the green lifting strop. At this stage the crane is no longer
required.
Using the two big bolts, bolt the frame to the steel bar (see Figure 81). This may
be difficult, as sometimes the bolts do not find the thread. If so, the steel bar
will need to be slightly rotated about the vertical or be removed and rotated 180
degrees in the horizontal axis. (Continued on next page)
Figure 81 The bow-mount in its final configuration. Several pieces of equipment are identified.
Refer to text for details. Adapted from an image taken by the Navy Imagery UnitEast.
114
DSTO-GD-0372
•
•
•
•
When the frame is securely attached to the boat, place two wooden blocks
between the frame and the rope tie downs (see Figure 81). To stop the frame
from moving forwards and backwards when the survey is underway have the
blocks facing in opposite directions.
All that is needed now is to cut the cable ties that were being used to stop the
tow-cable from unwinding and run the cable back to the TPU along the deck of
the boat.
Use cable ties to try and locate the tow-cable out of the way of any walkways.
The process of locating the bow-mount onto the boat is now complete and the
sonar is ready for use.
115
DSTO-GD-0372
7 Data Collection
7.1 Meta Data
As with most forms of data collection the key to any successful survey is documenting
the meta data and systematically archiving any data that has been collected. At DSTO,
Sydney the information that needs to be documented can be related to one of four
topics. These are: (1) the requirements of the Occupational Health and Safety
committee, (2) documenting any tests performed on the sonar, (3) documenting the
progress of a survey, or (4) information that would normally be documented
irrespective of whether the sonar was being tested or used for a survey.
7.1.1 OH and S Committee Requirements
When any type of sidescan sonar work is conducted it is a requirement of the OH and
S committee at DSTO that the following information should be documented in the
trials book:
•
•
•
•
•
•
Date of collection
Time of departure and return
All personnel on the boat
Reason for, or aim of data collection
Whether the survey area was in Port Jackson or offshore, and also the area(s)
visited.
Any safety incidents including, most importantly, what occurred and to whom
(these will need to be reported).
It is also a requirement that the aim of the days work be entered into the Survey Sheet
and that the trials manager and boat driver sign this form at the end of each day. The
Survey Sheet is included in the trials plan.
7.1.2 Testing the Sonar
When any instrument is being tested it is a very good idea to note the following:
•
•
•
116
The alterations made to any instruments on the boat, particularly if another
operator would not know that these have been made. It would be helpful if a
small label were placed on the instrument so any other personnel can quickly
see that the instruments set up has been altered.
Any unusual set up procedures (for example was GPS NMEA strings routed to
the acquisition computer instead of the TPU, or was a cable-out serial string
routed to the acquisition computer?).
Were any unusual settings used on the sonar? For example was a different
pulse width used? If so when were the changes implemented and what data
files do they correspond to?
DSTO-GD-0372
7.1.3 Survey Information
If a proper survey is being conducted then in addition to the information above, the
following should also be noted for the day in question. There is a data collection sheet
in use in which this information can be entered. Any data sheets collected should be
kept so they can be referred back to.
•
•
•
7.1.4
What survey lines were either partially or fully completed?
What were the names of the data files generated?
What time interval and survey line does each file correspond to?
Miscellaneous
Irrespective of why the sonar is being used it is always helpful if the following
information is documented:
•
•
•
Was any equipment broken?
Were there any unusual findings?
Did the TPU or acquisition computer behave abnormally (for example did the
TPU crash several times or did moving the mouse in the Isis ruggedised
computer make the operating system crash).
Although it may appear that a lot of documenting takes place when the sidescan sonar
is operated, any operator will get accustomed to the documenting that is needed and
not all the information listed above will need to be documented on each occasion a
sonar is used.
7.2 Collecting Data
The procedure to collect data using SonarPro or Isis will not be outlined here because it
was outlined in Chapter#5. What will be outlined is such issues as correct techniques,
media choices and data collection attributes.
Before the survey area is reached it can be a good idea to view the waterfall display, in
either Isis or SonarPro, and make sure it looks correct. It is not needed to save any of
this data until the surveying has begun.
Some important points to remember when data is being collected is the following:
•
•
•
Is the bathymetry getting dangerously low for the sonar to work in?
Bathymetry shallower than 5m should be of alarm when the sonar is being
towed whilst for a bow-mount bathymetry is not that much of an issue as the
boat needs a deeper draft than the sonar.
Are any alarms being displayed in the acquisition programs Isis or SonarPro?
Every time a new survey line is begun a new data file should be opened.
117
DSTO-GD-0372
•
•
•
Is a survey line being followed correctly or are there significant deviations? If a
survey line is not being followed is it necessary to stop the data collection and
return to the last location where good data was collected?
At the end of a day’s data collection systematically archive the files collected.
File any data sheets created.
7.2.1 Media Selection
As it is likely that any post-processing will be undertaken on a separate computer, then
this dictates that there is a need to transfer sidescan sonar data from the acquisition
computer to the post-processing computer. As sidescan sonar data can take up a lot of
space, with approximately 200 megabytes being collected in 8 minutes for the Klein
5500 or 1 GB in 40 mins, then the medium on which sonar data has been collected and
transferred to the post-processing computer has been magneto-optical (M-O) disks or
removable hard disks.
The magnetic optical disks at DSTO have capacities of around 2 GBytes, with each side
becoming full after approximately 40 minutes. When using M-O disks, make sure that
they are formatted using the command AFDisk, as described in Appendix D, otherwise
the windows NT processing computers will not be able to read them reliably. For
transfer from M-O to another computer, an external SCSI M-O drive exists at DSTO,
Sydney and can be installed in any computer that has a SCSI card.
The removable hard disks used at DSTO, Sydney were the 40 GByte Seagate barracuda
disks. Approximately 10 were purchased and they can be very helpful, requiring
removal only after approximately 8 hours. If the disks are being transferred between
computers of different operating systems then the disks may not be detected due to
different file systems being used. For example Windows 2000 can use NTFS, or Fat32,
whilst Windows 95 and Windows 98 uses Fat32 or Fat. If a disk does not appear in the
My Computer, go to the Control Panel|Administrative Tools|Computer Management
and click on disk management under storage. This will show all hard disks and
partitions present in a computer (see Figure 82). If needed, the file system used in the
removable hard disk can be altered here so the hard disk can be used.
118
DSTO-GD-0372
Figure 82 The Computer Management dialogue window in Windows 2000.
119
DSTO-GD-0372
8 Post-Processing
8.1 Introduction
SonarPro and Isis have primitive post-processing capabilities. In particular they can
only play back data files, with SonarPro also consisting of a target database. As these
two packages cannot smooth or edit navigational data or create mosaics then they
have not been the first tool used at DSTO and the RAN, for post-processing sidescan
sonar files. This was, and will be for some time, achieved by Sonarview (Young and
Anstee (1999) outline how to utilise Sonarview).
Despite SonarPro and Isis’ limited post-processing capabilities it was still thought
beneficial if a chapter was dedicated to explaining how to use these tools because there
are occasions when it is helpful to use them. Such occasions could be to play back
recently collected data files to check for data file corruption or to re-evaluate any
recently observed targets. This is easily achieved in SonarPro and Isis.
8.2 File Playback
8.2.1 ISIS
To play back DAT, XTF, SEG-Y or TRA5 data files in Isis, click on “File | playback” or
. Either option will result in Isis requesting which
click on the “Playback” button
data file to play back. The scrolling speed of the waterfall display(s) is controlled using
the walking/running person icons
playback speed”.
on the toolbar, or click on “view |
8.2.2 SonarPro
Both sdf and 5kd files can be played back using SonarPro. To do so, click on the
“Source” button in the Main window and select which Hard Disk the file is located on.
When this is performed the appearance of the tool bar in the waterfall window will
change from that which is available during data acquisition to that shown in Figure 83.
Sidescan sonar data files collected in the XTF, SEG-Y or DAT format cannot be played
back in SonarPro.
Figure 83 The tool bar available in the waterfall display of SonarPro when data files are being
played back.
5
120
Isis cannot save data files in the TRA format; it can only play them back.
DSTO-GD-0372
To play back sdf or 5kd files, first locate the data file. This can be achieved using the
or the advanced search icon
, which enables the
Open Sonar data icon
operator to temporally search for files. Once the data file has been chosen, the file
count window
will adjust to reflect the chronological location of the chosen
file relative to the total number of files available in the directory. Then it is a simple
matter of using the Data Source Control buttons
to play and stop
data files as well as move forward or backward one data file. If the operator does not
intervene, SonarPro will play all data files in the chosen directory starting with the
chosen file and finishing with the last file collected.
The other icons in the Playback Tool bar control the characteristics of the waterfall
display as well as permitting the attributes of any targets to be displayed. The three
icons
on the Playback Tool bar, have corresponding tabs in the
Sonar Viewer Properties window (Figure #84) and their functions are outlined below.
•
The Plan View Configuration icon controls whether or not the waterfall
display (1) is corrected for Slant Range, (2) displays the altitude line, (3) displays
the port or starboard or both, sidescan data, (4) blanks out the water column or
(5) is inverts the colour of the water column. Figure 84(a) shows the Plan View
Configuration tab in the Sonar Viewer Properties window.
•
The Time Variable Gain (TVG) icon permits the operator to alter how the
gain of the intensity is applied. The operator has the options of leaving the gain
on Auto or adjusting the three components of the TVG, namely spherical
spreading, absorption and scattering, for the port and starboard channels, using
the slider rulers. Any adjustments made to the TVG will appear immediately in
the waterfall display. Figure 84(b) shows the TVG tab in the Sonar Viewer
Properties window.
•
The Color Palette icon enables the operator to adjust the Hue Start, Hue
Stop, Saturation Start and Saturation Stop components of the color palette using
slider rulers. The operator also has the option of chosing inverse video. Figure
84c shows the Color Palette tab in the Sonar Viewer Properties window. Like
adjustments made to the TVG, any adjustments made to the color palette will be
immediately displayed in the waterfall display.
121
DSTO-GD-0372
(a)
(b)
(c)
Figure 84 The three tabs of the Sonar Viewer Properties window. (a) Plan View Configuration,
(b) TVG and (c) Color Palette.
The speed of the waterfall display can be altered using the icons
. The
waterfall display will scroll with the default speed of approximately twice the speed of
data capture (248 pings per second), with a maximum of nine times the speed of data
capture and a minimum of a half.
During data playback objects may be observed for which the height and length may
need to be determined. This can be deduced respectively, using the two icons
with the values calculated being displayed in the status bar, which is located
beneath the Information Window. Before these two functions can be used, the
122
DSTO-GD-0372
waterfall display needs to be stopped scrolling. This can be achieved using the stop
.
icon
To aid keeping track of observed targets it was outlined in section#5.3.6 that the
operator can mark the location of any targets by double-clicking in the waterfall
display, with a red filled circle subsequently being placed in the navigation window
where the target is located. This technique is good for small targets but for larger
targets or geological features such as rocky areas, this technique is unsuitable. To
enable the operator to highlight large areas in the waterfall display the icon
can
be used. This icon enables the operator to draw freehand lines in the waterfall display,
with any lines drawn subsequently shown in the Navigation Window. Unlike the
length and height icons above, however, the scrolling of the waterfall display does not
need to be stopped before this function can be invoked, although it is difficult to
observe the lines in the waterfall display while it is scrolling.
8.3 Cursor Position Estimation
If the operator wishes to know the latitude and longitude of any location in the
waterfall display then, assuming the layback information has been correctly entered
(see section 5.3.4) and the method for estimating the towfish yaw has been chosen
appropriately (see section 5.3.5), it is a simple matter of clicking on the waterfall
display with the cursor where the operator wishes to know the position, and the
latitude and longitude will be calculated and displayed in the status bar.
Note: cursor position information will be displayed in the status bar even if the
layback function is dimmed and not active (which occurs when the data format is
sdf). In this situation the position information should be disregarded.
In determining the position of any point in the waterfall display the assumption is
made that the bathymetry does not change across the track. This is the flat bottom
assumption and the operator should be aware of it. The operator should use caution if
he or she is determining the locations of targets in regions where the bathymetry
changes in the across-track direction. Figure 85 is a schematic displaying this scenario.
123
DSTO-GD-0372
Figure 85 A schematic diagram showing how the flat bottom assumption can result in incorrect
location of objects in areas of uneven bottom topography.
9 Trouble shooting
9.1 Introduction
Over the past several years at DSTO many problems have been observed with the
Klein 5500 system and often these problems have only been remedied by consultation
with either TEI or Klein Associates Inc. As this consultation often took several working
days then it was deemed very advantageous if the steps that were taken were outlined.
The problems that were observed can be placed into several categories. These were:
• TPU not booting
• TPU lock loss/error lights on
• TPU crashing
• Incorrect usage of acquisition software
• Error messages generated by acquisition software
• Idiosyncracies of waterfall displays
In this chapter all of the problems that have been observed with the Klein 5500
sidescan sonar system will be outlined, including any indicators or error messages, the
reasons for the problem and the action that needs to be taken. Some remedies have
been taken from Klein Series 5000 System Troubleshooting GUIDE and this text is very
helpful in isolating problems with the Klein 5500.
9.2 TPU not booting correctly
One of the most common problems to occur with the Klein 5500 sidescan sonar at
DSTO was for the TPU not to boot up. The reasons for this could be incorrect setup of
the FTP server on the acquisition computer, or the TPU operating system file vxworks
being placed in an incorrect location on the acquisition computer. The TPU should
124
DSTO-GD-0372
boot successfully after approximately 1 minute of it being switched on and evidence
that this has occurred is any of the following:
•
•
•
•
The vme light on the DSP board of the TPU flashes at the sonars default ping
rate.
The terminal emulation software connected to the com1 port of the TPU shows
the message shown in Figure 45.
If the FTP server program is ServU, then in the main window, there will be four
lines indicating that the TPU is downloading the file vxworks. If ServU does
not show that the TPU is downloading the file vxworks then it will not boot.
If an Ethernet hub is being used between the acquisition PC and the TPU, then
the indicator lights on the ports being used on the hub should light up soon
after the TPU is switched on, indicating that the file vxworks is being
downloaded.
If it is clear that the TPU is not booting, then the following actions should be taken, in
the order presented. In each of these actions use the white reset (rst) button located on
the bottom board of the TPU instead of the green on/off switch to reboot the TPU.
•
Use the “Ping” command in DOS on the acquisition computer and ping the IP
address 127.0.0.1. The IP address 127.0.0.1 is the address of the network card.
So the command ping 127.0.0.1 will test the inner loop between the computer
and the network card. If no packets of data can be sent to the network card
then the network card has not been installed correctly. Figure 86 shows an
example of the ping command testing this inner loop. Note in this figure how
four data packets were sent to the network card and four were sent back,
indicating that the “inner loop” has been set up correctly.
Solution-if the ping command reveals that the network card is not installed correctly
then remove old driver for network card (if it exists) and reinstall it. Then try the ping
command again to test the inner loop. If successful, then reboot TPU and see whether
it boots correctly. If it does not, but the inner loop exists, then proceed to the next step.
NOTE: It is not possible to use the ping command to ping the TPU from the acquisition
computer because the ping command itself is part of the operating system, and this has
not loaded yet on the TPU.
125
DSTO-GD-0372
Figure 86 The results of successfully pinging the network card on a PC. Note how four data
packets were sent and four were received, indicating a successful test.
•
•
Is the file vxworks located in the directory C:\klein on the acquisition
computer? If not, put it in there. Reset the TPU and see if it boots. If it does
not then proceed to the next step.
Check the settings in the FTP server (full details outlined in Chapter#3). The
settings which are often entered incorrectly are
o
o
o
o
•
If the settings outlined in Chapter#3 have been entered correctly and the TPU
still does not boot then if an Ethernet hub is being used, remove it and replace it
with a single cross-over cable between the TPU and acquisition computer. This
is because in the past, some Cat5 straight network cables have been broken and
this has been discovered by replacing the two being used and a hub with one
cross-over cable. If the usage of single cross-over cable enables the TPU to boot,
then either
o
o
o
o
126
IP address of TPU (normally 160.64.181.222).
IP address of acquisition computer (normally 160.64.181.221).
the username and password the TPU will use to log in as.
the home directory the TPU will try and download its operating system
file (vxworks) from.
the hub is broken (this is very unlikely),
the hub does not have power,
one or both of the straight network cables is broken (this has happened),
the wrong ports on the back of the hub are being used (see section 2.3
for correct usage).
DSTO-GD-0372
By now the TPU should be receiving its operating system file vxworks. If it
is not, then does the TPU still output to com1 the beginning of its boot
process (see Figure 45). If it does not then either:
•
•
The TPU does not have power
The TPU is malfunctioning and may need to be returned to Klein Associates in
the USA.
9.3 TPU Error Light
Sometimes, the yellow error light on the demultiplexer board of the TPU will be lit
when the TPU is switch on. This does NOT indicate that the TPU has not booted. It
indicates that there is an error in the link between the TPU and the sonar. As data
cannot be received until this link is restored then efforts will need to be made to locate
the problem. The reasons why the error light on the demultiplexer board will light up,
in order of likelihood, are the following:
•
There is not a closed connection between the tow-cable termination and the
TPU (located at the back of the TPU). Remove the tow-cable from the TPU and
reattach it more tightly (but hand tight only). Reboot TPU and see whether the
error light is still on.
Warning: do not connect or disconnect the tow-cable to or from the TPU while the TPU
is on. Serious damage may occur to the sonar system electronics and/or any operators
of the sonar may be injured.
•
•
There is not a closed connection at the subconn plug at the sonar. If possible
unscrew it, and reattach. Reboot TPU and see whether the error light is still on.
If the sonar is being towed, so that the winch is being used, then there is a slight
possibility that the tow-cable connection in the slip-ring has come apart. This
has happened once in the past. Why it occurred is not understood and the
possibility of it re-occurring is thought to be very unlikely. It will take several
minutes to remove the inner housing of the slip-ring and check the connection.
If the above solutions do not work, then there is a slight possibility that the problem is
originating to one of the following, although these are very rare. If any of these are
suspected contact Klein Associates Inc. for guidance.
•
•
•
•
Broken tow-cable
Wrong tow-cable
A too long tow-cable
Failure of sonar (primarily the multiplexer board).
127
DSTO-GD-0372
9.4 TPU Crashes
Sometimes, when data is being collected, for no apparent reason the TPU will crash.
The TPU is designed to be a very stable platform on which data is acquired and so it is
rare for this to happen, but it has been observed. There will be several clear indications
that the TPU has crashed. These are:
•
•
•
The vme light on the TPU will stop flashing and will stay on continuously.
The waterfall display in Isis or SonarPro will stop scrolling.
If Isis is being used then two dialogue boxes may be spawned saying “Failed on
SetSys5000 Standby” or “DoPing Event ERROR“. Although these error
messages are spawned when Isis is running, they are in fact generated by the
Klein System 5000 controller software ss.exe, which, as stated in section 5.2.6.2,
augments the server KLN5000.exe to route data to Isis from the TPU. The error
messages are generated because, as the TPU has crashed then no data is being
sent to ss.exe, with the error “Failed on SetSys5000 Standby” preceding the
error “DoPing Event Error”. Both error messages are symptomatic of the same
problem.
The solution is to first get SonarPro or Isis functioning correctly. SonarPro has no
quirks which could confuse a new user and is likely just to need shutting down and rerunning. Isis however does have a few quirks and the steps which should be taken to
get it working again are outlined below:
• Highlight the Klein System 5000 controller dialogue box with the left mouse
button and hit the escape key to remove it. Do not use the buttons in the top
right hand corner of this window, as they will not work.
• Close the Isis server dialogue window for the Klein 5000 series of sidescan
sonars.
• Now close Isis using File|Exit.
• Start up Isis making sure the Klein System 5000 controller dialogue box and the
dialogue box for the Isis server have been spawned. Isis should now be
functioning correctly.
Now the TPU must be rebooted. Press the RST (reset) button on the bottom board of
the TPU and wait for it to boot up. After the TPU has booted successfully (as
illustrated in Chapter#6) set up Isis or SonarPro to display data from the sonar (see
Chapter#5 for these details).
9.5 Incorrect usage of SonarPro
As outlined in section 5.3.4, to have access to the layback icon
in SonarPro the data
format needs to be set to 5kd and not sdf. If sdf is used then the layback icon will be
dimmed
128
and it will not be possible to enter the layback characteristics of a sonar.
DSTO-GD-0372
This will mean the location of any objects in the waterfall display are likely to be
incorrect and unusable.
The data format which SonarPro (as well as Isis) expects to come from the TPU, is set
using the variable Set Oldheader in the startup.ini file. This file, the reader may recall,
is downloaded using the file transfer protocol (ftp) from the Master computer by the
TPU during boot-up. When the variable Set Oldheader is set to zero (0) SonarPro
expects the sdf format and when this variable is set to 1 the 5kd format is used.
9.6 Error Messages generated in Isis
9.6.1
Demo Mode
When Isis is executed it interrogates the printer port on the acquisition computer
looking for the sentinel or dongle. If, for one of a few reasons, it does not see it then
Isis will spawn a message outlining that it is in demonstration mode and that data
acquisition is not possible; only data files can be played back. There are several
reasons why this message may be spawned. These are:
•
•
•
The dongle is not in place.
The connection is faulty or
Windows NT or Windows 2000 is being used and the appropriate driver has
not been installed (see Appendix A for details on how to install the necessary
driver).
For the first scenario, reboot the computer after attaching the dongle. If Isis is still in
demonstration mode then the printer port is likely to be faulty and the dongle may
need to be removed and reattached several times. If the Isis ruggedised computer is
being used then there is the additional option of internally mounting the sentinel. For
the last scenario, follow the steps outlined in Appendix A on how to install the correct
driver.
9.6.2
CSC Error
Sometimes when Isis is used to collect data (whether it is just being displayed or
displayed and written to disk), an error message is displayed of the form “CSC Error
Connecting to sonar source. Is source running? Check configuration (conf.exe) for
correct configuration and server address. Note, only a single master is allowed.”
Although the causes of this error are described, each statement will be described below
and the necessary remedial action also outlined.
•
•
Has the TPU booted successfully and is the connection between the TPU and
sonar closed? See section 9.2 and 9.3 above for the evidence and any action that
is needed.
All the other causes of this error are related to the System 5000 Configuration
dialogue box (see Figure 75). Bring up this dialogue box by double-clicking on
129
DSTO-GD-0372
the Klein software conf.exe. In this window, check the following and
implement the recommendations:
o
o
The System 5000 Network Address is the IP address of the TPU and unless
this has been changed it should be 160.64.181.222. If it is not this then
change it. Click on the Save and Exit button and try collecting data again
from the TPU.
If the same error is still being spawned and if there are more than one
acquisition computer then make sure there is only one Master. This is the
computer that will have control over such attributes as slant range, pulse
length, pulse shape, resolution and sound speed used. For those
computers using Isis, check the Master or Slave set up using the conf.exe
program, and if SonarPro is being used then click on the towfish icon
and in the TPU Connection dialogue box (see Figure 66a) choose whether
or not the PC connecting to the TPU will be the master or will connect to
the TPU as a slave. If any of the acquisition computers were set up
incorrectly (for example if there was more than one Master, or if all were
Slaves) then make the necessary alterations and try again to acquire sonar
data. If the same error message is generated then seek guidance from Klein
Associates Inc.
9.7 Serial Port Lock-up on Laptops
If the Windows 2000 operating system has been installed on a laptop that a serial cable
is connected to, when it is booting, and data is being transmitted down the cable, then
the operating system will believe a serial mouse has been connected to the laptop.
Because of this, the operating system will install the necessary drivers and will most
importantly lock the serial port, not enabling any data to be received over it. This
creates the problem that it will appear in Isis or SonarPro that the instrument
connected to the laptop, most likely the KVH Gyro, is not working, when in fact it is,
but it is really that laptop that is at fault.
If a laptop running Windows 2000 is booted up and it is suspected that the serial port
has locked up as a result of data being transmitted down it, then several actions can be
taken.
These are:
• First make sure data is streaming down the serial cable using a serial cable
tester.
Several RS232 Mini Testers (see Figure 87) from Jaycar
(http://www.jaycar.com.au) were purchased in August 2002 at DSTO, Sydney
and should be able to show whether data is streaming down on the serial cable.
130
DSTO-GD-0372
Figure 87 The RS232 Mini Tester from Jaycar.
•
•
•
•
If data is coming down the cable then set up a HyperTerminal session (see
Chapter#4 for details) to establish that no data is being transmitted through the
serial port in question. If this is correct then the port is locked.
Remove the serial cable from the laptop’s serial port and reboot the laptop.
Only after the laptop has booted, insert the serial cable with the data streaming
down it.
To check that the serial port is working, set up another HyperTerminal session
and make sure data can be seen coming into the laptop. If data does appear
then the port was locked and is now ready for collecting data.
These details will enable the serial port to be used after several minutes of testing, but
if a more permanent solution is desirable then, other than remembering when this
problem occurs, this can be achieved by wiring the serial cable so that it does not
“look” like a serial mouse. This modification must be done at the computer (or Data
Terminal Equipment [DCE]) end of the serial cable by making the following
alterations:
If a DB-25 (25 pin) Female plug is being used then solder a link between these pins.
pins 4 - 5
pins 6 - 8 - 20
If a DB-9 (9 pin) Female plug is being used then solder a link between these pins.
pins 7 - 8
pins 1 - 4 - 6
After jumpering the serial cable then either the laptop can be rebooted or the serial port
can be unlocked by removing the extra “Pointing Device” using the device manager in
the Control Panel (Triton Elics International CD, Winter 02).
131
DSTO-GD-0372
9.8 IP Address Conflict
On the rare occasions that there is more than one acquisition computer, it is quite likely
then when any of the slaves are connected to the network via the Ethernet hub, an
error is generated that there is an IP conflict. The reason for this is that the IP address
of the slave is the same as that of the TPU or any of the other computers and this is
likely to occur as the slave in question is likely to have been a master at some stage and
as such it would have been given the same IP address as the master that is currently in
use.
To set up the slave computer so it does not have an IP address that is conflicting with
those of the other computers, follow the directions below for the respective operating
system:
9.8.1 Windows 95
Go to the Control Panel | Network and in the network window select the
“Configuration” tab.
Select the TCP/IP (Transmission Control Protocol/Internet
Protocol) link from the network components list and then click the “Properties” button
below this list. Select the “IP address” tab and “Let me specify an IP address” should
be checked. Enter in an IP address that has not been used for all the other computers
and the TPU and use a subnet mask of 255.255.255.0. Click on OK and the IP address
and subnet mask of the computer should be set.
9.8.2 Windows 2000
Go to the Control Panel|Network and Dial-up Connection and right click on Local
Area Connection. Click on properties and the Local Area Connection Properties
window will be spawned (see Figure 31). In the Local Area Connection Properties
window select TCP/IP (Transmission Control Protocol/Internet Protocol) and click on
Properties. Then the “Internet Protocol (TCP/IP) Properties” window is displayed.
Click on “Use the following IP address” and enter in an IP address that has not already
been used with a subnet mask of 255.255.255.0. Leave the Default gateway window
empty. Figure 32 shows the Internet Protocol (TCP/IP) Property window with these
necessary settings. Click on OK and the IP address and subnet mask of the computer
will be set.
9.9 Waterfall Display Errors/Quirks
9.9.1 Symmetrical Waterfall Display in Isis
When the Klein 5500 was returned to DSTO in 2001, after undergoing a major
overhaul, the waterfall display in Isis was symmetrical about the sonar track axis. This
problem was simply caused by the variable “set OLDHEADER” in the startup.ini file
132
DSTO-GD-0372
being set to 0 (zero) and causing the TPU to generate the wrong data format sdf instead
of this variable being set to 1 and causing the TPU to generate the 5kd format.
9.9.2 Jerky Waterfall Scroll Speed
On some occasions using Isis and SonarPro, the waterfall display has been scrolling
somewhat sporadically and unevenly. The reason for this characteristic is outlined
below for these two software packages:
Isis
•
If the ship is moored, then the likely cause is that the speed of the waterfall
display is being compensated for ship speed, and as the ship is rolling
around sporadically then the ship speed from changes in GPS position are
alternating between zero and 0.1 knots. There is no need to be concerned,
as this problem would be rectified once the ship leaves the wharf, but if an
operator would like to remove this problem then right-click on the waterfall
display and deselect the speed correction radio button.
SonarPro
• In the early days of using SonarPro the waterfall display scrolled slowly
and unevenly. Consultation with Klein Associates revealed that SonarPro
was designed to be used with a 100 Mbits/second Ethernet Hub. The
problem was generated because a cross-over network cable was being used
between the TPU and the acquisition computer, with no hub, and data was
being sent to SonarPro in a slightly uneven rate. The remedy was to use a
hub. This problem is reported by the screen error:
Version 5.0 - SonarPro® Sonar Processing System
Date: 09/10/2001 Time: 16:47:39
TPU reports requested data page is no longer available. Resetting requested
data page.
9.9.3
Echosounder Interference
In 2001, Dr Phil Chapple, Task Manager for the Shallow Water Environment, visited
Klein Associates Inc. in New Hampshire requesting feedback on some peculiar
waterfall characteristics of the Klein 5500. At the time Klein requested that some data
be collected that ensonified different bottom types and to send the data to them. They
would then use the data to evaluate the performance of the Klein 5500 and provide
advice on how it could be improved.
During the data collection across-track striping was observed in some of the waterfall
plots (see Figure 88). Such striping is not a new feature in the sidescan sonar
community and it was suggested by Klein Associates that it was caused by the
echosounder on the boat. If high quality data needs to be collected then one solution
would be to turn off the echosounder and make sure that is the problem. If it is and
133
DSTO-GD-0372
the echosounder is needed then the distance between the sonar and the echosounder
could be increased.
Figure 88 Waterfall display of the Klein 5500 showing streaking.
10 Conclusion
This document begins by explaining how sidescan sonars operate and goes on to
explain how to correctly set up the Klein 5500 sidescan sonar. In particular, this report
begins with some basic underwater acoustic information that an operator of a sidescan
sonar may find helpful. It then outlines how sidescan sonars operate and what type of
information about the seafloor and water column they can provide. It outlines what
the physical limitations are in their usage and how the backscatter results can be used
to infer sediment types. This report then outlines how to correctly set up a computer
so it can acquire backscatter data from the Klein 5500 sidescan sonar, how to set up the
sonar either in a towed configuration or bow-mounted configuration, and how to use
the acquisition software Isis and SonarPro. Lastly, but by no means least, common
mistakes that can be made when setting up the acquisition computer are explained
together with problems that can occur with the TPU. Error messages that have been
observed with the acquisition software packages Isis and SonarPro are also highlighted
and advice given on how to circumvent them.
134
DSTO-GD-0372
11 References
Bell, J.M. Chantler, M.J. and T. Wittig, (1999) "Sidescan Sonar: a directional filter of
seabed texture?", IEE Proceedings. - Radar, Sonar and Navigation. 146(1), pp. 65-72
Blondel, P. and Murton. B. (1997) Handbook of Seafloor Sonar Imagery. Wiley
Publishers.
Fish, J.P. and Carr.H. (1990) Sound Underwater Images: A guide to the generation and
interpretation of sidescan sonar data. Lower Cape Publishing.
Fish, J.P and Carr.H. (2002) Sound Reflections: Advanced Application of Sidescan
Sonar. Lower Cape Publishing.
Klein Associates (1985) Sidescan Sonar Record Interpretation, Klein Associates, Salem,
New Hampshire.
Klein Associates Inc. “Klein Series 5000 System Troubleshooting Guide”
Kleinrock, M.C. (1991) Overview of Sidescan Sonar Systems and Processing, IEEE
Proceedings, p 77-83.
“LAN Configuration Notes, Klein 5000 with LAN, Triton Isis workstation with NT 4.0”
provided by TEI.
Technical Memorandum, Titled: Klein System 5000 Software Version 3.0 Release Notes
Triton Elics and Associates (2002) Isis Sonar User’s manual, volume 1
Triton Elics and Associates (2002) Isis Sonar User’s manual, volume 2
Urick, R. (1983) Principles of Underwater Sound 3rd edition, McGraw Hill Inc.
Waite, A.D. (2002) Sonar for Practicing Engineers 3rd edition. John Wiley and Sons,
Ltd.
Young, A and Anstee. S (2001) A User’s Guide to Sonarview 1.0: A Sidescan Sonar
Post-Processing System. DSTO General Document 0280.
135
DSTO-GD-0372
Appendix A: Installing software
In this report numerous software packages have been cited and summarised in relation
to collecting sidescan sonar data from the Klein 5500. There was the graphics video
display software Hawkeye, the FTP servers, Serv-U and Windows 2000, and the
acquisition packages Isis and SonarPro.
This appendix will either describe the installation procedure for these packages or if no
installation is required, where the application can be located. Winzip is a software
package instrumental in installing the above software packages. As it is easy to install
however then its installation procedure will not be outlined.
Warning: prior to making any alterations to a computer, such as installing or
upgrading software packages, it is advisable to make a complete backup of the
directories that will be altered.
Section 1 Hawkeye
As outlined in section 3.6.2, the Imagine 128 Graphics video card present in the Isis
ruggedised PC can be used in conjunction with the Hawkeye support software
package. This graphics card software enhancement works with the operating systems
Windows 95/98/NT but not with Windows 2000.
Before installing the Number Nine drivers, close all open application programs and
disable any anti-virus software that is running until the Hawkeye for Windows 95
installation is complete. To install Hawkeye follow the instructions below.
1. Go to the Number Nine web page http://www.nine.com (see Figure 89 for an
example of the layout).
2. Click on Drivers.
3. Click on Image 128 directory.
4. To determine the role played by the setup files in this directory, read the file
index.txt.
5. To install Hawkeye in Windows 95/98, Windows NT 3.51 or Windows NT 4.0
download the files 128w9213.exe, 128n3115.exe or nt410103.exe, respectively.
NOTE: Do not store these files in a directory called C:\number9 as it will create
a conflict with the configuration file of the same name. These files are selfextracting compressed files, containing the setup file, initialisation files,
dynamic link libraries and any other support files.
6. When the setup file has been extracted, double click on its icon
Hawkeye software will be installed.
136
and the
DSTO-GD-0372
7. If installing Hawkeye on Windows 95/98, then when prompted restart the
computer so the installation can be completed. Evidence that the installation
was successful is that the number 9 icon
right-hand toolbar.
should appear in the bottom
8. Any queries regarding the Hawkeye software can be directed to the Forum site
at Number Nine web site (see Figure 89).
Figure 89 The Number Nine web page, with the Drivers and Forum icons highlighted by yellow
ellipses.
Section 2 ServU
Serv_U (http://www.serv-u.com/) was written by Rob Beckers, the founder of CatSoft (http://www.cat-soft.com), and was originally named FTP Serv-U. In May, 2001,
the internet software company, Rhinosoft (http://www.rhinosoft), entered into a
partnership with Cat_Soft assuming all sales and technical support for past and current
customers. A site licence of 20 users was purchased by MOD, DSTO for Serv-U by
Stephen Pascoe several years ago although responsibilities and further administration
of the licence was transferred to John Shaw. As DSTO was one of Rob Becker’s early
customers, it receives lifetime updates free of charge.
Serv-U has been written in both 16 bit and 32 bit versions, for the operating systems,
Windows 95 / 98 / 98SE / Me, Windows NT Server/Workstation 4.0, Windows 2000
(Advanced) Server, Windows 2000 Professional, Windows XP Home / Professional.
137
DSTO-GD-0372
Serv-U comes in three levels, Personal, Standard and Professional. DSTO has a licence
to the last and most functional level, Serv-U Professional.
To install Serv-U, follow the procedure below:
•
•
•
•
•
•
first make sure administrator rights have been activated if the installation is to
made on the operating systems Win NT/2000.
Download the latest installation file (susetup.exe) of Serv-U from
(http://www.serv-u.com/) using any one of the four download sites available.
The file susetup.exe is a self-extracted Winzip compressed file.
) and
Once the download is complete, double-click on this executable (
the installation will begin. As an installation of Serv-U will write over an old
version then the first dialogue box that is spawned will state: “IMPORTANT: If
you have an older version of Serv-U installed and did not do so already: Exit
this installation now and make a backup of your Serv-U directory”.
Click on the Next button and after accepting the licence agreement select the
directory in which the new version of Serv-U will be placed.
Once the installation directory has been chosen, click on the Next button. Then
a box will appear outlining the options that can be installed. Check the options
needed and click on the Next button.
Then enter the name of the Program Manager group which the Serv-U icons
will be added to. If a new program manager group is wanted with the Serv-U
name then leave the default name of Serv-U FTP Server. Click on the Next
button and Serv-U is ready to be installed.
Warning once the following Next button is clicked the installation will begin and
should be allowed to progress to completion.
•
•
•
138
Click on the Next button and install Serv-U. During the installation process a
progress bar will appear and once the installation is completed a final window
is spawned asking if the installer wishes to find out about any of the other
products Rhinosoft produces. Click on the Close button in this window.
Then a window will be spawned stating that if the current installation is a new
installation of Serv-U then a setup Wizard will begin when the Administrator
program is started for the first time. Rhinosoft highly recommends that this
Wizard is used for the initial set up as changes can always be made later. If the
installation is an upgrade from an earlier version then the setup wizard will not
be spawned. Click on the Next button and follow the setup procedures
outlined in section 3.3 for the FTP server.
The last step is to enter the registration key. This is one line of ASCII characters
and needs to be acquired from Rhinosoft. An example of a registration key for
Serv-U is outlined below. If one of the twenty user licences of Serv-U needs to
be installed by someone from DSTO, Mr Les Hamilton can be contacted for the
correct key. As it is easy to lose the key then it is recommended to save it to a
DSTO-GD-0372
file, for example named key.txt, and placed in the Serv-U directory. If the
registration key is not entered the Professional version of Serv-U just installed
will automatically revert to the Personal edition after the 30-day evaluation
period.
------------------------REGISTRATION ID
Name:XXXXXXXXXXXXX
E-Mail Address:XXXXXXXXXXX
Registration ID:
XXXXXXXXXXXXXXXXXXXXXXXXXXXXXXXXXXXXXXXXXXXXXXXXXXXXX
XXXXXXXXXX
To enter the registration key, first highlight the registration ID string and use
the right mouse button to copy it to the clipboard. In the setup wizard, click on
the key icon (
), or click on the Licence drop down menu, and click on Enter
Key. If the current installation is an upgrade and the setup wizard has not been
spawned, then spawn Serv-U’s main window by clicking on the Serv-U icon
(
) in the bottom right-hand corner of the screen and follow one of the
approaches just listed. Then paste the key into the registration window and
click on the OK button. Figure 90 shows these details.
Figure 90 The different ways in which the registration key can be entered into the Serv-U setup
Wizard.
•
When the registration key has been accepted a Professional Serv-U should be
installed correctly and ready for use.
139
DSTO-GD-0372
Support for Serv-U should be directed to the Serv-U support team using the email
address [email protected]. Any sales queries directed to [email protected].
Section 3 Windows 2000 FTP Server
To install the Windows 2000 FTP Server there is a need to log on either as the
administrator or as a user that has been granted Administrator privileges. Then put in
the Windows 2000 CD and after it has auto-booted, click on “Install Add-On
Components”. Then check “Internet Information Services (IIS)” and click on the Details
button. The Details button provides control over which subcomponents of the Internet
Information Services (IIS) are installed. The subcomponents that are needed if the FTP
server is to be installed correctly are the Common Files, File Transfer Protocol (FTP)
Server, and Internet Information Services (II) Snapin. When a subcomponent is
deactivated, the windows component that subcomponent is needed for is displayed.
This makes it difficult to accidentally deactivate a critical subcomponent.
Once the three components are checked, the FTP server will be installed when OK is
clicked in the subcomponents window, and also in the components window. Figure 91
outlines the windows that are spawned in installing the FTP server is installed and the
subcomponents that need to be checked. To enquire as to whether the FTP server has
been successfully installed, there should be a “Default FTP Site” under Internet
Information Service, in the Computer Management window of the control panel (see
Figure 92). Windows 2000 does not need to be rebooted immediately after the
installation for administration to be performed on the server.
On some occasions when the Windows 2000 FTP server has been installed an error
message has been spawned outlining that some files could not be found. This occurs
because some files that are needed could not to be loaded from the CD as the CD has
been given a wrong drive letter. When this error appears, click on the Browse button
and choose the correct drive letter for the CD containing the Windows 2000 CD.
140
DSTO-GD-0372
Figure 91 The windows that are spawned and the options that need to be chosen to install the
Windows 2000 FTP server.
Figure 92 A picture showing the hierarchical location of a “Default FTP Site” in the Internet
Information Service folder of the Computer Management window of the control
panel.
141
DSTO-GD-0372
Section 4 Isis
The Environmental Assessment Group of DSTO has a maintenance contract with the
compilers of Isis, namely Triton Elics International (TEI), which gets renewed yearly.
This contract is designed to provide support for the Isis ruggedised computer (such as
helping with hardware and operating system upgrades). In the past this support has
been via emails as well as some on-site support. The maintenance contract also
involves supplying the latest versions of Isis, Delph Map (with real time mosaicking),
and SeaClass Bottom Characterization and providing support for these products. As
only Isis was summarised in this report then only the installation procedure for this
product will be described below.
Two options are available to install Isis on the acquisition computer. Either the
executable Isis.exe can be obtained from another computer and copied onto the one in
question, or the latest version of Isis can be installed using the TEI seafloor imaging
CD. If the latter option is selected then the procedure that needs to be followed is:
•
•
•
•
•
•
•
If using Windows NT or Windows 2000 operating system then make sure
the installer has administrator rights.
Insert the TEI installation disk.
Exit all other applications before beginning the installation program.
Either go to the directory C:\TEI software\Isis 5.50\ and double click on
setup.exe or, click on Start|Run and in the dialogue box that is spawned
type in X:\setup, where X is the drive letter for the CD-rom, and click on
OK.
The Install shield should be spawned and the installation of Isis will begin
after the OK button is clicked on. During the installation process the
installation software will ask which hard disk (or partition) Isis should be
installed on. TEI recommends that two partitions be used, one for any TEI
software and another partition to save data to.
The first time Isis is installed on a machine that is running Windows NT 4.0,
the computer will need to be rebooted during the installation. When the
installation finishes the computer must be rebooted if Windows NT 4.0 or
Windows 95/98 is being used. This reboot is so the alterations Isis has
made to the PATH environment variable are applied.
When the installation is complete there will be an Isis icon on the desktop
and there will be a TEI folder in the programs tab on the Start menu.
It should now be possible to spawn Isis by either using the icon on the desktop or
by clicking Start|Programs|TEI|Isis. When Isis is spawned if an error message is
displayed stating Isis is in demo mode and that Isis can only play back data or
demonstration files, then this is caused by Isis not detecting the sentinel (see section
9.6.1 for full details). One reason how this could occur is because unlike Windows
95 and Windows 98, under Windows NT and Windows 2000 the Isis dongle
requires specific drivers before Isis will recognise it.
The driver is
142
DSTO-GD-0372
RainbowSSD5.39.2.exe, which can be located at (X:\Drivers and Third Party
Applications\Sentinel Driver\, where X is the drive name of the CD) on the Isis®
Installation CD. Install the driver and Isis should work correctly.
Section 5 SonarPro
SonarPro is quite easy to install. Unlike Isis, SonarPro does not require any sentinels
and up to the time when this report was written, it was being obtained free of charge
by the Environmental Assessment Group at DSTO from Klein Associates. SonarPro
does have the disadvantage, albeit small, that it was designed to be executed on the 32
bit operating systems Windows NT and Windows 2000. SonarPro was not designed to
be executed on the 16 bit operating systems Windows 95/98 and Klein Associates
make no guarantees of the stability of SonarPro on these operating systems and will
not provide support if this action is taken.
To
download
the
latest
version
of
SonarPro,
go
to
(http://www.kleinsonar.com/tech/download.html) and scroll down to the SonarPro
section. Click on the “Get” button next to the compressed version required and
download the file. Before uncompressing this file, rename the klein folder to, for
example, klein_old, make a new folder named klein and then use the Winzip utility to
extract all the files in the compressed file into the folder klein. This way, there is still a
working version of SonarPro if the new version cannot be extracted correctly. When
the compressed file is uncompressed there should several dynamic link libraries and
the SonarPro executable (sonarpro.exe) in the klein folder. If it is desirable to have
SonarPro on more than one machine then the executable SonarPro.exe can be copied to
any number of machines. SonarPro should now be usable by double-clicking on this
executable file.
Early installation versions of SonarPro, namely 5.0 and 5.3, were accompanied by a
setup program for the application SnagIt (see Figure 93). SnagIt is a powerful utility
that can capture either the whole or part of the screen or an active window and send
either the image or the text to a printer, a file, an email, a rendering package, a
catalogue, the clipboard or an FTP server (for web page creation). SnagIt can be called
from within SonarPro, however, later installations of SonarPro do not have Snagit
encompassed with them. If it is only screen captures that are needed then Snagit may
not be warranted, as this can be achieved using the print screen key on the keyboard in
conjunction with any graphics package. If it is felt that SnagIt is worthy of use then if it
can not be found in the SonarPro compressed installation file then it can be
downloaded from (http://www.techsmith.com/products/snagit/default.asp) or
requested from Klein Associates.
143
DSTO-GD-0372
Figure 93 The main window of the screen capture utility SnagIt.
144
DSTO-GD-0372
Appendix B: TPU Bootup Files
The TPU has been set up so that when it is switched on or rebooted it requests two
files from the host computer. These two files are called vxworks and startup.ini. The
first of these files is the operating system for the TPU. It is a binary file and is
essential if the TPU is to boot successfully. Normally an operator does not need to
know the contents or structure of this file. The second file, startup.ini, is an ASCII
file and is used to alter the default settings of the TPU’s operating system.
This appendix will outline the role played by each variable in the startup.ini file, the
values available, the default values and the values used at DSTO for the Klein 5500
sidescan sonar. The information below has been extracted from the Technical
MemorandumTitled: Klein System 5000 Software Version 3.0 Release Notes.
The contents of the file startup.ini are as follows, followed by an explanation of the
role played by each variable.
set SONARTYPE 5000
set BATHY 0
set OLDHEADERTYPE 0
set OLDMUX 0
set RESMODE 0
set BAUDRATE 4800
set STANDBYMODE 0
set DESPECKLESWITCH 0
set SPEEDFILTERSWITCH 1
set TVGPAGE 7
set RANGE 2
set TXWAVEFORM 0
set RESPDIV 15
set RESPFREQ 7
set DVLDELAYDELTA 31
set HEARTBEAT 0
set PINGSPERFILE 5000
set SPEEDSOUND 150000
set DIAGLEVEL 0
•
SONARTYPE {d=2000, 3000, 5000} This sets the type of Klein sidescan
sonar that is going to be used. At DSTO this is often set to 5000, although
the 2000 has been used in the past and the successor to the 5000 is likely to
be the new 3000.
•
RANGE {d = 0,1,2,3}. This sets the slant range with the values of d=0,1,2,3
corresponding to 50m, 75m, 100m and 150m, respectively. The default
value for the TPU is 100m although at DSTO the value used is 75m.
145
DSTO-GD-0372
146
•
TXWAVEFORM {d = 0,1,2}. This sets the pulse length (or sometimes
called pulse width) of the chirp the sonar is generating. The values
corresponding to d =0, 1, 2 are 50 µ sec, 100 µ sec and 200 µ sec,
respectively. The default value is 50 µ sec and this is the value used at
DSTO.
•
RESPDIV {d = 0 - 15}. This variable sets the responder output rate to a
fraction of that of the sonar. The value is calculated using the formula 2d,
where d is an integer between 0 and 15. The default value is 15, which
turns off the responder. At DSTO a responder is not used to locate the
position of the sonar and so the value used is 15.
•
RESPFREQ {d = 0 - 15}. This sets the responder frequency using the
formula 24 kHz + d * 500 Hz, where d is an integer between 0 and 15.
The default value is 7 (or 27.5 kHz). As no responder is used at DSTO
then this variable can take any value. The value used at DSTO is 7 (or
27.5kHz).
•
DESPECKLESWITCH {d = 0,1,2,3} This sets the despeckle mode, where
the values of d = 0, 1, 2, 3 corresponding to off, low, medium and high.
Default is off and this is the value used at DSTO.
•
SPEEDFILTERSWITCH {d = 0,1} This turns the velocity filter on the
waterfall display on or off, with the values of d = 0, 1 corresponding to off
and on, respectively. The default value is on and this is the value used at
DSTO.
•
TVGPAGE {d = 0 - 15} This sets the TVG. Decreasing d decreases the gain
by 3dB and increasing d increases gain by 3dB. A setting of 15 selects a
“flat” TVG curve where the gain is constant. The default is 7 and this is
the value used at DSTO.
•
HEARTBEAT {d = 0 - 256} This sets the heartbeat message divisor.
Heartbeat messages are output once every ‘d’ pings where d is a value
from 0 to 256. Note that a value of 0 shuts off messages and this is the
default value and the value used at DSTO.
•
SPEEDSOUND {d = 140000 – 150000} This sets the speed of sound in the
water in units of cm/s. The default is 150000 cm/s and this is the value
used at DSTO. The accepted range is from 140000 to 160000 cm/s.
•
RESMODE {d = 0,1} Set resolution mode where d = 0 is normal and d = 1
is high resolution. Note ranges of 100m and 150m are not available in
high-resolution mode. Default is normal.
•
BAUDRATE {d = 300, 600, 1200, 2400, 4800, 9600, 19200, 38400} This sets
the baud rate in units of bits/sec for the com 2 port on the TPU. The
default is 4800 (the NMEA standard) and this is the value used at DSTO.
DSTO-GD-0372
•
BATHY {d = 0,1} This instructs the TPU to process bathymetry data. The
Klein 5500 at DSTO, however, did not have the bathymetry option fitted,
and so the value that has been used at DSTO for d is 0.
•
OLDHEADERTYPE {d = 0,1} This instructs the TPU how to construct the
header information in the data and plays a very important role. The two
values of d, namely 0 and 1, correspond to the data formats sdf (sonar
data format) and 5kd (5000 data), respectively, if SonarPro is being used
or if Isis is being used then d must take the value of 1 and this
corresponds to XTF. If d is set to 0 and Isis is being used then the
waterfall display may take on a symmetrical appearance, with one of the
channels being discarded.
•
PINGSPERFILE {d=5000} This instructs the acquisition software to create
data files containing 5000 pings.
It should be evident from the above bullet points that many of the default settings for
the variables are those that are used at DSTO. This is the reason why it has been
remarked on several occasions throughout this document that the downloading of
the startup.ini file by the TPU from the host computer is not necessary for the TPU to
be used with the Klein 5500.
147
DSTO-GD-0372
Appendix C: Klein 5500 Pressure Transducer
Calibration
As outlined in section 5.2.6, the dialogue box for the Klein 5000 Isis server,
KLN5000.exe, (see Figure 57) has a component labelled “compute depth from
voltage”. It is in this window that the calibration of the pressure transducer voltage
for the Klein 5500 sidescan sonar needs to be entered.
To calibrate the pressure transducer and establish what coefficients need to be
entered into this window first remove any old calibration coefficients and set up Isis
so it is receiving data from the sonar. Then lower the sonar into the water at 0.5
metre intervals and using Isis either read off the depth displayed in the Telemetry
panel of the Parameter display window or use the values recorded in any data files
that are generated. Graph the depth from the pressure sensor against actual depth,
with the former being the dependent variable or ordinate and the latter being the
independent variable or abscissa. As Isis only permits a linear calibration then the
scatter between these two values should appear linear. If this is the case, then
calculate the least squares linear fit. This could be done easily using a spreadsheet
program such as Excel. This linear fit should provide the slope of the line (m) and
the ordinate intercept (c) and it is this line that is the new relationship between
pressure transducer voltage (V) and the true depth (D), and is given by the following
formula:
V = mD + c
(1)
As the aim of this exercise is calibrate the pressure transducer so that the true depth
(D) of the sidescan sonar can be calculated using the voltage outputs (V), then
equation#1 needs to be rearranged so that D is the subject of the equation and not V.
When this is performed equation#1 reads:
( m)− (c m) = D (2)
V× 1
This is the form that the equation takes in the dialogue window.
The pressure transducer in the Klein 5500 sonar has not been calibrated for several
years and on the last occasion the relationship between voltage and depth was
determined to be:
V ×13.730 −10.37 = D
148
(3)
DSTO-GD-0372
Appendix D: Formatting Magneto-Optical Disks
As outlined in section 7.2.1, because the data acquisition rates of sidescan sonar are
very high (approximately 200 megabytes in ten minutes) there is a need to be able to
transfer large amounts of data from acquisition computers to post-processing
computers. At DSTO this has been accomplished using removable hard disks and
magneto-optical (M-O) disks.
Before a M-O disk can be used it needs to be low and a high level formatted. M-O
disks are supplied with a low level format but not a high level format. The low level
format is either 512 bytes/sector or 1024, with the former being normally used with
Unix (or equivalent) operating systems and the latter with Microsoft operating
systems. Isis can save data to M-O disks of either low level format, however, it
expects to “see” the low level format of 512 bytes/sector and this is the low level
format recommended by TEI. Isis can only be read M-O disks with a low level
format of 1024 bytes/sector at 10% of their normal rates. The low level format of a
M-O disk, if it has not been previously altered, can be determined by reading it off
the disk’s shutter. The capacity of a M-O disk, namely 600 megabytes, 1.2 Gigabytes
or 2 Gigabytes, gives no indication of the low level format of the disk. The disks
used at DSTO have a capacity of 2 Gigabytes.
The low level format of 1024 bytes per sector can be reduced to 512 bytes/sector by
using the utility scsifmt.exe, located in the directory C:\scsi. Like the command used
to alter or set an M-O disks high-level format, the command scsifmt.exe needs to be
run from within DOS and not from a MS-DOS shell whilst Windows is running. If it
is run from within an MS-DOS window an error message will be spawned. The
command scsifmt.exe can also be used to test (or verify) that the surface of an M-O
disk is free from any bad sectors and if any are found to flag them so they will not be
used during data collection. As conducting a low or high level format deletes any
data on a disc then important data on the disc needs to be backed up before any
formatting is performed. The procedure to back-up an M-O disk is outlined below,
followed by the procedure to set the low-level format:
Section 1 Backing-up M-O disks:
•
•
If using Windows 95, use the Start|Shutdown function to “return to DOS”.
Do not leave Windows 95 running and use a DOS shell window. If using
Windows NT restart the PC with a bootable DOS floppy.
When DOS boots up insert the M-O disk and use the DOS command COPY
or XCOPY to copy the important files to the hard disk (C:\ or D:\).
Section 2 Low-level Format
1. Exit windows and return to DOS by clicking Start|Shutdown|Return to
DOS.
2. Make sure power is being supplied to the M-O drive and insert the M-O disk.
149
DSTO-GD-0372
3. Go to the directory C:\scsi and run the command scsifmt.exe. Do not run this
command before the M-O disk has been inserted into the M-O drive.
4. When the first screen is displayed hit the enter key.
5. Use the arrow keys to select the M-O disk drive that needs its low-level
format of 1024 bytes/sector reduced to 512 and then press the enter key.
6. Then a screen appears asking if the disk needs to be verified or formatted.
Select Format and then press Enter. Confirm that a format is required.
Warning, formatting any computer media will result in any data on the
media being deleted. Check any media that is being readied for
formatting for important data. If data is present that needs to be backed
up, then follow the procedure above.
7. The formatting of a M-O disk may take a while. Once completed, other disks
can be formatted by following steps 5 to 6.
8. When the low-level formatting tasks have been completed, the scsifmt utility
can be exited by hitting the escape (esc) key.
Whether a M-O disk has a low level format of 512 bytes/sector or 1024, each side of a
M-O disk needs one DOS partition before Isis can use it. This is termed the high
level format and can be set using the commands AFDISK or FDISK. AFDISK is an
Adaptec SCSI disk partitioning and high-level formatting utility and can only be
used on SCSI disks and drives that are not controlled by the host adapter BIOS
(which is the BIOS on the SCSI PCI card). Those SCSI hard disks and drives that are
controlled by the host adapter BIOS need to use the DOS command FDISK. The
command used generally at DSTO is AFDISK. The commands AFDISK and FDISK
need to be run from within DOS and not from a MS-DOS shell whilst Windows is
running. If they are run from within an MS-DOS window an error message will be
spawned. The procedure to set the high level format is outlined below. It has been
taken from Appendix D of Volume 2 Isis Users manual.
Warning, formatting any computer media will result in any data on the
media being deleted. Check any media that is being readied for
formatting for important data. If data is present that needs to be backed
up, then follow the procedure below:
Section 3 High Level Format
With the important files copied to the hard disk, the M-O disk is ready for high level
formatting. The procedure to follow for each operating system is listed below.
Windows 95
1. Insert a startup floppy disk labelled for Windows 95 into a: drive and restart the
computer. This will restart the computer in DOS.
2. Wait until the prompt a:> appears.
3. Insert the MO disk into the MO drive on the appropriate side.
4. Type “afdisk” or “fdisk” and hit Enter to start the programs. If DOS cannot locate
these programs then they may be located at C:\APSI or C:\SCSI.
5. Use arrow keys to highlight the target as “... Sony SMO-F541+3” or use the SCSI
number of 5 and hit enter.
150
DSTO-GD-0372
Do not select the SCSI target number of zero (0), as this is the hard disk.
If a SCSI device is selected that is controlled by the host adapter BIOS and afdisk
is being used then an error message will be displayed outlining that the utility
FDISK should be used instead.
6. If a SCSI device is chosen that is not controlled by the BIOS on the host adaptor
(what the utility AFDISK is designed for) then a message will be generated asking
“Use Extended BIOS translation for this >1Gb Drive?” Use arrows to select “Yes”
and hit enter. When this action is performed one of two scenarios will occur,
depending upon whether the disk contains data. These are outlined below:
Case 1: If the disk has previously been formatted then a warning will be spawned
outlining that data will be lost if the reformat is continued. To continue, hit “Esc”.
Then another message will be spawned about format types. Hit “Esc” to continue.
Then select “Standard Hard Disk Format” by using the arrow keys, and then hit
“Enter”. Proceed to step 7.
Case 2: If the disk is unformatted then a message is displayed stating “This disk is
unformatted. --Press <Esc> to continue—“.
7. A table is spawned with the headings “Type, Start, End, Megs” across the top
(see Table 9). If the disk has never been formatted then this table will be empty.
In this case proceed to step 9. If the table is not empty, then the disk has already
been formatted, and may contain data.
If the disk contents are unknown do not continue to step 8 as this will delete all
data on the disk.
Table 9 The table spawned by AFDISK regarding the high level format of a M-O
disk.
Type
DOS
Start
0
End
138
Megs
1090
If the table appears as shown in Table 9 then disk has already been suitably
formatted for use with Isis and does not need reformatting. Proceed to step 10 and
exit the program. If the table is as shown in Table 9 except that the variable “Megs”
reads 1023 then the disk is readable under Windows 95 and NT, but is not formatted
to its full capacity. Proceed to step 8 to reformat the disk to its full capacity. If the
table contains some other entries then also proceed to step 8.
8. If the table is not empty and all the important data has been backed up (see
Backing up M-O above) then first delete all the partitions on the disk. Use the
arrow keys to select a partition, and hit “delete”. Then use the arrow keys to
highlight the “Yes” button in the message “Delete Partition?” and hit enter.
9. The table should now be empty. Hit “Insert” to create a new partition. This
brings up a description of the new partition. Hit “enter”. You will then be asked
“Create Partition?” Use the arrow keys to select “Yes” and hit enter. You may get
a message “Please wait”, and then a new entry will be created in the table. It
should read as described in Table 3.
151
DSTO-GD-0372
10. If the other side of the M-O disk needs high level formatting then eject the disk,
turn it over and put re-insert it into the M-O drive. Follow the procedures
outlined in steps 5 to 9. If other M-O disks need formatting then eject that just
formatted and insert those needing formatting. Also, follow steps 5 to 9.
11. If no other disks need high level formatting then exit AFDISK by hitting “Esc”
twice. Then use the arrow keys to select “Yes”, you want to exit AFDISK, and hit
“Enter”.
12. Now enter “Exit” at the DOS prompt or hit “Ctrl + Alt + Del” to reboot the
machine and return to Windows.
Note: If at any stage a message is spawned stating that no context-specific help is
available at this time, then this should be ignored and continue by hitting “Esc”. If
continuing is not possible then exit AFDISK and try restarting it, making sure the
MO being formatted is already in the drive.
152
Page classification: UNCLASSIFIED
DEFENCE SCIENCE AND TECHNOLOGY ORGANISATION
DOCUMENT CONTROL DATA
2. TITLE
Setup and Troubleshooting Procedures for the Klein 5500
Sidescan Sonar
1. PRIVACY MARKING/CAVEAT (OF
DOCUMENT)
3. SECURITY CLASSIFICATION (FOR UNCLASSIFIED REPORTS
THAT ARE LIMITED RELEASE USE (L) NEXT TO DOCUMENT
CLASSIFICATION)
Document
Title
Abstract
4. AUTHOR(S)
5. CORPORATE AUTHOR
Colin Andrew and Amy Young
Systems Sciences Laboratory
PO Box 4331
Melbourne Vic 3001 Australia
6a. DSTO NUMBER
6b. AR NUMBER
DSTO-GD-0372
AR-012-851
6c. TYPE OF REPORT
General Document
8. FILE NUMBER
9. TASK NUMBER
10. TASK SPONSOR
9505/25/76
NAV 00/035
COMAUSNAVMCDGRP
13. DOWNGRADING/DELIMITING INSTRUCTIONS
(U)
(U)
(U)
7. DOCUMENT DATE
November 2003
11. NO. OF PAGES
160
12. NO. OF
REFERENCES
14
14. RELEASE AUTHORITY
Chief, Maritime Operations Division
15. SECONDARY RELEASE STATEMENT OF THIS DOCUMENT
Approved for public release
OVERSEAS ENQUIRIES OUTSIDE STATED LIMITATIONS SHOULD BE REFERRED THROUGH DOCUMENT EXCHANGE, PO BOX 1500, SALISBURY, SA 5108
16. DELIBERATE ANNOUNCEMENT
No Limitations
17. CASUAL ANNOUNCEMENT
18. DEFTEST DESCRIPTORS
Yes
Manual, sidescan sonar, shiptowed sonar, scanning sonar, underwater acoustics.
19. ABSTRACT
This document outlines in detail all facets associated with the set up and usage of the Klein 5500 sidescan
sonar. In particular this document outlines: (1) the different types of hardware that are required, how
they need to be set up and networked, (2) how to set up and use the acquisiton software packages Isis
and SonarPro, and (3) how to detect, analyse and trouble-shoot incorrect set up and malfunctions in the
hardware and software.
Page classification: UNCLASSIFIED