1
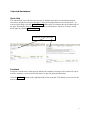
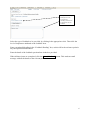
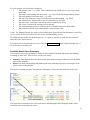
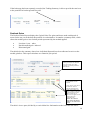
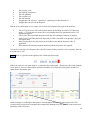
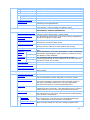
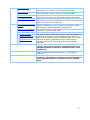
QSMART Reporting System Client User Manual Contents Login ............................................................................................................................................................................. 3 The Initial Login ....................................................................................................................................................... 3 Change Password ......................................................................................................................................................... 4 Password ................................................................................................................................................................... 4 Forgotten Password ................................................................................................................................................... 4 Help and Assistance ..................................................................................................................................................... 5 Quick Help ................................................................................................................................................................ 5 Feedback ................................................................................................................................................................... 5 Basic Tips on Navigating the System.......................................................................................................................... 7 Moving From One Screen Page to the Next.............................................................................................................. 7 Using the Screen Bars ............................................................................................................................................... 7 Sorting Screen Information by Selected Headings.................................................................................................... 8 Viewing Information for another Portfolio without Leaving the Screen................................................................... 8 Recalculating the Portfolio .......................................................................................................................................... 9 Recalculate the Portfolio to a Specific Date – ‘Recalculate To’ ............................................................................... 9 Overview .............................................................................................................................................................. 9 How to Recalculate the Portfolio.......................................................................................................................... 9 Income and Expenses................................................................................................................................................. 10 Overview ................................................................................................................................................................. 10 Searches ...................................................................................................................................................................... 11 Select a Range of Transactions within a Single Portfolio ....................................................................................... 11 Understanding the Reports ....................................................................................................................................... 12 Portfolio Valuation – by Security............................................................................................................................ 12 Portfolio Asset Class Summary............................................................................................................................... 13 The Portfolio Performance ...................................................................................................................................... 14 Holding Performance .............................................................................................................................................. 15 Trading Summary.................................................................................................................................................... 17 Realised Gains......................................................................................................................................................... 18 Unrealised Gains Report ......................................................................................................................................... 20 Reports - Creating and Printing ............................................................................................................................... 22 A Guide to the Menus ................................................................................................................................................ 23 2 Login The Initial Login Access the login screen via the Quantum website at www.quantumgroup.com.au then follow the link at the bottom right hand corner of the home page The following will display Enter the login details - user id and default password and then click Login to proceed. If the user wishes Praemium to remember the user id, ensure the “Remember user ID” box is checked with a tick. The first time the user logs in; a screen will appear to change the password from the default Enter the current password – “changeme” Enter the new password. This must be at least 6 characters and is case sensitive. Confirm the password. Once this has been completed successfully, the user will be taken to the transactional site for the service. Change Password Password Likewise, users can change their password at any time. Go to Maintenance on the menu bar, select the sub menu User Maintenance and click on Change Password. The following screen displays The user will be required to enter the current password, then enter the new password and in the bottom box confirm the new password. Remember, the password must be at least 6 characters and is case sensitive. HELP! What happens if I forget my password? Forgotten Password If users in the service forget their password, they must contact Quantum to reset it. Quantum does not know clients passwords and will never ask for a password. Quantum will reset the password to the default. The user can then login to the system and change the password, per the process discussed above. Use the default as the current password. Help and Assistance Quick Help This information is provided on most screens. It includes short notes on what that particular screen does and how to navigate through it. The Quick Help defaults to close down mode. To activate Quick Help, click the Quick Help>>>button which is located at the top left hand side of the page, beneath the menu bar. It will open up to reveal the notes. Likewise, it can be closed down again by clicking Quick Help<<< Click here to open and close Feedback Feedback is an interactive Help process initiated by emailing a message to be actioned. It can be used for assistance, to alert errors in the data or to provide general information. Click the Feedback button on the right hand side of the menu bar. This brings up a screen for the user to enter details. 5 Make your selection by clicking these circles You must enter something in these boxes to describe the item for Feedback Select the type of feedback to be provided, by clicking in the appropriate circle. Then click the level of importance attributed to the feedback item. Enter a meaningful heading in the “Feedback Heading” box, as this will be the reference point in any subsequent communication. Enter the detail of the feedback question/item in the box provided. When all these items are completed, click the Submit Feedback button. This sends an email message with all the details to the relevant personnel. 6 Basic Tips on Navigating the System As a general rule, throughout Praemium, where it is required to click a button to activate a process such as Save, the button must be clicked. Do NOT use the “enter” key as a substitute. The Praemium process will not respond and in some cases cause the user to be aborted from the session. When the user wishes to return to the previous screen, click Back on the menu bar. If the user wishes to go straight back to the main menu - Portfolio List, click Main on the menu bar. The following are some handy hints on navigating Praemium. • • • • Moving from one screen to another Using the screen bars to get from one part of the screen to another Sorting the information on the screen by selected headings Going straight to information for another portfolio Moving From One Screen Page to the Next The default number of lines of data in a screen page is 10. If there is more than one screen page of information the word next >>> at both the top and the bottom of the screen will change colour. Click Next>>> and the screen will scroll to the next page. Likewise, once the bottom of the list of information is reached and the user wishes to scroll back to a previous screen, click <<<Previous. The number of lines to a screen page can be changed and this is discussed in User Preferences Using the Screen Bars If the user cannot see all of a screen in the screen view, use the blue bars at the right hand side and across the bottom to bring the required information in to view. Click on the bar and drag it up/down or left/right. Click and drag the blue bars. Sorting Screen Information by Selected Headings Some of the column headings in a grid of screen data can be clicked to sort the information. If this is the case, the heading appears as a button. For example, in the Transaction History screen, the default is by Security. If the user wishes to view the information in date order, click on the column heading Date and the information will redisplay in date order. Once for descending order, click again for ascending order. Viewing Information for another Portfolio without Leaving the Screen The user may wish to view information for another portfolio. This can be done within a screen if the id of the alternate portfolio is known. Enter the id in the box entitled “Portfolio”. Click the switched to that portfolio. to the right of the box and the user is 8 Recalculating the Portfolio Recalculate the Portfolio to a Specific Date – ‘Recalculate To’ Overview This is Praemium’s most important function. Activating the “Recalculate To” process, not only updates the trading activity with the relevant corporate actions and the income transactions, it also reprocesses the CGT calculations and the performance to the selected “recalculate to” date. How to Recalculate the Portfolio Enter the date the portfolio is required to be recalculated to in the box to the right of the “Recalculate To” button, then click the “Recalculate To” button. The default is “Today” which is the current date; though any other date can be selected – xx/xx/xxxx. To view the results of this recalculation go to Transaction History, in the Trading Activity Menu. All reports are amended accordingly. Enter the date here and then click the Recalculate To button The Transaction History screen for the portfolio now displays the buy and sell transactions together with the auto-generated transactions (corporate actions) which have been created from the “Recalculate To” process. At the top of the page under the menu bar, the “Processed To” date is updated to show the date to which the portfolio has been recalculated. If the portfolio is recalculated to “Today” then the current date should be displayed. 9 Income and Expenses Overview Income for all ASX listed stocks and most managed funds is updated daily. All ASX listed stocks components are recorded, such as franked, unfranked and imputation credits. For listed trusts any estimated tax-free and tax deferred amounts are also accounted for. To view income entries, go to Trading Activity on the menu bar and click on Income Details. The following screen displays. 10 Searches Select a Range of Transactions within a Single Portfolio In the Trading Transaction screens, Income and Cash Books, a range of transactions can be selected within an individual portfolio. This can be for a date range across all securities, a date range for one security or all transactions for a security. For example, in the Transaction History screen, click Search. The screen redisplays To search for a date range, highlight “Inception” and overwrite with the start date xx/xx/xx. Highlight “Today” and over write with the end date xx/xx/xx. If only one security is required, highlight “All Sec” and overwrite with the security code. Click the green Submit button. E.g. The screen redisplays with the results This search process is available in the Income screen and also in the Cash Book, but not for a security. 11 Understanding the Reports Under the menu Portfolio Details, there is a selection of screens that provide information about the portfolio. All of these screens can be printed as reports. See Creating and Printing The screens deal with: • Portfolio Valuation – by Security • Portfolio Asset Class Summary • Portfolio Performance • Holding Performance • Trading Summary • Realised CGT – detailed and summary • Unrealised CGT – detailed and summary Every screen report has the following information which appears under the menu bar • The user ID – e.g. Admin Istrator • The selected portfolio for which the report is displaying – e.g. Demo 301 • The ‘Processed To’ date. The date the information for the portfolio represents. This can be amended by activating the “recalculate to” process to the required date. Portfolio Valuation – by Security The Portfolio Valuation – by Security is a summary of the portfolio holdings. It displays the total cost of the investments in the portfolio and the total current value at the processed to date, based on the day’s closing prices.* The Gain/ (Loss) is the nominal difference between the total value and the total cost – NOT the CGT gain or loss. The estimated income is indicative only and is based on the income generated by the holdings, over the previous 12 month period. The estimated yield is the estimated income as a percentage of the market value of the portfolio. The portfolio can be displayed either in alphabetical order, under categories such as ASX Listed or Managed Funds, or by GICS (Global Industry Classification Standard). The GICS can be toggled on or off using the GICS indicator Beneath the portfolio totals, is a table showing summary details for each holding. 12 For each security, the following is displayed • The Security code – e.g. AMC. This could also be the APIR code or service/personal asset code • The name of the holding and description – e.g. Amcor Ltd Ord (being ordinary shares) • The total quantity held at that time – e.g. 2500 • The unit cost, being an average of all the parcels for that holding – e.g. $5.40 • The adjusted cost (adjusted for return of capital etc) e.g. $13,500 • The unit value – being the Value divided by the quantity e.g. $8.24 • The Value – based on the closing price for the day. • The estimated annual income, based on prior 12 months income for the holding • The estimated yield as a percentage of the current market value. *Note: For Managed Funds, the most recent available price issued by the Fund Manager is used. For service assets, the last price entered by the service for that holding is used. Dividends that the holder has an entitlement to – i.e. gone ex, but not yet paid, are also reported under the code “DIVSNOTPAID” This report can be downloaded into excel. Click the Export to Excel button on the left hand side of the screen above the data grid. Portfolio Asset Class Summary The Portfolio Asset Class Summary is similar to the Portfolio Valuation, but groups the holdings according to asset class. There are two levels to the report. • • Summary. This displays the total values for the class and percentage of the total current market value of the portfolio Detail. This shows the holdings that make up the class with their respective percentages of the market value of the portfolio. The report is expanded to show the detail by clicking the + box at the left hand side of the class. Summary Detail The asset class is predefined for ASX listed shares and Managed Funds. Managed Funds can be classified across more than one sector 13 Service and personal asset holdings must have their asset class defined when they are set up. Go to Maintenance on the menu bar and select Asset Maintenance, then Service Assets. In the screen that displays to set up the holding details, enter the asset class from the drop down box. This report can be downloaded into excel. Click the Export to Excel button on the left hand side of the screen above the data grid. The Portfolio Performance This measures the performance of the portfolio between two selected periods at summary level. The report will display for the current quarter to date. Enter the required start and end dates and then click the Recalculate button. The information will redisplay for the chosen date range. Value at opening date is the balance at the start of business on the day – i.e. in this case, it should agree to the total market value per the Portfolio Valuation Report for 30/06/2004. 14 Income: This is the income received for the period. Realised Capital Gain: is the movement in the gross capital gain - as opposed to taxable gainin the period.. Unrealised Capital Gain: is the movement between the difference between the capital value and capital cost in the period. If this is a loss it will appear in the “Less” sector Net Contributions in: is a balancing figure and represents net inflows into the fund. If this is a net outflow it will appear in the “Less” sector. Click the->Reconciliation button to access a spreadsheet with back up schedules for this amount. Expenses: are the expenses paid for the period. The Closing Balance: is the result of the opening balance plus and minus the various components for the period and should agree to the total market value per the Portfolio Valuation Report for the end date of the period. The Gross Gain: is the movement between the opening and closing values adjusted for net contributions in/out. In the example: Closing Value 726,196.76 Less: Opening value (523,687.99) Less: Net Contributions In (150,720.00) = 51,788.77 Tax Credit Amount: is the value of tax credits received on the income received for the period. A The tax credits can be omitted from the screen and percentage calculation by switching off the option at service level in the Service Maintenance screen Net Performance: is based on the Gross Gain plus the Tax Credit Amount (if this is switched on – see above) divided by the Average Portfolio Value. In the example: • • • Gross Gain Tax Credit Amount Divided by: Average Portfolio Value 51,788.77 0 = 51,788.77 688,275.29 7.52%. The performance can also be benchmarked to one of a selection of indexes. A The benchmark can be set up at service level in the Service Maintenance screen, but can be overwritten at portfolio level, simply by selecting an alternative index from the drop down box in the screen. Select index from the drop down box Holding Performance The Holding Performance Report shows the performance of the individual holdings in the portfolio over a specified date range using asset weighted, compound return methodology. 15 Once an account has been activated, the performance period will default to 1 year to the current date as a result of the daily roll forward function. However, the period can be changed by entering the required from/to dates in the relevant boxes and clicking Recalculate. The performance is measured on both capital and income for the selected period and can be reviewed combined or independently. There is a select criteria panel, which provides the options to sort the information. You can sort by • Ascending or descending codes – i.e. alphabetically • Ascending or descending Performance • Ascending or descending Gain • Ascending or descending Impact Just click on your preferred method The above sort selection can be applied to • Capital and Income – i.e. Total Gain • Capital only, or • Income only Click the appropriate circle. The data table is sorted depending on the selection made. The information displays in dollar values and percentages. Click Print Reports on the menu bar to print the performance report using the sort criteria you have selected. 16 Trading Summary The Trading Summary provides the summary profit or loss for a financial year or part thereof as a result of trading for the period. It is NOT a tax report. It measures the nominal profit or loss on both the realised and unrealised positions. Where appropriate, in the situation where short sell trading has been used, the report shows the trading figures for the long and short portfolio separately. Unrealised Gains In the above example, the “Gain/Loss for Period” of $($81,829) is the movement of the difference between the market value and cost from 30/06/2002 and 30/06/2003. The “Unpaid Income” represents dividends or distributions where the holder has an entitlement, but the cash has not been received as at 30/06/2003. This amount will include any imputation credits due. Realised Gains The realised gain (loss), is the difference between the proceeds and cost for the trading period, plus income actually received in the period since the previous year end. (The income is adjusted for any accrual - unpaid income - at the end of the previous year end.) The total Gain/(Loss) will be the aggregate of the unrealised and realised gains and losses. In our example this is a net loss of $47,307. Turnover Statistics The Trading Summary also provides details of the trading turnover statistics, including the total value of both buys and sells for the trading period. The takeover percentage is the total value of turnover divided by the closing market value of the trading period. In our example this is $80,160/$379,597 * 100 – 21.12% 17 If the brokerage has been separately recorded, the Trading Summary is able to provide the total cost to the portfolio for brokerage and fees paid Realised Gains The Realised Gains Report displays the Capital Gains Tax gains and losses made on disposal of assets for the tax year at the date the portfolio is recalculated to. It contains a summary table, which shows the taxable gain or loss for that period represented by the method applied. • • • Less than 1 year – other. Non discounted gain - indexed. Discounted gain. The table below the summary shows how individual disposals have been allocated to arrive at the taxable gain/loss. This report calculates on a financial year period. This is the summary and shows the taxable gain/(loss) for the financial year or the current year to date, depending on when the portfolio is recalculated to. Each line shows the detail of the calculation for each disposal These columns, to the left of the blue line, show the selected taxable amounts based on the method used These columns, to the right of the blue line, show the detail of each type of gain/loss as it applies to each disposal and is for information only NOTE: The 2 sections either side of the blue line display as one table on the screen The table is in two parts, divided by a vertical blue line. Information to the left of the line shows 18 • • • • • • • The security code. The holding description. The sale quantity. The original cost. The sale amount. If applicable, the selected – optimised – capital gain on the disposal, or If applicable, the loss on the disposal Details of how these gain or loss values were selected are shown to the right of the blue line. • • • • • Non-CGT gain or loss. This will include details for holdings for which CGT does not apply – e.g. fixed interest, short sells or for holdings that were purchased before CGT legislation applied. Gross Gain. This represents the gain before any discounting or indexing is applied. Other Gain. If a holding has been disposed of within 12 months of acquisition, any gain will appear here. Indexed gain shows the gain between the indexed cost and the disposal value, if applicable. Discounted Gain includes amounts that have had the discount value applied. If a rule does not apply to a disposal, the cell will be blank. If the portfolio is for a company, then the discount rate is zero Help! There is a question mark against a line. What does this mean? Where the system is set to the default - to minimise the taxable gain - Praemium will switch methods where there is a loss to offset and the optimal calculation is to offset this gain against an indexed rather than a discounted gain. In this example, even though at first glance, it would appear that the discounted gain of $275.07 would be the best selection, Praemium has changed the method to use the indexed result to take full advantage of the $550 loss. 19 Total Gross Gain, excluding $300 non CGT gain, is $8235 The gross CGT gain is The loss available to offset is Gain for discounting at 50% $8235 $550 $7685 Taxable Gain, after discounting $3842.50 By switching the method to apply the loss to the “best fit” indexed calculation, Praemium has reduced the taxable gain to $3,830 in this instance. (Per Summary.) This report can be displayed in both detail and summary format. Unrealised Gains Report The Unrealised Gains Report displays the Capital Gains Tax gains and losses that would be made on disposal of assets at the date the portfolio is recalculated to. The information is in the same format as the Realised Gains Report. HELP! What if I wish to know the impact of a particular disposal on the portfolio’s realised gain? “What If” scenarios can be created. Click the green What If button on the screen. The following screen redisplays, now including the realised gains summary box. 20 Click in the box to the left of the Security to select the holdings to be used in the “What If” calculation. More than one can be clicked. Then click the mauve Recalculate button to see the result. The selected unrealised gains/losses have been merged into the Realised position. Click the Close What If button This report can be viewed in both detail and summary format 21 Reports - Creating and Printing To review, create and print reports for a single portfolio, click Print Reports on the menu bar. The following screen displays. Select the File and Style formats from the drop down boxes. The usual file format is Portable Document (if the user has access have Adobe Acrobat reader) or HTML viewer. The other file formats are useful for merging reports into applications such as Word or Excel or Rich Text format for downloading into other computer applications. The Formats enable reports to be printed on plain paper or to be merged into other pre printed mediums. Select ranges for certain reports by adjusting the dates in the boxes and change criteria by selecting the options available in the drop down boxes. All other dates are defined by the recalculate to date. Select the report(s) to print, by clicking in the Select Report Box. Select one or more reports, as required. Once the selections have been made, click Show Report and follow any prompts to print. Remember, the content of the reports will reflect the date that the portfolio has been recalculated to and the searches submitted. A Guide to the Menus Across the top of the screen, there is a menu bar, which will allow you to navigate your way around Praemium. When the cursor is placed over a selection on the bar, if there are further options, a sub-menu appears with those options. Just click on your menu choice and you will be taken straight to the relevant screen. Menu Bar The following table is a list of the complete menu and submenu options and provides a brief explanation for each. Main Menu Logout Sub Menu Detail This will log the user out of the current session. (Note: This only appears on the main menu) This will take the user back to the main menu Main Back This will take the user back to the previous screen Menus for maintaining the portfolio’s profile & user options. Maintenance User Maintenance Change User Details Change User Preferences Change Password s u b m e n u For user detail changes, such as change of address and contact details For setting up and maintaining user preferences, such as the number of lines per page. Change your password here. If the password has been forgotten, contact the System Administrator. Portfolio Management s u b m e n u Portfolio Details Portfolio User Links Registered Addresses Portfolio Broker Links Portfolio Bank Links Portfolio Tax Details Portfolio Billing Balance History Lock Tax Year For amending portfolio details, such as the name, tax & consolidation types and active status etc Link portfolios to users and amend linked users’ access levels here. Can be used to capture an address if required – used for client billing Add/amend broker details for automatic contract note upload. There is also a sample letter to assist with instructing a broker to set up this process. Set up bank links for the bank details upload process Not yet available Creates the billing profile and links the portfolio to a billing structure Not yet available Locks in all the transactions to a nominated year end. 23 Billing Billing Schedule Fee Tables Asset Maintenance Personal Assets Service Assets Yield Overrides Asset Class Targets Data Upload Data Download Portfolio Details Portfolio Valuation – by Security Portfolio Asset Class Summary Set up billing schedules for portfolios Set up fee tables for portfolios Maintain assets at portfolio level Maintain Assets at service level Maintain yields for service assets Set up asset class targets for portfolio comparison. Process to upload cost history and bank details from some commonly used applications. For download into BGL Simple Fund – Covered in a separate user manual - and for certain ex ‘Advent’ Users Various Screens providing portfolio holding, performance and CGT information Portfolio Summary, details as at the "processed to" date, listed by code in alpha order. Toggle GICS. The Portfolio by Asset Class. This screen can be expanded to reveal the holdings in each class. Portfolio Performance This report provides performance information for the portfolio for a selected date range Holding Performance A report providing details of the portfolio’s performance, offering various options in both content and sorting. Trading Summary Reports on accounting gain or loss for the current year to date. The realised gains, as at the "processed to" date, comprising information regarding gain type (discount, indexed or other) and detail for each disposal. The unrealised gains, as at the "processed to" date, comprising gain/loss for each holding or by tax lot. This also includes a "What If?" function. Realised Gains Detailed Unrealised gains Detailed Summary Summary Portfolio Search A facility to search for data across portfolios Portfolio Selection for Reports Download Report Pack Select portfolios for bulk reporting Trading Activity Recalculate Portfolio Cash Book Transaction History Buys/Sells Short Selling S u bm e n u Options – Write/Take Options - Exercise Monitor progress of report file and maintain files for created report packs. Menus for data entry. Allows the user to recalculate the portfolio from any screen. Transaction details for a cashbook that is part of the portfolio can be entered here either manually or from an upload This screen shows all the transactions, including buys, sells, short sells & options, which have been manually entered, and auto generated transactions. The auto-generated transactions should be reviewed and edited here. The buy and sell trades are entered here, either through the upload process or manually. This also allows you to view the trading activity without the auto-generated transactions. Short Sell (open & close) transactions are entered here. This also allows you to view short sell transactions independently from all other transactions. Write/Take and subsequent close out transactions for ETO’s are entered here. You can also view all ETO transactions here, independently from all other transactions Enter exercise details for ETO’s & company options here. 24 Take Up Rights Convert Notes Convert Preference Shares Carried Forward Losses Dividend Reinvestment Details Change Disposal Alloc. Method Income & Expenses S Income Details u Income Declared b not Paid m Expense Details e n u Print Reports System Management Feedback The system will automatically lapse rights. If all or some were taken up, use this screen to enter the details. The system will automatically redeem notes. If all or some were converted, use this screen to enter the details. The system will automatically redeem pref. shares. If all or some were converted, use this screen to enter the details. Enter any unused prior year capital losses here. This information should be verified and is needed to offset against gains in the current financial year. If the user participates in a DRP (or has done so), enter the company details here. This will allow the system to enter automatically, DRP transactions as appropriate. Enables the user to change the disposal method across the portfolio for a chosen date range The system will automatically update income information for ASX listed securities and most managed funds. However, other income details must be entered manually here. These reports will display information using selected criteria. Expenses can also be tracked by entering transactions manually. Click here to access the screen to set up printed reports. They can be created, reviewed & printed, be merged into Excel or Word or downloaded into other applications. System Administrator Access Only – described in Section 1 This screen provides a facility for the user to submit questions, information, comments and request help. It sends the information to Praemium Service staff by email. 25