1
Compendium
of Clinical
and Health
Indicators
November 2010
Data
Definitions
and User
Guide for
Computer
Files
Edited by
Azim Lakhani
Henryk Olearnik
Daniel Eayres
© Crown Copyright
i
COMPENDIUM OF CLINICAL AND HEALTH INDICATORS
Principal Contributors
Azim Lakhani, Henryk Olearnik, Daniel Eayres,
Alison Neave, Sam Widdowfield
Produced by
The NHS Information Centre for health and social care
ii
Disclaimer
This work is carried out byThe NHS InformationCentre for health and social care (NHS IC). All views
expressed in this publication are those of the contributors and not necessarily those of the NHS IC. While
every attempt is made to check data, the NHS IC cannot accept responsibility for inaccuracies in data from
external sources.
Copyright and Disclosure Notice
All material in the Compendium of Clinical and Health Indicators is Crown copyright. The material comes
from a variety of sources, each acknowledged individually. There are some restrictions to the use of the
Compendium data and some disclosure-related constraints (see accompanying updated disclosure letter).
The following is a general guide:
Permitted use (NHS family only): users are granted permission to access this material and to download it
onto electronic, magnetic, optical, or similar storage media provided that such activities are for NHS and
related purposes only.
Restricted use (non-NHS): users must not copy, distribute, or publish any of the material for use outside
the NHS without the formal permission of the Controller of Her Majesty's Stationery Office, and without
applying as appropriate the disclosure rules set out by DH / ONS.
To re-use Crown copyright information you require a Core Click-Use Licence ('Core Licence') from HMSO.
This licence is free of charge, is valid for five years and allows the licensee to re-use the majority of 'core'
Government information that is subject to Crown copyright protection. The Compendium data fall within the
scope of the Core Licence.
See http://www.clickanduse.hmso.gov.uk/online/pLogin.asp for further information. Confirmation of the Core
Licence is instantaneous: on submission of the application a licence number is emailed immediately.
Requests under the Freedom of Information (FOI) Act 2000: The appropriate source department must be
consulted before the release of any information under the FOI Act 2000 (see accompanying updated
disclosure letter).
iii
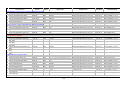
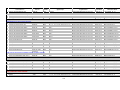
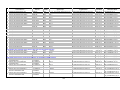
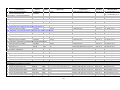
CONTENTS
INTRODUCTION
1
HEALTH TOPICS
General population indicators
Estimates of resident population
GP relevant population estimates
Indices of Deprivation 2007
ONS area classification
Composition of the Census count of resident population
Census count of resident population by age and sex
Communal establishments and their populations
Economic position of residents
Ethnic group and country of birth
Residents in households
Dependent children in households
Pensioners in households
Educational qualifications
Social class as defined by occupation of household reference person
National Statistics Socio-Economic Classification (NS-SEC) as defined by own occupation
Lone parent families with dependent children
Standard of health in preceding 12 months
Provision of unpaid care
Health of providers of unpaid care
Religion
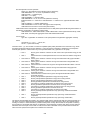
5 7 8 10 12 14 16 18 20 22 24 26 28 30 32 34 36 38 40 42
Risk factors
Fat consumption
Body Mass Index
Adults who are overweight
Obesity
Cigarette smoking
Cotinine level
Alcohol consumption
Fruit and vegetable consumption
Obesity among GP patients
Smoking among patients with selected conditions
Smoking cessation advice for smokers with selected conditions
44 46 48 50 52 54 56 59 61 63 65
General health
Limiting long-term illness
Inability to work due to permanent sickness
Mortality from all causes
Mortality from causes considered amenable to health care
Life expectancy
Self-assessed general health
Limiting longstanding illness
Acute sickness
Adults on prescribed medication
General Health Questionnaire GHQ12 score
Emergency hospital admissions: all conditions
Emergency hospital admissions: acute conditions usually managed in primary care
Emergency hospital admissions: chronic conditions usually managed in primary care
Emergency readmissions to hospital within 28 days of discharge
Years of life lost due to mortality from all causes
Deaths at home from all causes
67 69 71 73 76 78 80 82 83 85 87 90 93 97 103 105
Infant and child health
Vaccination for measles, mumps and rubella
Vaccination for whooping cough
Incidence of measles
108 109 111 iv
Incidence of whooping cough
Incidence of all central nervous system anomalies
Incidence of anencephalus
Incidence of spina bifida
Incidence of Down syndrome
Incidence of cleft palate and/or cleft lip
Low birthweight births
Stillbirths
Perinatal mortality
Postneonatal mortality
Mortality in infancy
Hospital procedures: orchidopexy
Emergency hospital admissions: children with lower respiratory tract infections
Emergency hospital admissions: children with gastroenteritis
Emergency hospital admissions: children with asthma
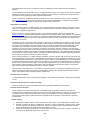
113 114 115 116 117 119 120 121 122 123 124 125 128 132 136
Oral health in children
Oral health in children: decayed teeth
Oral health in children: missing teeth
Oral health in children: filled teeth
Oral health in children: decayed/missing/filled teeth
Oral health in children: experience of dental decay
Oral health in children: percentage with decayed teeth
Oral health in children: decayed teeth in children with active dental decay
Oral health in children: decayed/missing/filled teeth in children with dental decay
Oral health in children: the Care index
139 141 143 145 147 149 151 153 155
Pregnancy
Fertility
Live births in NHS hospitals
Conceptions
Abortions
Abortions by gestational age
Abortions performed in the NHS and privately
Total period abortion rate as percentage of the potential fertility rate
Maternal mortality
157 159 160 162 164 165 166 167
DISEASES AND INJURY
Accidents
Hospital episodes (admissions): accidents
Mortality from accidents
Mortality from accidental falls
Mortality from skull fracture and intracranial injury
Mortality from land transport accidents
Major accidents
Years of life lost due to mortality from accidents
Years of life lost due to mortality from accidental falls
Years of life lost due to mortality from land transport accidents
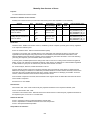
169 171 173 175 177 179 181 183 185
Asthma
Mortality from asthma
Wheeze or diagnosed asthma
Prevalence: asthma and prescribed medication
Prevalence: asthma with measures of variability or reversibility
Asthma review among patients with asthma
Years of life lost due to mortality from asthma
187 189 190 192 194 196
Bronchitis and other chronic obstructive pulmonary disease
Mortality from bronchitis and emphysema
Mortality from bronchitis, emphysema and other chronic obstructive pulmonary disease
Prevalence: chronic obstructive pulmonary disease
Prevalence: chronic obstructive pulmonary disease confirmed by spirometry
FeV1 checks for patients with chronic obstructive pulmonary disease
v
198 200 202 204 206 Inhaler technique checks for patients with chronic obstructive pulmonary disease
Vaccination: influenza, for patients with chronic obstructive pulmonary disease
Years of life lost due to mortality from bronchitis and emphysema
Years of life lost due to mortality from bronchitis, emphysema and other chronic obstructive pulmonary disease
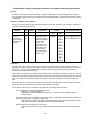
208 210 212 214
Cancers
All cancers
Incidence of all cancers
Mortality from all cancers
Deaths at home from all cancers
Years of life lost due to mortality from all cancers
Prevalence: all cancers
216 218 220 222 224
Bladder cancer
Incidence of bladder cancer
Mortality from bladder cancer
Survival following diagnosis of bladder cancer
Deaths at home from bladder cancer
Years of life lost due to mortality from bladder cancer
226 227 229 232 234
Breast cancer
Incidence of breast cancer
Mortality from breast cancer
Survival following diagnosis of breast cancer
Deaths at home from breast cancer
Breast screening programme coverage
Years of life lost due to mortality from breast cancer
236 237 239 242 244 246
Cervical cancer
Incidence of cervical cancer
Mortality from cervical cancer
Survival following diagnosis of cervical cancer
Deaths at home from cervical cancer
Cervical screening programme coverage
Cytology: cervical cancer screening
Years of life lost due to mortality from cervical cancer
248 249 251 254 256 258 260
Colorectal cancer
Incidence of colorectal cancer
Mortality from colorectal cancer
Survival following diagnosis of colon cancer
Deaths at home from colorectal cancer
Years of life lost due to mortality from colorectal cancer
262 264 266 269 271
Hodgkin's disease
Mortality from Hodgkin's disease
Years of life lost due to mortality from Hodgkin's disease
273 275
Leukaemia
Mortality from leukaemia
Years of life lost due to mortality from leukaemia
277 279
Lung cancer
Incidence of lung cancer
Mortality from lung cancer
Survival following diagnosis of lung cancer
Deaths at home from lung cancer
Years of life lost due to mortality from lung cancer
281 282 284 287 289
Oesophageal cancer
Incidence of oesophageal cancer
Mortality from oesophageal cancer
Survival following diagnosis of oesophageal cancer
Deaths at home from oesophageal cancer
Years of life lost due to mortality from oesophageal cancer
291 292 294 297 299
vi
Prostate cancer
Incidence of prostate cancer
Mortality from prostate cancer
Survival following diagnosis of prostate cancer
Deaths at home from prostate cancer
Years of life lost due to mortality from prostate cancer
301 302 304 307 309
Skin cancer
Incidence of malignant melanoma
Incidence of skin cancers other than malignant melanoma
Incidence of all skin cancers
Mortality from skin cancers other than malignant melanoma
Years of life lost due to mortality from malignant melanoma
Years of life lost due to mortality from skin cancers other than malignant melanoma
311 312 314 318 320 322
Stomach cancer
Incidence of stomach cancer
Mortality from stomach cancer
Survival following diagnosis of stomach cancer
Deaths at home from stomach cancer
Years of life lost due to mortality from stomach cancer
324 325 327 330 332
Cardiovascular diseases
All circulatory diseases
Mortality from all circulatory diseases
Years of life lost due to mortality from all circulatory diseases
334 336
Chronic rheumatic heart disease
Mortality from chronic rheumatic heart disease
338
Coronary heart disease
Mortality from coronary heart disease
Mortality from acute myocardial infarction
Mortality from ischaemic heart disease other than acute myocardial infarction
Deaths within 30 days of emergency admission to hospital: myocardial infarction
Deaths within 30 days of a hospital procedure: coronary artery bypass graft
Prevalence: coronary heart disease
Exercise testing / specialist referral for patients with newly diagnosed angina
Blood pressure in patients with coronary heart disease
Cholesterol levels in patients with coronary heart disease
Antiplatelet / anti-coagulant therapy for patients with coronary heart disease
Beta blocker therapy for patients with coronary heart disease
ACE inhibitor therapy for patients with myocardial infarction
Vaccination: influenza, for patients with coronary heart disease
Years of life lost due to mortality from coronary heart disease
340
342 344 346 350 355 357 359 361 363 365 367 369 371
Heart failure
Prevalence: heart failure
Prevalence: heart failure confirmed by echocardiogram or specialist assessment
ACE inhibitor therapy for patients with heart failure due to left ventricular dysfunction
373 375 377
Hypertensive disease
Mortality from hypertensive disease
Systolic blood pressure
Diastolic blood pressure
High blood pressure
Treated and controlled high blood pressure
Prevalence: hypertension
Controlled high blood pressure in patients with hypertension
Years of life lost due to mortality from hypertensive disease
379 381 383 385 387 389 391 393
Stroke
Mortality from stroke
Deaths within 30 days of emergency admission to hospital: stroke
Emergency hospital admissions: stroke
395 397 401 vii
Emergency readmissions to hospital within 28 days of discharge: stroke
Returning to usual place of residence following hospital treatment: stroke
Prevalence: stroke or transient ischaemic attacks
Referral of patients with stroke for further investigation
Blood pressure in patients with stroke or transient ischaemic attack
Cholesterol levels in patients with stroke or transient ischaemic attack
Antiplatelet / anti-coagulant therapy for patients with stroke or transient ischaemic attack
Vaccination: influenza, for patients with stroke or transient ischaemic attack
Years of life lost due to mortality from stroke
404 408 412 414 416 418 420 422 424
Atrial fibrilation
Prevalence: atrial fibrillation
Prevalence: atrial fibrillation confirmed by ECG or specialist
Antiplatelet / anti-coagulant therapy for patients with atrial fibrillation
426 428 430
Chronic liver disease
Mortality from chronic liver disease including cirrhosis
Years of life lost due to mortality from chronic liver disease including cirrhosis
432 434
Chronic renal failure
Mortality from chronic renal failure
Years of life lost due to mortality from chronic renal failure
Prevalence: chronic kidney disease
Normal blood pressure in patients with chronic kidney disease
ACE inhibitor / ARB therapy for chronic kidney disease patients with hypertension and proteinuria
436 438 440 442 444
Diabetes mellitus
Emergency hospital admissions: diabetic ketoacidosis and coma
Hospital procedures: lower limb amputations in diabetic patients
Mortality from diabetes
Prevalence: diabetes mellitus
Controlled blood glucose levels in patients with diabetes mellitus
Blood glucose levels in patients with diabetes mellitus
Retinal screening in patients with diabetes mellitus
Peripheral pulse checking in patients with diabetes mellitus
Neuropathy testing in patients with diabetes mellitus
Blood pressure in patients with diabetes mellitus
Micro-albuminuria testing in patients with diabetes mellitus
Renal function testing in patients with diabetes mellitus
ACE inhibitor therapy for patients with diabetes mellitus
Cholesterol levels in patients with diabetes mellitus
Vaccination: influenza, for patients with diabetes mellitus
Years of life lost due to mortality from diabetes
446 450 454 456 458 460 462 464 466 468 470 472 474 476 478 480
Epilepsy
Mortality from epilepsy
Prevalence: epilepsy
Record of seizure frequency among patients with epilepsy
Patients with epilepsy on drug treatment and convulsion free
Years of life lost due to mortality from epilepsy
Epilepsy review among patients on drug treatment for epilepsy
482 484 486 488 490 492
Infectious and parasitic diseases
Incidence of meningococcal meningitis
Mortality from infectious and parasitic disease
Years of life lost due to mortality from infectious and parasitic disease
494 495 497
Tuberculosis
Incidence of tuberculosis
Mortality from tuberculosis
Years of life lost due to mortality from tuberculosis
499 500 502
Mental illness
Emergency hospital admissions: schizophrenia
Emergency hospital admissions: neuroses
504 507 viii
Mortality from suicide
Mortality from suicide and injury undetermined
Prevalence: psychoses
Health review and treatment checks among patients with psychoses
Thyroid and renal function testing in patients on lithium therapy
Years of life lost due to mortality from suicide
Years of life lost due to mortality from suicide and injury undetermined
Comprehensive care plan for patients on mental health register
Follow-up of non-attendance at annual review among patients with psychoses
Screening for depression in patients with diabetes and/or coronary heart disease
Depression severity assessment at outset of treatment
511 513 515 517 519 521 523 525 527 529 531
Dementia
Prevalence: dementia
Care review among patients with dementia
533 535
Osteoporosis
Emergency hospital admissions and timely surgery: fractured proximal femur
Mortality from fracture of femur
Deaths within 30 days of emergency admission to hospital: fractured proximal femur
Returning to usual place of residence following hospital treatment: fractured proximal femur
Emergency readmissions to hospital within 28 days of discharge: fractured proximal femur
537 542 544 548 552
Osteoarthritis
Hospital procedures: primary hip replacement
Hospital procedures: revision hip replacement
Hospital procedures: primary knee replacement
Emergency readmissions to hospital within 28 days of discharge: primary hip replacement surgery
556 560 564 567
Peptic ulcer
Mortality from gastric, duodenal, and peptic ulcers
Years of life lost due to mortality from gastric, duodenal and peptic ulcers
572 574
Pneumonia
Mortality from pneumonia
Years of life lost due to mortality from pneumonia
576 578
Surgery
Potentially avoidable mortality associated with specified medical conditions amenable to surgical intervention
Deaths within 30 days of a hospital procedure: surgery (non-elective admissions)
Hospital procedures: cataract removal
Emergency readmissions to hospital within 28 days of discharge: hysterectomy
580 582 587 591
Hypothyroidism
Prevalence: hypothyroidism
Thyroid function tests in patients with hypothyroidism
595 597
Learning disabilities
Prevalence: learning disabilities
599
ANNEXES
ANNEX 1
ANNEX 2
ANNEX 3
ANNEX 4
ANNEX 5
ANNEX 6
ANNEX 7A
ANNEX 7B
ANNEX 7C
ANNEX 8A
ANNEX 8B
601 614 625 644 668 669 673 675 678 686 688 ix
ANNEX 9
ANNEX 10
ANNEX 11
ANNEX 12
ANNEX 13
691 693 695 733 740 x
INTRODUCTION
Overview
This user guide accompanies the ongoing release of the Compendium of Clinical and Health Indicators. The
Compendium can be accessed on the Clinical and Health Outcomes Knowledge Base via the internet at
http://www.nchod.nhs.uk as a disclosure controlled version, which removes any data that may potentially identify an
individual, or via the NHSnet at http://nww.nchod.nhs.uk (available only to NHS staff who are allowed access to
such data). Indicator source data are usually supplied at different times throughout the year. Parts of the
Compendium are thus updated as data become available, in order to ensure that users always have access to the
most up to date information for any indicator at the time of access.
The Compendium brings together indicators from several data sets developed historically by the Department of
Health (DH) over a number of years in response to a variety of needs and policy initiatives, for example, the Public
Health Common Data Set, population health outcome indicators, Our Healthier Nation (OHN) indicators, clinical
indicators, cancer survival indicators and others.
The production of the Compendium is now undertaken by The NHS Information Centre for health and social care
(NHS IC). The NHS IC is responsible for co-ordination of data extracts from the Department of Health (DH), the
Office for National Statistics (ONS) and other external sources, analyses of the majority of the data, and the coediting of relevant specifications and technical annexes.
The user guide to the Compendium (currently available only in electronic form) provides a description of the data
grouped by conditions / health topics, specifications of the indicators, annexes with technical details, and a file
matrix. The specifications include updated descriptive information for each indicator concerning its purpose,
variants, numerator and denominator data, statistical methods, references, and a summary table of the data
available.
The spreadsheet data files have a common layout, as far as is possible, with the same organisations in the same
rows and use hyperlinks for faster browsing through the data. On the NHS version, they are provided both as
multiple worksheets, covering the different types of statistical analyses for a particular category of indicator, and as
single worksheets. The public version provides single worksheets only. Historical data presented as tables, maps,
and graphs are available in archived Compendia dating back to 1998.
Types of data
The Compendium indicators cover various aspects of population health and clinical and health outcomes. Data are
analysed by age; gender; National Health Service (NHS) and government geographical boundaries (national,
regional, local); and health care institutions; for the most recent year(s) and with trend data for selected indicators. A
variety of different statistical analyses such as direct and indirect standardisation, years of life lost etc. are available.
Each indicator covers different combinations of all these aspects, based on what is possible and feasible with
currently available routine data, and these are described in detail within each indicator specification.
Data provided in the Compendium are at national (England & Wales, England) and various sub-national levels, such
as Government Office Region (GOR), ONS Area Classification, Strategic Health Authority (SHA), Local Authority
(LA), Primary Care Organisation (PCO) and County (CTY). They are based either on single calendar, financial, or
academic year, or are three years’ pooled data. The main groups of indicators for which figures are presented as
current and / or trend data include:
•
•
•
•
•
•
•
•
•
•
•
•
•
•
•
•
Mortality;
Years of life lost;
Cancer incidence;
Cancer survival;
Cancer deaths st home;
Cancer screening programmes;
Hospital Episode Statistics (HES) based indicators;
Vaccinations;
Infectious diseases;
Congenital malformations;
Births and infant mortality;
Oral health in children;
Fertility;
Conceptions;
Abortions;
Life expectancy;
1
•
•
•
•
•
•
•
•
2001 Census based indicators;
ONS Area Classification;
Indices of Deprivation 2004;
General Household Survey (GHS) smoking and drinking indicators;
Health Survey for England (HSE) based indicators;
Expenditure and Food Survey (EFS) fat consumption indicators;
Population indicators including ONS 2001 Census based estimates and GP registered and resident
relevant estimates
Primary care based indicators.
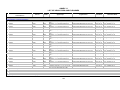
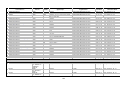
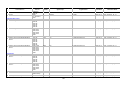
For a complete list of Compendium indicators and filenames see the matrix in Annex 11.
Data sources
There are a variety of sources as follows:
•
•
•
•
•
•
•
•
The ONS supplies mortality data, cancer registrations, life expectancy, births and infant mortality data,
congenital anomaly data, data related to indices of deprivation, and population estimates;
The DH either supplies or co-ordinates data extracts of HES data managed by Northgate Information
Solutions, accident morbidity data, data on health risk factors (from national health surveys). Data
produced / processed by DH include GP registered population estimates, vaccination data, legal abortion
data, five year population projections (currently not available), 2001 Census based data;
The Health Protection Agency supplies infectious disease notification data;
The British Association for the Study of Community Dentistry is responsible for the oral health data
supplied by the DH, West Midlands Public Health Group;
The National Down Syndrome Cytogenetic Register (Wolfson Institute of Preventive Medicine) at St.
Bartholomew’s and the Royal London School of Medicine and Dentistry provides data on Down syndrome
diagnoses and outcomes;
The Department for Environment, Food and Rural Affairs provides data on health risk factors related to fat
consumption based on the Expenditure and Food Survey;
The National Centre for Social Research provides data for the Health Survey for England indicators;
Quality and Outcomes Framework is the source of data for primary care indicators which are supplied by
the Prescribing Support Unit at The NHS Information Centre for health and social care.
Quality of indicators
The indicators in the Compendium have been brought together from disparate sources and there are ongoing
attempts to ensure consistency between them. As an aid to this endeavour, a review of internationally used criteria
to judge the quality of indicators was undertaken and is reported in Annex 12. The review shows that the criteria are
specific to the context in which an indicator and the data are to be used. Users are advised to refer to these criteria
in assessing the suitability of an individual indicator for a specific intended use.
Comments on the Compendium
Comments on the scope and contents of the Compendium should be sent to:
Alison Neave
Public Health Indicators Section Head
The NHS Information Centre for health and social care
1 Trevelyan Square
Boar Lane
Leeds LS1 6AE
E-mail: [email protected]
Comments and questions on the definitions and calculations plus suggestions for new indicators and requests for
further analyses should be sent to:
Sam Widdowfield
Senior Analyst
Public Health Indicators
The NHS Information Centre for health and social care
1 Trevelyan Square
Boar Lane
Leeds LS1 6AE
E-mail: [email protected]
2
Acknowledgments
The NHS IC appreciate the contribution and assistance of the following in the development and production of the
Compendium:
External Contributors:
Allan Baker (ONS), Richard Bond (DH), Lorna Booth (DH), Anita Brock (ONS), Andrew Clark (LSHTM), Dave
Clucas (NHS IC), Michel Coleman (LSHTM), Lois Cook (ONS), Nicola Cooper (ONS), Rachel Craig (NatCen), Sue
Dewane (ONS), Daniel Funge (DH), Peter Goldblatt (ONS) Sue Graves (DH), Clare Griffiths (ONS), Mary Grinsted
(DH), Alison Holding (ONS), Andrew Jackson (DH), Sacha Keshavarz (DH), John Langford (DH), June Leach
(ONS), Simon Lewry (DH), Ann Loveday (ONS), David Lloyd (NHS IC), Hugh Markowe (DH), Susan Mayne (NHS
IC), Stephen McGuire (NHS IC), Joan Morris (NDSCR), Paragi Patel (HPA), Siva Prakash, Michael Riga (LSHTM),
Vera Ruddock (ONS), Colin Sanderson (LSHTM), Shaun Scholes (NatCen), Andy Sneddon (ONS), Craig Spence
(Nortgate IS), Cecilia St.John (ONS), Rachel Foskett-Tharby (NHS Employers), Kate Wooster (Northgate IS) and
other members of the Compendium Steering Group and Technical Group.
Updated: August 2010
3
4
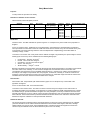
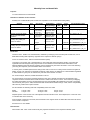
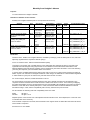
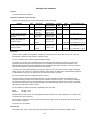
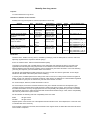
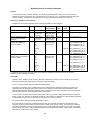
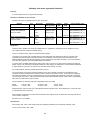
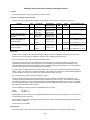
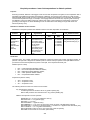
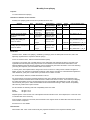
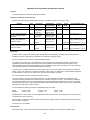
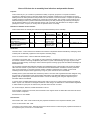
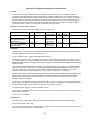
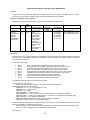
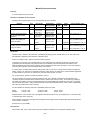
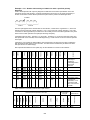
Estimates of resident population
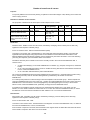
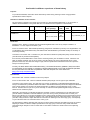
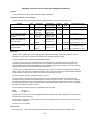
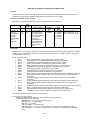
Purpose:
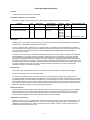
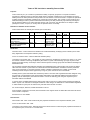
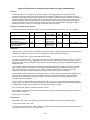
To facilitate planning of health services at local level and provide denominators for epidemiological analyses.
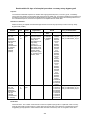
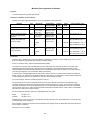
Definition of indicator and its variants:
Mid-year estimates of resident population for the respective calendar years, based on the 2001 Census by age
and sex. The estimated resident population of an area includes all people who usually live there, whatever their
nationality. Members of UK and non-UK armed forces stationed in the UK are included and UK forces stationed
outside the UK are excluded. Students are taken to be resident at their term time address.
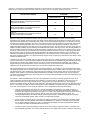
Statistic
Number
Sex
Age group
Organisation
(see glossary)
MFP All ages, <1, 1-4, E&W, E, GOR, ONS
5-9, 10-14, 15- area, SHA, LA,
19, 20-24, 25-29, PCO, CTY
30-34, 35-39, 4044, 45-49, 50-54,
55-59, 60-64, 6569, 70-74, 75-79,
80-84, 85+
Current
data
Trend
data
2008
2007
2006
2005
2004
2003
2002
2001
2000
1999
1998
1997
1996
1995
1994
1993
File-worksheet name
01A_001NO_08_V2
01A_001NO_07_V3
01A_001NO_06_V4
01A_001NO_05_V6
01A_001NO_04_V7
01A_001NO_03_V6
01A_001NO_02_V6
01A_001NO_01_V3
01A_001NO_00_V3
01A_001NO_99_V3
01A_001NO_98_V3
01A_001NO_97_V3
01A_001NO_96_V3
01A_001NO_95_V3
01A_001NO_94_V3
01A_001NO_93_V3
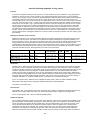
Numerator:
Numerator data - Estimates of resident population in the mid-respective year by age and sex.
Source of numerator data - Office for National Statistics (ONS).
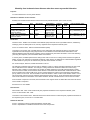
Comments on numerator data - The latest population data released by the ONS in May 2010 are revised mid2002 to mid-2008 estimates for LAs and only mid-2008 estimates for PCOs (revised mid 2002 to mid-2007
estimates for PCOs are scheduled for release in September 2010). The figures are presented at national level and
subnationally by five year age group and sex. These revised estimates reflect the improved methods for
measuring migration, developed under the Interdepartmental Task Force on Migration Statistics.
Previously published data for 2001 to 2007 were also revised mid-year estimates derived from the 2001 Census
with allowance for subsequent births, deaths, migration, and ageing of the population. ONS identified an
undercount in the original 2001 population estimates of certain population groups, mainly young men. An
adjustment for this was incorporated in the revised 2001 and the 2002 mid-year estimates released in September
2003. The Census Matching Project for Manchester resulted in further revisions to the 2001 and 2002 estimates
for the City of Manchester, with the estimates for Greater Manchester, North West Government Office Region
(GOR), England, and England & Wales also being amended as a consequence. These revisions were released in
November 2003. A further revision to the 2002 estimates were released in January 2004 as a result of an
amendment to the armed forces population estimates. Final versions of the 2001 and 2002 mid-year population
estimates, incorporating changes from further Census Matching Projects, were released by ONS in September
2004. The latest versions of mid-year estimates for 2002 to 2005 are reflecting revisions due to improved
international migration and were released in August 2007 and October 2007 for Local Authorities and Primary
Care Organisations respectively.
In October 2006, re-structured Primary Care Organisation (PCO) boundaries came into effect. As a result, the
number of PCOs was reduced from 304 to 152 and the coterminosity between LAs and PCOs was increased to
342 LAs wholly coterminous with 130 PCOs. For these PCOs, estimates were produced back to 1993 by an
aggregation of LA mid-year estimates. Using a new simplified methodology, ONS produced back-dated time series
of population estimates for all new PCOs (including 22 PCOs non-coterminous with LAs) for mid-2002 to mid-2005
in March 2007.
The provisional 2007 PCO population estimates released in 2008 were revised and their final version is now
published. The estimates for any PCOs whose geographical boundaries do not comprise whole local authorities
5
are therefore subject to change. The published PCO estimates by quinary age and sex have Experimental
Statistics status,
All LA population estimates are provided for the new configuration of local authorities following their
reorganisation on 1st April 2009.
Figures for 1993-2000 are ONS revised rebased mid-year estimates based on the 2001 Census. The 2001
Census results showed that previous mid-year population estimates produced during the 1990s were
overestimates of the population. This was due to the following: (1) overestimation of the under-enumeration in the
1991 Census, and (2) underestimation of the outward migration over the ten year period following 1991. Therefore,
the estimates for 1991 to 2000 have had to be rebased downwards to make them consistent with the 2001
Census.
Final revisions to the historical population series were released in October 2004.
A minor error has been corrected for the mid-2004 population estimates affecting the London Borough of Harrow
and ‘higher’ geographical levels on 20 December 2005. For more detailed information see the note at:
http://www.statistics.gov.uk/downloads/theme_population/Correction_Population_Estimates_Dec2005.pdf
It is ONS policy to publish population estimates rounded to at least the nearest 100 persons. Estimates are
sometimes provided in units to facilitate further calculations. They cannot be guaranteed to be as exact as the
level of detail implied by unit figures.
ONS publishes detailed national population estimates by sex and single year of age, and local estimates by sex
and quinary age group. Local estimates are also now calculated by single year of age, but these figures are less
reliable, and single year of age data for local areas have been aggregated to five-year groupings for use in further
calculations and for presentation purposes.
For more information about methodological issues concerning population change figures and contributing factors
such as migration see: http://www.statistics.gov.uk/downloads/theme_population/2007_FAQ.pdf
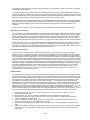
Denominator:
Denominator data - Not applicable.
Source of denominator data - Not applicable.
Comments on denominator data - Not applicable.
Interpretation of indicators:
Quality of indicator - Annex 12 describes the criteria that should be used to judge the quality of this indicator. The
application of the criteria is dependent on the context (e.g. describing a single organisation, comparing several
organisations) and the level (e.g. national / regional with large numbers of events, local with small numbers of
events) at which the data are to be used.
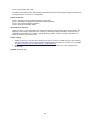
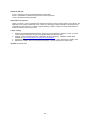
Further reading:
1.
2.
3.
Population Estimates. A Short Guide to Population Estimates. Office for National Statistics. Available at:
http://www.statistics.gov.uk/downloads/theme_population/Short_Guide_revision_Nov_04_final.pdf
Benton P, White I. Looking beyond the 2001 Census. Office for National Statistics Population Trends, Vol.
113, 2003: 7-10.
Chappell R, Duncan C, Smith J Whitworth A. Implications of 2001 Census for local authority district mid-year
population estimates. Office for National Statistics Population Trends, Vol. 113, 2003: 20-31.
Updated: August 2010
6
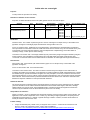
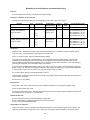
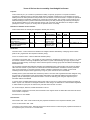
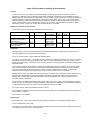
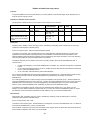
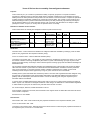
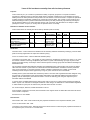
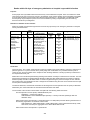
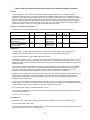
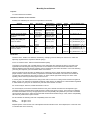
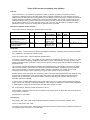
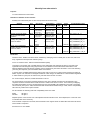
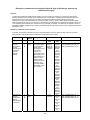
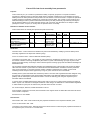
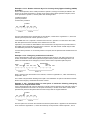
GP relevant population estimates
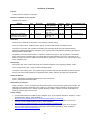
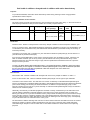
Purpose:
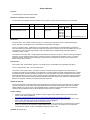
To facilitate planning of health services at local level.
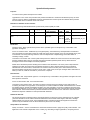
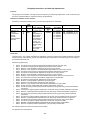
Definition of indicator and its variants:
GP relevant population registered with a GP constituent practice and resident relevant population with a usual
address within the respective geographical boundary by age and sex.
Statistic
Number
Sex
Age group
Organisation
(see glossary)
MFP All ages, 18 &
E&W, E, GOR, ONS
over, <1, 1-4, 5- area, SHA, PCO
9, 10-14, 15-19,
20-24, 25-29, 3034, 35-39, 40-44,
45-49, 50-54, 5559, 60-64, 65-69,
70-74, 75-79, 8084, 85+
Current
data
2008
Trend
data
File-worksheet name
01C_185NO_08_V1
Numerator:
Numerator data - Estimated number of GP and resident relevant male and female population based on GP lists in
the 2009 Attribution Data Set (ADS) and constrained to Office for National Statistics (ONS) 2008 mid-year
estimates (excluding special populations).
Source of numerator data - The NHS Information Centre for health and social care (IC).
Comments on numerator data - GP patient registration data were extracted from Family Health Services (FHS)
registers at postcode level in April 2009 or re-assigned to the postcode geography of the respective GP list.
Special populations i.e. armed forces, dependents of foreign armed forces, and convicted prisoners who have
been inmates for 6 months or more are not included.
Denominator:
Denominator data - Not applicable.
Source of denominator data - Not applicable.
Comments on denominator data - Not applicable.
Statistical methods:
All data have been adjusted to be consistent with population estimates published by ONS and then special
populations removed - the figures bear no resemblance to actual people. Therefore no figures have been
suppressed, and the spreadsheet may contain figures of 1. This does not imply that there is one person in that
Primary Care Organisation (PCO) in that age band, nor should it be taken to suggest that the figures are accurate
to this level. Their accuracy will be limited by the combined accuracy of: the ONS mid-year estimates, FHS
registers and GP practice registers, and the postcode to NHS organisation translations in the NHS Postcode
Directory.
For more information on methodology, see Annex 10.
Interpretation of indicators:
Quality of indicator - Annex 12 describes the criteria that should be used to judge the quality of this indicator. The
application of the criteria is dependent on the context (e.g. describing a single organisation, comparing several
organisations) and the level (e.g. national / regional with large numbers of events, local with small numbers of
events) at which the data are to be used.
Updated: August 2010
7
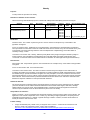
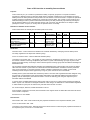
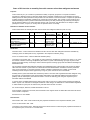
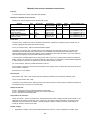
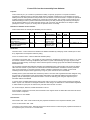
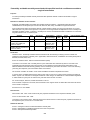
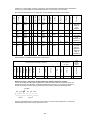
Indices of Deprivation 2007
Purpose:
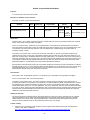
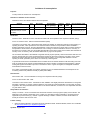
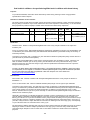
To provide a measure of deprivation at Local Authority (LA) and Primary Care Organisation (PCO) level. The
Indices of Deprivation are used widely to analyse patterns of deprivation, identify areas that would benefit from
special initiatives or programmes and as a tool to determine eligibility for specific funding streams.
Definition of indicator and its variants:
The English Indices of Deprivation 2007 (ID 2007) are the Government’s official measure of multiple deprivation at
small area level. The 2007 Indices update information provided in the Indices of Deprivation 2004 (ID 2004).
Statistic
Score and rank
Sex
P
Age group
Organisation
(see glossary)
Ages n/a
LA, PCO
Current
data
Trend
data
2007
File-worksheet name
01F_183SC_07_V1
Numerator:
Numerator data - Scores in the ID 2007 are at Lower Layer Super Output Area (LSOA) level indicators in the
following seven “domains” of deprivation:
•
Income;
•
Employment;
•
Health Deprivation and Disability;
•
Education, Skills and Training;
•
Barriers to Housing and Services;
•
Crime;
•
Living Environment.
The seven LSOA level Domain Indices are combined to make the LSOA level Index of Multiple Deprivation 2007
(IMD 2007). The summary measures are:
•
Local Concentration;
•
Extent;
•
Average Score;
•
Average Rank;
•
Scale (for Income and Employment only).
Source of numerator data - Department for Communities and Local Government (DCLG).
The Indices have been constructed by the Social Disadvantage Research Centre at the University of Oxford.
Historically, the following organisations contributed to construction of Indices of Deprivation 2004 by providing
relevant information; Social Disadvantage Research Centre (SDRC), Social Policy and Social Research
Department at the University of Oxford commissioned by the Office of the Deputy Prime Minister (ODPM),
Department for Education and Skills (DfES), Department for Transport (DfT), Department for Work and Pensions
(DWP), Department of Health (DH), Heriot-Watt University, Home Office, Home Office and National Asylum
Support Service, Inland Revenue, MapInfo Ltd, NHS Information Authority, Office for National Statistics (ONS),
Post Office Ltd, Prescription Pricing Authority, Regional Police Forces, Staffordshire University, and Universities
and Colleges Admissions Service (UCAS).
Comments on numerator data - The ID 2007 combine a number of indicators, chosen to cover a range of
economic, social and housing isues, into a single deprivation score for each small area in England. This allows
each area to be ranked relative to one another according to their level of deprivation. As with ID 2004, the ID 2007
have been produced at Lower Super Output Area level, of which there are 32,482 in the country.
In contrast to other earlier produced deprivation indices based on 1991 Census data, most of the indicators used
in the ID 2004 and ID 2007 can be updated regularly. The Local Authority district level presentations of the ID
2004 included only employment scale, income scale, average of ward scores, average of ward ranks, extent of
deprivation, and local concentration. See Annex 1 for more details on ID 2004.
Denominator:
Denominator data - See “Numerator data”.
Source of denominator data - See “Numerator data”.
8
Comments on denominator data - See “Numerator data”.
Statistical methods:
The methodology underpinning the ID 2004 and ID 2007 are largely the same though there have been small
changes to some of the underlying indicators. Comparison between the two Indices is therefore acceptable.
Further information on methodology and guidance on ID 2007 use can be found at:
http://www.communities.gov.uk/documents/communities/pdf/733520.pdf
Interpretation of indicators:
Quality of indicator - Annex 12 describes the criteria that should be used to judge the quality of this indicator. The
application of the criteria is dependent on the context (e.g. describing a single organisation, comparing several
organisations) and the level (e.g. national / regional with large numbers of events, local with small numbers of
events) at which the data are to be used.
Further reading:
1.
2.
3.
Noble, M, McLennan D, Wilkinson K, Whitworth A, Barnes H. The English Indices of Deprivation 2007:
Summary. London: Department for Communities and Local Government, 2008. Available at:
http://www.communities.gov.uk/documents/communities/pdf/733520.pdf
Noble, M. The English Indices of Deprivation 2004: Summary. London: Office of the Deputy Prime Minister,
2004. Available at:
http://www.odpm.gov.uk/stellent/groups/odpm_urbanpolicy/documents/pdf/odpm_urbpol_pdf_028470.pdf
Noble, M. The English Indices of Deprivation 2004 (revised). London: Office of the Deputy Prime Minister,
2004. Available at:
http://www.odpm.gov.uk/stellent/groups/odpm_urbanpolicy/documents/page/odpm_urbpol_029534.pdf
Updated: October 2007
9
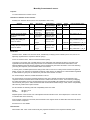
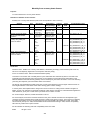
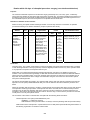
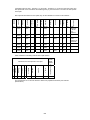
ONS area classification
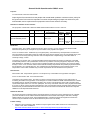
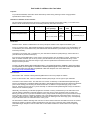
Purpose:
To provide a simple indicator of the characteristics of an area, and of the similarity between areas, for comparison
or targeting purposes, and as a variable for analysis with other data.
Definition of indicator and its variants:
The Office for National Statistics (ONS) Area Classification based on data from the 2001 Census.
Statistic
Sex
Type of area based on census
variables
P
Age group
Ages n/a
Organisation
(see glossary)
LA, PCO
Current
data
2001
Trend
data
File-worksheet name
01G_005SC_01_V2
Numerator:
Numerator data - The Local Authorities (LAs) in England classified hierarchically into twelve groups.
Source of numerator data - ONS 2001 Census Local Base Statistics.
Comments on numerator data - The LAs comprising each ONS area group are shown in Annex 7C. The Office for
National Statistics has calculated the classification to Local Authority boundaries as at April 2003. Throughout the
Compendium, the mean indicator values given for the twelve ONS area classification groups are computed from
the values for constituent LAs.
The rectructured Primary Care Organisations (PCOs) comprising each ONS area group are shown in Annex 8B
which has been updated. There are 152 PCOs with boundaries as at October 2006.
The classification has been produced for the whole of the UK for the first time at three hierarchal levels:
supergroup, group, and sub-group. There are eight clusters (including Northern Ireland Countryside) at supergroup
level, thirteen clusters at group level, and twenty-four at sub-group level. An example of a supergroup is “Cities
and Services”. Names have been given to each supergroup and group. These names have been chosen to
represent the group as a whole and may not accurately describe each individual LA. However, all LAs within a
group share similar population characteristics.
Supergroups, groups and sub-groups each have a set of Cluster Summaries. These present the main
characteristics of each cluster in text and on a “radar chart”. A radar chart looks like a wheel with a number of
spokes. Each spoke of the wheel represents a “variable” - a characteristic of the population. Points are plotted to
indicate values for each variable relative to the mean of the population. For more information on the hierarchy of
groupings and how to use the classification, see the user guide, available via the following link:
http://www.statistics.gov.uk/about/methodology_by_theme/area_classification/downloads/User_Guide.pdf
Files that contain statistical summaries of each collection and highlight the main socio-economic and demographic
characteristics of the clusters in the collection are available via the ONS website.
Denominator:
Denominator data - See “Numerator data”.
Source of denominator data - See “Numerator data”.
Comments on denominator data - See “Numerator data”.
Statistical methods:
A statistical technique known as “Cluster Analysis” was used, in particular, Ward's method. Further information
about the methodology for Cluster Analysis is shown in Annexes 7A and 8A. Information is also presented for 42
variables (different characteristics of the population). These variables are listed in Annex 7B.
The detailed classification is shown in Excel spreadsheets available from the Department of Health’s (DH's)
Demography and Geography Statistics team. The classification is also presented in a new graphical display
method called Scalable Vector Graphics (SVG) and in pdf format on the National Statistics Neighbourhood
Statistics website:
http://www.statistics.gov.uk/about/methodology_by_theme/area_classification/maps.asp
10
An alternative method of using the classifications for each authority is to find the authorities that are most similar to
it; these are called “Corresponding Authorities”. To measure similarity between authorities the Squared Euclidean
Distance (SED) has been used, which is based solely on the 42 variables used in the main classification. Thus
corresponding authorities could be geographically far apart, e.g. Salford and Gateshead or Isle of Wight and
Scarborough. In this context, the range is defined as the range between the two most similar authorities and the
two most dissimilar authorities.
Two authorities are considered to be:
•
Extremely similar if they have an SED of less than 1% of the range between the two most similar
authorities and the two most dissimilar authorities;
•
Very similar if they have an SED of less than 2.5% of the range;
•
Similar if they have an SED of less than 5% of the range;
•
Somewhat similar if they have an SED of less than 10% of the range;
•
Not similar if their SEDs differ by more than 10% of the total range.
An Excel spreadsheet of this information is available from the Department of Health’s Demography and
Geography Statistics team.
The degree of similarity between the corresponding authorities is shown with a colour coding system (red has
been used to show authorities that are “Extremely Similar”, green for “Very Similar”, blue for “Similar”, and yellow
for “Somewhat Similar”).
The authorities in urban areas, especially London, have more extreme values and so are less likely to be similar to
other authorities. An example of this is Tower Hamlets, whose four corresponding authorities are all classified “Not
Similar”.
Interpretation of indicators:
Quality of indicator - Annex 12 describes the criteria that should be used to judge the quality of this indicator. The
application of the criteria is dependent on the context (e.g. describing a single organisation, comparing several
organisations) and the level (e.g. national / regional with large numbers of events, local with small numbers of
events) at which the data are to be used.
Further reading:
1.
2.
3.
4.
5.
Bailey S, Charlton J, Dollamore G, Fitzpatrick J. The ONS Classification of Local and Health Authorities of
Great Britain: Revised for Authorities in 1999. Office for National Statistics, 1999. Available at:
http://www.statistics.gov.uk/downloads/theme_population/SMPS63_v5.pdf
Bailey S, Charlton J, Dollamore G, Fitzpatrick J. Which authorities are alike. Office for National Statistics
Population Trends, Vol. 98, 1999: 29-41.
Martin, D. Geography for the 2001 Census in England and Wales. Office for National Statistics Population
Trends, Vol. 108, 2002: 7-15.
Office for National Statistics. National Statistics 2001 Area Classification of Local Authorities. Office for
National Statistics website:
http://www.statistics.gov.uk/about/methodology_by_theme/area_classification/
Smith J, Chappell R, Whitworth A. Duncan C. Implications of 2001 Census for Local Authority district mid-year
population estimates. Office for National Statistics Population Trends, Vol. 113, 2003: 20-31.
Updated: November 2007
11
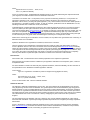
Composition of the Census count of resident population
Purpose:
To provide 2001 Census based information about household status of resident population.
Definition of indicator and its variants:
The Census count of resident population and the percentage who were present and resident in households and
resident in communal establishments.
Statistic
Number and percent of
residents in households
Sex
P
Age group
All ages
Organisation
(see glossary)
Current
data
E&W, E, GOR, ONS
area, SHA, LA,
PCO, CTY
2001
Trend
data
File-worksheet name
01H_006VS_01_V2
Note: Data for PCOs have been produced from “best fit” of Output Areas.
Numerator:
Numerator data - Numbers of residents in each of the component groups.
Source of numerator data – Office for National Statistics (ONS): Key Statistics Table 1 (KS01). Data processed by
the Department of Health (DH).
Comments on numerator data - The ONS Area Classification values for Census indicators are computed from
Local Authority (LA) data. Strategic Health Authority (SHA) values are computed from Primary Care Organisation
(PCO) data rather than LA.
Denominator:
Denominator data - The total number of residents in the area.
Source of denominator data - ONS: Key Statistics Table 1 (KS01). Data processed by DH.
Comments on denominator data - The count of resident population in households and communal establishments is
based on statistics relating to where people usually live.
The following two groups of enumerated persons were separately identified:
•
Resident in households - persons enumerated as resident in a household;
•
Resident in communal establishments - persons enumerated in a communal establishment, which was
recorded as being their usual residence.
In addition to these two groups enumerated by the Census, the resident population of an area included the
following group: Imputed residents in households - for those absent households for which no completed census
form was received by ONS, certain data were imputed. The imputed items were those that were fully processed for
100% of records. The method of deriving these data was to draw on information from similar absent households in
the same neighbourhood for which completed forms were returned. Appropriate matches were identified by using
basic information about the households collected by enumerators.
Statistical methods:
Census data for PCOs were produced by ONS on the basis of best fit using two different methods. The 2001
Census Key Statistics tables were produced on the basis of best fit of Output Areas to PCOs, and Standard tables
(which are generally the more detailed tables, showing cross-tabulations between different variables) for health
areas were produced on the basis of best fit of wards. The “two-method approach” used by ONS is a problem, in
that the same variables for health areas appear as different totals in the Key Statistics and Standard tables. Some
of these differences are also “significant”. For a more detailed explanation see:
http://www.statistics.gov.uk/census2001/cn_96.asp
Disclosure protection measures applied by the ONS to 2001 Census output for England and Wales are in place in
order to prevent the inadvertent release of information about identifiable individuals. As a result, totals may
sometimes not add up. For more details about disclosure control methods see:
http://www.statistics.gov.uk/census2001/op5.asp
12
Percentages were obtained by dividing numbers of residents in each of the component groups by the total number
of residents in the area.
Interpretation of indicators:
Quality of indicator - Annex 12 describes the criteria that should be used to judge the quality of this indicator. The
application of the criteria is dependent on the context (e.g. describing a single organisation, comparing several
organisations) and the level (e.g. national / regional with large numbers of events, local with small numbers of
events) at which the data are to be used.
Further reading:
1.
2.
3.
4.
5.
Office for National Statistics. The Census 2001 homepage. Office for National Statistics, 2004. Available at:
http://www.statistics.gov.uk/census2001/
Benton, P. White, I. Looking beyond the 2001 Census, Office for National Statistics Population Trends, Vol
113, 2003: 7-10.
Office for National Statistics. Local Authority information pages. Available at:
http://www.statistics.gov.uk/census2001/la.asp
Martin, D. Geography for the 2001 Census in England and Wales. Office for National Statistics Population
Trends, Vol 108, 2002: 7-15.
Chappell R, Duncan C, Smith J, Whitworth A. Implications of 2001 Census for local authority district mid-year
population estimates. Office for National Statistics Population Trends, Vol 113, 2003: 12.
Updated: December 2009
13
Census count of resident population by age and sex
Purpose:
To provide 2001 Census based information about distribution of resident population by age and gender.
Definition of indicator and its variants:
The Census count of resident males and females by age.
Statistic
Number of residents
Sex
Age group
Organisation
(see glossary)
MFP All ages, <5, 5- E&W, E, GOR, ONS
14, 15-24, 25-44, area, SHA, LA,
45-64, 65-74, 75- PCO, CTY
84, 85+
Current
data
2001
Trend
data
File-worksheet name
01I_007NO_01_V2
Note: Data for PCOs have been produced from “best fit” of Output Areas.
Numerator:
Numerator data - Numbers of residents in each age and sex category.
Source of numerator data – Office for National Statistics (ONS): Standard Table 01 (S01). Data processed by
Department of Health (DH).
Comments on numerator data - The ONS Area Classification values for Census indicators are computed from
Local Authority (LA) data. Strategic Health Authority (SHA) values are computed from Primary Care Organisation
(PCO) data rather than LA.
Denominator:
Denominator data - Not applicable.
Source of denominator data - Not applicable.
Comments on denominator data - Not applicable.
Statistical methods:
Census data for PCOs were produced by ONS on the basis of best fit using two different methods. The 2001
Census Key Statistics tables were produced on the basis of best fit of Output Areas to PCOs, and Standard tables
(which are generally the more detailed tables, showing cross-tabulations between different variables) for health
areas were produced on the basis of best fit of wards. The “two-method approach” used by ONS is a problem, in
that the same variables for health areas appear as different totals in the Key Statistics and Standard tables. Some
of these differences are also “significant”. For a more detailed explanation see:
http://www.statistics.gov.uk/census2001/cn_96.asp
Disclosure protection measures applied by the ONS to 2001 Census output for England and Wales are in place in
order to prevent the inadvertent release of information about identifiable individuals. As a result, totals may
sometimes not add up. For more details about disclosure control methods see:
http://www.statistics.gov.uk/census2001/op5.asp
Interpretation of indicators:
Quality of indicator - Annex 12 describes the criteria that should be used to judge the quality of this indicator. The
application of the criteria is dependent on the context (e.g. describing a single organisation, comparing several
organisations) and the level (e.g. national / regional with large numbers of events, local with small numbers of
events) at which the data are to be used.
Further reading:
1.
2.
Office for National Statistics. The Census 2001 homepage. Office for National Statistics, 2004. Available at:
http://www.statistics.gov.uk/census2001/
Benton, P. White, I. Looking beyond the 2001 Census, Office for National Statistics Population Trends, Vol
113, 2003: 7-10.
14
3.
4.
5.
Office for National Statistics. Local Authority information pages. Available at:
http://www.statistics.gov.uk/census2001/la.asp
Martin, D. Geography for the 2001 Census in England and Wales. Office for National Statistics Population
Trends, Vol 108, 2002: 7-15.
Chappell R, Duncan C, Smith J, Whitworth A. Implications of 2001 Census for local authority district mid-year
population estimates. Office for National Statistics Population Trends, Vol 113, 2003: 12.
Updated: December 2009
15
Communal establishments and their populations
Purpose:
To provide 2001 Census based information about the residents of communal establishments.
Definition of indicator and its variants:
Information on a variety of communal establishments and their residents.
Statistic
Number and percent of
residents
Sex
P
Age group
All ages
Organisation
(see glossary)
Current
data
E&W, E, GOR, ONS
area, SHA, LA,
PCO, CTY
2001
Trend
data
File-worksheet name
01J_008VS_01_V2
Note: Data for PCOs have been produced from “best fit” of Output Areas.
Numerator:
Numerator data - Numbers of residents in each type of establishment. For each type of establishment the following
Census counts are presented:
•
number of establishments;
•
number of residents (excluding staff and families);
•
number of resident staff and families;
•
number of residents in medical and care establishments, and other establishments with a limiting longterm illness.
Figures are presented for the following Communal establishments:
1) Medical and care establishments:
•
all establishments;
•
NHS - psychiatric;
•
Local Authority - Children's homes;
•
Local Authority - Other;
•
Housing Association homes and hostels;
•
nursing homes (non-NHS/LA);
•
residential care homes (non-NHS/LA);
•
children's homes (non-NHS/LA);
•
other.
2) Other establishments.
Source of numerator data – Office for National Statistics (ONS): Key Statistics Table 23 (KS23) and Standard
Table 126 (S126). Data processed by the Department of Health (DH).
Comments on numerator data - The ONS Area Classification values for Census indicators are computed from
Local Authority (LA) data. Strategic Health Authority (SHA) values are computed from Primary Care Organisation
(PCO) data rather than LA.
Communal establishments are those in which some form of communal catering is provided. The establishments
for which separate figures are presented are set out below.
•
•
•
•
•
•
NHS hospitals/homes include hospitals, nursing homes, rehabilitation units and nurses' homes and
hostels which are either directly managed or managed by Trusts. The term “psychiatric” covers hospitals
for the mentally ill, including Special Hospitals;
Local Authority homes only include those managed by a Local Authority;
Housing Association homes and hostels include those managed by a Housing Association (but excluding
children's homes) and almshouses registered with the Housing Corporation;
Nursing homes (non-NHS/LA) include nursing homes, convalescent homes and hospices run by
voluntary, charitable and private organisations;
Residential care homes (non-NHS/LA) include homes registered with a Local Authority and those exempt
from registration managed by voluntary, charitable, and private organisations;
Other non-medical and care establishments cover most types of establishments which provide board and
accommodation for visitors (including hotels, boarding houses, holiday camps, apartments,
16
•
YHA/YMCA/YWCA hostels, other types of hostels, residential clubs, common lodging houses, and
reception centres with resident staff);
Households with 5 or more paying guests and/or resident staff are included, and conversely very small
hotels are treated as households.
Denominator:
Denominator data - The total number of residents in the area.
Source of denominator data - ONS: Key Statistics Table 23 (KS23). Data processed by DH.
Comments on denominator data - None.
Statistical methods:
Census Data for PCOs were produced by ONS on the basis of best fit using two different methods. The 2001
Census Key Statistics tables were produced on the basis of best fit of Output Areas to PCOs, and Standard tables
(which are generally the more detailed tables, showing cross-tabulations between different variables) for health
areas were produced on the basis of best fit of wards. The “two-method approach” used by ONS is a problem, in
that the same variables for health areas appear as different totals in the Key Statistics and Standard tables. Some
of these differences are also “significant”. For a more detailed explanation see:
http://www.statistics.gov.uk/census2001/cn_96.asp
Disclosure protection measures applied by the ONS to 2001 Census output for England and Wales are in place in
order to prevent the inadvertent release of information about identifiable individuals. As a result, totals may
sometimes not add up. For more details about disclosure control methods see:
http://www.statistics.gov.uk/census2001/op5.asp
Percentages were obtained by dividing numbers of residents in each type of establishment by the appropriate total
number of residents in the area.
Interpretation of indicators:
Quality of indicator - Annex 12 describes the criteria that should be used to judge the quality of this indicator. The
application of the criteria is dependent on the context (e.g. describing a single organisation, comparing several
organisations) and the level (e.g. national / regional with large numbers of events, local with small numbers of
events) at which the data are to be used.
Further reading:
1.
2.
3.
4.
5.
Office for National Statistics. The Census 2001 homepage. Office for National Statistics, 2004. Available at:
http://www.statistics.gov.uk/census2001/
Benton, P. White, I. Looking beyond the 2001 Census, Office for National Statistics Population Trends, Vol
113, 2003: 7-10.
Office for National Statistics. Local Authority information pages. Available at:
http://www.statistics.gov.uk/census2001/la.asp
Martin, D. Geography for the 2001 Census in England and Wales. Office for National Statistics Population
Trends, Vol 108, 2002: 7-15.
Chappell R, Duncan C, Smith J, Whitworth A. Implications of 2001 Census for local authority district mid-year
population estimates. Office for National Statistics Population Trends, Vol 113, 2003: 12.
Updated: December 2009
17
Economic position of residents
Purpose:
To provide 2001 Census based information about the economic position of resident populations.
Definition of indicator and its variants:
Employment status of resident populations.
Statistic
Number and percent of
persons
Sex
P
Age group
16-74
Organisation
(see glossary)
Current
data
E&W, E, GOR, ONS
area, SHA, LA,
PCO, CTY
2001
Trend
data
File-worksheet name
01K_011VS_01_V2
Note: Data for PCOs have been produced from “best fit” of Output Areas.
Numerator:
Numerator data - Numbers of residents by economic status (employed, unemployed, full-time students,
economically inactive students, retired, looking after home/family, permanently sick/disabled, others).
Source of numerator data – Office for National Statistics (ONS): Key Statistics Table 9a (KS09a). Data processed
by the Department of Health (DH).
Comments on numerator data - The ONS Area Classification values for Census indicators are computed from
Local Authority (LA) data. Strategic Health Authority (SHA) values are computed from Primary Care Organisation
(PCO) data rather than LA.
The definition of "economically active" was largely determined from answers to more than one question, including:
•
•
"Last week, were you doing any work: as an employee, or on a Government sponsored training scheme
or as self-employed/freelance, or in your own/family business?”;
"Last week, were you any of the following: retired, student, looking after home/family, permanently
sick/disabled or none of the above?".
The number of persons employed includes those working for an employer full- or part-time and the self-employed.
It excludes those on a government employment or training scheme or in full-time education. The unemployed
comprise those looking for a job, waiting to start a job, on a government scheme, or in full-time education. People
wanting a job but prevented from looking by temporary sickness or a holiday are included in the count of
unemployed. The retired are those who have ceased paid work completely.
Denominator:
Denominator data - The total number of residents in the area.
Source of denominator data - ONS: Key Statistics Table 9a (KS09a). Data processed by DH.
Comments on denominator data - None.
Statistical methods:
Census data for PCOs were produced by ONS on the basis of best fit using two different methods. The 2001
Census Key Statistics tables were produced on the basis of best fit of Output Areas to PCOs, and Standard tables
(which are generally the more detailed tables, showing cross-tabulations between different variables) for health
areas were produced on the basis of best fit of wards. The “two-method approach” used by ONS is a problem, in
that the same variables for health areas appear as different totals in the Key Statistics and Standard tables. Some
of these differences are also “significant”. For a more detailed explanation see:
http://www.statistics.gov.uk/census2001/cn_96.asp
Disclosure protection measures applied by the ONS to 2001 Census output for England and Wales are in place in
order to prevent the inadvertent release of information about identifiable individuals. As a result, totals may
sometimes not add up. For more details about disclosure control methods see:
http://www.statistics.gov.uk/census2001/op5.asp
18
Percentages were obtained by dividing numbers of residents with the relevant economic position by the
corresponding total number of residents in the area.
Interpretation of indicators:
Quality of indicator - Annex 12 describes the criteria that should be used to judge the quality of this indicator. The
application of the criteria is dependent on the context (e.g. describing a single organisation, comparing several
organisations) and the level (e.g. national / regional with large numbers of events, local with small numbers of
events) at which the data are to be used.
Further reading:
1.
Office for National Statistics. The Census 2001 homepage. Office for National Statistics, 2004. Available at:
http://www.statistics.gov.uk/census2001/
Updated: December 2009
19
Ethnic group and country of birth
Purpose:
To provide 2001 Census based information about the ethnic composition of resident populations.
Definition of indicator and its variants:
Residents whose ethnic group was:
•
White - British, Irish, Other;
•
Mixed - White and Black Caribbean, White and Black African, White and Asian, Other Mixed;
•
Asian or Asian British - Indian, Pakistani, Bangladeshi, Other Asian;
•
Black or Black British - Black Caribbean, Black African, Other Black;
•
Chinese or other ethnic group - Chinese, Other Ethnic Group.
Also number of residents by country of birth - Great Britain & Northern Ireland, Republic of Ireland, Other
European Union (EU) (as at 29/02/2001), Rest of the World.
Statistic
Number and percent of
residents
Sex
P
Age group
All ages
Organisation
(see glossary)
Current
data
E&W, E, GOR, ONS
area, SHA, LA,
PCO, CTY
2001
Trend
data
File-worksheet name
01L_012VS_01_V2
Note: Data for PCOs have been produced from “best fit” of Output Areas.
Numerator:
Numerator data - Numbers of residents by ethnic group and country of birth.
Source of numerator data – Office for National Statistics (ONS): Key Statistics Tables 05 and 06 (KS05 and
KS06). Data processed by the Department of Health (DH).
Comments on numerator data - The ONS Area Classification values for Census indicators are computed from
Local Authority (LA) data. Strategic Health Authority (SHA) values are computed from Primary Care Organisation
(PCO) data rather than LA.
Ethnic group is based on the ethnic or racial group to which the person considered they belonged. The question
provided for sixteen responses (as detailed above). Those replying "Other White", "Other Mixed", "Other Asian",
"Other Black", or "Other - Other Ethnic Group" were asked to describe the group to which they belonged and some
of these were reallocated to one of the other categories in tables.
Country of birth outside the UK was based on writing in the present name of the country in which the person's
birthplace is situated.
Denominator:
Denominator data - The total number of residents in the area.
Source of denominator data - ONS: Key Statistics Table 02 (KS02). Data processed by DH.
Comments on denominator data - None.
Statistical methods:
Census data for PCOs were produced by ONS on the basis of best fit using two different methods. The 2001
Census Key Statistics tables were produced on the basis of best fit of Output Areas to PCOs, and Standard tables
(which are generally the more detailed tables, showing cross-tabulations between different variables) for health
areas were produced on the basis of best fit of wards. The “two-method approach” used by ONS is a problem, in
that the same variables for health areas appear as different totals in the Key Statistics and Standard tables. Some
of these differences are also “significant”. For a more detailed explanation see:
http://www.statistics.gov.uk/census2001/cn_96.asp
Disclosure protection measures applied by the ONS to 2001 Census output for England and Wales are in place in
order to prevent the inadvertent release of information about identifiable individuals. As a result, totals may
sometimes not add up. For more details about disclosure control methods see:
http://www.statistics.gov.uk/census2001/op5.asp
20
Percentages were obtained by dividing numbers in each group by the total number of residents in the area.
Interpretation of indicators:
Quality of indicator - Annex 12 describes the criteria that should be used to judge the quality of this indicator. The
application of the criteria is dependent on the context (e.g. describing a single organisation, comparing several
organisations) and the level (e.g. national / regional with large numbers of events, local with small numbers of
events) at which the data are to be used.
Further reading:
1.
Office for National Statistics. The Census 2001 homepage. Office for National Statistics, 2004. Available at:
http://www.statistics.gov.uk/census2001/
Updated: December 2009
21
Residents in households
Purpose:
To provide 2001 Census based information about household characteristics of resident populations.
Definition of indicator and its variants:
Residents in households, which were: owner-occupied, privately rented, rented from a Local Authority,
overcrowded, without central heating, lacking or sharing basic amenities, without a car, with two or more cars.
Statistic
Number and percent of
residents
Sex
P
Age group
All ages
Organisation
(see glossary)
Current
data
E&W, E, GOR, ONS
area, SHA, LA,
PCO, CTY
2001
Trend
data
File-worksheet name
01M_013VS_01_V2
Note: Data for PCOs have been produced from “best fit” of Output Areas.
Numerator:
Numerator data - Numbers of residents in each household category. For number of residents without a car or with
two or more cars it is the number of residents aged 17 or over.
Source of numerator data – Office for National Statistics (ONS): Key Statistics Table 01 (KS01), and Standard
Tables: S17, S18, S51 and S59. Data processed by the Department of Health (DH).
Comments on numerator data - The ONS Area Classification values for Census indicators are computed from
Local Authority (LA) data. Strategic Health Authority (SHA) values are computed from Primary Care Organisation
(PCO) data rather than LA.
Answers to the Census question on how each household occupied their accommodation provided the information
on housing tenure. For the purposes of this indicator, owner-occupiers are those who owned the accommodation
outright or were buying through a mortgage or loan; privately rented includes those renting furnished or
unfurnished accommodation from a landlord (other than with a job or business or from a Local Authority, a New
Town Development Corporation, a charitable or Housing Action trust, or a Housing Association); and Local
Authority tenants are those renting from a local council.
Overcrowded households are considered to be those with more than one person per room (where the count of
rooms excluded small kitchens, bathrooms and toilets). A household was without central heating if no living rooms
or bedrooms were centrally heated. It lacked or shared basic amenities if it did not have sole use of a bath or
shower and an inside flush toilet.
The number of cars is based on the cars or vans (excluding those used only for carrying goods) normally available
to any members of the household aged 17 or over.
Denominator:
Denominator data - The total number of residents in the area. For residents with no car or having two or more
cars, it is the number of residents aged 17 or over.
Source of denominator data - ONS: Key Statistics Table 01 (KS01), and Standard Table 01 (S01) for number of
residents aged 17+. Data processed by DH.
Comments on denominator data - None.
Statistical methods:
Census data for PCOs were produced by ONS on the basis of best fit using two different methods. The 2001
Census Key Statistics tables were produced on the basis of best fit of Output Areas to PCOs, and Standard tables
(which are generally the more detailed tables, showing cross-tabulations between different variables) for health
areas were produced on the basis of best fit of wards. The “two-method approach” used by ONS is a problem, in
that the same variables for health areas appear as different totals in the Key Statistics and Standard tables. Some
of these differences are also “significant”. For a more detailed explanation see:
http://www.statistics.gov.uk/census2001/cn_96.asp
22
Disclosure protection measures applied by the ONS to 2001 Census output for England and Wales are in place in
order to prevent the inadvertent release of information about identifiable individuals. As a result, totals may
sometimes not add up. For more details about disclosure control methods see:
http://www.statistics.gov.uk/census2001/op5.asp
The percentage of residents in households with each characteristic was obtained by dividing the number of such
residents by the total number of residents in households.
Interpretation of indicators:
Quality of indicator - Annex 12 describes the criteria that should be used to judge the quality of this indicator. The
application of the criteria is dependent on the context (e.g. describing a single organisation, comparing several
organisations) and the level (e.g. national / regional with large numbers of events, local with small numbers of
events) at which the data are to be used.
Further reading:
1.
Office for National Statistics. The Census 2001 homepage. Office for National Statistics, 2004. Available at:
http://www.statistics.gov.uk/census2001/
Updated: December 2009
23
Dependent children in households
Purpose:
To provide 2001 Census based information about dependent children and types of households.
Definition of indicator and its variants:
Dependent children in resident households;
•
Lone parent families (with dependent children);
•
Dependent children in resident households which were without central heating;
•
Dependent children in resident households which were overcrowded (with more than one person per
room).
Note: A dependent child is a person in a household aged 0 to 15 (whether or not in a family) or a person aged 16
to 18 who is a full time student in a family with parent(s).
Statistic
Number and percent
Sex
P
Age group
0-18
Organisation
(see glossary)
Current
data
E&W, E, GOR, ONS
area, SHA, LA,
PCO, CTY
2001
Trend
data
File-worksheet name
01N_014VS_01_V2
Note: Data for PCOs have been produced from “best fit” of Output Areas.
Numerator:
Numerator data - Numbers of dependent children in households with particular characteristics.
Source of numerator data – Office for National Statistics (ONS): Standard Tables 04, 06 and 54. Data processed
by the Department of Health (DH).
Comments on numerator data - The ONS Area Classification values for Census indicators are computed from
Local Authority (LA) data. Strategic Health Authority (SHA) values are computed from Primary Care Organisation
(PCO) data rather than LA.
For the purposes of this indicator, lone parent households can be classified as married (or re-married) if they
denote their marital status as married (or re-married) but have no spouse or partner identified in the relationship
matrix, and overcrowded households are those with more than one person per room (where the count of rooms
excluded bathrooms). The occupancy rating assumes that every household, including one person households,
requires a minimum of two common rooms (excluding bathrooms).
A household is without central heating if no living rooms or bedrooms are centrally heated.
In general a household’s accommodation is defined as an unshared dwelling if all the rooms are behind a door that
only that household can use.
Denominator:
Denominator data - The total number of dependent children in resident households.
Source of denominator data - ONS: Standard Tables – 04, 06 and 54. Data processed by DH.
Comments on denominator data - For those absent households for which no completed Census form was received
by ONS, certain data were imputed.
Statistical methods:
Census data for PCO were produced by ONS on the basis of best fit using two different methods. The 2001
Census Key Statistics tables were produced on the basis of best fit of Output Areas to PCOs, and Standard tables
(which are generally the more detailed tables, showing cross-tabulations between different variables) for health
areas were produced on the basis of best fit of wards. The “two-method approach” used by ONS is a problem, in
that the same variables for health areas appear as different totals in the Key Statistics and Standard tables. Some
of these differences are also “significant”. For a more detailed explanation see:
http://www.statistics.gov.uk/census2001/cn_96.asp
24
Disclosure protection measures applied by the ONS to 2001 Census output for England and Wales are in place in
order to prevent the inadvertent release of information about identifiable individuals. As a result, totals may
sometimes not add up. For more details about disclosure control methods see:
http://www.statistics.gov.uk/census2001/op5.asp
Percentages were obtained by dividing numbers of dependent children in households with the relevant
characteristic by the total number of dependent children in households.
Interpretation of indicators:
Quality of indicator - Annex 12 describes the criteria that should be used to judge the quality of this indicator. The
application of the criteria is dependent on the context (e.g. describing a single organisation, comparing several
organisations) and the level (e.g. national / regional with large numbers of events, local with small numbers of
events) at which the data are to be used.
Further reading:
1.
Office for National Statistics. The Census 2001 homepage. Office for National Statistics, 2004. Available at:
http://www.statistics.gov.uk/census2001/
Updated: December 2009
25
Pensioners in households
Purpose:
To provide 2001 Census based information about pensioners and types of households.
Definition of indicator and its variants:
Pensioners in households who were: living alone, without central heating, without a car.
Statistic
Number and percent of
residents in households
Sex
P
Age group
<75, 75+
Organisation
(see glossary)
Current
data
E&W, E, GOR, ONS
area, SHA, LA,
PCO, CTY
2001
Trend
data
File-worksheet name
01O_015VS_01_V2
Note: Data for PCOs have been produced from “best fit” of Output Areas.
Numerator:
Numerator data - Numbers of pensioners in households.
Source of numerator data – Office for National Statistics (ONS): Standard Tables 01. Data processed by the
Department of Health (DH).
Comments on numerator data - The ONS Area Classification values for Census indicators are computed from
Local Authority (LA) data. Strategic Health Authority (SHA) values are computed from Primary Care Organisation
(PCO) data rather than LA.
Pensioners are men aged 65 and over and women aged 60 and over. The “other type of pensioner” is one that
lives in a communal establishment i.e. a nursing home, hospital etc.
A household comprises one person living alone, or a group of people (not necessarily related) living at the same
address with common housekeeping - that is, sharing either a living room or sitting-room or at least one meal a
day.
Denominator:
Denominator data - The total number of residents in the area.
Source of denominator data - ONS: Standard Table 01. Data processed by DH.
Comments on denominator data - None.
Statistical methods:
Census data for PCOs were produced by ONS on the basis of best fit using two different methods. The 2001
Census Key Statistics tables were produced on the basis of best fit of Output Areas to PCOs, and Standard tables
(which are generally the more detailed tables, showing cross-tabulations between different variables) for health
areas were produced on the basis of best fit of wards. The “two-method approach” used by ONS is a problem, in
that the same variables for health areas appear as different totals in the Key Statistics and Standard tables. Some
of these differences are also “significant”. For a more detailed explanation see:
http://www.statistics.gov.uk/census2001/cn_96.asp
Disclosure protection measures applied by the ONS to 2001 Census output for England and Wales are in place in
order to prevent the inadvertent release of information about identifiable individuals. As a result, totals may
sometimes not add up. For more details about disclosure control methods see:
http://www.statistics.gov.uk/census2001/op5.asp
The percentage of pensioners in households was obtained by dividing the number resident in households at each
age by the corresponding total number of residents in the area. The percentage of pensioners in households with
each characteristic was obtained by dividing the number of such pensioners at each age by the corresponding
total number resident in households.
26
Interpretation of indicators:
Quality of indicator - Annex 12 describes the criteria that should be used to judge the quality of this indicator. The
application of the criteria is dependent on the context (e.g. describing a single organisation, comparing several
organisations) and the level (e.g. national / regional with large numbers of events, local with small numbers of
events) at which the data are to be used.
Further reading:
1.
Office for National Statistics. The Census 2001 homepage. Office for National Statistics, 2004. Available at:
http://www.statistics.gov.uk/census2001/
Updated: December 2009
27
Educational qualifications
Purpose:
To provide 2001 Census based information about the educational qualifications of the adult population.
Definition of indicator and its variants:
Residents with qualifications obtained after reaching the age of 16.
Statistic
Number and percent of
residents
Sex
P
Age group
16-74,
16-pensionable
age
Organisation
(see glossary)
Current
data
E&W, E, GOR, ONS
area, SHA, LA,
PCO, CTY
2001
Trend
data
File-worksheet name
01P_016VS_01_V2
Note: Data for PCOs have been produced from “best fit” of Output Areas.
Numerator:
Numerator data - Number of residents with qualifications, based on a 10% sample.
Source of numerator data – Office for National Statistics (ONS): Standard Table 105 (S105). Data processed by
the Department of Health (DH).
Comments on numerator data - The ONS Area Classification values for Census indicators are computed from
Local Authority (LA) data. Strategic Health Authority (SHA) values are computed from Primary Care Organisation
(PCO) data rather than LA.
The Census question on qualifications sought details of all professional, educational and vocational qualifications
obtained after reaching the age of 16, excluding any that would normally be obtained at school.
Denominator:
Denominator data - The total number of residents aged 16 to 74, and also estimated total number of residents
aged 16 to pensionable age in a 10% sample.
Source of denominator data - ONS: Standard Table 105 (S105). Data processed by DH.
Comments on denominator data - None.
Statistical methods:
Census data for PCOs were produced by ONS on the basis of best fit using two different methods. The 2001
Census Key Statistics tables were produced on the basis of best fit of Output Areas to PCOs, and Standard tables
(which are generally the more detailed tables, showing cross-tabulations between different variables) for health
areas were produced on the basis of best fit of wards. The “two-method approach” used by ONS is a problem, in
that the same variables for health areas appear as different totals in the Key Statistics and Standard tables. Some
of these differences are also “significant”. For a more detailed explanation see:
http://www.statistics.gov.uk/census2001/cn_96.asp
Disclosure protection measures applied by the ONS to 2001 Census output for England and Wales are in place in
order to prevent the inadvertent release of information about identifiable individuals. As a result, totals may
sometimes not add up. For more details about disclosure control methods see:
http://www.statistics.gov.uk/census2001/op5.asp
The percentage of residents aged 18 and over with qualifications was obtained by dividing the number of such
residents in the sample by the total number of residents aged 18 and over in the sample. To carry out a
comparable calculation to obtain the percentage at ages between 18 and pensionable age, it was first necessary
to estimate the total number of residents of this age in the 10% sample. This estimate was obtained by multiplying
the equivalent figure from the full count by the sampling fraction among household residents of working age; this
method differs from that used in the 1993 supplement.
Interpretation of indicators:
Quality of indicator - Annex 12 describes the criteria that should be used to judge the quality of this indicator. The
application of the criteria is dependent on the context (e.g. describing a single organisation, comparing several
28
organisations) and the level (e.g. national / regional with large numbers of events, local with small numbers of
events) at which the data are to be used.
Further reading:
1.
Office for National Statistics. The Census 2001 homepage. Office for National Statistics, 2004. Available at:
http://www.statistics.gov.uk/census2001/
Updated: December 2009
29
Social class as defined by occupation of household reference person
Purpose:
To provide 2001 Census based information about the social class of resident populations as defined by occupation
of household head.
Definition of indicator and its variants:
Residents in households with an economically active household head, by the social class of the head of
household.
Statistic
Number and percent of
residents in households
Sex
P
Age group
Organisation
(see glossary)
16 to 74
E&W, E, GOR, ONS
residents, 16-64 area, SHA, LA,
economically
PCO, CTY
active
Current
data
2001
Trend
data
File-worksheet name
01Q_017VS_01_V2
Note: Data for PCOs have been produced from “best fit” of Output Areas.
Numerator:
Numerator data - Numbers of residents in households with household reference persons aged 16-74 in the
following National Statistics Socio-Economic Classifications (NS-SECs):
•
•
•
•
•
•
•
•
•
•
•
•
Large employers and higher managerial occupations;
Higher Professional Occupations;
Lower Managerial and Professional Occupations;
Intermediate Occupations;
Small Employers and Own Account Workers;
Large Supervisory and Technical Occupations;
Semi-Routine Occupations;
Routine Occupations;
Never Worked;
Long-term Unemployed;
Full-time Students;
Not classifiable for other reasons.
Source of numerator data – Office for National Statistics (ONS): Standard Table S45 (S45). Data processed by the
Department of Health (DH).
Comments on numerator data - The ONS Area Classification values for Census indicators are computed from
Local Authority (LA) data. Strategic Health Authority (SHA) values are computed from Primary Care Organisation
(PCO) data rather than LA.
The definition of "economically active" was largely determined from answers to more than one question, including:
•
•
•
"Last week, were you doing any work: as an employee, or on a Government sponsored training scheme
or as self-employed/freelance, or in your own/family business?”;
"Last week, were you any of the following: retired, student, looking after home/family, permanently
sick/disabled or none of the above?";
"Were you actively looking for any kind of paid work during the last 4 weeks?".
The economically inactive were those allocated to the following categories: students, permanently sick, retired,
and other inactive (including looking after home or family).
The National Statistics Socio-Economic Classification (NS-SEC) was derived from information provided on
occupation and employment status. Persons aged 16 and over were asked to provide details of their main job in
the previous week (if they had a paid job in that week) or of their most recent job. Anyone with no previous paid job
was instructed to give no further occupational information (including many housewives, elderly retired,
permanently sick and young or long-term unemployed).
The household reference person (HRP) was the first person entered on the form aged 16 and over and usually
resident at the address of enumeration. No reference person was identified in households consisting entirely of
visitors.
30
“Not classifiable for other reasons” included people whose occupation had not been coded and those who could
not be allocated to an NS-SEC category.
In the NS-SEC classification all full-time students were recorded in the full-time student category regardless of
whether they were economically active or not.
For long-term unemployed the year last worked is 1999 or earlier.
Denominator:
Denominator data - The total number of household residents in the sample.
Source of denominator data - ONS: Standard Table S45 (S45). Data processed by DH.
Comments on denominator data - None
Statistical methods:
Census data for PCOs were produced by ONS on the basis of best fit using two different methods. The 2001
Census Key Statistics tables were produced on the basis of best fit of Output Areas to PCOs, and Standard tables
(which are generally the more detailed tables, showing cross-tabulations between different variables) for health
areas were produced on the basis of best fit of wards. The “two-method approach” used by ONS is a problem, in
that the same variables for health areas appear as different totals in the Key Statistics and Standard tables. Some
of these differences are also “significant”. For a more detailed explanation see:
http://www.statistics.gov.uk/census2001/cn_96.asp
Disclosure protection measures applied by the ONS to 2001 Census output for England and Wales are in place in
order to prevent the inadvertent release of information about identifiable individuals. As a result, totals may
sometimes not add up. For more details about disclosure control methods see:
http://www.statistics.gov.uk/census2001/op5.asp
Interpretation of indicators:
Quality of indicator - Annex 12 describes the criteria that should be used to judge the quality of this indicator. The
application of the criteria is dependent on the context (e.g. describing a single organisation, comparing several
organisations) and the level (e.g. national / regional with large numbers of events, local with small numbers of
events) at which the data are to be used.
Further reading:
1.
2.
Office for National Statistics. The Census 2001 homepage. Office for National Statistics, 2004. Available at:
http://www.statistics.gov.uk/census2001/
Office for National Statistics / Employment Department Group. Standard Occupational Classification. Volumes
1, 2 and 3. London: Her Majesty’s Stationery Office, 1990.
Updated: December 2009
31
National Statistics Socio-Economic Classification (NS-SEC) as defined by own
occupation
Purpose:
To provide 2001 Census based information about the National Statistics Socio-Economic (NS-SEC) Group of the
population within each area as defined by own occupation.
Definition of indicator and its variants:
Economically active and non-active residents of households and those aged 16-64 who are economically active by
National Statistics Socio-Economic classification as defined by own occupation.
Statistic
Number and percent of
residents in households
Sex
MF
Age group
Organisation
(see glossary)
16-74 econ.
E&W, E, GOR, ONS
active, 16-64 by area, SHA, LA,
SEC
PCO, CTY
Current
data
2001
Trend
data
File-worksheet name
01R_018VS_01_V2
Note: Data for PCOs have been produced from “best fit” of Output Areas.
Numerator:
Numerator data - Numbers of people aged 16-64 by National Statistics Socio-economic Classification (NS-SEC)
and number aged 16-74 who were economically active in the following NS-SECs:
•
•
•
•
•
•
•
•
•
•
•
•
Higher Managerial and Professional Occupations;
Higher Professional Occupations;
Lower Managerial and Professional Occupations;
Intermediate Occupations;
Small Employers and Own Account Workers;
Lower Supervisory and Technical Occupations;
Semi-Routine Occupations;
Routine Occupations;
Never Worked;
Long-term Unemployed;
Full-time Students;
Not classifiable for other reasons.
Source of numerator data – Office for National Statistics (ONS): Standard Tables 23 and 26 (S23 and S26). Data
processed by the Department of Health (DH).
Comments on numerator data - The ONS Area Classification values for Census indicators are computed from
Local Authority (LA) data. Strategic Health Authority (SHA) values are computed from Primary Care Organisation
(PCO) data rather than LA.
The definition of "economically active" was largely determined from answers to more than one question, including:
•
•
•
"Last week, were you doing any work: as an employee, or on a Government sponsored training scheme
or as self-employed/freelance, or in your own/family business?”;
"Last week, were you any of the following: retired, student, looking after home/family, permanently
sick/disabled or none of the above?";
"Were you actively looking for any kind of paid work during the last 4 weeks?".
The economically inactive were those allocated to the following categories: students, permanently sick, retired,
and other inactive (including looking after home or family).
National Statistics Socio-Economic Classification (NS-SEC) was derived from information provided on occupation
and employment status. Persons aged 16 and over were asked to provide details of their main job in the previous
week (if they had a paid job in that week) or of their most recent job. Anyone with no previous paid job was
instructed to give no further occupational information (including many housewives, elderly retired, permanently sick
and young or long-term unemployed).
32
Denominator:
Denominator data - The total number of male and female residents aged 16-64, and household residents aged 1674.
Source of denominator data - ONS: Standard Tables 23 and 26 (S23 & S26). Data processed by DH.
Comments on denominator data - For those absent households for which no completed Census form was received
by ONS, certain data were imputed.
Statistical methods:
Census data for PCOs were produced by ONS on the basis of best fit using two different methods. The 2001
Census Key Statistics tables were produced on the basis of best fit of Output Areas to PCOs, and Standard tables
(which are generally the more detailed tables, showing cross-tabulations between different variables) for health
areas were produced on the basis of best fit of wards. The “two-method approach” used by ONS is a problem, in
that the same variables for health areas appear as different totals in the Key Statistics and Standard tables. Some
of these differences are also “significant”. For a more detailed explanation see:
http://www.statistics.gov.uk/census2001/cn_96.asp
Disclosure protection measures applied by the ONS to 2001 Census output for England and Wales are in place in
order to prevent the inadvertent release of information about identifiable individuals. As a result, totals may
sometimes not add up. For more details about disclosure control methods see:
http://www.statistics.gov.uk/census2001/op5.asp
The percentages of men and women resident in households who were economically active or retired were
obtained by dividing the number of such residents in the sample by the total number of men and women,
respectively, in the sample who were resident in households.
The percentage distribution by NS-SEC was obtained by dividing the number of men and women resident in each
area in each group by the total number of men and women resident in each area.
Interpretation of indicators:
Quality of indicator - Annex 12 describes the criteria that should be used to judge the quality of this indicator. The
application of the criteria is dependent on the context (e.g. describing a single organisation, comparing several
organisations) and the level (e.g. national / regional with large numbers of events, local with small numbers of
events) at which the data are to be used.
Further reading:
1.
2.
Office for National Statistics. The Census 2001 homepage. Office for National Statistics, 2004. Available at:
http://www.statistics.gov.uk/census2001/
Office for National Statistics / Employment Department Group. Standard Occupational Classification. Volumes
1, 2 and 3. London: Her Majesty’s Stationery Office, 1990.
Updated: December 2009
33
Lone parent families with dependent children
Purpose:
To provide 2001 Census based information about lone parent families with dependent children.
Definition of indicator and its variants:
Lone parent families with dependent children.
A dependent child is a person in a household aged 0-15 (whether or not in a family) or a person aged 16-18 who is
a full-time student in a family with parent(s).
Statistic
Number and percent
Sex
P
Age group
0-18
Organisation
(see glossary)
Current
data
E&W, E, GOR, ONS
area, SHA, LA,
PCO, CTY
2001
Trend
data
File-worksheet name
01S_019VS_01_V3
Note: Data for PCOs have been produced from “best fit” of Output Areas.
Numerator:
Numerator data - Numbers of all lone parent families and lone parent families with dependent children.
Source of numerator data - ONS: Standard Table 06 (S06). Data were originally processed by the Department of
Health (DH). Corrected data were downloaded via Census Area Statistics on the Web (Casweb).
Comments on numerator data - The ONS Area Classification values for Census indicators are computed from
Local Authority (LA) data.
For the purposes of this table, a lone parent is defined as an adult with a dependent child living in a household with
no other persons (whether related to that dependent child or not). Lone parents can be classified as married (or remarried) if they denote their marital status as married (or re-married), but have no spouse or partner identified in
the relationship matrix.
Family units in a household were determined on the basis of the age, sex, marital status, long-term illness, and
relationship in household of every resident in the household. A family comprises one of the following groups:
married couple family (a married couple with or without their never-married children including childless couples);
cohabiting couple family (two persons of the opposite sex living together as a couple with or without their nevermarried children, including childless couples); lone parent family (a mother or father together with her/his nevermarried children).
Grandparents residing with their grandchildren were counted as a family if the grandchildren's parents were not
resident in the household. Households consisting entirely of persons aged under 16 were not grouped into
families.
Denominator:
Denominator data - The total number of families in the sample, total number of families with dependent children in
the sample, and total number of dependent children in families in the sample.
Source of denominator data - ONS: Standard Table 06 (S06). Data originally processed by the Department of
Health (DH). Corrected data were downloaded via Census Area Statistics on the Web (Casweb).
Comments on denominator data - For those absent households for which no completed Census form was received
by ONS, certain data were imputed.
Statistical methods:
Census data for PCOs were produced by ONS on the basis of best fit using two different methods. The 2001
Census Key Statistics tables were produced on the basis of best fit of Output Areas to PCOs, and Standard tables
(which are generally the more detailed tables, showing cross-tabulations between different variables) for health
areas were produced on the basis of best fit of wards. The “two-method approach” used by ONS is a problem, in
that the same variables for health areas appear as different totals in the Key Statistics and Standard tables. Some
of these differences are also “significant”. For a more detailed explanation see:
http://www.statistics.gov.uk/census2001/cn_96.asp
34
Disclosure protection measures applied by the ONS to 2001 Census output for England and Wales are in place in
order to prevent the inadvertent release of information about identifiable individuals. As a result, totals may
sometimes not add up. For more details about disclosure control methods see:
http://www.statistics.gov.uk/census2001/op5.asp
Percentages of all families that are lone parents with dependent children were obtained by dividing numbers of
lone parent families with dependent children by the total number of families. Percentages of families with
dependent children that are lone parent families were obtained by dividing numbers of lone parent families with
dependent children by the total number of families with dependent children. Percentages of dependent children in
families that are lone parent families were obtained by dividing the number of dependent children in lone parent
families by the total number of dependent children in families.
Interpretation of indicators:
Quality of indicator - Annex 12 describes the criteria that should be used to judge the quality of this indicator. The
application of the criteria is dependent on the context (e.g. describing a single organisation, comparing several
organisations) and the level (e.g. national / regional with large numbers of events, local with small numbers of
events) at which the data are to be used.
Further reading:
1.
Office for National Statistics. The Census 2001 homepage. Office for National Statistics, 2004. Available at:
http://www.statistics.gov.uk/census2001/
Updated: August 2010
35
Standard of health in preceding 12 months
Purpose:
To provide 2001 Census based information about the health of resident populations over the preceding 12 months.
Definition of indicator and its variants:
Standard of health of residents over the preceding 12 months: Good, Fairly Good, or Not Good.
Statistic
Number and percent of
residents in households
Sex
P
Age group
All ages
Organisation
(see glossary)
Current
data
E&W, E, GOR, ONS
area, SHA, LA,
PCO, CTY
2001
Trend
data
File-worksheet name
01T_501VS_01_V2
Note: Data for PCOs have been produced from “best fit” of Output Areas.
Numerator:
Numerator data - Number of household residents with good, fairly good or not good health.
Source of numerator data – Office for National Statistics (ONS): Standard Table 16 (S16). Data processed by the
Department of Health (DH).
Comments on numerator data - The ONS Area Classification values for Census indicators are computed from
Local Authority (LA) data. Strategic Health Authority (SHA) values are computed from Primary Care Organisation
(PCO) data rather than LA.
A person's health is based on replies to the question "Over the last twelve months would you say your health has
on the whole been: Good, Fairly good or Not good?"
Denominator:
Denominator data - The total number of residents in the area.
Source of denominator data - ONS: Standard Table 16 (S16). Data processed by DH.
Comments on denominator data - For those absent households for which no completed Census form was received
by ONS, certain data were imputed.
Statistical methods:
Census data for PCOs were produced by ONS on the basis of best fit using two different methods. The 2001
Census Key Statistics tables were produced on the basis of best fit of Output Areas to PCOs, and Standard tables
(which are generally the more detailed tables, showing cross-tabulations between different variables) for health
areas were produced on the basis of best fit of wards. The “two-method approach” used by ONS is a problem, in
that the same variables for health areas appear as different totals in the Key Statistics and Standard tables. Some
of these differences are also “significant”. For a more detailed explanation see:
http://www.statistics.gov.uk/census2001/cn_96.asp
Disclosure protection measures applied by the ONS to 2001 Census output for England and Wales are in place in
order to prevent the inadvertent release of information about identifiable individuals. As a result, totals may
sometimes not add up. For more details about disclosure control methods see:
http://www.statistics.gov.uk/census2001/op5.asp
Percentages were obtained by dividing numbers of residents in each of the three groups by the corresponding
total number of residents in the area.
Interpretation of indicators:
Quality of indicator - Annex 12 describes the criteria that should be used to judge the quality of this indicator. The
application of the criteria is dependent on the context (e.g. describing a single organisation, comparing several
organisations) and the level (e.g. national / regional with large numbers of events, local with small numbers of
events) at which the data are to be used.
36
Further reading:
1.
Office for National Statistics. The Census 2001 homepage. Office for National Statistics, 2004. Available at:
http://www.statistics.gov.uk/census2001/
Updated: December 2009
37
Provision of unpaid care
Purpose:
To provide 2001 Census based information about unpaid care.
Definition of indicator and its variants:
Household residents providing various levels of unpaid care.
Statistic
Number and percent of
residents in households
Sex
P
Age group
All ages
Organisation
(see glossary)
Current
data
E&W, E, GOR, ONS
area, SHA, LA,
PCO, CTY
2001
Trend
data
File-worksheet name
01U_502VS_01_V2
Note: Data for PCOs have been produced from “best fit” of Output Areas.
Numerator:
Numerator data - Number of residents providing unpaid care, by level of care:
•
•
•
•
no care;
1 to 19 hours;
20 to 49 hours;
50 + hours.
Source of numerator data – Office for National Statistics (ONS): Standard Table 25 (S25). Data processed by the
Department of Health (DH).
Comments on numerator data - The ONS Area Classification values for Census indicators are computed from
Local Authority (LA) data. Strategic Health Authority (SHA) values are computed from Primary Care Organisation
(PCO) data rather than LA.
Numbers of persons providing care are based on the replies to the following question "Do you look after, or give
any help or support to family members, friends, neighbours or others because of: long-term physical or mental illhealth or disability, or problems related to old age? (Do not count anything you do as part of your paid
employment. Tick time spent in a typical week)".
Denominator:
Denominator data - The total number of residents in the area.
Source of denominator data - ONS: Standard Table 25 (S25). Data processed by DH.
Comments on denominator data - For those absent households for which no completed Census form was received
by ONS, certain data were imputed.
Statistical methods:
Census data for PCOs were produced by ONS on the basis of best fit using two different methods. The 2001
Census Key Statistics tables were produced on the basis of best fit of Output Areas to PCOs, and Standard tables
(which are generally the more detailed tables, showing cross-tabulations between different variables) for health
areas were produced on the basis of best fit of wards. The “two-method approach” used by ONS is a problem, in
that the same variables for health areas appear as different totals in the Key Statistics and Standard tables. Some
of these differences are also “significant”. For a more detailed explanation see:
http://www.statistics.gov.uk/census2001/cn_96.asp
Disclosure protection measures applied by the ONS to 2001 Census output for England and Wales are in place in
order to prevent the inadvertent release of information about identifiable individuals. As a result, totals may
sometimes not add up. For more details about disclosure control methods see:
http://www.statistics.gov.uk/census2001/op5.asp
Percentages were obtained by dividing the number of residents providing each of the "level of care groups" by the
corresponding total number of residents in the area.
38
Interpretation of indicators:
Quality of indicator - Annex 12 describes the criteria that should be used to judge the quality of this indicator. The
application of the criteria is dependent on the context (e.g. describing a single organisation, comparing several
organisations) and the level (e.g. national / regional with large numbers of events, local with small numbers of
events) at which the data are to be used.
Further reading:
1.
Office for National Statistics. The Census 2001 homepage. Office for National Statistics, 2004. Available at:
http://www.statistics.gov.uk/census2001/
Updated: December 2009
39
Health of providers of unpaid care
Purpose:
To provide 2001 Census based information about resident populations' general health by the amount of care that
they provide.
Definition of indicator and its variants:
General health of providers of unpaid care.
Statistic
Number and percent
Sex
P
Age group
All ages
Organisation
(see glossary)
Current
data
E&W, E, GOR, ONS
area, SHA, LA,
PCO, CTY
2001
Trend
data
File-worksheet name
01V_504VS_01_V2
Note: Data for PCOs have been produced from “best fit” of Output Areas.
Numerator:
Numerator data - Number of residents providing care by their state of health.
Source of numerator data - Office for National Statistics (ONS): Standard Table 25 (S25). Data processed by the
Department of Health (DH).
Comments on numerator data - The ONS Area Classification values for Census indicators are computed from
Local Authority (LA) data. Strategic Health Authority (SHA) values are computed from Primary Care Organisation
(PCO) data rather than LA.
Person’s health is based on replies to the question "Over the last twelve months would you say your health has on
the whole been: Good, Fairly good or Not good?"
Numbers of persons providing care are based on the replies to the following question:
"Do you look after, or give any help or support to family members, friends, neighbours or others because of: longterm physical or mental ill-health or disability, or problems related to old age?"
This excludes anything done as part of paid employment. This response is recorded as time spent in a typical
week as follows:
•
•
•
•
no care;
1 to 19 hours;
20 to 49 hours;
50 + hours.
Denominator:
Denominator data - The total number of carers in the area.
Source of denominator data - ONS: Standard Table 25 (S25). Data processed by DH.
Comments on denominator data - For those absent households for which no completed Census form was received
by ONS, certain data were imputed.
Statistical methods:
Census data for PCOs were produced by ONS on the basis of best fit using two different methods. The 2001
Census Key Statistics tables were produced on the basis of best fit of Output Areas to PCOs, and Standard tables
(which are generally the more detailed tables, showing cross-tabulations between different variables) for health
areas were produced on the basis of best fit of wards. The “two-method approach” used by ONS is a problem, in
that the same variables for health areas appear as different totals in the Key Statistics and Standard tables. Some
of these differences are also “significant”. For a more detailed explanation see:
http://www.statistics.gov.uk/census2001/cn_96.asp
40
Disclosure protection measures applied by the ONS to 2001 Census output for England and Wales are in place in
order to prevent the inadvertent release of information about identifiable individuals. As a result, totals may
sometimes not add up. For more details about disclosure control methods see:
http://www.statistics.gov.uk/census2001/op5.asp
Percentages were obtained by dividing numbers of each level of person's health and amount of care they provide
by total number of household residents of good health, fairly good health or not good health as appropriate.
Interpretation of indicators:
Quality of indicator - Annex 12 describes the criteria that should be used to judge the quality of this indicator. The
application of the criteria is dependent on the context (e.g. describing a single organisation, comparing several
organisations) and the level (e.g. national / regional with large numbers of events, local with small numbers of
events) at which the data are to be used.
Further reading:
1.
Office for National Statistics. The Census 2001 homepage. Office for National Statistics, 2004. Available at:
http://www.statistics.gov.uk/census2001/
Updated: December 2009
41
Religion
Purpose:
To provide 2001 Census based information about resident populations' religions.
Definition of indicator and its variants:
Resident populations by type of religion.
Statistic
Number and percent of all
residents
Sex
P
Age group
All ages
Organisation
(see glossary)
Current
data
E&W, E, GOR, ONS
area, SHA, LA,
PCO, CTY
2001
Trend
data
File-worksheet name
01W_503VS_01_V2
Note: Data for PCOs have been produced from “best fit” of Output Areas.
Numerator:
Numerator data - Number of residents by type of religion.
Source of numerator data – Office for National Statistics (ONS): Standard Table 149 (S149). Data processed by
the Department of Health (DH).
Comments on numerator data - The ONS Area Classification values for Census indicators are computed from
Local Authority (LA) data. Strategic Health Authority (SHA) values are computed from Primary Care Organisation
(PCO) data rather than LA.
This was the only voluntary question in the Census. Numbers of persons by religion is based on replies to the
question "What is your religion" where the following boxed replies were allowed: "None", "Christian", "Buddhist",
"Hindu", "Jewish", "Muslim", "Sikh", and "Any other religion".
Denominator:
Denominator data - The total number of residents in the area excluding those where religion was not stated.
Source of denominator data - ONS: Standard Table 149 (S149). Data processed by DH.
Comments on denominator data - For those absent households for which no completed Census form was received
by ONS, certain data were imputed.
Statistical methods:
Census data for PCOs were produced by ONS on the basis of best fit using two different methods. The 2001
Census Key Statistics tables were produced on the basis of best fit of Output Areas to PCOs, and Standard tables
(which are generally the more detailed tables, showing cross-tabulations between different variables) for health
areas were produced on the basis of best fit of wards. The “two-method approach” used by ONS is a problem, in
that the same variables for health areas appear as different totals in the Key Statistics and Standard tables. Some
of these differences are also “significant”. For a more detailed explanation see:
http://www.statistics.gov.uk/census2001/cn_96.asp
Disclosure protection measures applied by the ONS to 2001 Census output for England and Wales are in place in
order to prevent the inadvertent release of information about identifiable individuals. As a result, totals may
sometimes not add up. For more details about disclosure control methods see:
http://www.statistics.gov.uk/census2001/op5.asp
Percentages were obtained by dividing number of residents of each religion by the corresponding total number of
residents in the area.
Interpretation of indicators:
Quality of indicator - Annex 12 describes the criteria that should be used to judge the quality of this indicator. The
application of the criteria is dependent on the context (e.g. describing a single organisation, comparing several
organisations) and the level (e.g. national / regional with large numbers of events, local with small numbers of
events) at which the data are to be used.
42
Further reading:
1.
Office for National Statistics. The Census 2001 homepage. Office for National Statistics, 2004. Available at:
http://www.statistics.gov.uk/census2001/
Updated: December 2009
43
Fat consumption
Purpose:
To reduce the proportion of food energy derived from saturated fatty acids and total fat.
Definition of indicator and its variants:
The proportion of food energy derived from household food and drink excluding alcohol.
Statistic
Sex
Age group
Percent of household food
energy derived from saturated
fatty acids
P
All ages
Percent of household food
energy derived from saturated
fatty acids
P
Percent of household food
energy derived from total fat
Percent of household food
energy derived from total fat
Organisation
(see glossary)
Current
data
Trend
data
E, GOR
2006-08
All ages
E, GOR
2008
P
All ages
E, GOR
2006-08
P
All ages
E, GOR
2008
FY
1996/971998/99
to
2005-07
FY
2001/02
to
2007
FY
1996/971998/99
to
2005-07
FY
2001/02
to
2007
File-worksheet name
02A_051PCP1_08_V1
02A_051PCP2_08_V1
02A_051PCP3_08_V1
02A_051PCP4_08_V1
Numerator:
Numerator data - Estimates of energy derived from saturated fatty acids and total fat by households in a sample
survey of randomly selected private households in the United Kingdom.
Source of numerator data - Expenditure and Food Survey.
Comments on numerator data - The Expenditure and Food Survey (EFS) replaced the National Food Survey
(NFS) and the Family Expenditure Survey (FES) from 1 April 2001. The EFS is a continuous survey of households
in the United Kingdom comissioned jointly by the Office for National Statistics (ONS) and the Department for
Environment, Food and Rural Affairs (DEFRA).
Estimates from the EFS are more accurate than those from the original NFS data due to design improvements.
These include the use of till receipts and the use of individual two-week diaries for each member of the
participating household aged 7 years and over. As a result of the improved recording methods, the EFS shows
higher amounts of expenditure, consumption, and nutrient intakes overall.
The EFS was run on a financial year basis until 2005/06, unlike NFS, which produced results by calendar year.
Although the EFS results should not be compared directly with the NFS results, a methodology has been
developed to provide scaling factors for adjusting NFS results at household level. Despite discontinuities between
the two surveys that make construction of a longer term time series very difficult, NFS results from 1996 have
been scaled up for comparison with the EFS and the data show the series on a financial year basis back to
1996/97. However, any comparisons with the discontinued NFS should be treated with caution.
For the 2006 results the survey has moved onto a calendar year basis (from the previous financial year basis) in
preparation for its integration to the Continuous Population Survey (CPS) from January 2008. As a consequence,
the January 2006 to March 2006 data are common between the 2005/06 financial year results and the 2006
calendar year results. The duplication of January - March 2006 when the survey switched from financial year to
calendar year has been removed from calculation.
Denominator:
Denominator data - A sample of randomly selected private households in the United Kingdom.
Source of denominator data - Expenditure and Food Survey.
44
Comments on denominator data - The EFS survey is based on a sample of randomly selected target households
in the United Kingdom. For the background information and detailed description of the survey see:
http://www.statistics.gov.uk/ssd/surveys/expenditure_food_survey.asp
Statistical methods:
Data presented here are rolling three-year weighted averages of the percentages. The three-year weighted
averages are derived by weighting the estimates for each year by the sample size. For more details see the
methodological note available at:
http://statistics.defra.gov.uk/esg/publications/efs/method/method_EFS_sampling.pdf
Interpretation of indicators:
Quality of indicator - Annex 12 describes the criteria that should be used to judge the quality of this indicator. The
application of the criteria is dependent on the context (e.g. describing a single organisation, comparing several
organisations) and the level (e.g. national / regional with large numbers of events, local with small numbers of
events) at which the data are to be used.
Further reading:
1.
A National Statistics Publication by DEFRA. Family Food in 2007. London: TSO, 2008. Available at:
https://statistics.defra.gov.uk/esg/publications/efs/2008/complete.pdf
2. A National Statistics Publication by DEFRA. Family Food in 2007. London: TSO, 2008. Available at:
https://statistics.defra.gov.uk/esg/publications/efs/2007/complete.pdf
3. Department for Environment, Food and Rural Affairs and National Statistics. Family Food. An annual report on
the 2006 Expenditure and Food Survey. London: TSO, 2008. Available at:
https://statistics.defra.gov.uk/esg/publications/efs/2006cal/complete.pdf
4. Department for Environment, Food and Rural Affairs and National Statistics. Family Food. An annual report on
the 2005-06 Expenditure and Food Survey. London: TSO, 2007. Available at:
http://statistics.defra.gov.uk/esg/publications/efs/2006/complete.pdf
5. Department for Environment, Food and Rural Affairs and National Statistics. Family Food. An annual report on
the 2004-05 Expenditure and Food Survey. London: TSO, 2006. Available at:
http://statistics.defra.gov.uk/esg/publications/efs/2005/complete.pdf
6. Department for Environment, Food and Rural Affairs and National Statistics. Family Food. An annual report on
the 2003-04 Expenditure and Food Survey. London: TSO, 2005. Available at:
http://statistics.defra.gov.uk/esg/publications/efs/2004/complete.pdf
7. Department for Environment, Food and Rural Affairs and National Statistics. Family Food. An annual report on
the 2002-03 Expenditure and Food Survey. London: The Stationery Office, 2004. Available at:
http://statistics.defra.gov.uk/esg/publications/efs/2003/familyfood.pdf
8. Department for Environment, Food and Rural Affairs and National Statistics. Expenditure and Food Survey:
House Food Consumption, Expenditure and Nutrient Intakes 1st April 2001 to 31st March 2002. First results
from the Expenditure and Food Survey. London: Office for National Statistics, 2003.
9. Department for Environment, Food and Rural Affairs. National Food Survey 2000: annual report on food
expenditure, consumption and nutrient intakes. London: The Stationery Office, 2001.
10. Department of Health. The Health of the Nation: A Strategy for Health in England. London: Her Majesty’s
Stationery Office, 1992.
11. Department of Health. Our Healthier Nation: A Contract for Health. A Consultation Paper. London: The
Stationery Office, 1998.
Updated: March 2010
45
Body Mass Index
Purpose:
To help reduce the prevalence of obesity.
Definition of indicator and its variants:
Observed body mass index (BMI) of adults.
Statistic
Mean and age-standardised
mean
Sex
Age group
MFP 16+
Organisation
(see glossary)
E, GOR, ONS area,
SHA, CTY
Current
data
Trend
data
File-worksheet name
2001-03
2002-04
2003-05
2004-06
2005-07
2006-08 1998-08
02D_310VSP1_08_V1
02D_310VSP2_08_V1
Numerator:
Numerator data - The BMI calculated for persons aged 16+ in a sample survey of the health of the population of
England.
Source of numerator data - Health Survey for England (HSE), commissioned by the Department of Health and
since April 2005 The Information Centre for health and social care and carried out by the Joint Health Survey Unit
of Social and Community Planning Research and of the Department of Epidemiology and Public Health at
University College, London.
Comments on numerator data - Body mass index is defined as weight in kg divided by the square height in metres.
Adults (aged 16 and over) can be classified into the following BMI groups:
•
•
•
•
•
2
Underweight - less than 18.5 kg/m
Normal - 18.5 to less than 25 kg/m2;
Overweight - over 25 to less than 30 kg/m2;
Obese - over 30 kg/m2;
‘Morbid obesity’ – 40 kg/m2 or more.
BMI was calculated for all respondents who had valid height and weight measurements. The height of respondents
who were chair-bound, unsteady, or could not stand straight was not measured. Data for those who were
considered by the interviewer to have unreliable measurements (e.g. wearing a wig, turban) were excluded from
the analysis. The weight of respondents who were pregnant, chair bound, unsteady, or could not stand was not
measured. Those who weighed more than 130 kg were asked for an “estimated weight” because the scales were
unreliable above this level. These have been included in the analysis.
Denominator:
Denominator data - Respondents (with measurements) aged 16+ in a sample survey of the health of the
population of England.
Source of denominator data - See “Numerator data”.
Comments on denominator data - The HSE is a series of annual surveys that began in 1991 with the aim of
monitoring the health of the population. It was designed to measure health and health related behaviours in adults
and children living in private households in England. For each participant, the survey included an interview and a
physical examination by a nurse, at which various physical measurements, tests, and samples of blood and saliva
were collected. These measurements provided biomedical information about known risk factors associated with
disease and objective validation for self-reported health behaviour.
Statistical methods:
The figures have been provided for three-year periods (based on three-year moving averages) and for calendar
years. All calculations of sub-national observed estimates at Government Office Region, ONS area, Strategic
Health Authority and County levels, age-standardised rates, confidence intervals and significance tests were
carried out by the National Centre for Social Research (see Annex 9 for details).
46
Interpretation of indicators:
Quality of indicator - Annex 12 describes the criteria that should be used to judge the quality of this indicator. The
application of the criteria is dependent on the context (e.g. describing a single organisation, comparing several
organisations) and the level (e.g. national / regional with large numbers of events, local with small numbers of events)
at which the data are to be used.
Further reading:
1.
2.
3.
4.
Craig R and Mindell (eds). Health Survey for England 2006. Volume 1: Cardiovascular disease and risk
factors in adults. The Information Centre, Leeds, 2008. Available at:
http://www.ic.nhs.uk/webfiles/publications/HSE06/HSE%2006%20report%20VOL%201%20v2.pdf
Craig R and Mindell (eds). Health Survey for England 2006. Volume 3: Methodology and documentation. The
Information Centre, Leeds, 2008. Available at:
http://www.ic.nhs.uk/webfiles/publications/HSE06/HSE06_VOL3.pdf
Scholes S, Prescott A and Bajekal M. Health and lifestyle indicators for Strategic Health Authorities, 19942002, London: National Centre for Social Research, 2004. Available at:
http://www.dh.gov.uk/assetRoot/04/07/77/31/04077731.pdf
Prescott-Clarke P, Primatesta P. Health Survey for England - The Health of Young People '95 - 97. London:
The Stationery Office, 1998.
Updated: November 2010
47
Adults who are overweight
Purpose:
To help reduce the prevalence of obesity.
Definition of indicator and its variants:
2
Proportion of adults with a Body Mass Index (BMI) greater than 25 and under 30 kg/m .
Statistic
Number, percent and
age-standardised percent
Sex
Age group
MFP 16+
Organisation
(see glossary)
Current
data
E, GOR, ONS area,
SHA, CTY
2001-03
2002-04
2003-05
2004-06
2005-07
2006-08
Trend
data
File-worksheet name
02E_311VSP1_08_V1
1998-08 02E_311VSP2_08_V1
Numerator:
Numerator data - The number of persons aged 16+ who are overweight in a sample survey of the health of the
population of England. Overweight people are defined as having a BMI of 25 to 30.
Source of numerator data - Health Survey for England (HSE), commissioned by the Department of Health and
since April 2005 The Information Centre for health and social care and carried out by the Joint Health Survey Unit
of Social and Community Planning Research and of the Department of Epidemiology and Public Health at
University College, London (See “Further reading”).
Comments on numerator data - Overweight, defined by body mass index (weight in kilograms divided by height in
metres squared), was calculated for all respondents who had valid height and weight measurements (see
“Comments on numerator data” section of BMI indicator for definition of valid height and weight measurements).
Denominator:
Denominator data - Respondents (with measurements) aged 16+ in a sample survey of the health of the
population of England.
Source of denominator data - See “Numerator data”.
Comments on denominator data - The HSE is a series of annual surveys that began in 1991 with the aim of
monitoring the health of the population. It was designed to measure health and health related behaviours in adults
and children living in private households in England. For each participant, the survey included an interview and a
physical examination by a nurse, at which various physical measurements, tests, and samples of blood and saliva
were collected. These measurements provided biomedical information about known risk factors associated with
disease and objective validation for self-reported health behaviour.
Statistical methods:
The figures have been provided for three-year periods (based on three-year moving averages) and for calendar
years. All calculations of sub-national observed estimates at Government Office Region, ONS area, Strategic
Health Authority and County levels, age-standardised rates, confidence intervals and significance tests were
carried out by the National Centre for Social Research (see Annex 9 for details).
Interpretation of indicators:
Quality of indicator - Annex 12 describes the criteria that should be used to judge the quality of this indicator. The
application of the criteria is dependent on the context (e.g. describing a single organisation, comparing several
organisations) and the level (e.g. national / regional with large numbers of events, local with small numbers of
events) at which the data are to be used.
Further reading:
1.
Craig R and Mindell (eds). Health Survey for England 2006. Volume 1: Cardiovascular disease and risk
factors in adults. The Information Centre, Leeds, 2008. Available at:
http://www.ic.nhs.uk/webfiles/publications/HSE06/HSE%2006%20report%20VOL%201%20v2.pdf
48
2.
3.
4.
Craig R and Mindell (eds). Health Survey for England 2006. Volume 3: Methodology and documentation. The
Information Centre, Leeds, 2008. Available at:
http://www.ic.nhs.uk/webfiles/publications/HSE06/HSE06_VOL3.pdf
Scholes S, Prescott A and Bajekal M. Health and lifestyle indicators for Strategic Health Authorities, 19942002, London: National Centre for Social Research, 2004. Available at:
http://www.dh.gov.uk/assetRoot/04/07/77/31/04077731.pdf
Department of Health. The Health Survey for England 1998 - Cardiovascular Disease. London: Her Majesty’s
Stationery Office, 1998.
Updated: November 2010
49
Obesity
Purpose:
To help reduce the prevalence of obesity.
Definition of indicator and its variants:
2
Observed and age-standardised proportion of adults with a Body Mass Index (BMI) greater than 30 kg/m .
Statistic
Number, percent and
age-standardised percent
Sex
Age group
MFP 16+
Organisation
(see glossary)
Current
data
E, GOR, ONS area,
SHA, CTY
2001-03
2002-04
2003-05
2004-06
2005-07
2006-08
Trend
data
File-worksheet name
02F_312VSP1_08_V1
1998-08 02F_312VSP2_08_V1
Numerator:
Numerator data - The number of persons aged 16+ who are obese in a sample survey of the health of the
population of England.
Source of numerator data - Health Survey for England (HSE), commissioned by the Department of Health and
since April 2005 The Information Centre for health and social care and carried out by the Joint Health Survey Unit
of Social and Community Planning Research and of the Department of Epidemiology and Public Health at
University College, London.
Comments on numerator data - Obesity, defined by Body Mass Index (weight in kilograms divided by height in
metres squared), was calculated for all respondents who had valid height and weight measurements (see
“Comments on numerator data” section of BMI indicator for definition of valid height and weight measurements).
Denominator:
Denominator data - Respondents aged 16+ with measurements in a sample survey of the health of the population
of England.
Source of denominator data - See “Numerator data”.
Comments on denominator data - The HSE is a series of annual surveys that began in 1991 with the aim of
monitoring the health of the population. It was designed to measure health and health related behaviours in adults
and children living in private households in England. For each participant, the survey included an interview and a
physical examination by a nurse, at which various physical measurements, tests, and samples of blood and saliva
were collected. These measurements provided biomedical information about known risk factors associated with
disease and objective validation for self-reported health behaviour.
Statistical methods:
The figures have been provided for three-year periods (based on three-year moving averages) and for calendar
years. All calculations of sub-national observed estimates at Government Office Region, ONS area, Strategic
Health Authority and County levels, age-standardised rates, confidence intervals and significance tests were
carried out by the National Centre for Social Research (see Annex 9 for details).
Interpretation of indicators:
Quality of indicator - Annex 12 describes the criteria that should be used to judge the quality of this indicator. The
application of the criteria is dependent on the context (e.g. describing a single organisation, comparing several
organisations) and the level (e.g. national / regional with large numbers of events, local with small numbers of
events) at which the data are to be used.
Further reading:
1.
Craig R and Mindell (eds). Health Survey for England 2006. Volume 1: Cardiovascular disease and risk
factors in adults. The Information Centre, Leeds, 2008. Available at:
http://www.ic.nhs.uk/webfiles/publications/HSE06/HSE%2006%20report%20VOL%201%20v2.pdf
50
2.
3.
4.
5.
6.
Craig R and Mindell (eds). Health Survey for England 2006. Volume 3: Methodology and documentation. The
Information Centre, Leeds, 2008. Available at:
http://www.ic.nhs.uk/webfiles/publications/HSE06/HSE06_VOL3.pdf
Scholes S, Prescott A and Bajekal M. Health and lifestyle indicators for Strategic Health Authorities, 19942002, London: National Centre for Social Research, 2004. Available at:
http://www.dh.gov.uk/assetRoot/04/07/77/31/04077731.pdf
Joint Health Surveys Unit, National Centre for Social Research and Department of Epidemiology and Public
Health, the Royal Free and University College Medical School. The Health Survey for England: The health of
minority ethnic groups '99. London: Her Majesty’s Stationery Office, 2001.
Department of Health. Our Healthier Nation: A Contract for Health. A Consultation Paper. London: Her
Majesty’s Stationery Office, 1998.
Department of Health. The Health of the Nation: A Strategy for Health in England. London: Her Majesty’s
Stationery Office, 1992.
Updated: November 2010
51
Cigarette smoking
Purpose:
To help reduce the prevalence of smoking.
Definition of indicator and its variants:
The prevalence of smoking:
(i)
Proportion of current cigarette smokers based on the results from General Lifestyle Survey;
(ii)
Proportion of self-reported current cigarette smokers based on results from the Health Survey for England.
Statistic
Sex
Age group
Organisation
(see glossary)
Percent (i)
MFP 16+
E, GOR
Number, percent and
age-standardised percent (ii)
MFP 16+
E, GOR, ONS area,
SHA, CTY
Current
data
2008
2001-03
2002-04
2003-05
2004-06
2005-07
2006-08
Trend
data
File-worksheet name
1998, 02G_314PC_08_V1
2000 to
2007
02G_314VSP1_08_V1
1998-08 02G_314VSP2_08_V1
Numerator:
Numerator data –
(i)
Current smokers aged 16+ in a sample survey of the general population resident in private households in
Britain;
(ii)
Current smokers aged 16+ in a sample survey of the health of the population of England.
Source of numerator data (i)
General Lifestyle Survey (GLF) formerly known as the General Household Survey (GHS) - a multi-purpose
continuous survey carried out by the Office for National Statistics (ONS) as part of the Integrated Household
Survey (IHS).
(ii) Health Survey for England (HSE), commissioned by the Department of Health and since April 2005 The
Information Centre for health and social care and carried out by the Joint Health Survey Unit of Social and
Community Planning Research and of the Department of Epidemiology and Public Health at University College,
London.
Comments on numerator data (i)
GLF data on smoking are now provided on an annual basis;
(ii)
HSE numerator data are based on observed self-reported current smoking.
Denominator:
Denominator data (i)
A sample of the general population aged 16+ resident in private households in Britain;
(ii)
Respondents aged 16+ in a sample survey of the health of the population of England.
Source of denominator data - See “Numerator data”.
Comments on denominator data –
(i)
The GLF collects information on a range of core topics including smoking and drinking from people living in
private households in Great Britain. The survey started as the GHS in 1971 and has been carried out continuously
since then, except for breaks in 1997-1998 (when the survey was reviewed) and 1999-2000 (when the survey was
re-developed). For more details about the GLF see:
http://www.statistics.gov.uk/StatBase/Product.asp?vlnk=5756&More=Y
(ii)
The HSE is a series of annual surveys that began in 1991 with the aim of monitoring the health of the
population. It was designed to measure health and health related behaviours in adults and children living in private
households in England. For each participant, the survey included an interview and a physical examination by a
nurse, at which various physical measurements, tests, and samples of blood and saliva were collected. These
measurements provided biomedical information about known risk factors associated with disease and objective
validation for self-reported health behaviour.
52
Statistical methods:
(i)
The GLF figures presented are the percentage of survey respondents aged 16+ who are current smokers.
(ii)
The figures have been provided for three-year periods (based on three-year moving averages) and for
calendar years. All calculations of sub-national observed estimates at Government Office Region, ONS area,
Strategic Health Authority and County levels, age-standardised rates, confidence intervals and significance tests
were carried out by the National Centre for Social Research (see Annex 9 for details).
Interpretation of indicators:
Quality of indicator - Annex 12 describes the criteria that should be used to judge the quality of this indicator. The
application of the criteria is dependent on the context (e.g. describing a single organisation, comparing several
organisations) and the level (e.g. national / regional with large numbers of events, local with small numbers of
events) at which the data are to be used.
Further reading:
1.
2.
3.
4.
5.
6.
7.
8.
9.
10.
11.
12.
13.
14.
15.
Ali R, Bugler C, Curtis D, Dunstan S, Lloyd K, Maurice S, Pobjoy A, Shemwell L and White J. General
Household Survey 2008: Overview Report, Newport Office for National Statistics, 2010. Available at:
http://www.statistics.gov.uk/downloads/theme_compendia/GLF08/GLFoverview2008.pdf
Robinson S and Bugler C. General Lifestyle Survey: Smoking and drinking among adults, 2008. Newport:
Office for National Statistics, 2010. Available at:
http://www.statistics.gov.uk/downloads/theme_compendia/GLF08/GLFSmoking&DrinkingAmongAdults2008.p
df
Ali R, Binmore R, Dunstan S, Greer J, Matthews D, Murray L and Robinson S. General Household Survey
2007: Overview Report, Newport Office for National Statistics, 2009. Available at:
http://www.statistics.gov.uk/downloads/theme_compendia/GHS07/GHSoverview2007.pdf
Robinson S and Lader D.General Household Survey 2007: Smoking and drinking among adults, Newport
Office for National Statistics, 2009. Available at:
http://www.statistics.gov.uk/downloads/theme_compendia/GHS07/GHSSmokingandDrinkingAmongAdults200
7.pdf
Goddard E. General Household Survey 2006: Smoking and drinking among adults. London: Office for
National Statistics, 2008. Available at:
http://www.parliament.uk/deposits/depositedpapers/2008/DEP2008-2395.pdf
Craig R and Mindell (eds). Health Survey for England 2006. Volume 1: Cardiovascular disease and risk
factors in adults. The Information Centre, Leeds, 2008. Available at:
http://www.ic.nhs.uk/webfiles/publications/HSE06/HSE%2006%20report%20VOL%201%20v2.pdf
Craig R and Mindell (eds). Health Survey for England 2006. Volume 3: Methodology and documentation. The
Information Centre, Leeds, 2008. Available at:
http://www.ic.nhs.uk/webfiles/publications/HSE06/HSE06_VOL3.pdf
Goddard E. General Household Survey 2005: Smoking and drinking among adults. London: Office for National
Statistics, 2006. Available at:
http://www.statistics.gov.uk/downloads/theme_compendia/GHS05/GHS2005_SmokingandDrinking_Report.pdf
Goddard E and Green H. General Household Survey 2004: Smoking and drinking among adults. London:
Office for National Statistics, 2005. Available at:
http://www.statistics.gov.uk/downloads/theme_compendia/GHS2004_Smoking%20_and_Drinking_Report.pdf
Rickards L et al. Living in Britain: Results from the 2002 General Household Survey. London: The Stationery
Office, 2004.
Walker A et al. Living in Britain: Results from the 2001 General Household Survey. London: The Stationery
Office, 2002. Available online at: http://www.statistics.gov.uk/lib2001/index.html
Department of Health. NHS Cancer Plan: a plan for investment, a plan for reform. London: Department of
Health. 2000. Available online at:
http://www.dh.gov.uk/PublicationsAndStatistics/Publications/PublicationsPolicyAndGuidance/PublicationsPolic
yAndGuidanceArticle/fs/en?CONTENT_ID=4009609&chk=n4LXTU
Department of Health. Smoking Kills: a White Paper on Tobacco. London: Her Majesty’s Stationery Office,
1998. Available at: http://www.archive.official-documents.co.uk/document/cm41/4177/4177.htm
Scholes S, Prescott A and Bajekal M. Health and lifestyle indicators for Strategic Health Authorities, 19942002, London: National Centre for Social Research, 2004.
Joint Health Surveys Unit, National Centre for Social Research and Department of Epidemiology and Public
Health, the Royal Free and University College Medical School, London. The Health Survey for England Cardiovascular disease. London: Her Majesty’s Stationery Office, 1998.
Updated: November 2010
53
Cotinine level
Purpose:
To reduce prevalence of smoking.
Definition of indicator and its variants:
Proportion of adults with a serum / salivary cotinine level of 15 or more nanograms per millilitre (a level regarded
as indicative of smoking).
Statistic
Number, percent and
age-standardised percent
Sex
Age group
Organisation
(see glossary)
MFP 16+
E, GOR, ONS area,
SHA, CTY
Current
data
2000-02
Trend
data
File-worksheet name
02I_315VSP1_02_V2
2001 02I_315VSP2_08_V1
2007-08
Numerator:
Numerator data - Persons aged 16+ with a serum cotinine level of 15ng/ml or above in a sample survey of the
health of the population of England.
Source of numerator data - Health Survey for England (HSE), commissioned by the Department of Health and
since April 2005 The Information Centre for health and social care and carried out by the Joint Health Survey Unit
of Social and Community Planning Research and of the Department of Epidemiology and Public Health at
University College, London.
Comments on numerator data - Blood samples taken from adult Health Survey respondents were analysed to
estimate cotinine levels in serum. Levels of 15 nanograms per millilitre or higher suggest strongly that the
respondent is an active smoker (please note that the cutoff point has been reduced from 20 to 15 nanograms per
millilitre and therefore current figures are not comparable with previously published data for this indicator). Persons
using nicotine replacement products were excluded from the analysis.
Cotinine is a metabolite of nicotine. It is one of several biological markers that are indicators of smoking (others
include carbon monoxide and thiocyanate), and is generally considered the most useful. It can be measured in,
among other things, saliva or serum (before 1998, cotinine levels in the Health Survey were measured in serum in
adults, but from 1998 were measured in saliva, primarily to increase the number of people being measured as
more people refuse to give a blood sample than a saliva sample). Cotinine has a half-life in the body of between
16 and 20 hours, which means that it will detect regular smoking (or other tabaco use such as chewing) but may
not detect occasional use if the last occasion was several days ago. Anyone with a salivary cotinine level of 15
nanograms per millitre or more is highly likely to be a tobacco user.
The measurement of cotinine levels in the Health Survey series provides an objective cross-check on self-reports
of smoking behaviour, which are known not always to be accurate. Inaccuracies in reporting arise in part from
difficulties respondents may experience in providing quantitative summaries of variable behaviour patterns, but in
some cases arise from a desire to conceal the truth from other people, such as household members who may be
present during the interview. Limitations on the ability of self-report to provide accurate quantitative responses are
particularly marked in relation to exposure to other people's smoking (passive smoking). Assays of cotinine levels
by gas chromatography are sensitive and are able to detect and measure low concentrations of cotinine. They are
thus of particular value in examining passive smoking.
Denominator:
Denominator data - Respondents (with measurements) aged 16+ in a sample survey of the health of the
population of England.
Source of denominator data - See “Numerator data”.
Comments on denominator data - The HSE is a series of annual surveys that began in 1991 with the aim of
monitoring the health of the population. It was designed to measure health and health related behaviours in adults
and children living in private households in England. For each participant, the survey included an interview and a
physical examination by a nurse, at which various physical measurements, tests, and samples of blood and saliva
were collected. These measurements provided biomedical information about known risk factors associated with
disease and objective validation for self-reported health behaviour.
54
Statistical methods:
The figures have been provided for three-year periods (based on three-year moving averages) and for calendar
years. All calculations of sub-national observed estimates at Government Office Region, ONS area, Strategic
Health Authority and County levels, age-standardised rates, confidence intervals and significance tests were
carried out by the National Centre for Social Research (see Annex 9 for details).
Interpretation of indicators:
Quality of indicator - Annex 12 describes the criteria that should be used to judge the quality of this indicator. The
application of the criteria is dependent on the context (e.g. describing a single organisation, comparing several
organisations) and the level (e.g. national / regional with large numbers of events, local with small numbers of
events) at which the data are to be used.
Further reading:
1.
2.
Scholes S, Prescott A and Bajekal M. Health and lifestyle indicators for Strategic Health Authorities, 19942002, London: National Centre for Social Research, 2004. Available at:
http://www.dh.gov.uk/assetRoot/04/07/77/31/04077731.pdf
Hedges B and di Salvo P. Alcohol consumption and smoking. Health Survey for England 96. Available at:
http://www.archive.official-documents.co.uk/document/doh/survey96/ehch8.htm
Updated: November 2010
55
Alcohol consumption
Purpose:
To help reduce the prevalence of excessive alcohol consumption and the health risks associated with single
episodes of intoxication.
The damage caused by alcohol misuse to individuals and society has become an increasing focus of public
concern in recent years. Drinking alcohol has been linked to increased risks of hypertension, stroke,
coronary heart disease, liver cirrhosis and some cancers.
Definition of indicator and its variants:
The prevalence of alcohol consumption above certain specified levels (“sensible” limits) based on people’s
estimates of amounts drank on a “usual” occasion recorded in terms of five different types of drink and then
converted into units of alcohol:
(i) The prevalence of alcohol consumption based on results from the General Lifestyle Survey including:
•
Proportion of men who drank more than 4 units of alcohol on at least one day the previous week and
women who drank more than 3 units;
•
Proportion of men who drank more than 8 units of alcohol on at least one day the previous week and
women who drank more than 6 units.
(ii) The prevalence of alcohol consumption based on results from the Health Survey for England including:
•
Proportion of men drinking more than 4 units and women drinking more than 3 units of alcohol in heaviest
drinking day last week;
•
Proportion of men drinking more than 8 units and women drinking more than 6 units of alcohol in heaviest
drinking day last week.
Statistic
Percent (i)
Number, percent and
age-standardised percent (ii)
Sex
MF
Age group
16+
MFP 16+
Organisation
(see glossary)
E, GOR
E, GOR, ONS area,
SHA, CTY
Current
data
2008
Trend
data
File-worksheet name
1998, 02K_318PC_08_V1
2000 to
2007
2001-03
2002-04
2003-05
2004-06 1998-08
02K_318VSP1_06_V1
02K_318VSP2_06_V1
02K_318VSP3_08_V1
02K_318VSP4_08_V1
Numerator:
Numerator data (i)
The number of men who drank more than 4 and 8 units and women who drank 3 and 6 units on at least one
day in a sample survey of the general population resident in private households in Britain.
(ii)
The number of men and women aged 16+ drinking more than 4 or 8 units and 3 or 6 units respectively in
heaviest drinking day last week in a sample survey of the health of the population of England.
Source of numerator data (i)
General Lifestyle Survey (GLF) formerly known as the General Household Survey (GHS) - a multi-purpose
continuous survey carried out by the Office for National Statistics (ONS) as part of the Integrated Household
Survey (HIS).
(ii)
Health Survey for England (HSE), commissioned by the Department of Health and since April 2005 The
Information Centre for health and social care and carried out by the Joint Health Survey Unit of Social and
Community Planning Research and of the Department of Epidemiology and Public Health at University College,
London.
Comments on numerator data (i)
GLF data on alcohol consumption are now provided on an annual basis. Prior to 1988, alcohol questions
were asked only of those aged 18 and over, but since 1988, respondents aged 16 and 17 have answered the
questions using a self-completion questionnaire. Obtaining reliable information about drinking behaviour is difficult
and, in consequence, social surveys consistently record lower levels of consumption than would be expected from
data on alcohol sales. This is partly because people may consciously or unconsciously under-estimate how much
alcohol they consume. Drinking at home is particularly likely to be under-estimated because the quantities
consumed are not measured and are likely to be larger than those dispensed in licensed premises.
56
The current measure of average weekly alcohol consumption has been used in the GHS since 1986, and was
developed in response to earlier medical guidelines on drinking which related to maximum recommended weekly
amounts of alcohol. Its use has been continued to provide a consistent measure of alcohol consumption by means
of which trends can continue to be monitored. Respondents are asked how often over the last year they have
drank each of the six types of drink listed in the previous section (normal strength beer, strong beer, wine, spirits,
fortified wines and alcopops), and how much they have usually drank on any one day. This information is
combined to give an estimate of the respondent’s weekly alcohol consumption (averaged over a year) in units of
alcohol.
(ii)
HSE numerator data are broadly based on observed self-reported binge drinking behaviour. The binge
drinking indicator definition has changed and is now consistent with the definition used on the GHS. Also in 2007
the method of calculating units was changed. See the HSE 2007 report, Volume 1 Chapter 7 for details:
http://www.ic.nhs.uk/pubs/hse07healthylifestyles.
From 1998 onwards, in addition to questions on “usual” consumption, adults were asked about how many days
had they drank alcohol in the past 7 days. If they had drank more on one day than others, they were asked how
much they drank on that day. If they had drank the same amount on several days, they were asked how much
they had drank on the most recent of those days. The thresholds of 4 or more units for men and 3 or more units for
women were based on the daily sensible alcohol consumption advice.
The HSE no longer collects data on the amount of weekly consumption therefore the indicators referring to mean
usual alcohol consumption per week and proportion of men and women drinking more than 21 and 14 units
respectively per week cannot be updated.
Denominator:
Denominator data (i)
A sample of the general population aged 16+ resident in private households in Britain.
(ii)
Respondents aged 16+ in a sample survey of the health of the population of England. The base for mean
weekly alcohol consumption is all adults in the survey.
Source of denominator data - See “Numerator data”.
Comments on denominator data (i)
The GLF collects information on a range of core topics including smoking and drinking from people living in
private households in Great Britain. The survey started as the GHS in 1971 and has been carried out continuously
since then, except for breaks in 1997-1998 (when the survey was reviewed) and 1999-2000 (when the survey was
re-developed). For more details about the GLF see:
http://www.statistics.gov.uk/StatBase/Product.asp?vlnk=5756&More=Y
(ii)
The HSE is a series of annual surveys that began in 1991 with the aim of monitoring the health of the
population. It was designed to measure health and health related behaviours in adults and children living in private
households in England. For each participant, the survey included an interview and a physical examination by a
nurse, at which various physical measurements, tests, and samples of blood and saliva were collected. These
measurements provided biomedical information about known risk factors associated with disease and objective
validation for self-reported health behaviour.
Statistical methods:
(i)
GLF used two measures of alcohol consumption on at least one day in recent week : 4 and 8 units (men)
and 3 and 6 units (women). The figures presented are the percentage of survey respondents aged 16+ who
reported alcohol consumption above certain specified levels.
(ii)
The figures have been provided for three-year periods (based on three-year moving averages) and for
calendar years. All calculations of sub-national observed estimates at Government Office Region, ONS area,
Strategic Health Authority and County levels, age-standardised rates, confidence intervals and significance tests
were carried out by the National Centre for Social Research (see Annex 9 for details).
Interpretation of indicators:
Quality of indicator - Annex 12 describes the criteria that should be used to judge the quality of this indicator. The
application of the criteria is dependent on the context (e.g. describing a single organisation, comparing several
organisations) and the level (e.g. national / regional with large numbers of events, local with small numbers of
events) at which the data are to be used.
Further reading:
1.
2.
Ali R, Bugler C, Curtis D, Dunstan S, Lloyd K, Maurice S, Pobjoy A, Shemwell L and White J. General
Household Survey 2008: Overview Report, Newport Office for National Statistics, 2010. Available at:
http://www.statistics.gov.uk/downloads/theme_compendia/GLF08/GLFoverview2008.pdf
Robinson S and Bugler C. General Lifestyle Survey: Smoking and drinking among adults, 2008. Newport:
Office for National Statistics, 2010. Available at:
57
http://www.statistics.gov.uk/downloads/theme_compendia/GLF08/GLFSmoking&DrinkingAmongAdults2008.p
df
3. Ali R, Binmore R, Dunstan S, Greer J, Matthews D, Murray L and Robinson S. General Household Survey
2007: Overview Report, Newport Office for National Statistics, 2009. Available at:
http://www.statistics.gov.uk/downloads/theme_compendia/GHS07/GHSoverview2007.pdf
4. Robinson S and Lader D.General Household Survey 2007: Smoking and drinking among adults, Newport
Office for National Statistics, 2009. Available at:
http://www.statistics.gov.uk/downloads/theme_compendia/GHS07/GHSSmokingandDrinkingAmongAdults200
7.pdf
5. Goddard E. General Household Survey 2065: Smoking and drinking among adults. London: Office for
National Statistics, 2008. Available at:
http://www.parliament.uk/deposits/depositedpapers/2008/DEP2008-2395.pdf
6. Craig R and Mindell (eds). Health Survey for England 2006. Volume 1: Cardiovascular disease and risk
factors in adults. The Information Centre, Leeds, 2008. Available at:
http://www.ic.nhs.uk/webfiles/publications/HSE06/HSE%2006%20report%20VOL%201%20v2.pdf
7. Craig R and Mindell (eds). Health Survey for England 2006. Volume 3: Methodology and documentation. The
Information Centre, Leeds, 2008. Available at:
http://www.ic.nhs.uk/webfiles/publications/HSE06/HSE06_VOL3.pdf
8. Goddard E. General Household Survey 2005: Smoking and drinking among adults. London: Office for National
Statistics, 2006. Available at:
http://www.statistics.gov.uk/downloads/theme_compendia/GHS05/GHS2005_SmokingandDrinking_Report.pdf
9. Goddard E and Green H. General Household Survey 2004: Smoking and drinking among adults. London:
Office for National Statistics, 2005. Available at:
http://www.statistics.gov.uk/downloads/theme_compendia/GHS2004_Smoking%20_and_Drinking_Report.pdf
10. Rickards L et al. Living in Britain: Results from the 2002 General Household Survey. London: The Stationery
Office, 2004.
11. Scholes S, Prescott A and Bajekal M. Health and lifestyle indicators for Strategic Health Authorities, 19942002, London: National Centre for Social Research, 2004.
12. Walker A et al. Living in Britain: Results from the 2001 General Household Survey. London: The Stationery
Office, 2002.
13. Edwards, Griffith. Alcohol policy: securing a positive impact on health. Copenhagen: World Health
Organization, 2001.
14. Rehn, N. Alcohol in the European Region – consumption, harm and policies. Copenhagen: World Health
Organization, 2001.
15. Department of Health. NHS Cancer Plan: a plan for investment, a plan for reform. London: Department of
Health, 2000.
16. Joint Health Surveys Unit, National Centre for Social Research and Department of Epidemiology and Public
Health, the Royal Free and University College Medical School, London. The Health Survey for England Cardiovascular disease. London: Her Majesty’s Stationery Office, 1998.
Updated: November 2010
58
Fruit and vegetable consumption
Purpose:
To help reduce the risk of deaths from chronic diseases such as heart disease, stroke, and cancer.
The Five-a-day programme was introduced to increase fruit and vegetable consumption within the general
population. Its central message is that people should eat at least five portions of fruit and vegetables a day; that a
variety of fruit and vegetables should be consumed and that fresh, frozen, canned and dried fruit, vegetables and
pulses all count in making up these portions. The programme includes educational initiatives to increase
awareness of the Five-a-day message and the benefits of fruit and vegetable consumption, along with more direct
schemes to increase access to fruit and vegetables, such as the school fruit scheme and community initiatives.
Monitoring of fruit and vegetable consumption is key to evaluating the success of the policy, both at the level of
individual schemes and at a more general level.
Definition of indicator and its variants:
Observed and age-standardised proportion of adults who met the recommended guidelines of consuming five or
more portions of fruit and vegetables a day.
Statistic
Number, percent and
age-standardised percent
Sex
Age group
MFP 16+
Organisation
(see glossary)
Current
data
E, GOR, ONS area,
SHA, CTY
2001-03
2002-04
2003-05
2004-06
2005-07
2006-08
Trend
data
File-worksheet name
02L_319VSP1_08_V1
2001-08 02L_319VSP2_08_V1
Numerator:
Numerator data - The number of persons aged 16+ who consume five or more portions of fruit and vegetables a
day in a sample survey of the health of the population of England.
Source of numerator data - Health Survey for England (HSE), commissioned by the Department of Health and
since April 2005 The Information Centre for health and social care and carried out by the Joint Health Survey Unit
of Social and Community Planning Research and of the Department of Epidemiology and Public Health at
University College, London.
Comments on numerator data - The Government recommends an intake of at least five portions of fruit or
vegetables (five 80g portions or 400g) per person per day to help reduce the risk of some cancers, heart disease
and many other chronic conditions. Questions about fruit and vegetable consumption were designed to assess
levels of fruit and vegetable consumption within the population and to compare it with the Five-a-day message.
Denominator:
Denominator data - Respondents aged 16+ in a sample survey of the health of the population of England.
Source of denominator data - See “Numerator data”.
Comments on denominator data - The HSE is a series of annual surveys that began in 1991 with the aim of
monitoring the health of the population. It was designed to measure health and health related behaviours in adults
and children living in private households in England. For each participant, the survey included an interview and a
physical examination by a nurse, at which various physical measurements, tests, and samples of blood and saliva
were collected. These measurements provided biomedical information about known risk factors associated with
disease and objective validation for self-reported health behaviour.
Statistical methods:
The figures have been provided for three-year periods (based on three-year moving averages) and for calendar
years. All calculations of sub-national observed estimates at Government Office Region, ONS area, Strategic
Health Authority and County levels, age-standardised rates, confidence intervals and significance tests were
carried out by the National Centre for Social Research (see Annex 9 for details).
59
Interpretation of indicators:
Quality of indicator - Annex 12 describes the criteria that should be used to judge the quality of this indicator. The
application of the criteria is dependent on the context (e.g. describing a single organisation, comparing several
organisations) and the level (e.g. national / regional with large numbers of events, local with small numbers of
events) at which the data are to be used.
Further reading:
1.
2.
3.
4.
Craig R and Mindell (eds). Health Survey for England 2006. Volume 1: Cardiovascular disease and risk
factors in adults. The Information Centre, Leeds, 2008. Available at:
http://www.ic.nhs.uk/webfiles/publications/HSE06/HSE%2006%20report%20VOL%201%20v2.pdf
Craig R and Mindell (eds). Health Survey for England 2006. Volume 3: Methodology and documentation. The
Information Centre, Leeds, 2008. Available at:
http://www.ic.nhs.uk/webfiles/publications/HSE06/HSE06_VOL3.pdf
Department of Health. 5 A DAY health benefits, 2007. Available at:
http://www.dh.gov.uk/en/Publichealth/Healthimprovement/FiveADay/FiveADaygeneralinformation/DH_400234
Bajekal M, Primatesta P and Prior G. HSE 2001: Fruit and vegetables consumption, National Centre for Social
Research, TSO, 2001. Available at::
http://www.archive2.official-documents.co.uk/document/deps/doh/survey01/fvc/fvc.htm
Updated: November 2010
60
Obesity among GP patients
Purpose:
To help reduce the prevalence of obesity among NHS patients.
Obesity has become a major health issue. It is associated with poor clinical outcomes and is also a major
contributory factor for some of the commonest causes of death and disability in developed economies, most
notably greater rates of diabetes mellitus and accelerated onset of cardiovascular disease.
Definition of indicator and its variants:
Proportion of patients with a BMI greater than or equal to 30 in the previous 15 months in a GP registered
population.
Statistic
Sex
Age
group
Organisation
(see glossary)
Number and percent of
patients
P
16+
E, GOR, SHA,
PCO
Period
Current
data
FY 2008/09
File_worksheet Name
Trend data
02M_670PC_09_V1
Numerator:
Numerator data - Patients aged 18 and over who are obese with a BMI at least 30 registered with GP practices.
Source of numerator data - Quality and Outcomes Framework (QOF).
Comments on numerator data - The data for this primary care indicator are derived from the Quality Management
Analysis System (QMAS) and supplied by the Prescribing Support Unit at The NHS Information Centre for health
and social care. The QOF is part of the General Medical Services (GMS) contract, with a focus on prevalence and
management of common chronic diseases at general practice level. It is aimed at measuring the achievement of
general practices against a set of evidence based negotiated standards and encouraging good practice.
The data to support the clinical quality indicators (i.e. clinical achievement data) are extracted from individual GP
practice clinical systems and sent automatically to QMAS once a month. Practices can make additional
submissions of clinical data at any time.
Denominator:
Denominator data - All patients aged 18 and over registered with GP practices (age-banded practice list size).
Source of denominator data - See “Numerator data”.
Comments on denominator data - Age-banded practice list sizes were obtained from the Prescription Services
Division (RxS) of the NHS Business Services Authority.
Statistical methods:
The data are presented as raw (unadjusted) figures as recorded by the practices. Ideally, comparisons between
PCOs should take into account differences between their populations in terms of age, gender and case-mix.
However, this is not possible at present as the supplied data are not broken down by these characteristics.
Interpretation of indicators:
Quality of indicator - Users of data derived from QMAS should recognise that QMAS was established as a
mechanism to support the calculation of practice QOF payments and not as a person based epidemiological tool.
It is not a comprehensive source of data on quality of care in general practice, but it is potentially a rich and
valuable source of such information, providing that the limitations of the data are acknowledged.
From 2009 onwards, National Prevalence Day has been moved to 31st March (previously 14th February), so that
prevalence is calculated on the same basis as disease registers for indicator denominators.
There have been some significant revisions to the QOF, compared to previous years. Therefore direct
comparisons cannot be made except for the indicators that have not been subject to definitional changes.
61
Further reading:
1.
2.
3.
4.
5.
6.
7.
The NHS Information Centre for health and social care. National Quality and Outcomes Framework
Achievement Data 2008/09, September 2009. Available at: http://www.ic.nhs.uk/webfiles/QOF/200809/QOF%20Achievement%20and%20Prevalence%20Bulletin%202008-09.pdf
NHS Employers and General Practitioners Committee BMA. Quality and Outcomes Framework guidance for
GMS contract 2008/09, April 2008. Available at:
http://www.nhsemployers.org/SiteCollectionDocuments/QUALITY_OUT_COMPLETE_CD_110209.pdf
The NHS Information Centre for health and social care. National Quality and Outcomes Framework Statistics
for England 2007/08. Available at:
http://www.ic.nhs.uk/webfiles/QOF/2007-08/QOF%20200708%20Statistical%20Bulletin.pdf
The Information Centre for health and social care, Prescribing Support Unit. National Quality and Outcomes
Framework Statistics for England 2006/07. Available at:
http://www.ic.nhs.uk/webfiles/QOF/2006-07/QOF%202006-07%20Statistical%20Bulletin.pdf
Ashworth M, Armstrong D. The relationship between general practice characteristics and quality of care: a
national survey of quality indicators used in the UK Quality and Outcomes Framework, 2004-5, BMC Family
Practice, London: Ashworth and Armstrong, 2006 7:68. Available at:
http://www.biomedcentral.com/1471-2296/7/68
Department of Health, Investing in General Practice. The New General Medical Services Contract. Available
at: http://www.dh.gov.uk/assetRoot/04/07/86/58/04078658.pdf
Eastern Region Public Health Observatory, The limitations of Quality and Outcomes Framework (QOF) data.
Briefing No. 3, 2005. Available at:
http://www.erpho.org.uk/Download/Public/12597/1/Briefing%2003%20The%20limitations%20of%20QOF%20d
ata.pdf
Updated: October 2010
62
Smoking among patients with selected conditions
Purpose:
To help reduce the level of risk to health associated with smoking for NHS patients with selected conditions.
Smoking is an established risk factor for cardiovascular and other diseases.
Definition of indicator and its variants:
Proportion of patients with any or any combination of the following conditions (co-morbidity): coronary heart
disease, stroke or TIA, hypertension, diabetes, COPD, CKD, asthma, schizophrenia, bipolar affective disorder or
other psychoses whose notes record smoking status in the previous 15 months (except those who have never
smoked where smoking status need only be recorded once since diagnosis).
Statistic
Sex
Age
group
Organisation
(see glossary)
Number and percent of
patients
P
16+
E, GOR, SHA,
PCO
Period
Current
data
FY 2008/09
File_worksheet Name
Trend data
02N_671PC_09_V1
Numerator:
Numerator data - Patients on the co-morbidity register with particular chronic conditions who are recorded with a
status of ‘current smoker’, ‘never smoked’ or ‘ex-smoker’ in the 15 months before the reference date. ‘Never
smoked status’ to be checked and recorded annually until the patient is aged 25 years or over. Ex-smokers are to
be asked about smoking status on an annual basis until they have been a non-smoker for 3 years.
Source of numerator data - Quality and Outcomes Framework (QOF).
Comments on numerator data - The data for this primary care indicator are derived from the Quality Management
Analysis System (QMAS) and supplied by the Prescribing Support Unit at The NHS Information Centre for health
and social care. The QOF is part of the General Medical Services (GMS) contract, with a focus on prevalence and
management of common chronic diseases at general practice level. It is aimed at measuring the achievement of
general practices against a set of evidence based negotiated standards and encouraging good practice.
The data to support the clinical quality indicators (i.e. clinical achievement data) are extracted from individual GP
practice clinical systems and sent automatically to QMAS once a month. Practices can make additional
submissions of clinical data at any time.
The ‘reference date’ is the specified date of patient records held by the general practice modelled for the end of the
st
QOF year (midnight 31 March). It is the same for the data from all practices and may differ from the date of data
submission.
There have been some definitional changes in 2008/09 which have affected the data for this indicator. Patients
with CKD, schizophrenia, bipolar affective disorder or other psychoses have been added to the definition and the
criteria have changed. For more details see ‘Changes to Quality and Outcomes Framework for 2008’ available at:
http://www.nhsemployers.org/SiteCollectionDocuments/27_3_08_Proposed_Changes_to_Quality_and_Outcomes
_Framework_for_2008__FINAL_CD_110209.pdf
Denominator:
Denominator data - Patients on the co-morbidity register excluding those who have been exception reported.
Patients may be exception reported for the following reasons:
•
registered in the three months before the reference date;
•
smoking exception reported in the 15 months before the reference date;
•
the earliest diagnosis date of disease recorded in the three months before the reference date.
For more details regarding the description of the selection criteria and dataset rules of the relevant indicator set
see the following documentation available at: http://www.wmrlmc.co.uk/gms2/informationtechnology.htm
Source of denominator data - See “Numerator data”.
Comments on denominator data - The denominator is a count of patients for whom the clinical indicator should be
met. However, the selection rules do not provide the same opportunity for all patients included in the denominator
to take advantage of the full period (maximum number of months after the diagnosis) allowed by good practice for
the test, measurement or treatment to be undertaken (e.g. if good practice for angina patients allows for a
particular test to be conducted up to 12 months after diagnosis then patients diagnosed between four and 11
63
months before the reference date do not have the full period of 12 months for the test). Additionally, patients can
be removed from the denominator through the application of exception reporting.
Statistical methods:
The data are presented as raw (unadjusted) figures as recorded by the practices. Ideally, comparisons between
PCOs should take into account differences between their populations in terms of age, gender and case-mix.
However, this is not possible at present as the supplied data are not broken down by these characteristics.
Interpretation of indicators:
Quality of indicator - Users of data derived from QMAS should recognise that QMAS was established as a
mechanism to support the calculation of practice QOF payments and not as a person based epidemiological tool.
It is not a comprehensive source of data on quality of care in general practice, but it is potentially a rich and
valuable source of such information, providing that the limitations of the data are acknowledged.
There have been some significant revisions to the QOF, compared to previous years. Therefore direct
comparisons cannot be made except for the indicators that have not been subject to definitional changes.
Further reading:
1.
2.
3.
4.
5.
6.
7.
The NHS Information Centre for health and social care. National Quality and Outcomes Framework
Achievement Data 2008/09, September 2009. Available at: http://www.ic.nhs.uk/webfiles/QOF/200809/QOF%20Achievement%20and%20Prevalence%20Bulletin%202008-09.pdf
NHS Employers and General Practitioners Committee BMA. Quality and Outcomes Framework guidance for
GMS contract 2008/09, April 2008. Available at:
http://www.nhsemployers.org/SiteCollectionDocuments/QUALITY_OUT_COMPLETE_CD_110209.pdf
The NHS Information Centre for health and social care. National Quality and Outcomes Framework Statistics
for England 2007/08. Available at:
http://www.ic.nhs.uk/webfiles/QOF/2007-08/QOF%20200708%20Statistical%20Bulletin.pdf
The Information Centre for health and social care, Prescribing Support Unit. National Quality and Outcomes
Framework Statistics for England 2006/07. Available at:
http://www.ic.nhs.uk/webfiles/QOF/2006-07/QOF%202006-07%20Statistical%20Bulletin.pdf
Ashworth M, Armstrong D. The relationship between general practice characteristics and quality of care: a
national survey of quality indicators used in the UK Quality and Outcomes Framework, 2004-5, BMC Family
Practice, London: Ashworth and Armstrong, 2006 7:68. Available at:
http://www.biomedcentral.com/1471-2296/7/68
Department of Health, Investing in General Practice. The New General Medical Services Contract. Available
at: http://www.dh.gov.uk/assetRoot/04/07/86/58/04078658.pdf
Eastern Region Public Health Observatory, The limitations of Quality and Outcomes Framework (QOF) data.
Briefing No. 3, 2005. Available at:
http://www.erpho.org.uk/Download/Public/12597/1/Briefing%2003%20The%20limitations%20of%20QOF%20d
ata.pdf
Updated: October 2010
64
Smoking cessation advice for smokers with selected conditions
Purpose:
To help reduce the level of risk to health associated with smoking for NHS patients with selected conditions and
ensure high standards of primary health care and treatment delivered to them.
Evidence of benefits of smoking cessation has mostly been part of research in the domain of ischaemic heart
disease. Many strategies have been used to help people to stop smoking. A meta-analysis of controlled trials in
patients post-myocardial infarction showed that a combination of individual and group smoking cessation advice
and assistance reinforced by primary care teams gave the highest success rates.
The findings of primary prevention trials indicate that cessation of cigarette smoking shoud be advocated in the
secondary prevention of ischaemic or haemorrhagic stroke. It is recommended that all patients with hypertension
should have a smoking history taken. It is widely agreed that smoking cessation is the most powerful lifestyle
measure to lower blood pressure or cardiovascular risk.
The risk of vascular complications in patients with diabetes is substantially increased. Because these vascular
risks could be compounded by smoking, regular reminders to patients about smoking are justified. Health
professionals involved in caring for diabetic patients should advise them not to smoke.
Smoking cessation is the single most effective (and cost-effective) intervention to reduce the risk of developing
COPD and stop its progression. Every tobacco user should be offered at least brief tobacco dependence treatment
at every visit to the health care provider.
There is epidemiological evidence that smoking is associated with poor asthma control. The evidence for the value
of smoking cessation advice is largely extrapolated from studies in relation to coronary heart disease. It is
recommended that smoking cessation be encouraged as it is good for general health and may decrease asthma
severity.
Definition of indicator and its variants:
Proportion of patients with any or any combination of the following conditions (co-morbidity): coronary heart
disease, stroke or TIA, hypertension, diabetes, COPD, CKD, asthma, schizophrenia, bipolar affective disorder or
other psychoses who smoke and whose notes contain a record that smoking cessation advice or referral to a
specialist service, where available, has been offered within the previous 15 months.
Statistic
Sex
Age
group
Organisation
(see glossary)
Number and percent of
patients
P
16+
E, GOR, SHA,
PCO
Period
Current
data
FY 2008/09
File_worksheet Name
Trend data
02O_672PC_09_V1
Numerator:
Numerator data - Patients on the co-morbidity register who smoke and who have been offered smoking cessation
advice in the 15 months before the reference date.
Source of numerator data - Quality and Outcomes Framework (QOF).
Comments on numerator data - The data for this primary care indicator are derived from the Quality Management
Analysis System (QMAS) and supplied by the Prescribing Support Unit at The NHS Information Centre for health
and social care. The QOF is part of the General Medical Services (GMS) contract, with a focus on prevalence and
management of common chronic diseases at general practice level. It is aimed at measuring the achievement of
general practices against a set of evidence based negotiated standards and encouraging good practice.
The data to support the clinical quality indicators (i.e. clinical achievement data) are extracted from individual GP
practice clinical systems and sent automatically to QMAS once a month. Practices can make additional
submissions of clinical data at any time.
The ‘reference date’ is the specified date of patient records held by the general practice modelled for the end of the
QOF year (midnight 31st March). It is the same for the data from all practices and may differ from the date of data
submission.
There have been some definitional changes in 2008/09 which have affected the data for this indicator. Patients
with CKD, schizophrenia, bipolar affective disorder or other psychoses have been added to the definition and the
criteria have changed. For more details see ‘Changes to Quality and Outcomes Framework for 2008’ available at:
65
http://www.nhsemployers.org/SiteCollectionDocuments/27_3_08_Proposed_Changes_to_Quality_and_Outcomes
_Framework_for_2008__FINAL_CD_110209.pdf
Denominator:
Denominator data - Patients on the co-morbidity register whose notes record a positive smoking status excluding
those who have been exception reported. Patients may be exception reported for the following reasons:
•
registered in the three months before the reference date;
•
smoking exception reported in the 15 months before the reference date;
•
the earliest diagnosis date of disease recorded in the three months before the reference date.
For more details regarding the description of the selection criteria and dataset rules of the relevant indicator set
see the following documentation available at: http://www.wmrlmc.co.uk/gms2/informationtechnology.htm
Source of denominator data - See “Numerator data”.
Comments on denominator data - The denominator is a count of patients for whom the clinical indicator should be
met. However, the selection rules do not provide the same opportunity for all patients included in the denominator
to take advantage of the full period (maximum number of months after the diagnosis) allowed by good practice for
the test, measurement or treatment to be undertaken (e.g. if good practice for angina patients allows for a
particular test to be conducted up to 12 months after diagnosis then patients diagnosed between four and 11
months before the reference date do not have the full period of 12 months for the test). Additionally, patients can
be removed from the denominator through the application of exception reporting.
Statistical methods:
The data are presented as raw (unadjusted) figures as recorded by the practices. Ideally, comparisons between
PCOs should take into account differences between their populations in terms of age, gender and case-mix.
However, this is not possible at present as the figures supplied to us are not broken down by these characteristics.
Interpretation of indicators:
Quality of indicator - Users of data derived from QMAS should recognise that QMAS was established as a
mechanism to support the calculation of practice QOF payments and not as a person based epidemiological tool.
It is not a comprehensive source of data on quality of care in general practice, but it is potentially a rich and
valuable source of such information, providing that the limitations of the data are acknowledged.
There have been some significant revisions to the QOF, compared to previous years. Therefore direct
comparisons cannot be made except for the indicators that have not been subject to definitional changes.
Further reading:
1.
2.
3.
4.
5.
6.
7.
8.
The NHS Information Centre for health and social care. National Quality and Outcomes Framework
Achievement Data 2008/09, September 2009. Available at: http://www.ic.nhs.uk/webfiles/QOF/200809/QOF%20Achievement%20and%20Prevalence%20Bulletin%202008-09.pdf
NHS Employers and General Practitioners Committee BMA. Quality and Outcomes Framework guidance for
GMS contract 2008/09, April 2008. Available at:
http://www.nhsemployers.org/SiteCollectionDocuments/QUALITY_OUT_COMPLETE_CD_110209.pdf
The NHS Information Centre for health and social care. National Quality and Outcomes Framework Statistics
for England 2007/08. Available at:
http://www.ic.nhs.uk/webfiles/QOF/2007-08/QOF%20200708%20Statistical%20Bulletin.pdf
The Information Centre for health and social care, Prescribing Support Unit. National Quality and Outcomes
Framework Statistics for England 2006/07. Available at:
http://www.ic.nhs.uk/webfiles/QOF/2006-07/QOF%202006-07%20Statistical%20Bulletin.pdf
The Information Centre for health and social care, Prescribing Support Unit. National Quality and Outcomes
Framework or England 2005/06. Available at:
http://www.ic.nhs.uk/webfiles/publications/qof/NationalQualityOutcomesFramework280906_PDF.pdf
The Health and Social Care Information Centre, National Quality and Outcomes Framework Statistics for
England 2004/05. Available at:
http://www.ic.nhs.uk/webfiles/publications/qof0405/QOF0405_Statistical_Bulletin.pdf
Ashworth M, Armstrong D. The relationship between general practice characteristics and quality of care: a
national survey of quality indicators used in the UK Quality and Outcomes Framework, 2004-5, BMC Family
Practice, London: Ashworth and Armstrong, 2006 7:68. Available at:
http://www.biomedcentral.com/1471-2296/7/68
Department of Health, Investing in General Practice. The New General Medical Services Contract. Available
at: http://www.dh.gov.uk/assetRoot/04/07/86/58/04078658.pdf
Updated: October 2010
66
Limiting long-term illness
Purpose:
To provide 2001 Census based information about resident population with limiting long-term illness.
Definition of indicator and its variants:
Proportion of residents in households with limiting long-term illness.
Statistic
Sex
Age group
Number, percent and indirectly
age-standardised illness ratio
MF
All ages, <65,
65-74, 75+
Organisation
(see glossary)
Current
data
E&W, E, GOR, ONS
area, SHA, LA,
PCO, CTY
2001
Trend
data
File-worksheet name
03A_009VS_01_V2
Note: Data for PCOs have been produced from “best fit” of Output Areas.
Numerator:
Numerator data - Numbers of persons in households with limiting long-term illness.
Source of numerator data – Office for National Statistics (ONS): Standard Table 16 (ST016). Data processed by
the Department of Health (DH).
ONS: Small Area Statistics (SAS) - Tables 12 and 13. Data processed by DH.
Comments on numerator data - The ONS Area Classification values for Census indicators are computed from
Local Authority (LA) data. Strategic Health Authority (SHA) values are computed from Primary Care Organisation
(PCO) data rather than LA.
Numbers of persons in households with limiting long-term illness are based on answers to the question "Do you
have any long-term illness, health problem or disability which limits your daily activities or the work you can do?"
Denominator:
Denominator data - The total persons in households in the area.
Source of denominator data - ONS: Standard Table 16 (ST016). Data processed by DH.
Comments on denominator data - None.
Statistical methods:
Census data for PCOs were produced by ONS on the basis of best fit using two different methods. The 2001
Census Key Statistics tables were produced on the basis of best fit of Output Areas to PCOs and Standard tables
(which are generally the more detailed tables, showing cross-tabulations between different variables) for health
areas were produced on the basis of best fit of wards. The “two-method approach” used by ONS is a problem, in
that the same variables for health areas appear as different totals in the Key Statistics and Standard tables. Some
of these differences are also “significant”. For a more detailed explanation see:
http://www.statistics.gov.uk/census2001/cn_96.asp
Disclosure protection measures applied by the ONS to 2001 Census output for England and Wales are in place in
order to prevent the inadvertent release of information about identifiable individuals. As a result, totals may
sometimes not add up. For more details about disclosure control methods see:
http://www.statistics.gov.uk/census2001/op5.asp
Percentages were obtained by dividing numbers of persons in households with limiting long-term illness by the
appropriate total number of persons in households in the area.
Standardised illness ratios were calculated by multiplying age- and sex-specific illness rates for England and
Wales (age-bands up to 65, 65-74 and 75+) by corresponding resident populations for each area.
Interpretation of indicators:
Quality of indicator - Annex 12 describes the criteria that should be used to judge the quality of this indicator. The
application of the criteria is dependent on the context (e.g. describing a single organisation, comparing several
67
organisations) and the level (e.g. national / regional with large numbers of events, local with small numbers of
events) at which the data are to be used.
Further reading:
1.
2.
Office for National Statistics. The Census 2001 homepage. Office for National Statistics, 2004. Available at:
http://www.statistics.gov.uk/census2001/
Office for National Statistics. 1991 Census: Limiting long-term illness, Great Britain. CEN 91. London: Office
for National Statistics, 1993.
Updated: December 2009
68
Inability to work due to permanent sickness
Purpose:
To provide 2001 Census based information about resident populations prevented from working by permanent
sickness.
Definition of indicator and its variants:
Proportion of residents in households unable to work because of long-term sickness or disability and
corresponding sickness ratios.
Statistic
Number, percent and indirectly
age-standardised sickness
ratio
Sex
Age group
Organisation
(see glossary)
MFP 16+, working
E&W, E, GOR, ONS
ages (16-59 (F), area, SHA, LA,
16-64 (M))
PCO, CTY
Current
data
Trend
data
2001
File-worksheet name
03B_010VS_01_V2
Note: Data for PCOs have been produced from “best fit” of Output Areas.
Numerator:
Numerator data - Number of residents prevented from working by long-term sickness or disability.
Source of numerator data – Office for National Statistics (ONS): Standard Table 28 (S28). Data processed by the
Department of Health (DH).
Comments on numerator data - The ONS Area Classification values for Census indicators are computed from
Local Authority (LA) data. Strategic Health Authority (SHA) values are computed from Primary Care Organisation
(PCO) data rather than LA.
Numbers of persons "permanently sick" are based on those ticking the reply "Do you have any long-term illness,
health problem or disability which limits your daily activities or the work you can do?" and then "Last week, were
you any of the following: permanently sick or disabled?".
Denominator:
Denominator data - The total number of residents in the area.
Source of denominator data - ONS: Standard Table 28 (S28). Data processed by DH.
Comments on denominator data - For those absent households for which no completed census form was received
by ONS, certain data were imputed.
Statistical methods:
Census data for PCOs were produced by ONS on the basis of best fit using two different methods. The 2001
Census Key Statistics tables were produced on the basis of best fit of Output Areas to PCOs, and Standard tables
(which are generally the more detailed tables, showing cross-tabulations between different variables) for health
areas were produced on the basis of best fit of wards. The “two-method approach” used by ONS is a problem, in
that the same variables for health areas appear as different totals in the Key Statistics and Standard tables. Some
of these differences are also “significant”. For a more detailed explanation see:
http://www.statistics.gov.uk/census2001/cn_96.asp
Disclosure protection measures applied by the ONS to 2001 Census output for England and Wales are in place in
order to prevent the inadvertent release of information about identifiable individuals. As a result, totals may
sometimes not add up. For more details about disclosure control methods see:
http://www.statistics.gov.uk/census2001/op5.asp
Percentages were obtained by dividing numbers of "permanently sick" residents by the corresponding total
number of residents in the area.
Standardised sickness ratios for each sex were calculated by multiplying age- and sex-specific illness rates for
England and Wales (age-bands 16-24, 25-44, 45-64, and 65-74) by corresponding resident populations for each
area.
69
Interpretation of indicators:
Quality of indicator - Annex 12 describes the criteria that should be used to judge the quality of this indicator. The
application of the criteria is dependent on the context (e.g. describing a single organisation, comparing several
organisations) and the level (e.g. national / regional with large numbers of events, local with small numbers of
events) at which the data are to be used.
Further reading:
1.
2.
Office for National Statistics. The Census 2001 homepage. Office for National Statistics, 2004. Available at:
http://www.statistics.gov.uk/census2001/
Office for National Statistics. 1991 Census: Limiting long-term illness, Great Britain. CEN 91. London: Office for
National Statistics, 1993.
Updated: December 2009
70
Mortality from all causes
Purpose:
To reduce mortality.
Definition of indicator and its variants:
Mortality from all causes (ICD-10 A00-Y99 equivalent to ICD-9 001-E999).
Statistic
Number of deaths
Crude death rate
Average age-specific death
rate per 100,000 resident
population
Indirectly age-standardised
mortality ratio (SMR) and
number of deaths
Sex
Age group
MFP 1+, 1-4, 5-14,
15-34, 35-64,
65-74, 75+
MFP All ages
MFP 1+, 1-4, 5-14,
15-34, 35-64,
65-74, 75+
MFP All ages,
<15,
<75,
15-64,
65-74
Organisation
(see glossary)
Current
data
E&W, E, GOR,
ONS area, SHA,
LA, PCO, CTY
E&W, E, GOR,
ONS area, SHA,
LA, PCO, CTY
E&W, E, GOR,
ONS area, SHA,
LA, PCO, CTY
E&W, E, GOR,
ONS area, SHA,
LA, PCO, CTY
2008
03C_073NO_08_V1
2008
03C_073CRP1_08_V1
2006-08
03C_073CRP2_08_V1
2006-08
03C_073SM00++_08_V1
03C_073SM0014_08_V1
03C_073SM0074_08_V1
03C_073SM1564_08_V1
03C_073SM6574_08_V1
All ages,
<15,
<75,
15-64,
65-74
Directly age-standardised
mortality rate per 100,000 and
number of deaths
MFP All ages*,
<15,
<75,
15-64,
65-74
Trend
data
File-worksheet name
1993-08 03C_073SMT00++_08_V1
03C_073SMT0014_08_V1
03C_073SMT0074_08_V1
03C_073SMT1564_08_V1
03C_073SMT6574_08_V1
E&W, E, GOR,
ONS area, SHA,
LA, PCO, CTY
All Ages#*
All ages*,
<15,
<75,
15-64,
65-74
2006-08
03C_073DR00++_08_V1
03C_073DR0014_08_V1
03C_073DR0074_08_V1
03C_073DR1564_08_V1
03C_073DR6574_08_V1
1995-97
03C_073DR00++_97_V1
1993-08 03C_073DRT00++_08_V1
03C_073DRT0014_08_V1
03C_073DRT0074_08_V1
03C_073DRT1564_08_V1
03C_073DRT6574_08_V1
# Department of Health Public Service Agreement target monitoring baseline.
*Additional local authority based aggregates are included for Neighbourhood Renewal Fund and Working
Neighbourhood Fund target monitoring.
Numerator:
Numerator data - Deaths from all causes classified by underlying cause of death (ICD-10 A00-Y99 equivalent to
ICD-9 001-E999), registered in the respective calendar year(s). Neonatal deaths are included in the age groups
that contain those aged less than 1 year.
Source of numerator data – Office for National Statistics (ONS).
Comments on numerator data – Mortality data for years 1993-2006 were extracted by ONS in June 2007 with
organisational codes assigned using the postcode of usual residence and the November 2006 edition of the
National Statistics Postcode Directory (NSPD). Data for subsequent years were extracted in June of the following
year using the respective year’s November edition of the NSPD.
In January 2001, the ONS implemented a change from ICD-9 to ICD-10 for coding causes of death in England &
Wales. As part of an exercise to investigate the effects of this change, the ONS also re-coded all deaths registered
in 1999. Deaths for years prior to 1999 and for year 2000 have not been re-coded.
71
For current analysis, therefore, all data are based on ICD-10.
For trend analysis, the numbers of deaths observed in the years 1993-98 and 2000 must be adjusted to give
“expected” numbers of deaths which would have been coded to this cause in ICD-10. This is done by multiplying
the ICD-9 based death counts by the appropriate ICD-10/9 comparability ratio published by the ONS. Trend data
cannot include years prior to 1993, because the ONS introduced automated coding in 1993, and the comparability
ratios are only valid from this point onwards. For this indicator the following ICD-10/9 comparability ratios were
used:
Males
Females
All Ages: 1
All Ages: 1
Adjusted person counts are the sum of the adjusted male and female counts. Once adjusted, the counts are used
to calculate rates in the usual way.
From the 2003 Compendium onwards, data are based on the original causes of death rather than the final causes
used in earlier Compendia.
See Annex 2 for more details.
Denominator:
Denominator data - 2001 Census based mid-year population estimates for the respective calendar years.
Source of denominator data - ONS.
Comments on denominator data - Data are based on the latest revisions of ONS mid-year population estimates for
the respective years, current as at 1 October 2009.
Statistical methods:
Annex 2: Changes to Office for National Statistics mortality data
Annex 3: Explanations of statistical methods used in the Compendium
Annex 5: European Standard Population
Interpretation of indicators:
Quality of indicator - Annex 12 describes the criteria that should be used to judge the quality of this indicator. The
application of the criteria is dependent on the context (e.g. describing a single organisation, comparing several
organisations) and the level (e.g. national / regional with large numbers of events, local with small numbers of
events) at which the data are to be used.
Further reading:
1.
2.
Office for National Statistics. Twentieth Century Mortality Trends in England and Wales. Office for National
Statistics Health Statistics Quarterly, No. 18, 2003: 5-17. Available at:
http://www.statistics.gov.uk/downloads/theme_health/HSQ18_revised_21Aug03.pdf
Brock A, Griffiths C. Trends in the mortality of young adults aged 15-44 in England and Wales, 1961-2001.
Office for National Statistics Health Statistics Quarterly, No. 19, 2003: 22-31. Available at:
http://www.statistics.gov.uk/downloads/theme_health/HSQ19.pdf
Updated: December 2009
72
Mortality from causes considered amenable to health care
Purpose:
To help reduce deaths from causes considered amenable to health care. Causes of death are included if there is
evidence that they are amenable to healthcare interventions and – given timely, appropriate, and high quality care
– death rates should be low among the age groups specified. Healthcare intervention includes preventing disease
onset as well as treating disease. Two additional indictors are provided: ‘mortality from causes considered
amenable to health care (exc Ischaemic heart disease)’ and ‘mortality from causes other than those considered
amenable to health care’. The difference between amenable and non-amenable causes in their trends over time
may provide evidence of the increasing (or decreasing) effectiveness of health care.
Definition of indicator and its variants:
Mortality from causes considered amenable to health care (see “Numerator data” for definition).
Mortality from causes considered amenable to health care (exc ischaemic heart disease).
Mortality from causes other than those considered amenable to health care.
As from the November 2005 Compendium release this indicator replaces the ‘mortality from potentially avoidable
causes’ indicator published in previous Compendia.
Statistic
Indirectly age-standardised
mortality ratio (SMRs) and
number of deaths
Directly age-standardised
mortality rate per 100,000 and
number of deaths
Sex
Age group
MFP Various <75
MFP Various <75
Organisation
(see glossary)
Current
data
E&W, E, GOR,
ONS area, SHA,
LA, PCO, CTY
2006-08
E&W, E, GOR,
ONS area, SHA,
LA, PCO, CTY
2006-08
Trend
data
File-worksheet name
03D_074SMP1_08_V1
03D_074SMP2_08_V1
03D_074SMP3_08_V1
1993-08 03D_074SMP1T_08_V1
03D_074SMP2T_08_V1
03D_074SMP3T_08_V1
03D_074DRP1_08_V1
03D_074DRP2_08_V1
03D_074DRP3_08_V1
1993-08 03D_074DRP1T_08_V1
03D_074DRP2T_08_V1
03D_074DRP3T_08_V1
Numerator:
Numerator data – Deaths considered amenable to health care are defined as those from the following causes for
the specific age groups stated. Deaths are classified by underlying cause of death, registered in the respective
calendar years and analysed collectively (See “Further reading ”):
•
Intestinal infections (ICD-10 A00-A09, ICD-9 001-009, ages 0-14 years;
•
Tuberculosis (ICD-10 A15-A19, B90; ICD-9 010-018, 137), ages 0-74 years;
•
Other infectious diseases (diptheria, tetanus, poliomyelitis) (ICD-10 A36, A35, A80; ICD-9 032, 037, 045),
ages 0-74 years;
•
Whooping cough (ICD-10 A37, ICD-9 033), ages 0-14 years;
•
Septicaemia (ICD-10 A40-A41, ICD-9 038), ages 0-74 years;
•
Measles (ICD-10 B05, ICD-9 055), ages 1-14 years;
•
Malignant neoplasm of colon and rectum (ICD-10 C18-C21, ICD-9 153-154), ages 0-74 years;
•
Malignant neoplasm of skin (ICD-10 C44, ICD-9 173), ages 0-74 years;
•
Malignant neoplasm of female breast (ICD-10 C50, ICD-9 174), ages 0-74 years;
•
Malignant neoplasm of cervix uteri (ICD-10 C53, ICD-9 180), ages 0-74 years;
•
Malignant neoplasm of unspecified part of the uterus and body of the uterus (ICD-10 C54-C55, ICD-9
179, 182), ages 0-44 years;
•
Malignant neoplasm of testis (ICD-10 C62, ICD-9 186), 0-74 years;
•
Hodgkin's disease (ICD-10 C81, ICD-9 201), ages 0-74 years;
•
Leukaemia (ICD-10 C91-C95, ICD-9 204-208), ages 0-44 years;
•
Diseases of the thyroid (ICD-10 E00-E07, ICD-9 240-246), ages 0-74 years;
•
Diabetes mellitus (ICD-10 E10-E14, ICD-9 250), ages 0-49 years;
•
Epilepsy (ICD-10 G40-G41, ICD-9 345), 0-74 years;
•
Chronic rheumatic heart disease (ICD-10 I05-I09, ICD-9 393-398), ages 0-74 years;
•
Hypertensive disease (ICD-10 I10-I13, I15 ; ICD-9 401-405), ages 0-74 years;
•
Ischaemic heart disease (ICD-10 I20-I25, ICD-9 410-414), ages 0-74 years;
•
Cerebrovascular disease (ICD-10 I60-I69, ICD-9 430-438), ages 0-74 years;
73
•
•
•
•
•
•
•
•
•
•
•
•
•
•
All respiratory diseases (excl. pneumonia, influenza and asthma) (ICD-10 J00-J09, J20-J44, J47-J99;
ICD-9 460-479, 488-492, 494-519), ages 1-14 years;
Influenza (ICD-10 J10-J11, ICD-9 487), ages 0-74 years;
Pneumonia (ICD-10 J12-J18, ICD-9 480-486), ages 0-74 years;
Asthma (ICD-10 J45-J46, ICD-9 493), ages 0-44 years;
Peptic ulcer (ICD-10 K25-K27, ICD-9 531-533), ages 0-74 years;
Appendicitis (ICD-10 K35-K38, ICD-9 540-543), ages 0-74 years;
Abdominal hernia (ICD-10 K40-K46, ICD-9 550-553), ages 0-74 years;
Cholelithiasis & cholecystitis (ICD-10 K80-K81, ICD-9 574-575.1), ages 0-74 years;
Nephritis and nephrosis (ICD-10 N00-N07, N17-N19, N25-N27; ICD-9 580-589), ages 0-74 years;
Benign prostatic hyperplasia (ICD-10 N40, ICD-9 600), ages 0-74 years;
Maternal deaths (ICD-10 O00-O99, ICD-9 630-676), ages 0-74 years;
Congenital cardiovascular anomalies (ICD-10 Q20-Q28, ICD-9 745-747), ages 0-74 years;
Perinatal deaths (all causes excl. stillbirths), ages 0-6 days;
Misadventures to patients during surgical and medical care (ICD-10 Y60-Y69, Y83-Y84; ICD-9 E870E876, E878-E879), ages 0-74 years.
Deaths from causes considered amenable to health care (exc ischaemic heart disease) are defined as above
with the exclusion of the deaths from ischeamic heart disease (ICD-10 I20-I25, ICD-9 410-414), ages 0-74
years.
Deaths from causes other than those considered amenable to health care are defined as deaths for ages 0-74
years excluding those deaths as defined above.
Source of numerator data – Office for National Statistics (ONS).
Comments on numerator data – Mortality data for years 1993-2006 were extracted by ONS in June 2007 with
organisational codes assigned using the postcode of usual residence and the November 2006 edition of the
National Statistics Postcode Directory (NSPD). Data for subsequent years were extracted in June of the following
year using the respective year’s November edition of the NSPD.
In January 2001, the ONS implemented a change from ICD-9 to ICD-10 for coding causes of death in England &
Wales. As part of an exercise to investigate the effects of this change, the ONS also re-coded all deaths registered
in 1999. Deaths for years prior to 1999 and for year 2000 have not been re-coded.
For current analysis, therefore, all data are based on ICD-10.
For trend analysis, the numbers of deaths observed in the years 1993-98 and 2000 must be adjusted to give
“expected” numbers of deaths which would have been coded to this cause in ICD-10. This is done by multiplying
the ICD-9 based death counts by the appropriate ICD-10/9 comparability ratio published by the ONS. Trend data
cannot include years prior to 1993, because the ONS introduced automated coding in 1993, and the comparability
ratios are only valid from this point onwards.
For this indicator comparability ratios are not available for each of the specific causes and age-groups and
adjustment is not possible. Trends should therefore be interpreted with caution as there is a potential discontinuity
as a result of the change in ICD version.
From the 2003 Compendium onwards, data are based on the original causes of death rather than the final causes
used in earlier Compendia.
See Annex 2 for more details.
Denominator:
Denominator data - 2001 Census based mid-year population estimates for the respective calendar years.
Source of denominator data - ONS.
Comments on denominator data – The demoninator population used is that aged 0-74 years. Data are based on
the latest revisions of ONS mid-year population estimates for the respective years, current as at 1 October 2009.
Statistical methods:
Annex 2: Changes to Office for National Statistics mortality data
Annex 3: Explanations of statistical methodologies used in the Compendium.
74
Interpretation of indicators:
Quality of indicator - Annex 12 describes the criteria that should be used to judge the quality of this indicator. The
application of the criteria is dependent on the context (e.g. describing a single organisation, comparing several
organisations) and the level (e.g. national / regional with large numbers of events, local with small numbers of
events) at which the data are to be used.
Further reading:
1.
2.
3.
4.
5.
Wheller L, Baker A, Griffiths C and Ronney C. Trends in avoidable mortality in England and Wales, 19932005. Office for National Statistics Health Statistics Quarterly, No. 34, 2007: 6-25, Available at:
http://www.statistics.gov.uk/downloads/theme_health/HSQ34.pdf
Nolte E & McKee M. Does Healthcare Save Lives - Avoidable Mortality Revisited. London: The Nuffield Trust,
2004.
Lakhani A et al. Creative use of existing clinical and health outcomes data to assess NHS performance in
England: part 2 – more challenging aspects of monitoring. BMJ, 2005; 330: 1486-92.
Charlton JRH, Bauer R, Lakhani A. Outcome measures for district and regional health care planning.
Community Medicine, 1984; 6: 306-315.
Brock A, Griffiths C. Trends in the mortality of young adults aged 15-44 in England and Wales, 1961-2001.
Office for National Statistics Health Statistics Quarterly, No. 19, 2003: 22-31. Available at:
http://www.statistics.gov.uk/downloads/theme_health/HSQ19.pdf
Updated: December 2009
75
Life expectancy
Purpose:
To help reduce premature mortality and facilitate planning of health services at local level.
Definition of indicator and its variants:
Life expectancy at birth (a measure of mortality) for an area in a given period as an estimate of the number of
years a new-born baby would survive, were he or she to experience the particular area's age-specific mortality
rates for that time period throughout his or her life.
Statistic
Number and rank
Sex
MF
Age group
All ages, 65+
Organisation
(see glossary)
Current
data
E&W, E, GOR,
SHA, LA, PCO CTY
2006-08
E&W, E, GOR,
SHA, LA, PCO
(2002-04 onwards),
CTY
Trend
data
File-worksheet name
03E_186NOP1_08_V1
03E_186NOP2_08_V1
1991-93
to
03E_186NOTP1_08_V1
2006-08 03E_186NOTP2_08_V1
Numerator:
Numerator data - Estimated number of years of life expectancy at birth and at age 65 based on a three-year period
for the relevant years.
Source of numerator data – Office for National Statistics (ONS).
Comments on numerator data - The figures reflect mortality among those living in the area in each time period.
They are not the number of years a baby born in the area in each time period could actually expect to live, both
because the death rates of the area are likely to change in the future and because many of those born in the area
will live elsewhere for at least some part of their lives.
Life expectancy at birth is also not a guide to the remaining expectancy of life at any given age. For example, if
female life expectancy at birth was 80 years for a particular area, life expectancy of women aged exactly 75 years
in that area would exceed 5 years. This reflects the fact that survival from a particular age depends only on the
mortality rates beyond that age, whereas survival from birth is based on mortality rates for all ages.
The figures are rolling three-year averages produced by aggregating deaths and population estimates for each
successive overlapping three-year period. They are presented as the current data for 2006-08 (including
confidence intervals) and as trend data (without confidence intervals) for 1991-1993 to 2006-2008 to show change
over time. The deaths of non-residents are included in the figures for England and Wales but are excluded from
data for other areas. Two Local Authorities (City of London and Isles of Scilly) are excluded from the results
because of small numbers of deaths and populations in these areas.
The population estimates used for the calculation of figures for this indicator are based on the 2001 Census. The
current interim life tables are published by ONS. These tables are based on the mid-year population estimates for
2006 and 2007 revised and published in August 2008, and 2008 estimates published in August 2009 and
corresponding data on births, infant deaths by individual age from those years.
Denominator:
Denominator data - See “Numerator data”.
Source of denominator data - See “Numerator data”.
Comments on denominator data - See “Numerator data”.
Statistical methods:
Abridged life tables were constructed using standard methods. Separate tables were constructed for males and
females. The tables were created using annual mid-year population estimates and deaths registered in each year.
All figures presented here are for life expectancy at birth. The Government Actuary's Department (GAD) compiles
data on life expectancy, using data derived from Registrars General on population and deaths. Data are available
in the form of life tables on both a period and a cohort basis.
76
The calculation of the confidence intervals was made using the method developed by Chiang. A report which
details research undertaken by the Office for National Statistics on comparing methodologies to enable the
calculation of confidence intervals for life expectancy at birth has now been published as No 33 in the National
Statistics Methodological Series. This report, “Life expectancy at birth: methodological options for small
populations”, also presents research carried out to establish if there is a minimum population size below which the
calculation of life expectancy may not be considered feasible. It concludes with a summary of methodological
conclusions and considers how these could be applied to the calculation of life expectancy at birth for wards in
England and Wales. A copy of the report can be found on the ONS website at:
http://www.statistics.gov.uk/statbase/Product.asp?vlnk=10626
Examples of life tables constructed for the comparison of methodologies are also available in an Excel workbook,
“Life Table Templates” which can be found on the ONS website at:
http://www.statistics.gov.uk/statbase/Product.asp?vlnk=8841
Life expectancy at age 65 uses the same methodology as is used for calculating life expectancy at birth.
Interpretation of indicators:
Quality of indicator - Annex 12 describes the criteria that should be used to judge the quality of this indicator. The
application of the criteria is dependent on the context (e.g. describing a single organisation, comparing several
organisations) and the level (e.g. national / regional with large numbers of events, local with small numbers of
events) at which the data are to be used.
Further reading:
1.
2.
3.
4.
5.
6.
7.
8.
9.
10.
11.
12.
13.
14.
15.
16.
17.
Office for National Statistics. Life expectancy at birth and at age 65 by local areas in the United Kingdom,
2006-08. Health Statistical Bulletin, 21 October 2009. Available at:
http://www.statistics.gov.uk/pdfdir/liex1009.pdf
Office for National Statistics. News Release: Life expectancy at birth remains highest in the South of England,
21 October 2009. Available at: http://www.statistics.gov.uk/pdfdir/liexnr1009.pdf
Office for National Statistics. News Release: Life expectancy at birth is longest in the South of England,
30 October 2008. Available at: http://www.statistics.gov.uk/pdfdir/leb1008.pdf
Office for National Statistics. Report: Life expectancy at birth and at age 65 by local areas in the United
Kingdom, 2004-06. Health Statistics Quarterly, no 36, Winter 2007. Available at:
http://www.statistics.gov.uk/downloads/theme_population/HSQ36LE.pdf
Office for National Statistics. Life expectancy news release November 2006 available at:
http://www.statistics.gov.uk/pdfdir/liex1106.pdf
Office for National Statistics. Life expectancy at birth by health and local authorities in England and Wales,
2002 - 2004. Health Statistics Quarterly, No. 28, Winter 2005: 52-61. Available at:
http://www.statistics.gov.uk/downloads/theme_health/HSQ28.pdf
Woods M, Rachet B, Riga M, Stone N, Shah A, M C. Geographical variation in life expectancy at birth in
England and Wales is largely explained by deprivation. J Epidemiol Community Health 2005; 59:115-120.
Bajekal, M et al. Healthy life expectancy at Health Authority level: comparing estimates from the General
Household Survey and the Health Survey for England. Office for National Statistics Health Statistics Quarterly,
No. 16, 2002: 25-37. Available at: http://www.statistics.gov.uk/downloads/theme_health/HSQ16.pdf
Office for National Statistics. Life expectancy at birth by health and local authorities in the United Kingdom,
1998 to 2000. Office for National Statistics Health Statistics Quarterly, No. 13, 2002: 83-90. Available at:
http://www.statistics.gov.uk/downloads/theme_health/HSQ13_v4.pdf
Office for National Statistics. Trends in life expectancy by social class 1972 – 1999. London: Office for
National Statistics, 2002. Available at:
http://www.statistics.gov.uk/downloads/theme_population/Life_Expect_Social_class_197299/Life_Expect_Social_class_1972-99.pdf
World Health Organization Regional Office for Europe. The European Health Report 2002. Copenhagen:
World Health Organization, 2002. Available at: http://www.who.dk/europeanhealthreport
Griffiths C and Fitzpatrick J. Geographic inequalities in life expectancy in the United Kingdom, 1995-97. Office
for National Statistics Health Statistics Quarterly, No. 9, 2001: 16-27.
Office for National Statistics. Life expectancy at birth by health and local authorities in the United Kingdom,
1997-99. Office for National Statistics Health Statistics Quarterly, No. 11, 2001: 78-85. Available at:
http://www.statistics.gov.uk/downloads/theme_health/HSQ11_v3.pdf
Acheson, Sir Donald. Inequalities in health. Bristol: The Policy Press, 1999.
Newell C. Methods and Models in Demography. Chichester: John Wiley & Sons, 1994.
Shyrock HS and Siegel JS. The Methods and Materials of Demography. Abridged edition. New York:
Academic Press,1976.
Chiang, CL. The life table and its construction. From: Introduction to stochastic processes in Biostatistics. New
York: John Wiley & Sons, 1968; Chapter 9: 189-214.
Updated: December 2009
77
Self-assessed general health
Purpose:
To help reduce levels of sickness and ill health and promote healthy lifestyles.
Definition of indicator and its variants:
Proportion of adults rating their general health as “very good” or “good”.
Statistic
Number, percent and
age-standardised percent
Sex
Age group
MFP 16+
Organisation
(see glossary)
Current
data
E, GOR, ONS area,
SHA, CTY
2001-03
2002-04
2003-05
2004-06
2005-07
2006-08
Trend
data
File-worksheet name
03F_301VSP1_08_V1
1998-08 03F_301VSP2_08_V1
Numerator:
Numerator data - The number of persons aged 16+ rating their general health as “very good” or “good” on a five
point scale ranging between “very good”, “good”, “fair”, “bad”, and “very bad” in a sample survey of the health of
the population of England.
Source of numerator data - Health Survey for England (HSE), commissioned by the Department of Health and
since April 2005 The Information Centre for health and social care and carried out by the Joint Health Survey Unit
of Social and Community Planning Research and of the Department of Epidemiology and Public Health at
University College, London.
Comments on numerator data - The results shown are based on respondents' subjective views and selfassessments of their health and, as such, self-reported illnesses may not necessarily correspond with medical
diagnoses. Some conditions such as mental illness have been shown to be under-reported in health surveys.Only
people living in private households were included in the sample. Those who were living in institutions, or
unavailable for interview as a result of a serious medical problem, were excluded.
Denominator:
Denominator data - Respondents aged 16+ in a sample survey of the health of the population of England.
Source of denominator data - See “Numerator data”.
Comments on denominator data - The HSE is a series of annual surveys that began in 1991 with the aim of
monitoring the health of the population. It was designed to measure health and health related behaviours in adults
and children living in private households in England. For each participant, the survey included an interview and a
physical examination by a nurse, at which various physical measurements, tests, and samples of blood and saliva
were collected. These measurements provided biomedical information about known risk factors associated with
disease and objective validation for self-reported health behaviour.
Statistical methods:
The figures have been provided for three-year periods (based on three-year moving averages) and for calendar
years. All calculations of sub-national observed estimates at Government Office Region, ONS area, Strategic
Health Authority and County levels, age-standardised rates, confidence intervals and significance tests were
carried out by the National Centre for Social Research (see Annex 9 for details).
Interpretation of indicators:
Quality of indicator - Annex 12 describes the criteria that should be used to judge the quality of this indicator. The
application of the criteria is dependent on the context (e.g. describing a single organisation, comparing several
organisations) and the level (e.g. national / regional with large numbers of events, local with small numbers of
events) at which the data are to be used.
Further reading:
1.
Sproston K and Primatesta P Eds. Health Surveyfor England 2003, National Centre for Social Research,
London: TSO, 2004. Available at:
78
2.
3.
http://www.archive2.official-documents.co.uk/document/deps/doh/survey03/card/card01.htm
Scholes S, Prescott A and Bajekal M. Health and lifestyle indicators for Strategic Health Authorities, 19942002, London: National Centre for Social Research, 2004. Available at:
http://www.dh.gov.uk/assetRoot/04/07/77/31/04077731.pdf
Joint Health Surveys Unit, National Centre for Social Research and Department of Epidemiology and Public
Health, the Royal Free and University College Medical School, London. The Health Survey for England Cardiovascular disease. London: Her Majesty’s Stationery Office, 1998.
Updated: November 2010
79
Limiting longstanding illness
Purpose:
To help reduce levels of sickness and ill health.
Definition of indicator and its variants:
Proportion of adults who report having one or more chronic conditions which limit their activities.
Statistic
Number, percent and
age-standardised percent
Sex
Age group
MFP 16+
Organisation
(see glossary)
Current
data
E, GOR, ONS area,
SHA, CTY
2001-03
2002-04
2003-05
2004-06
2005-07
2006-08
Trend
data
File-worksheet name
03G_302VSP1_08_V1
1998-08 03G_302VSP2_08_V1
Numerator:
Numerator data - The number of persons aged 16+ with one or more chronic self-reported limiting conditions in a
sample survey of the health of the population of England.
Source of numerator data - Health Survey for England (HSE), commissioned by the Department of Health and
since April 2005 The Information Centre for health and social care and carried out by the Joint Health Survey Unit
of Social and Community Planning Research and of the Department of Epidemiology and Public Health at
University College, London.
Comments on numerator data - Respondents were asked whether they had any illness, disability, or infirmity that
had troubled them over a period of time or was likely to affect them over a period of time. Those who reported
such an illness were asked about the nature of their condition (details of up to six longstanding illnesses were
recorded) and whether it limited their activities in any way. Questions on longstanding illness have been asked in
the Health Survey series since it began, while the question on limiting longstanding illness was introduced in 1996.
Longstanding illnesses were coded into categories defined in the International Classification of Diseases (ICD), but
it should be noted that the ICD is used mostly to classify conditions according to the cause, whereas HSE
classifies according to the reported symptoms.
Denominator:
Denominator data - Respondents aged 16+ in a sample survey of the health of the population of England.
Source of denominator data - See “Numerator data”.
Comments on denominator data - The HSE is a series of annual surveys that began in 1991 with the aim of
monitoring the health of the population. It was designed to measure health and health related behaviours in adults
and children living in private households in England. For each participant, the survey included an interview and a
physical examination by a nurse, at which various physical measurements, tests, and samples of blood and saliva
were collected. These measurements provided biomedical information about known risk factors associated with
disease and objective validation for self-reported health behaviour.
Statistical methods:
The figures have been provided for three-year periods (based on three-year moving averages) and for calendar
years. All calculations of sub-national observed estimates at Government Office Region, ONS area, Strategic
Health Authority and County levels, age-standardised rates, confidence intervals and significance tests were
carried out by the National Centre for Social Research (see Annex 9 for details).
Interpretation of indicators:
Quality of indicator - Annex 12 describes the criteria that should be used to judge the quality of this indicator. The
application of the criteria is dependent on the context (e.g. describing a single organisation, comparing several
organisations) and the level (e.g. national / regional with large numbers of events, local with small numbers of
events) at which the data are to be used.
80
Further reading:
1.
2.
3.
Sproston K and Primatesta P Eds. Health Surveyfor England 2003, National Centre for Social Research,
London: TSO, 2004. Available at:
http://www.archive2.official-documents.co.uk/document/deps/doh/survey03/card/card01.htm
Scholes S, Prescott A and Bajekal M. Health and lifestyle indicators for Strategic Health Authorities, 19942002, London: National Centre for Social Research, 2004. Available at:
http://www.dh.gov.uk/assetRoot/04/07/77/31/04077731.pdf
Joint Health Surveys Unit, National Centre for Social Research and Department of Epidemiology and Public
Health, the Royal Free and University College Medical School, London. The Health Survey for England Cardiovascular disease. London: Her Majesty’s Stationery Office, 1998.
Updated: November 2010
81
Acute sickness
Purpose:
To reduce levels of sickness and ill health.
Definition of indicator and its variants:
The prevalence of self-reported acute sickness among adults in the two weeks preceding a survey interview.
Statistic
Sex
Age group
Organisation
(see glossary)
Number, percent and
age-standardised percent
MFP
16+
E, GOR, ONS area,
SHA, CTY
Period
Current
data
2001-03
2002-04
2003-05
2004-06
2005-07
2006-08
File_worksheet Name
Trend
data
03H_303VSP1_08_V1
1998-08
03H_303VSP2_08_V1
Numerator:
Numerator data - The number of persons aged 16+ reporting acute sickness in the two weeks preceding the
survey interview, in a sample survey of the health of the population of England.
Source of numerator data - Health Survey for England (HSE), commissioned by the Department of Health and
since April 2005 The Information Centre for health and social care and carried out by the Joint Health Surv*ey Unit
of Social and Community Planning Research and of the Department of Epidemiology and Public Health at
University College, London.
Comments on numerator data - Acute sickness was defined as having to cut down, in the two weeks preceding the
interview, on usual activities (in the house, at school, at work or in free time) due to illness or injury. In order to
assess its severity, those who reported having acute sickness were asked on how many days in the past two
weeks had they been affected.
Denominator:
Denominator data - Respondents aged 16+ in a sample survey of the health of the population of England.
Source of denominator data - See “Numerator data”.
Comments on denominator data - The HSE is a series of annual surveys that began in 1991 with the aim of
monitoring the health of the population. It was designed to measure health and health related behaviours in adults
and children living in private households in England. For each participant, the survey included an interview and a
physical examination by a nurse, at which various physical measurements, tests, and samples of blood and saliva
were collected. These measurements provided biomedical information about known risk factors associated with
disease and objective validation for self-reported health behaviour.
Statistical methods:
The figures have been provided for three-year periods (based on three-year moving averages) and for calendar
years. All calculations of sub-national observed estimates at Government Office Region, ONS area, Strategic
Health Authority and County levels, age-standardised rates, confidence intervals and significance tests were
carried out by the National Centre for Social Research (see Annex 9 for details).
Further reading:
1.
2.
3.
Sproston K and Primatesta P Eds. Health Surveyfor England 2003, National Centre for Social Research,
London: TSO, 2004. Available at:
http://www.archive2.official-documents.co.uk/document/deps/doh/survey03/card/card01.htm
Scholes S, Prescott A and Bajekal M. Health and lifestyle indicators for Strategic Health Authorities, 19942002, London: National Centre for Social Research, 2004. Available at:
http://www.dh.gov.uk/assetRoot/04/07/77/31/04077731.pdf
Joint Health Surveys Unit, National Centre for Social Research and Department of Epidemiology and Public
Health, the Royal Free and University College Medical School, London. The Health Survey for England Cardiovascular disease. London: Her Majesty’s Stationery Office, 1998.
Updated: November 2010
82
Adults on prescribed medication
Purpose:
To reduce levels of sickness and ill health.
Definition of indicator and its variants:
Proportion of adults on prescribed medication.
Statistic
Sex
Age group
Organisation
(see glossary)
Number, percent and
age-standardised percent
MFP
16+
E, GOR, ONS area,
SHA, CTY
Period
Current
data
2001-03
2005-07
2006-08
File_worksheet
Name
Trend
data
03I_304VSP1_08_V1
1998
2000-03
2005-08
03I_304VSP2_08_V1
Numerator:
Numerator data - The number of persons aged 16+ currently taking at least one prescribed medicine in a sample
survey of the health of the population of England.
Source of numerator data - Health Survey for England (HSE), commissioned by the Department of Health and
since April 2005 The Information Centre for health and social care and carried out by the Joint Health Survey Unit
of Social and Community Planning Research and of the Department of Epidemiology and Public Health at
University College, London.
Comments on numerator data - As part of the nurse visit, information on the use of prescribed medicine was
collected and the name of each type of prescribed medicine was recorded. The nurse allocated medicines to a 6digit code corresponding to the British National Formulary (BNF) listing. Any medicines that nurses were unable to
code were checked by the office coding staff. It should be noted that the Health Survey assesses the reported use
of prescribed medicines and the findings reported here may differ from levels assessed using information about
dispensed medicines. Contraceptives are not included as prescribed medicines.
All respondents were asked about their use of prescribed medicines and these have been classified into 13 broad
pharmacological groups. For most categories there was little difference in the proportion of men and women using
prescribed medicines. The most commonly taken types of medicine by both men and women were those for
cardiovascular disease and for the central nervous system.
Denominator:
Denominator data - Respondents aged 16+ in a sample survey of the health of the population of England.
Source of denominator data - See “Numerator data”.
Comments on denominator data - The HSE is a series of annual surveys that began in 1991 with the aim of
monitoring the health of the population. It was designed to measure health and health related behaviours in adults
and children living in private households in England. The current “full” sample size of the HSE comprises about
16,000 adults aged 16 and over. For each participant, the survey included an interview and a physical examination
by a nurse, at which various physical measurements, tests, and samples of blood and saliva were collected. These
measurements provided biomedical information about known risk factors associated with disease and objective
validation for self-reported health behaviour.
Statistical methods:
The figures have been provided for three-year periods (based on three-year moving averages) and for calendar
years. All calculations of sub-national observed estimates at Government Office Region, ONS area, Strategic
Health Authority and County levels, age-standardised rates, confidence intervals and significance tests were
carried out by the National Centre for Social Research (see Annex 9 for details).
Further reading:
1.
Sproston K and Primatesta P Eds. Health Surveyfor England 2003, National Centre for Social Research,
London: TSO, 2004. Available at:
http://www.archive2.official-documents.co.uk/document/deps/doh/survey03/card/card01.htm
83
2.
3.
Scholes S, Prescott A and Bajekal M. Health and lifestyle indicators for Strategic Health Authorities, 19942002, London: National Centre for Social Research, 2004. Available at:
http://www.dh.gov.uk/assetRoot/04/07/77/31/04077731.pdf
Joint Health Surveys Unit, National Centre for Social Research and Department of Epidemiology and Public
Health, the Royal Free and University College Medical School, London. The Health Survey for England Cardiovascular disease. London: Her Majesty’s Stationery Office, 1998.
Updated: November 2010
84
General Health Questionnaire GHQ12 score
Purpose:
To reduce levels of sickness and ill health.
Improving the life outcomes for those people with mental health problems continues to be a priority for
the government.To this end it is important to monitor the percentage of people who suffer from poor
mental health, and to explore how this proportion varies across sections of society.
Definition of indicator and its variants:
The proportion of adults with a General Health Questionnaire GHQ12 score of 4 and over.
Statistic
Number. percent and
age-standardised percent
Sex
MFP
Age group
16+
Organisation
Period
(see glossary)
Current
data
E, GOR, ONS area,
SHA, CTY
2001-03
2002-04
2003-05
2004-06
File_worksheet Name
Trend
data
03J_321VSP1_06_V1
1998-06
2008
03J_321VSP2_08_V1
Numerator:
Numerator data - The number of persons aged 16+ with a score of 4 or over on the 12-item General Health
Questionnaire (GHQ12) in a sample survey of the health of the population of England.
Source of numerator data - Health Survey for England (HSE), commissioned by the Department of Health and
since April 2005 The Information Centre for health and social care and carried out by the Joint Health Survey Unit
of Social and Community Planning Research and of the Department of Epidemiology and Public Health at
University College, London.
Comments on numerator data - The general health questionnaire (GHQ) was used as an indicator of possible
mental health problems. This questionnaire consists of 12 questions concerning happiness, depression, anxiety,
sleep disturbance, and ability to cope over the four weeks preceding the survey interview. As in previous Health
Surveys a score of 4 or more was used as the threshold to identify respondents with possible psychiatric disorder,
and is referred to as a 'high GHQ score'. The questionnaire was administered in self-completion format, to all
respondents. Scores were calculated only for those respondents who had answered all 12 questions.
Denominator:
Denominator data - Respondents aged 16+ in a sample survey of the health of the population of England.
Source of denominator data - See “Numerator data”.
Comments on denominator data - The HSE is a series of annual surveys that began in 1991 with the aim of
monitoring the health of the population. It was designed to measure health and health related behaviours in adults
and children living in private households in England. The current “full” sample size of the HSE comprises about
16,000 adults aged 16 and over. For each participant, the survey included an interview and a physical examination
by a nurse, at which various physical measurements, tests, and samples of blood and saliva were collected. These
measurements provided biomedical information about known risk factors associated with disease and objective
validation for self-reported health behaviour.
Statistical methods:
The figures have been provided for three-year periods (based on three-year moving averages) and for calendar
years. All calculations of sub-national observed estimates at Government Office Region, ONS area, Strategic
Health Authority and County levels, age-standardised rates, confidence intervals and significance tests were
carried out by the National Centre for Social Research (see Annex 9 for details).
Further reading:
1.
Sproston K and Primatesta P Eds. Health Surveyfor England 2003, National Centre for Social Research,
London: TSO, 2004. Available at:
http://www.archive2.official-documents.co.uk/document/deps/doh/survey03/card/card01.htm
85
2.
3.
Scholes S, Prescott A and Bajekal M. Health and lifestyle indicators for Strategic Health Authorities, 19942002, London: National Centre for Social Research, 2004. Available at:
http://www.dh.gov.uk/assetRoot/04/07/77/31/04077731.pdf
Joint Health Surveys Unit, National Centre for Social Research and Department of Epidemiology and Public
Health, the Royal Free and University College Medical School, London. The Health Survey for England Cardiovascular disease. London: Her Majesty’s Stationery Office, 1998.
Updated: November 2010
86
Emergency hospital admissions: all conditions
Purpose:
The purpose of this indicator is to help monitor NHS success in prevention and treatment outside hospital.
Emergency admissions to hospital can be avoided if local systems are put in place to identify those at risk and
target services, particularly primary care services. There was a PPF target for 2002/3 for emergency admissions to
grow at less than 2%. The majority of patients admitted to hospital as an emergency are older people. In order to
avoid perverse incentives that might keep older people out of hospital when it is legitimate for them to be admitted,
the indicator is presented as a rate for patients of all ages. This indicator also acts as a proxy for the delivery of
services for older people generally.
Definition of indicator and its variants:
Emergency admissions to hospital, irrespective of condition.
Statistic
Sex
Age
group
Organisation
Period
(see glossary)
Indirectly age
and sexstandardised
rate per
100,000
(standardised to
FY 2005/06)
P
F
M
All
Ages
E; GOR; ONS area
(boundaries as at
November 2006);
SHA (boundaries as
at July 2006);
County, LA
(boundaries as at
April 2009); PCO
(boundaries as at
October 2006);
CTY.
Current
data
FY
2007/08
Trend
data
FY 2002/03,
FY 2003/04,
FY 2004/05,
FY 2005/06,
FY 2006/07
File_worksheet name
03K_520ISR7GP_08_V1
03K_520ISR7GF_08_V1
03K_520ISR7GM_08_V1
Numerator:
Numerator data - The number of finished and unfinished continuous inpatient (CIP) spells, excluding transfers, for
patients of all ages with an emergency method of admission in the respective financial year.
The following fields and values are used for the numerator:
The first episode in the CIP spell has:
ADMISORC not = 51, 52 or 53 (admission source);
AND EPITYPE = 1 (episode type);
AND SEX = 1 or 2 (sex);
AND EPIORDER = 1 (episode order);
AND ADMIMETH = 21, 22, 23, 24 or 28 (emergency admission method);
AND EPISTART >= 01/04/YYYY and EPISTART <= 31/03/YYYY+1 (episode start date within year);
AND CLASSPAT = 1 (patient classification);
AND STARTAGE is either 0-120 or 7001-7007 (age at start of episode);
AND DOB not 01/01/1900 or 01/01/1901 (date of birth).
Fields used from the first episode in a spell where there is a valid patient postcode allowing the derivation of
the following organisation of residence codes include:
SPELLRESPCTC, SPELLRESLADSTC, SPELLRESSTHAC. Other organisational levels (E, GOR,
ONS Areas, Counties) are aggregates of the SPELLRESLADSTC field.
Counts are by:
age / sex / organisation of residence in CIP spell (values for England are aggregates of these)
where:
age bands are <1, 1-4, 5-9, … , 80-84, 85+;
sex is 1, 2 (male and female).
Source of numerator data - Hospital Episode Statistics (HES) for CIP spells intersecting the respective financial
year. England, The NHS Information Centre for health and social care.
Comments on numerator data - It is important, for the purposes of measuring incidence, to count persons as
opposed to episodes of care, as each person with the condition should only be counted once during each
admission. This is done by counting CIP spells (epiorder 1) only. Some transfers, which are also coded epiorder 1
87
and emergency, could lead to double counting. In order to avoid this, spells which have an ADMISORC of 51-53,
indicating a transfer from another NHS Trust, are excluded.
Individual finished consultant episodes are linked to other episodes where all are part of one continuous spell of
care for a patient (see CIP spell construction sections in Annex 4 (Methods section of the Clinical and Health
Outcomes Knowledge Base www.nchod.nhs.uk ) for details). A spell may contain HES data from another year only
when one of its episodes spans years. For example, a spell which finished during April may contain admission
information from an episode which started during the previous March. In order to avoid double counting that spell
in both financial years, only spells which started during the financial year of analysis are counted.
Spells are attributed to the organisation of residence, based on the numerator.
There is variation in the completeness of hospital records and quality of coding (see Data Quality sections in
Annex 4 (Methods section of the Clinical and Health Outcomes Knowledge Base www.nchod.nhs.uk ) for details).
Denominator:
Denominator data - The denominator is the resident population for the respective organisation.
Data are based on the latest revisions of ONS mid-year population estimates for the respective years, current as
at 29 September 2008.
For further details on revisions to ONS mid-year population estimates, and their availability, see the comments in
the specification for the ‘Estimates of resident population’ indicator.
Counts are by:
age / sex / organisation of residence (values for England are aggregates of these)
where:
age bands are <1, 1-4, 5-9, … , 80-84, 85+;
sex is 1, 2 (male and female).
Source of denominator data - Office for National Statistics.
Statistical methods:
The indicator is indirectly standardised by age and sex. The person-based rate is standardised by age and sex
using England age and sex rates as standards. The gender-specific rates are standardised by age using personbased standards, in order to highlight differences across gender. Indirect standardisation involves the calculation
of the ratio of an organisation’s observed number of events and the number of events that would be expected if it
had experienced the same event rates as those of patients in England, given the mix of age and sex of its patients.
This standardised ratio is then converted into a rate by multiplying it by the overall event rate of patients in
England.
The percentage change in admission rate from a previous year, plus the statistical significance of this change,
have also been calculated. A positive percentage represents improvement and a negative percentage represents
deterioration.
Annex 3 ‘Explanation of statistical methods’ (Methods section of the Clinical and Health Outcomes Knowledge
Base www.nchod.nhs.uk ) describes the methods used for indirect standardisation, calculation of improvement,
estimation of confidence intervals, and banding of significance of improvement.
Interpretation of indicator:
Type of indicator - This is a generic, cross-sectional annual comparative indicator, acting as a proxy for outcome.
In the absence of an absolute standard, comparative data are useful for monitoring in relation to rates achieved in
comparable organisations.
Quality of Indicator – Annex 12 (Methods section of the Clinical and Health Outcomes Knowledge Base
www.nchod.nhs.uk ) describes the criteria that should be used to judge the quality of this indicator. The application
of the criteria is dependent on the context (e.g. describing a single organisation, comparing several organisations)
and the level (e.g. national / regional with large numbers of events, local with small numbers of events) at which
the data are to be used.
Confidence Intervals - Some of the values and factors influencing the indicator may be chance occurrences, with
values fluctuating at random between organisations and from year to year. Numbers of admissions may be small
at Primary Care Organisation and Local Authority level. The results should therefore be interpreted with caution
and with the aid of confidence intervals. The 95% confidence interval provides a measure of the statistical
precision of the rate for an area or institution. It indicates a range which, with 95% confidence, will contain the
underlying value of the indicator. If the confidence interval for an area’s rate does not contain the overall national
88
rate, the difference between the two rates is considered statistically significant. If the confidence intervals for the
two rates overlap, in most cases the difference between the rates would not be considered statistically significant.
95% and 99.8% confidence intervals have been calculated.
Effect of case-mix/severity - A number of factors outside the control of hospitals, such as the socio-economic mix
of local populations and events prior to hospitalisation, may determine whether a patient gets admitted or not and
may influence rates. Differences in case-mix (beyond that accounted for by standardisation), comorbidities and
other potential risk factors also contribute to the variation. Current data do not allow assignment of severity of
illness across continuous inpatient spells, nor do they allow adjustment for any of these factors. We have tried to
deal with this constraint partially by presenting the data in clusters that are similar with respect to organisation
type. Gender-specific data standardised to person rates are available.
Other potential confounding factors - The patterns of providing care may vary between organisations in terms of:
extent of treatment in primary care settings; referral policies and practices; hospital outpatient facilities/walk-in
clinics; and hospital inpatient admission policies.
Potential value of indicator:
To stimulate discussion and encourage local investigation, and to lead to improvement in data quality and quality
of care.
Potential for follow-up action leading to change:
Studies to assess the extent to which admissions were potentially avoidable are recommended.
Relevant national initiatives:
This indicator was part of the NHS Performance Indicators published by the Department of Health up to 2002.
Further reading:
1.
2.
NHS Executive. Clinical Effectiveness Indicators – A Consultation Document. London: Department of Health,
1998.
Department of Health. NHS Performance Indicators . London: Department of Health, 2002.
Updated: July 2009
89
Emergency hospital admissions: acute conditions usually managed in primary care
Purpose:
The purpose of the indicator is to help monitor potentially avoidable emergency hospital admissions for certain
acute illnesses that are amenable to management in a primary care setting through, for example, better support in
the management of illnesses in the home (providing support as well as facilitating access to health advice and
therapy through NHS Direct and enhanced primary care).
Definition of indicator and its variants:
Emergency admissions to hospital of persons with acute conditions (ear/nose/throat infections, kidney/urinary tract
infections, heart failure) usually managed in primary care.
Statistic
Age
group
Sex
Organisation
(see glossary)
Indirectly age
and sexstandardised
rate per
100,000
(standardised
to FY 2005/06)
P
F
M
All
Ages
E; GOR; ONS area
(boundaries as at
November 2006);
SHA (boundaries as
at July 2006);
County, LA
(boundaries as at
April 2009); PCO
(boundaries as at
October 2006);
CTY.
Period
Current
data
FY
2007/08
Trend
data
FY 2002/03
FY 2003/04
FY 2004/05
FY 2005/06
FY 2006/07
File_worksheet name
03L_521ISR7EP_08_V1
03L_521ISR7EF_08_V1
03L_521ISR7EM_08_V1
Numerator:
Numerator data - The number of finished and unfinished continuous inpatient (CIP) spells, excluding transfers, for
patients with an emergency method of admission and with any of the following primary diagnoses (DIAG_01in the
st
1 episode of the spell, ICD 10 codes) in the respective financial year:
Ear, nose and throat infections
•
H66.0 - H66.4, H66.9
•
J02.0, J02.8, J02.9
•
J03.0, J03.8, J03.9
•
J04.0
•
J06.0, J06.8, J06.9
•
J31.0 - J31.2
Suppurative and unspecified otitis media;
Acute pharyngitis;
Acute tonsillitis;
Acute laryngitis;
Acute upper respiratory infections of multiple and unspecified
sites;
Chronic rhinitis, nasopharyngitis and pharyngitis.
Kidney / urinary tract infections
•
N15.9
•
N39.0
•
N30.0
Renal tubulo-interstitial disease, unspecified;
Urinary tract infection, site not specified;
Acute cystitis.
Heart failure
•
I50.0, I50.1, I50.9
•
I11.-
Heart failure;
Hypertensive heart disease.
The following fields and values are used for the numerator:
The first episode in the CIP spell has:
DIAG_01 in the valid list for this indicator (primary diagnosis);
AND ADMISORC not = 51, 52 or 53 (admission source);
AND EPITYPE = 1 (episode type);
AND SEX = 1 or 2 (sex);
AND EPIORDER = 1 (episode order);
AND ADMIMETH = 21, 22, 23, 24 or 28 (admission method);
AND EPISTART is >= 01/04/YYYY and EPISTART <= 31/03/YYYY+1 (episode start date);
AND CLASSPAT = 1 (patient classification);
AND STARTAGE is 0-120 or 7001-7007 (age at start of episode);
AND DOB not 01/01/1900 or 01/01/1901 (date of birth).
90
Fields used from the first episode in a spell where there is a valid patient postcode allowing the derivation
of the following organisation of residence codes include:
SPELLRESPCTC, SPELLRESLADSTC, SPELLRESSTHAC. Other organisational levels (E, GOR,
ONS Areas, Counties) are aggregates of the SPELLRESLADSTC field.
Counts are by:
age / sex / organisation of residence in CIP spell (values for England are aggregates of
these)
where:
age bands are <1, 1-4, 5-9, … , 80-84, 85+;
sex is 1, 2 (male and female).
Source of numerator data – Hospital Episode Statistics (HES) for CIP spells intersecting the respective financial
year. England, The NHS Information Centre for health and social care.
Comments on numerator data – It is important, for the purposes of measuring incidence, to count persons as
opposed to episodes of care, as each person with the condition should only be counted once during each
admission. This is done by counting CIPS (epiorder 1) only. Some transfers, which are also coded epiorder 1 and
emergency, could lead to double counting. In order to avoid this, spells which have an ADMISORC of 51-53,
indicating a transfer from another NHS Trust, are excluded.
Individual finished consultant episodes are linked to other episodes where all are part of one continuous spell of
care for a patient (see CIP spell construction sections in Annex 4 (Methods section of the Clinical and Health
Outcomes Knowledge Base www.nchod.nhs.uk ) for details). A spell may contain HES data from another year only
when one of its episodes spans years. For example, a spell which finished during April may contain admission
information from an episode which started during the previous March. In order to avoid double counting that spell
in both financial years, only spells which started during the financial year of analysis are counted.
Deaths in the community prior to admission are not included, nor are patients who get treated in the community, as
data about them are not available.
Emergency method of admission and primary diagnosis are used to distinguish between new disease and
readmission for the same problem previously treated in hospital. However, there could be double counting if the
readmission is coded as an emergency and has the same primary diagnosis.
Spells are attributed to the organisation of residence, based on the numerator.
There is variation in the completeness of hospital records and quality of coding (see Data Quality sections in
Annex 4 (Methods section of the Clinical and Health Outcomes Knowledge Base www.nchod.nhs.uk ) for details).
These show the proportion of diagnoses not coded. There may be variation between hospitals in the way that they
code diagnoses to the fourteen diagnosis fields in each episode, particularly primary diagnosis. For instance, they
may code in the order in which diagnoses were made, or according to the perceived importance or complexity.
This may affect whether a particular spell is selected for inclusion in the numerator of this indicator.
Denominator:
Denominator data - The denominator is the resident population for the respective organisation.
Data are based on the latest revisions of ONS mid-year population estimates for the respective years, current as
at 29 September 2008.
For further details on revisions to ONS mid-year population estimates, and their availability, see the comments in
the specification for the ‘Estimates of resident population’ indicator.
Counts are by:
age / sex / organisation of residence (values for England are aggregates of these)
where:
age bands are <1, 1-4, 5-9, … , 80-84, 85+;
sex is 1, 2 (male and female).
Source of denominator data - Office for National Statistics.
Statistical Methods:
The indicator is indirectly standardised by age and sex. The person-based rate is standardised by age and sex
using England age and sex rates as standards. The gender-specific rates are standardised by age using person
based standards, in order to highlight differences across gender. Indirect standardisation involves the calculation
of the ratio of an organisation’s observed number of events and the number of events that would be expected if it
91
had experienced the same event rates as those of patients in England, given the mix of age and sex of its patients.
This standardised ratio is then converted into a rate by multiplying it by the overall event rate of patients in
England.
The percentage change in admission rate from a previous year, plus the statistical significance of this change,
have also been calculated. A positive percentage represents improvement and a negative percentage represents
deterioration.
Annex 3 ‘Explanation of statistical methods’ (Methods section of the Clinical and Health Outcomes Knowledge
Base www.nchod.nhs.uk ) describes the methods used for indirect standardisation, calculation of improvement,
estimation of confidence intervals, and banding of significance of improvement.
Interpretation of indicator:
Type of indicator - This is a condition-specific, cross-sectional annual comparative indicator, acting as a proxy for
outcome. In the absence of an absolute standard, comparative data are useful for monitoring in relation to rates
achieved in comparable organisations.
Quality of Indicator – Annex 12 (Methods section of the Clinical and Health Outcomes Knowledge Base
www.nchod.nhs.uk ) describes the criteria that should be used to judge the quality of this indicator. The application
of the criteria is dependent on the context (e.g. describing a single organisation, comparing several organisations)
and the level (e.g. national / regional with large numbers of events, local with small numbers of events) at which
the data are to be used.
Confidence Intervals - Some of the values and factors influencing the indicator may be chance occurrences, with
values fluctuating at random between organisations and from year to year. Numbers of admissions may be small
at Primary Care Organisation and Local Authority level. The results should therefore be interpreted with caution
and with the aid of confidence intervals. The 95% confidence interval provides a measure of the statistical
precision of the rate for an area or institution. It indicates a range which, with 95% confidence, will contain the
underlying value of the indicator. If the confidence interval for an area’s rate does not contain the overall national
rate, the difference between the two rates is considered statistically significant. If the confidence interval overlaps
the national rate, in most cases the difference between the rates would not be considered statistically significant.
95% and 99.8% confidence intervals have been calculated.
Effect of case-mix/severity - A number of factors outside the control of hospitals, such as the socio-economic mix
of local populations and events prior to hospitalisation, may determine whether a patient gets admitted or not and
may influence rates. Differences in case-mix (beyond that accounted for by standardisation), comorbidities and
other potential risk factors also contribute to the variation. Current data do not allow assignment of severity of
illness across continuous inpatient spells, nor do they allow adjustment for any of these factors. We have tried to
deal with this constraint partially by presenting the data in clusters that are similar with respect to organisation
type. Gender-specific data standardised to person rates are available.
Other potential confounding factors - The patterns of providing care may vary between organisations in terms of:
extent of treatment in primary care settings; referral policies and practices; accessibility of accident and emergency
facilities; hospital outpatient facilities/walk-in clinics; and hospital inpatient admission policies and practices.
Potential value of indicator:
To stimulate discussion and encourage local investigation, and to lead to improvement in data quality and quality
of care.
Potential for follow-up action leading to change:
Studies to assess the extent to which admissions were potentially avoidable are recommended.
Relevant national initiatives:
This indicator was part of the NHS Performance Indicators published by the Department of Health up to 2002.
Further reading:
1.
2.
3.
NHS Executive. Clinical Effectiveness Indicators – A Consultation Document. London: Department of Health,
1998.
Department of Health. NHS Performance Indicator. London: Department of Health, 2002.
Lakhani A, Coles J, Eayres D, Spence C, Rachet B. Creative use of existing clinical and health outcomes data
to assess NHS performance in England: Part 1—performance indicators closely linked to clinical care. BMJ
2005;330: 1426-31.
Updated: July 2009
92
Emergency hospital admissions: chronic conditions usually managed in primary care
Purpose:
The purpose of the indicator is to help monitor potentially avoidable emergency hospital admissions for certain
chronic illnesses that are amenable to management in a primary care setting. Admissions may be avoided
through, for example, better support in the management of illnesses in the home (providing support as well as
facilitating access to health advice and therapy through NHS Direct and enhanced primary care).
Definition of indicator and its variants:
Emergency admissions to hospital of persons with chronic conditions (asthma, diabetes) usually managed in
primary care.
Statistic
Age
group
Sex
Organisation
(see glossary)
Indirectly age
and sexstandardised
rate per
100,000
(standardised to
FY 2005/06)
P
F
M
All
Ages
E; GOR; ONS area
(boundaries as at
November 2006);
SHA (boundaries as
at July 2006);
County, LA
(boundaries as at
April 2009); PCO
(boundaries as at
October 2006);
CTY.
Period
Current
data
FY
2007/08
Trend
data
FY 2002/03,
FY 2003/04,
FY 2004/05,
FY 2005/06,
FY 2006/07
File_worksheet name
03M_522ISR7FP_08_V1
03M_522ISR7FF_08_V1
03M_522ISR7FM_08_V1
Numerator:
Numerator data - The number of finished and unfinished continuous inpatient spells (CIPS), excluding transfers,
for patients with an emergency method of admission and with any of the following primary diagnoses (DIAG_01 in
the 1st episode of the spell, ICD 10 codes) in the respective financial year:
Asthma:
• J45.• J46.-
Asthma;
Status asthmaticus.
Diabetes:
•
•
•
•
•
E10.E11.E12.E13.E14.-
Insulin-dependent diabetes mellitus;
Non-insulin-dependent diabetes mellitus;
Malnutrition-related diabetes mellitus;
Other specified diabetes mellitus;
Unspecified diabetes mellitus.
The following fields and values are used for the numerator:
The first episode in the CIP spell has:
DIAG_01 in the valid list for this indicator (primary diagnosis);
AND ADMISORC not = 51, 52 or 53 (admission source);
AND EPITYPE = 1 (episode type);
AND SEX = 1 or 2 (sex);
AND EPIORDER = 1 (episode order);
AND ADMIMETH = 21, 22, 23, 24 or 28 (admission method);
AND EPISTART is >= 01/04/YYYY and EPISTART <= 31/03/YYYY+1 (episode start date);
AND CLASSPAT = 1 (patient classification);
AND STARTAGE is 0-120 or 7001-7007 (age at start of episode);
AND DOB not 01/01/1900 or 01/01/1901 (date of birth).
Fields used from the first episode in a spell where there is a valid patient postcode allowing the derivation of the
following organisation of residence codes include:
SPELLRESPCTC, SPELLRESLADSTC, SPELLRESSTHAC. Other organisational levels (E, GOR,
ONS Areas, Counties) are aggregates of the SPELLRESLADSTC field.
Counts are by:
93
age / sex / organisation of residence in CIP spell (values for England are aggregates of these)
where:
age bands are <1, 1-4, 5-9, … , 80-84, 85+;
sex is 1, 2 (male and female).
Source of numerator data – Hospital Episode Statistics (HES) for CIP spells intersecting the respective financial
year. England, The NHS Information Centre for health and social care.
Comments on numerator data – It is important, for the purposes of measuring incidence, to count persons as
opposed to episodes of care, as each person with the condition should only be counted once during each
admission. This is done by counting CIPS (epiorder 1) only. Some transfers, which are also coded epiorder 1 and
emergency, could lead to double counting. In order to avoid this, spells which have an ADMISORC of 51-53,
indicating a transfer from another NHS Trust, are excluded.
Individual finished consultant episodes are linked to other episodes where all are part of one continuous spell of
care for a patient (see CIP spell construction sections in Annex 4 (Methods section of the Clinical and Health
Outcomes Knowledge Base www.nchod.nhs.uk ) for details). A spell may contain HES data from another year only
when one of its episodes spans years. For example, a spell which finished during April may contain admission
information from an episode which started during the previous March. In order to avoid double counting that spell
in both financial years, only spells which started during the financial year of analysis are counted.
Deaths in the community prior to admission are not included, nor are patients who get treated in the community, as
data about them are not available.
Emergency method of admission and primary diagnosis are used to distinguish between new disease and
readmission for the same problem previously treated in hospital. However, there could be double counting if the
readmission is coded as an emergency and has the same primary diagnosis.
Spells are attributed to the organisation of residence, based on the numerator.
There is variation in the completeness of hospital records and quality of coding (see Data Quality sections in
Annex 4 (Methods section of the Clinical and Health Outcomes Knowledge Base www.nchod.nhs.uk ) for details).
These show the proportion of diagnoses not coded. There may be variation between hospitals in the way that they
code diagnoses to the fourteen diagnosis fields in each episode, particularly primary diagnosis. For instance, they
may code in the order in which diagnoses were made, or according to the perceived importance or complexity.
This may affect whether a particular spell is selected for inclusion in the numerator of this indicator.
Denominator:
Denominator data - The denominator is the resident population for the respective organisation.
Data are based on the latest revisions of ONS mid-year population estimates for the respective years, current as
at 29 September 2008.
For further details on revisions to ONS mid-year population estimates, and their availability, see the comments in
the specification for the ‘Estimates of resident population’ indicator.
Counts are by:
age / sex / organisation of residence (values for England are aggregates of these)
where:
age bands are <1, 1-4, 5-9, … , 80-84, 85+;
sex is 1, 2 (male and female).
Source of denominator data - Office for National Statistics.
Comments on denominator data - Ideally, the denominator should include only patients in the community with
asthma or diabetes. In the absence of routine data on such patients, the total resident population is used as a
denominator.
Statistical Methods:
The indicator is indirectly standardised by age and sex. The person-based rate is standardised by age and sex
using England age and sex rates as standards. The gender-specific rates are standardised by age using personbased standards, in order to highlight differences across gender. Indirect standardisation involves the calculation
of the ratio of an organisation’s observed number of events and the number of events that would be expected if it
had experienced the same event rates as those of patients in England, given the mix of age and sex of its patients.
This standardised ratio is then converted into a rate by multiplying it by the overall event rate of patients in
England.
94
The percentage change in admission rate from a previous year, plus the statistical significance of this change,
have also been calculated. A positive percentage represents improvement and a negative percentage represents
deterioration.
Annex 3 ‘Explanation of statistical methods’ (Methods section of the Clinical and Health Outcomes Knowledge
Base www.nchod.nhs.uk ) describes the methods used for indirect standardisation, calculation of improvement,
estimation of confidence intervals, and banding of significance of improvement.
Interpretation of indicator:
Type of indicator - This is a condition-specific, cross-sectional annual comparative indicator, acting as a proxy for
outcome. In the absence of an absolute standard, comparative data are useful for monitoring in relation to rates
achieved in comparable organisations.
Quality of Indicator – Annex 12 (Methods section of the Clinical and Health Outcomes Knowledge Base
www.nchod.nhs.uk ) describes the criteria that should be used to judge the quality of this indicator. The application
of the criteria is dependent on the context (e.g. describing a single organisation, comparing several organisations)
and the level (e.g. national / regional with large numbers of events, local with small numbers of events) at which
the data are to be used.
Confidence Intervals - Some of the values and factors influencing the indicator may be chance occurrences, with
values fluctuating at random between organisations and from year to year. Numbers of admissions may be small
at Primary Care Organisation and Local Authority level. The results should therefore be interpreted with caution
and with the aid of confidence intervals. The 95% confidence interval provides a measure of the statistical
precision of the rate for an area or institution. It indicates a range which, with 95% confidence, will contain the
underlying value of the indicator. If the confidence interval for an area’s rate does not contain the overall national
rate, the difference between the two rates is considered statistically significant. If the confidence interval overlaps
the national rate, in most cases the difference between the rates would not be considered statistically significant.
95% and 99.8% confidence intervals have been calculated.
Effect of case-mix/severity - A number of factors outside the control of hospitals, such as the socio-economic mix
of local populations and events prior to hospitalisation, may determine whether a patient gets admitted or not and
may influence rates. Differences in case-mix (beyond that accounted for by standardisation), comorbidities and
other potential risk factors also contribute to the variation. Current data do not allow assignment of severity of
illness across continuous inpatient spells, nor do they allow adjustment for any of these factors. We have tried to
deal with this constraint partially by presenting the data in clusters that are similar with respect to organisation
type. Gender-specific data standardised to person rates are available.
Other potential confounding factors - There may be variation in the prevalence of diabetes between residents of
different organisations. In particular, it is known that Type 2 diabetes is up to six times more common in people of
South Asian descent and up to three times more common amongst those of African and Afro-Caribbean origin.
Despite this, the indicator is still of value, as many of these are potentially preventable admissions, irrespective of
the prevalence of diabetes. The patterns of providing care may vary between organisations in terms of: extent of
treatment in primary care settings; referral policies and practices; accessibility of accident and emergency facilities;
hospital outpatient facilities / walk-in clinics; and hospital inpatient admission policies and practices.
Potential value of indicator:
To stimulate discussion and encourage local investigation, and to lead to improvement in data quality and quality
of care.
Potential for follow-up action leading to change:
Studies to assess the extent to which admissions were potentially avoidable are recommended.
Relevant national initiatives:
This indicator was part of the NHS Performance Indicators published by the Department of Health up to 2002. The
Diabetes National Service Framework and its subsequent Delivery Strategy set out the first ever set of national
standards for the treatment of diabetes in order to raise the quality of NHS services and reduce unacceptable
variations between them. In addition, although the National Service Framework for long-term conditions focuses
on people with neurological conditions, much of the guidance it offers can apply to anyone living with a long term
condition.
Further reading:
1.
2.
NHS Executive. Clinical Effectiveness Indicators – A Consultation Document. London: Department of Health,
1998.
Department of Health. NHS Performance Indicators. London: Department of Health, 2002.
95
3.
4.
5.
6.
Department of Health. National service framework for diabetes: standards. London: Department of Health,
2001.
Department of Health. Improving Diabetes Services – The NSF Two Years On. London: Department of
Health, 2005.
Department of Health. National Service Framework for Long-term Conditions. London: Department of Health,
2005.
Lakhani A, Coles J, Eayres D, Spence C, Rachet B. Creative use of existing clinical and health outcomes data
to assess NHS performance in England: Part 1—performance indicators closely linked to clinical care. BMJ
2005;330: 1426-31.
Updated: July 2009
96
Emergency readmissions to hospital within 28 days of discharge
Purpose:
To help monitor National Health Service (NHS) success in avoiding (or reducing to a minimum) readmission
following discharge from hospital, when readmission was not part of the originally planned treatment. Previous
analyses have shown wide variation between similar NHS organisations in emergency readmission rates. Not all
emergency readmissions are likely to be part of the originally planned treatment and some may be potentially
avoidable. The NHS may be helped to prevent potentially avoidable readmissions by seeing comparative figures
and learning lessons from organisations with low readmission rates.
Definition of indicator and its variants:
Percentage of emergency admission to any hospital in England occurring within 28 days of the last, previous
discharge from hospital after admission.
Statistic
Sex
Age
group
Organisation
Period
(see glossary)
Indirectly age,
sex, method of
admission of
discharge spell,
diagnosis within
medical
specialties,
procedure
within surgical
specialties
standardised
percent
(standardised to
2004/05)
P
F
M
0-15
years
Indirectly age,
sex, method of
admission of
discharge spell,
diagnosis within
medical
specialties,
procedure
within surgical
specialties
standardised
percent
(standardised to
2004/05)
P
F
M
16-74
years
Indirectly age,
sex, method of
admission of
discharge spell,
diagnosis within
medical
specialties,
procedure
within surgical
specialties
standardised
percent
(standardised to
2004/05)
P
F
M
75+
years
Current
data
FY
2008/09
E; GOR; ONS
area (boundaries
as at November
2006); SHA
(boundaries as at
July 2006);
County; LA
(boundaries as at
April 2009); PCO
(boundaries as at
October 2006);
NHS provider
Trusts (as during
financial year);
provider clusters;
deprivation group
(5, 7 bands)
E; GOR; ONS
area (boundaries
as at November
2006); SHA
(boundaries as at
July 2006);
County; LA
(boundaries as at
April 2009); PCO
(boundaries as at
October 2006);
NHS provider
Trusts (as during
financial year);
provider clusters;
deprivation group
(5, 7 bands)
E; GOR; ONS
area (boundaries
as at November
2006); SHA
(boundaries as at
July 2006);
County; LA
(boundaries as at
April 2009); PCO
(boundaries as at
October 2006);
NHS provider
Trusts (as during
financial year);
provider clusters;
97
File_worksheet Name
Trend data
FY 1999/00,
FY 2000/01,
FY 2001/02,
FY 2002/03,
FY 2003/04,
FY 2004/05,
FY 2005/06,
FY 2006/07,
FY 2007/08
03N_523ISP4EP_09_V1
03N_523ISP4EF_09_V1
03N_523ISP4EM_09_V1
FY
2008/09
FY 1999/00,
FY 2000/01,
FY 2001/02,
FY 2002/03,
FY 2003/04,
FY 2004/05,
FY 2005/06,
FY 2006/07,
FY 2007/08
03N_523ISP4AP_09_V1
03N_523ISP4AF_09_V1
03N_523ISP4AM_09_V1
FY
2008/09
FY 1999/00,
FY 2000/01,
FY 2001/02,
FY 2002/03,
FY 2003/04,
FY 2004/05,
FY 2005/06,
FY 2006/07,
FY 2007/08
03N_523ISP4DP_09_V1
03N_523ISP4DF_09_V1
03N_523ISP4DM_09_V1
Indirectly age,
sex, method of
admission of
discharge spell,
diagnosis within
medical
specialties,
procedure
within surgical
specialties
standardised
percent
(standardised to
2004/05)
P
F
M
16+
years
deprivation group
(5, 7 bands)
E; GOR; ONS
area (boundaries
as at November
2006); SHA
(boundaries as at
July 2006);
County; LA
(boundaries as at
April 2009); PCO
(boundaries as at
October 2006);
NHS provider
Trusts (as during
financial year);
provider clusters;
deprivation group
(5, 7 bands)
FY
2008/09
FY 1999/00,
FY 2000/01,
FY 2001/02,
FY 2002/03,
FY 2003/04,
FY 2004/05,
FY 2005/06,
FY 2006/07,
FY 2007/08
03N_523ISP4ADP_09_V1
03N_523ISP4ADF_09_V1
03N_523ISP4ADM_09_V1
Numerator:
Numerator data - The number of finished and unfinished continuous inpatient (CIP) spells that are emergency
admissions within 0-27 days (inclusive) of the last, previous discharge from hospital (see denominator), including
those where the patient dies, but excluding the following: those with a main specialty upon readmission coded
under obstetric or mental health specialties; and those where the readmitting spell has a diagnosis of cancer
(other than benign or in situ) or chemotherapy for cancer coded anywhere in the spell.
The date of the last, previous discharge from hospital, and the date and method of admission from the following
CIP spell, are used to determine the interval between discharge and emergency readmission.
The numerator is based on a pair of spells, the discharge spell and the next subsequent readmission spell (this
spell must meet the numerator criteria). The selection process thus carries over the characteristics of the
denominator for the discharge spell and applies additional ones to the readmission spell.
The following fields and values are used for the numerator.
The numerator is the number of denominator CIP spells where:
Diagnosis of cancer is not coded in any position in the readmission spell;
AND the first episode in readmission CIP spell ADMIDATE minus last episode in admission CIP
spell DISDATE < 27 days inclusive (discharge date and admission date, includes negatives);
AND the first episode in the readmission CIP spell has:
ADMIMETH = 21, 22, 23, 24 or 28 (admission method);
AND DIAG_01 does not begin with ‘O’ (primary diagnosis)
AND MAINSPEF not 700-715, 501, 560, 610 (main specialty).
Fields used from the first episode in a spell where there is a valid organisation of residence code include:
SPELLRESPCTC, SPELLRESLADSTC, SPELLRESSTHAC. Other organisational levels (E, GOR,
ONS Areas, Counties) are aggregates of the SPELLRESLADST field.
Fields used from the last episode in a spell include:
PROCODETC (provider code, unmapped). Provider clusters are aggregates of the PROCODETC
field.
Counts are by:
age / sex / method of admission of discharge spell / diagnosis (ICD 10 chapter / selected subchapters within medical specialties) and procedure (OPCS 4 chapter / selected sub-chapters within
surgical specialties) / organisation of residence in CIP spell (values for England are aggregates of
these)
where:
age bands for the respective age specific indicators are :<1, 1-4, 5-9, 10-15,
16-64, 65-74, 75-84, 85+; 16-64, 65-74, 75-84, 85+;
sex is 1, 2 (male and female);
admission method is elective or non-elective;
diagnosis (within medical specialties);
procedure (within surgical specialties).
Source of numerator data - Hospital Episode Statistics (HES) for CIP spells intersecting the respective financial
year, plus those up to 28 days in the next financial year, England, The NHS Information Centre for health and
social care.
98
Comments on numerator data - Individual finished consultant episodes are linked to other episodes where all are
part of one continuous spell of care for a patient (see CIP spell construction sections in Annex 4 (Methods section
of the Clinical and Health Outcomes Knowledge Base www.nchod.nhs.uk ) for details). A spell may contain HES
data from another year only when one of its episodes spans years. For example, a spell which finished during April
may contain admission information from an episode which started during the previous March.
The numerator (readmissions) consists of CIP spells (see denominator) that include both finished and unfinished
(i.e. finished episodes from following years) episodes i.e. readmissions can be finished and unfinished CIP spells.
Where there is more than one readmission within 28 days, each readmission is counted once, in relation to the
previous discharge.
Readmissions that end in death are included in the numerator.
Patients within the mental health and maternity specialties as well as those with a diagnosis of cancer have been
excluded because in these cases emergency readmission is often considered a necessary part of care.
Spells are attributed to the organisation of residence, based on the numerator.
The indicator includes discharges occurring after transfer to another Trust. Discharges are counted to the first
valid organisation coded in the spell for residence based aggregates, and to the discharging trust for trust based
aggregates.
There is variation in the completeness of hospital records and quality of coding (see Data Quality sections in
Annex 4 (Methods section of the Clinical and Health Outcomes Knowledge Base www.nchod.nhs.uk ) for details).
Denominator:
Denominator data - The number of finished CIP spells within selected medical and surgical specialties, with a
st
discharge date up to March 31 within the year of analysis. Day cases, spells with a discharge coded as death,
maternity spells (based on specialty, episode type, diagnosis), and those with mention of a diagnosis of cancer or
chemotherapy for cancer anywhere in the spell are excluded. Patients with mention of a diagnosis of cancer or
chemotherapy for cancer anywhere in the 365 days prior to admission are excluded. Mental health specialties are
also excluded.
The following fields and values are used for the denominator.
The first episode in the CIP spell has:
ADMIMETH = 11, 12, 13, 21, 22, 23, 24, 28, 31, 32, 81, 82, 83, 84 or 89 (admission method);
AND EPITYPE = 1 (episode type);
AND CLASSPAT = 1 (patient classification);
AND AGE = 0-15 or 7001-7007 (Ind.4E), 16-74 (Ind.4A), 75+ (Ind.4D);
AND DOB not 01/01/1900 or 01/01/1901 (date of birth);
AND SEX = 1 or 2 (sex);
AND EPIORDER = 1 (episode order);
AND EPISTART is valid (episode start date);
AND DIAG_01 does not begin with ‘O’ (primary diagnosis).
AND the last episode in the CIP spell has:
DISDATE is valid and < 04/03/YYYY+1 (discharge date);
AND EPITYPE = 1 (episode type);
AND MAINSPEF not 700-715, 501, 560, 610 (main specialty);
AND DISMETH = 1, 2 or 3 (discharge method).
Spells with any mention of a diagnosis of cancer (ICD-10 codes C00-C97, D37-D48) or chemotherapy for
cancer (ICD-10 code Z51.1) are also excluded from the denominator, as are patients with mention of a
diagnosis of cancer or chemotherapy for cancer anywhere in the 365 days prior to admission.
Additionally, the following exclusions are applied (main specialty, first valid procedure and primary
diagnosis):
AND (episode where the first valid procedure took place MAINSPEF = 100, 101, 110, 120, 130,
140, 141, 142, 143, 150, 160, 170, 180 or 502 AND first valid procedure is not NULL)
OR (first episode in CIP spell MAINSPEF = 100, 101, 110, 120, 130, 140, 141, 142, 143, 150, 160,
170, 180 or 502
OR (first episode in CIP spell MAINSPEF = 190, 191, 300, 301, 302, 303, 304, 305, 310, 311, 312,
313, 314, 315, 320, 330, 340, 350, 360, 361, 370, 371, 400, 401, 410, 420, 421, 430, 450, 460,
800, 810 or 823 and first episode in CIP spell DIAG_01 is not NULL)).
There is an additional 3 step piece of logic which is designed to ensure that the spells are allocated to the
most appropriate group for standardisation:
99
Step A) Look for spells where there is a valid procedure and surgical specialty (taken from the
episode where the procedure was found).
Step B) Excluding spells selected in step A, select spells where main specialty in the first episode
is surgical, these spells are standardised under the ‘no procedures’ basket.
Step C) Excluding those spells selected in step A and step B, select spells where main specialty of
the first episode is medical.
Those spells selected in A) are standardised by procedure subgroup. Note that procedures beginning with
‘Y’ or ‘Z’ are standardised in the ‘no procedure’ basket. Those spells selected in C) are standardised by
diagnosis subgroup.
Lists of specialties and sub-groups used for filtering/standardisation:
Specialties:
Medical Specialties: '190', '191', '300', '301', '302', '303', '304',’305’, '310', '311', '312', '313', '314',
'315', '320', '330', '340', '350', '360', '361', '370', '371', '400', '401', '410', '420', '421', '430', '450',
'460', '800', '810', '823’.
Surgical Specialties: '100', '101', '110', '120', '130', '140', '141', '142', '143', '150', '160', '170', '180',
'502'
Details of the diagnosis / procedure groups and subgroups can be found on separate tabs within the output
file for each indicator (see the table on page 1 of this specification for file names).
Fields used from the first episode in a spell where there is a valid organisation of residence code include:
SPELLRESPCTC, SPELLRESLADSTC., SPELLRESSTHAC. Other organisational levels (E, GOR,
ONS Areas, Counties) are aggregates of the SPELLRESLADSTC field.
Fields used from the last episode in a spell include:
PROCODETC (provider code, unmapped). Provider clusters are aggregates of the PROCODETC
field.
Counts are by:
age / sex / method of admission of discharge spell / diagnosis (ICD 10 chapter / selected subchapters within medical specialties) and procedure (OPCS 4 chapter / selected sub-chapters within
surgical specialties) / organisation of residence in CIP spell (values for England are aggregates of
these)
where:
age bands for the respective age specific indicators are: <1, 1-4, 5-9, 10-15,16-64, 65-74, 75-84,
85+; 16-64, 65-74, 75-84, 85+;
sex is 1, 2 (male and female);
admission method is elective or non-elective;
diagnosis (within medical specialties).
Source of denominator data - Hospital Episode Statistics (HES) for CIP spells intersecting the respective financial
year, England, The NHS Information Centre for health and social care.
Comments on denominator data - There is variation in the completeness of hospital records and quality of coding
(see Data Quality sections in Annex 4 (Methods section of the Clinical and Health Outcomes Knowledge Base
www.nchod.nhs.uk ) for details). Quality of coding shows the proportion of diagnoses not coded. There may also
be variation between hospitals in the way that they code diagnoses to the fourteen diagnosis fields in each
episode, particularly primary diagnosis. For instance, they may code in the order in which the diagnoses were
made, or according to their perceived importance or complexity. This may affect the group/subgroup within which
a particular spell is selected for standardisation in this indicator. Similarly, there may be variation in which
procedure is coded to the first position.
The denominator consists of CIP spells that cover all continuous, consultant episodes for the same patient,
including those following a transfer to another hospital. Denominator CIP spells must start with an admission
episode and finish with a (live) discharge episode in the year of analysis.
CIP spells with a discharge code of death are excluded from the denominator because readmission is not
possible.
Statistical Methods:
The indicator is indirectly standardised by age, sex, method of admission and diagnosis / procedure. The personbased rate is standardised by using England age, sex, method of admission and diagnosis / procedure rates as
standards. We defined the diagnosis and procedure groups for standardisation at ICD 10 / OPCS 4 coding
chapter, sub-chapter or 3 digit level where the readmission rate was significantly different from that of the next
higher level in two consecutive financial years and there were at least 50 discharges in each year. The gender
specific rates are standardised using person based standards, in order to highlight differences across gender.
Indirect standardisation involves the calculation of the ratio of an organisation’s observed number of events and
100
the number of events that would be expected if it had experienced the same event rates as those of patients in
England, given the mix of age, sex, method of admission and diagnosis / procedure of its patients. This
standardised ratio is then converted into a rate by multiplying it by the overall event rate of patients in England.
The percentage change in rates from a previous year, plus the statistical significance of this change, have also
been calculated. A positive percentage represents improvement and a negative percentage represents
deterioration.
Annex 3 ‘Explanation of statistical methods’ (Methods section of the Clinical and Health Outcomes Knowledge
Base www.nchod.nhs.uk ) describes the methods used for indirect standardisation, calculation of improvement,
estimation of confidence intervals, and banding of significance of improvement.
Interpretation of indicator:
Type of indicator - This is a generic, cross-sectional annual comparative indicator of outcome. In the absence of
an absolute standard, comparative data are useful for monitoring in relation to rates achieved in comparable
organisations.
Quality of Indicator - Annex 12 (Methods section of the Clinical and Health Outcomes Knowledge Base
www.nchod.nhs.uk ) describes the criteria that should be used to judge the quality of this indicator. The application
of the criteria is dependent on the context (e.g. describing a single organisation, comparing several organisations)
and the level (e.g. national / regional with large numbers of events, local with small numbers of events) at which
the data are to be used.
Confidence Intervals - Some of the values and factors influencing the indicator may be chance occurrences, with
values fluctuating at random between organisations and from year to year. Numbers of admissions may be small
at Primary Care Organisation, Local Authority and provider Trust level. The results should therefore be interpreted
with caution and with the aid of confidence intervals. The 95% confidence interval provides a measure of the
statistical precision of the rate for an area or institution. It indicates a range which, with 95% confidence, will
contain the underlying value of the indicator. If the confidence interval for an area’s rate does not contain the
overall national rate, the difference between the two rates is considered statistically significant. If the confidence
interval overlaps the national rate, in most cases the difference between the rates would not be considered
statistically significant. 95% and 99.8% confidence intervals have been calculated.
Effect of case-mix/severity - A number of factors outside the control of hospitals, such as the socio-economic mix
of local populations and events prior to hospitalisation, may contribute to the variation shown by the indicators.
Differences in case-mix, severity of illness, comorbidities and other potential risk factors also contribute to the
variation. The data available do not allow adjustment for any of these factors. This may pose less of a constraint
at geographical organisation level than at hospital level. We have tried to deal with this constraint by presenting
the data in clusters that are similar with respect to institution or organisation type. An attempt has also been made
to take into account differences between organisations in the mix of diagnoses within medical specialties and
procedures within surgical specialties. No attempt has been made to assess whether the readmission was linked
to the discharge in terms of diagnosis. A patient discharged after an operation may be readmitted into a
community hospital with a wound or chest infection. There are many different possibilities and over-specifying may
lead to readmissions being missed. Gender-specific data standardised to person rates are available. Analyses at
England level by the Index of Multiple Deprivation are presented.
Other potential confounding factors - A continuous inpatient spell may include transfers to other hospitals, e.g. for
rehabilitation. The patterns of providing care may vary between NHS hospital trusts in terms of whether patients
are transferred elsewhere before final discharge. Planned transfers, for example for rehabilitation, may affect
discharge destination figures and readmission rates.
Variation between hospitals in average length of stay may lead to variation between hospitals in the proportion of
complications occurring in hospital, as opposed to in the community after discharge from hospital. Readmissions
may reflect self-discharge against medical advice, and levels of primary care and community resources available
to manage care outside hospital. Readmissions may not be linked clinically to the previous spell and may be
appropriate for the clinical care of the patient. There may be variation between Trusts in the way emergency
admissions are coded. Routine data do not allow for all of these aspects to be identified and removed from the
indicator, however, this may be done through local audit.
Potential value of indicator:
To stimulate discussion and encourage local investigation, and to lead to improvement in data quality and quality
of care.
Potential for follow-up action leading to change:
Studies to assess the extent to which readmissions were linked to the previous episode, and therefore truly
represent potentially avoidable adverse events, are recommended.
101
Relevant national initiatives:
Variants of this indicator have been used by the Department of Health in the NHS Performance Indicators, and by
the Commission for Health Improvement and the Healthcare Commission in NHS Performance Ratings, in various
combinations between 1999 and 2005.
Further reading:
1. Mason A, Goldacre M, Daly E. Using Readmission Rates as a Health Outcome indicator – a Literature Review.
Report to the Department of Health. Oxford: National Centre for Health Outcomes Development, 2000.
2. Department of Health. NHS Performance Indicators. London: Department of Health, 2002.
3. Healthcare Commission. 2005 performance ratings: July 2005 website
http://ratings2005.healthcarecommission.org.uk/. London: Healthcare Commission, 2005.
Updated: November 2010
102
Years of life lost due to mortality from all causes
Purpose:
Years of life lost (YLL) is a measure of premature mortality. Its primary purpose is to compare the relative
importance of different causes of premature death within a particular population and it can therefore be used by
health planners to define priorities for the prevention of such deaths. It can also be used to compare the premature
mortality experience of different populations for a particular cause of death. The concept of years of life lost is to
estimate the length of time a person would have lived had they not died prematurely. By inherently including the
age at which the death occurs, rather than just the fact of its occurrence, the calculation is an attempt to better
quantify the burden, or impact, on society from the specified cause of mortality.
Definition of indicator and its variants:
Years of life lost due to mortality from all causes (ICD-10 A00-Y99).
Statistic
Crude rate per 10,000
population and number of
years of life lost
Directly age-standardised rate
per 10,000 population and
number of deaths
Sex
Age group
MFP <75
MFP <75
Organisation
(see glossary)
Current
data
Trend
data
File-worksheet name
E&W, E, GOR,
ONS area, SHA,
LA, PCO, CTY
E&W, E, GOR,
ONS area, SHA,
LA, PCO, CTY
2006-08
03O_070CR_08_V1
2006-08
03O_070DR_08_V1
Numerator:
Numerator data – Years of life lost and deaths from all causes classified by underlying cause of death (ICD-10
A00-Y99), registered in the respective calendar year(s).
Source of numerator data – Office for National Statistics (ONS).
Comments on numerator data – The number of years of life lost is calculated by summing over ages 1 to 74 years
the number of deaths at each age multiplied by the number of years of life remaining up to age 75 years. Infant
deaths are omitted as they are mostly a result of causes specific to this age group and have different aetiologies to
deaths later in life.
The numerator presented alongside the sdirecgtly age-tandardised years of life lost rate is the number of deaths
rather than the number of years of life lost. This is because the standardisation calculation has been performed
using 5-year age bands. In each age band the number of deaths is weighted by the number of years of life
remaining from the mid-point of the age band up to age 75 years. See annex 3 for more details.
Mortality data for years 1993-2006 were extracted by ONS in June 2007 with organisational codes assigned using
the postcode of usual residence and the November 2006 edition of the National Statistics Postcode Directory
(NSPD). Data for subsequent years were extracted in June of the following year using the respective year’s
November edition of the NSPD.
In January 2001, the ONS implemented a change from ICD-9 to ICD-10 for coding causes of death in England &
Wales. As part of an exercise to investigate the effects of this change, the ONS also re-coded all deaths registered
in 1999. Deaths for years prior to 1999 and for year 2000 have not been re-coded.
For current analysis, therefore, all data are based on ICD-10.
From the 2003 Compendium onwards, data are based on the original causes of death rather than the final causes
used in earlier Compendia.
See Annex 2 for more details.
Denominator:
Denominator data - 2001 Census based mid-year population estimates for the respective calendar years.
Source of denominator data - ONS.
Comments on denominator data - Data are based on the latest revisions of ONS mid-year population estimates for
the respective years, current as at 1 October 2009.
103
Statistical methods:
Annex 2: Changes to Office for National Statistics mortality data
Annex 3: Explanations of statistical methods used in the Compendium
Annex 5: European Standard Population
Interpretation of indicators:
Quality of indicator - Annex 12 describes the criteria that should be used to judge the quality of this indicator. The
application of the criteria is dependent on the context (e.g. describing a single organisation, comparing several
organisations) and the level (e.g. national / regional with large numbers of events, local with small numbers of
events) at which the data are to be used.
Further reading:
1.
2.
Office for National Statistics. Twentieth Century Mortality Trends in England and Wales. Office for National
Statistics Health Statistics Quarterly, No. 18, 2003: 5-17. Available at:
http://www.statistics.gov.uk/downloads/theme_health/HSQ18_revised_21Aug03.pdf
Brock A, Griffiths C. Trends in the mortality of young adults aged 15-44 in England and Wales, 1961-2001.
Office for National Statistics Health Statistics Quarterly, No. 19, 2003: 22-31. Available at:
http://www.statistics.gov.uk/downloads/theme_health/HSQ19.pdf
Updated: December 2009
104
Deaths at home from all causes
Purpose:
To improve palliative care and service planning for patients in the terminal stages of life, allowing more of them the
choice of dying at home.
Definition of indicator and its variants:
The proportion of deaths from all causes (ICD-10 A00-Y99) that occur at home.
Statistic
Sex
Age group
Percent of deaths at home and
number of deaths at home
MFP All ages
Indirectly age-standardised
deaths at home rate per 100
deaths and number of deaths
at home
MFP All ages
Organisation
(see glossary)
Current
data
E&W, E, GOR, ONS 2006-08
area, SHA, LA,
PCO, CTY
E&W, E, GOR, ONS 2006-08
area, SHA, LA,
PCO, CTY
Trend
data
File-worksheet name
03P_200PC_08_V1
03P_200ISR_08_V1
Numerator:
Numerator data - Deaths at home from all causes, classified by underlying cause of death (ICD-10 A00-Y99),
registered in the respective calendar year(s).
Source of numerator data - Office for National Statistics (ONS).
Comments on numerator data – Mortality data for years 1993-2006 were extracted by ONS in June 2007 with
organisational codes assigned using the postcode of usual residence and the November 2006 edition of the
National Statistics Postcode Directory (NSPD). Data for subsequent years were extracted in June of the following
year using the respective year’s November edition of the NSPD.
Information about the place of death is found on the mortality record in the communal establishment field. It
contains one of:
•
•
•
a 5 digit code identifying a communal establishment or institution (e.g. hospital, nursing home, residential
home);
an “H” code which indicates that the person is certified as having died at their home address and that this
is not a communal establishment or;
an “E” code which indicates that the person died elsewhere.
The communal establishments are themselves classified into 84 categories (e.g. general hospital, mental nursing
home, nursing home etc) and can be further distinguished by whether they are an NHS or Non-NHS
establishment.
It is currently ONS practice to include nursing homes with hospitals under a broader group - “Other hospitals and
communal establishments for the care of the sick” - and also to include residential homes under “Other communal
establishments”. This is because of concerns highlighted by the ONS regarding the accuracy of the recorded
status of some communal establishments, particularly nursing homes and residential homes.
It is therefore not possible to include nursing home or residential home deaths as a “home” death. For this
indicator, a “home” death is defined as one that has the ”H” code in the communal establishment field, i.e. where
the death has occurred at the home address and that address is not of a communal establishment.
Denominator:
Denominator data - All deaths from all causes, classified by underlying cause of death (ICD-10 A00-Y99),
registered in the respective calendar year(s).
Source of denominator data - ONS.
Comments on denominator data - Includes deaths in all categories of communal establishment code, i.e. deaths in
all communal establishments, at home, and elsewhere.
From the 2003 Compendium onwards, data are based on the original causes of death rather than the final causes
used in earlier Compendia. See Annex 2 for more details.
105
Statistical methods:
The age-standardised deaths at home rate utilises the indirect method of standardisation. The direct method was
found not to be robust as it was affected by small numerator and denominator counts in specific age groups.
Indirect standardisation requires the computation of the ratio of an area’s observed number of events to its
expected number of events if it had experienced the standard age-specific rates. This age-standardised ratio can
be converted into a rate by multiplying it by the crude rate of the standard population.
The standard rates used are those of England for the respective calendar year(s). Male and female rates have
been standardised separately. The rate for persons is standardised for both age and sex.
This methodology is similar to that used for the Clinical Indicators and is described in detail in:
Annex 3: Explanations of statistical methods used in the Compendium (under the sections entitled “Indirectly
Standardised Rates For Clinical Indicators” and “Confidence Intervals Of Indirectly Standardised Rates For Clinical
Indicators”).
Interpretation of indicators:
Type of Indicator - This is a generic cross-sectional comparative indicator reflecting events which act as a proxy for
outcome (quality of dying). In the absence of an absolute standard, comparative data are useful for monitoring in
relation to rates achieved in comparable areas.
Quality of indicator - Annex 12 describes the criteria that should be used to judge the quality of this indicator. The
application of the criteria is dependent on the context (e.g. describing a single organisation, comparing several
organisations) and the level (e.g. national / regional with large numbers of events, local with small numbers of
events) at which the data are to be used.
Confidence Intervals - 95%. Some of the values and factors influencing them may be chance occurrences, with
values fluctuating at random between organisations and from year to year. Numbers of deaths may be small at
individual organisational level. The results should therefore be interpreted with caution and with the aid of
confidence intervals. The 95% confidence interval provides a measure of the statistical precision of the rate for an
area or institution. It indicates a range which, with 95% probability, will contain the underlying value of the
indicator. If the confidence interval for an organisation’s rate is outside the range of the national confidence
intervals, the difference between the two rates is considered statistically significant. If the confidence intervals for
two rates overlap, in most cases the difference between the rates would not be considered statistically significant.
Effect of Case-Mix / severity – The specific cause of death, its acuteness of onset and its need for hospital care
have implications for those who wish to die at home being able to do so. Variations in the proportion of deaths at
home may be due to differences in the pattern of acute vs chronic deaths rather than differences in access to
appropriate care The data available do not allow adjustment for these factors.
Other Potential Confounding Factors - A number of factors outside the control of the NHS such as personal
choice, availability of hospices, and family/community support may contribute to the variation shown by the
indicator.
Relevant National initiatives:
1.
2.
3.
4.
Department of Health. End of life care strategy : Promoting high quality care for all adults at the end of life.
London: Department of Health , 2008.
http://www.dh.gov.uk/en/Publicationsandstatistics/Publications/PublicationsPolicyAndGuidance/DH_086277
Department of Health. The NHS cancer plan and the new NHS: Providing a patient-centred service. London:
Department of Health, 2004.
Department of Health. Pioneering Schemes Named Best of the Best. NHS Beacons – Part of a Concerted
Campaign to Improve Cancer Services. Department of Health, 1999. Press release: reference 1999/0375
Commission for Health Improvement. NHS Cancer Care in England and Wales. National Service Framework
Assessments No.1. London: Commission for Health Improvement, 2001.
Further reading:
1.
2.
3.
Higginson I.J, Thompson M. Children and young people who die from cancer: epidemiology and place of
death in England (1995-9). British Medical Journal 2003; 327: 478-479.
Grande GE, Todd CJ, Barclay SIG, Farquhar MC. Does hospital at home for palliative care facilitate death at
home? Randomised controlled trial. British Medical Journal 1999; 319: 1472-1475.
Higginson I.J, Jarman B, Astin P, Dolan S. Do social factors affect where patients die: an analysis of 10 years
of cancer deaths in England. Journal of Public Health Medicine 1999; 21(1): 23-28.
106
Updated: December 2009
107
Vaccination for measles, mumps and rubella
Purpose:
To help reduce the incidence of measles, mumps and rubella by increasing vaccination uptake.
Definition of indicator and its variants:
Proportion of children reaching their second birthday who were vaccinated against measles, mumps and rubella.
Statistic
Percent
Sex
P
Age group
<2, <5
Organisation
(see glossary)
Current
data
E, GOR, SHA, PCO
FY
2008/09
Trend
data
File-worksheet name
04A_080PCP1_09_V1
04A_080PCP2_09_V1
Numerator:
Numerator data - Children vaccinated against measles, mumps and rubella (by their second and fifth birthdays) in
the respective financial year.
Source of numerator data - The NHS Information Centre for health and social care (IC).
Comments on numerator data - None.
Denominator:
Denominator data - Total number of children reaching their second and fifth birthdays in the respective financial
year.
Source of denominator data - The NHS Information Centre for health and social care (IC).
Comments on denominator data - None.
Interpretation of indicators:
Quality of indicator - Annex 12 describes the criteria that should be used to judge the quality of this indicator. The
application of the criteria is dependent on the context (e.g. describing a single organisation, comparing several
organisations) and the level (e.g. national / regional with large numbers of events, local with small numbers of
events) at which the data are to be used.
Further reading:
1.
2.
3.
4.
5.
6.
7.
8.
NHS Immunisation Statistics, England: 2008-09. Bulletin. The Information Centre, 2009. Available at:
http://www.ic.nhs.uk/webfiles/publications/immunisationstats0809/NHS_Immunisation_Statistics_England_20
08_09_Bulletin.pdf
NHS Immunisation Statistics, England: 2007-08. Bulletin. The Information Centre, 2008. Available at:
http://www.ic.nhs.uk/webfiles/publications/immunisation2007to2008/Final%20200708%20Imms%20Bulletin%20%28amended%29.pdf
NHS Immunisation Statistics, England: 2006-07. Bulletin. The Information Centre, 2007. Available at:
http://www.ic.nhs.uk/webfiles/publications/immstats2005to2006/Final%20200607%20Immunisation%20Bulletin%20%28with%20copyright%29.pdf
NHS Immunisation Statistics, England: 2005-06. Bulletin 2006/17/HSCIC. The Information Centre, 2006.
Available at:
http://www.ic.nhs.uk/webfiles/publications/immstats2005to2006/ImmunisationStatistics280906_PDF.pdf
NHS Immunisation Statistics, England: 2004-05. Bulletin 2005/05/HSCIC. London: Health and Social Care
Information Centre, 2005. Available at: http://www.dh.gov.uk/assetRoot/04/11/96/50/04119650.pdf
Government Statistical Service. NHS Immunisation Statistics, England: 2003-04. Bulletin 2004/16. London:
Government Statistical Service, 2004. Available at:
http://www.dh.gov.uk/assetRoot/04/09/95/77/04099577.pdf
Government Statistical Service. NHS Immunisation Statistics, England: 2002-03. Bulletin 2003/16. London:
Government Statistical Service, 2003. Available at:
http://www.dh.gov.uk/assetRoot/04/08/10/09/04081009.pdf
Government Statistical Service. NHS Immunisation Statistics, England: 2001-02. Bulletin 2002/18. London:
Government Statistical Service, 2002. Available at:
http://www.dh.gov.uk/assetRoot/04/02/31/98/04023198.pdf
Updated: March 2010
108
Vaccination for whooping cough
Purpose:
To help reduce the incidence of whooping cough by increasing vaccination uptake.
Definition of indicator and its variants:
Proportion of children reaching their first and fifths birthdays who were vaccinated against whooping cough.
Statistic
Percent
Sex
P
Age group
<1, <5
Organisation
(see glossary)
Current
data
E, GOR, SHA, PCO
FY
2008/09
Trend
data
File-worksheet name
04B_081PCP1_09_V1
04B_081PCP2_09_V1
Numerator:
Numerator data - Children vaccinated against whooping cough (by their first and fifth birthdays) in the respective
financial year.
Source of numerator data - The NHS Information Centre for health and social care (IC).
Comments on numerator data - Whooping cough is no longer administered as a separate vaccination so the
figures provided at 12 month cohort are the diphtheria, tetanus, polio, pertussis and Hib ‘5-in1’ vaccination
(DTaP/IPV/Hib) which includes whooping cough as part of the vaccination.
Denominator:
Denominator data - Total number of children reaching their first and fifth birthdays in the respective financial year.
Source of denominator data - The NHS Information Centre for health and social care (IC).
Comments on denominator data - None.
Interpretation of indicators:
Quality of indicator - Annex 12 describes the criteria that should be used to judge the quality of this indicator. The
application of the criteria is dependent on the context (e.g. describing a single organisation, comparing several
organisations) and the level (e.g. national / regional with large numbers of events, local with small numbers of
events) at which the data are to be used.
Further reading:
1.
2.
3.
4.
5.
6.
7.
8.
NHS Immunisation Statistics, England: 2008-09. Bulletin. The Information Centre, 2009. Available at:
http://www.ic.nhs.uk/webfiles/publications/immunisationstats0809/NHS_Immunisation_Statistics_England_2
008_09_Bulletin.pdf
NHS Immunisation Statistics, England 2007-08. Bulletin. The Information Centre, 2008. Available at:
http://www.ic.nhs.uk/webfiles/publications/immunisation2007to2008/Final%20200708%20Imms%20Bulletin%20%28amended%29.pdf
NHS Immunisation Statistics, England: 2006-07. Bulletin. The Information Centre, 2006. Available at:
http://www.ic.nhs.uk/webfiles/publications/immstats2005to2006/Final%20200607%20Immunisation%20Bulletin%20%28with%20copyright%29.pdf
NHS Immunisation Statistics, England: 2005-06. Bulletin 2006/17/HSCIC. The Information Centre, 2006.
Available at:
http://www.ic.nhs.uk/webfiles/publications/immstats2005to2006/ImmunisationStatistics280906_PDF.pdf
NHS Immunisation Statistics, England: 2004-05. Bulletin 2005/05/HSCIC. London: Health and Social Care
Information Centre, 2005. Available at: http://www.dh.gov.uk/assetRoot/04/11/96/50/04119650.pdf
Government Statistical Service. NHS Immunisation Statistics, England: 2003-04. Bulletin 2004/16. London:
Government Statistical Service, 2004. Available at:
http://www.dh.gov.uk/assetRoot/04/09/95/77/04099577.pdf
Government Statistical Service. NHS Immunisation Statistics, England: 2002-03. Bulletin 2003/16. London:
Government Statistical Service, 2003. Available at:
http://www.dh.gov.uk/assetRoot/04/08/10/09/04081009.pdf
Government Statistical Service. NHS Immunisation Statistics, England: 2001-02. Bulletin 2002/18. London:
Government Statistical Service, 2002. Available at:
http://www.dh.gov.uk/assetRoot/04/02/31/98/04023198.pdf
109
9.
World Health Organization. Pertussis vaccine. Geneva: World Health Organization. Available at:
http://www.who.int/vaccines/en/pertussis.shtml
Updated: March 2010
110
Incidence of measles
Purpose:
To help reduce the incidence of measles.
Definition of indicator and its variants:
Notifications of measles.
Statistic
Sex
Age group
Number of notifications
P
All ages
Directly age-standardised
notification rate per 100,000
and number of notifications
P
<1 and <15
Organisation
(see glossary)
Current
data
E&W, E, GOR, ONS
2008
area, SHA, LA,
PCO, CTY
E&W, E, GOR, ONS 2005-08
area, SHA, LA,
PCO, CTY
Trend
data
File-worksheet name
04C_086NO_08_V1
04C_086DR_08_V1
Numerator:
Numerator data - Notifications of measles in the respective calendar year(s).
Source of numerator data - Health Protection Agency, Communicable Disease Surveillance Centre.
Comments on numerator data - Measles is notifiable under the Public Health Acts and Infectious Disease
Regulations. Detailed statistics and a description of the reporting system are published annually by the Office for
National Statistics (Series MB2).
The epidemic nature of measles results in a variation in incidence from year to year, irrespective of vaccination
levels, until coverage is extremely high. An indicator that shows wide variations on a year to year basis can be
difficult to interpret. As there are marked annual variations in notifications of measles, a four-year average is used
for the notification rates.
Denominator:
Denominator data - 2001 Census based mid-year population estimates for the respective calendar year(s).
Source of denominator data – Office for National Statistics (ONS).
Comments on denominator data - The population figures used are ONS mid-year estimates for 2005-08 derived
from the 2001 Census with allowance for subsequent births, deaths, migration, and ageing of the population.
Statistical methods:
Annex 3: Explanations of statistical methods used in the Compendium
Annex 5: European Standard Population
Interpretation of indicators:
Quality of indicator - Annex 12 describes the criteria that should be used to judge the quality of this indicator. The
application of the criteria is dependent on the context (e.g. describing a single organisation, comparing several
organisations) and the level (e.g. national / regional with large numbers of events, local with small numbers of
events) at which the data are to be used.
Further reading:
1.
2.
3.
Communicable Disease Surveillance Centre. Measles. From: Immunoglobulin Handbook, Chapter 2. London:
Health Protection Agency, 2004: Available at:
http://www.hpa.org.uk/infections/topics_az/immunoglobulin/pdfs/ig_measles.pdf
Health Protection Agency. Guidelines on the management of communicable diseases in schools and
nurseries: London: Health Protection Agency, 2003. Available at:
http://www.hpa.org.uk/infections/topics_az/schools/guideline_info/measles.htm
World Health Organization. Strategic Plan for measles and congenital rubella infection in the European
Regions of World Health Organization. Copenhagen: World Health Organization, 2003. Available at:
http://www.who.dk/document/e81567.pdf
111
4.
Gay N. et al. The epidemiology of measles in England and Wales since the 1994 vaccination campaign.
London: Communicable Disease Review, Communicable Disease Surveillance Centre, 1997.
Updated: December 2009
112
Incidence of whooping cough
Purpose:
To help reduce the incidence of whooping cough.
Definition of indicator and its variants:
Notifications of whooping cough.
Statistic
Sex
Age group
Number of notifications
P
All ages
Directly age-standardised
notification rate per 100,000
and number of notifications
P
<1 and <15
Organisation
(see glossary)
Current
data
E&W, E, GOR, ONS
2008
area, SHA, LA,
PCO, CTY
E&W, E, GOR, ONS 2005-08
area, SHA, LA,
PCO, CTY
Trend
data
File-worksheet name
04D_089NO_08_V1
04D_089DR_08_V1
Numerator:
Numerator data - Notifications of whooping cough in the respective calendar year(s).
Source of numerator data - Health Protection Agency, Communicable Disease Surveillance Centre.
Comments on numerator data - Whooping cough is notifiable under the Public Health Acts and Infectious Disease
Regulations. Detailed statistics and a description of the reporting system are published annually by the Office for
National Statistics (Series MB2).
The epidemic nature of whooping cough results in a variation in incidence from year to year, irrespective of
vaccination levels, until coverage is extremely high. An indicator that shows wide variations on a year to year basis
can be difficult to interpret. As there are marked annual variations in notifications of whooping cough, a four-year
average is used for the notification rates.
Denominator:
Denominator data - 2001 Census based mid-year population estimates for the respective calendar year(s).
Source of denominator data – Office for National Statistics (ONS).
Comments on denominator data - The population figures used are ONS mid-year estimates for 2005-08 derived
from the 2001 Census with allowance for subsequent births, deaths, migration, and ageing of the population.
Statistical methods:
Annex 3: Explanations of statistical methods used in the Compendium
Annex 5: European Standard Population
Interpretation of indicators:
Quality of indicator - Annex 12 describes the criteria that should be used to judge the quality of this indicator. The
application of the criteria is dependent on the context (e.g. describing a single organisation, comparing several
organisations) and the level (e.g. national / regional with large numbers of events, local with small numbers of
events) at which the data are to be used.
Further reading:
1.
2.
Health Protection Agency. Guidelines on the Management of Communicable Diseases: Pertussis (Whooping
Cough). London: Health Protection Agency, 2003. Available at:
http://www.hpa.org.uk/infections/topics_az/schools/guideline_info/pertussis.htm;
Devine MJ, Bellis MA, Tocque SQ. Whooping cough surveillance in the north west of England. Communicable
Disease and Public Health, 1998; 1: 121-5.
Updated: December 2009
113
Incidence of all central nervous system anomalies
Purpose:
To help reduce the incidence of all central nervous system anomalies.
Definition of indicator and its variants:
Notifications of live and still born babies with central nervous system anomalies.
Statistic
Number of notifications and
notification rate per 10,000
total births
Sex
P
Age group
0
Organisation
(see glossary)
E&W, E, GOR
Current
data
2008
2006-08
Trend
data
File-worksheet name
04E_082CRP1_08_V1
04E_082CRP2_08_V1
Numerator:
Numerator data - Notifications of live and still born babies with central nervous system anomalies in the respective
calendar year(s).
Source of numerator data - Office for National Statistics (ONS).
Comments on numerator data - Although the ONS scheme is primarily for monitoring changes in the frequency of
reporting anomalies, it also provides the most extensive data on incidence and prevalence levels available in
England and Wales. However, the major disadvantage of using the monitoring scheme data to measure incidence
and prevalence levels arises from the deficiencies in its coverage, in that the notification scheme is voluntary. In
the period up to January 1990, only anomalies detected within seven days of birth were included, later extended to
ten days. From 1st January 1995, anomalies detected at any age can be reported.
The numerator data relate to the National Congenital Anomaly System (NCAS). ONS receives these data from two
sources: electronically from local congenital anomaly registers for the areas covered by a register, and on paper
SD56 forms directly from NHS Trusts in areas without a local register. It is recocognised that there is underreporting in NCAS, particularly in the areas not covered by a local registers.
In April 2006 several PCTs in East Midlands and Yorkshire and The Humber decided to withold funding from their
local congenital anomaly register, the East Midlands and South Yorkshire Congenital Anomaly Register. Without
funding the register was unable to process or send data to ONS. Figures for England, and England and Wales
exclude data from these areas.
As of 1995, congenital anomalies are coded on the basis of ICD-10. Detailed statistics and a description of the
monitoring scheme are published annually by ONS (Series MB3).
Denominator:
Denominator data - Live and still births occurring in the respective calendar year(s).
Source of denominator data - ONS.
Comments on denominator data - Until October 1992, stillbirths were legally defined as fetal deaths occurring after
28 weeks of gestation. In October 1992 the definition was revised to include fetal deaths occurring after 24 weeks
of gestation. The data presented here are based on the revised definition, and hence are not comparable with data
for years before 1993.
Interpretation of indicators:
Quality of indicator - Annex 12 describes the criteria that should be used to judge the quality of this indicator. The
application of the criteria is dependent on the context (e.g. describing a single organisation, comparing several
organisations) and the level (e.g. national / regional with large numbers of events, local with small numbers of
events) at which the data are to be used.
Further reading:
1. Office for National Statistics. Congenital anomaly notifications 2008. Statistical Bulletin, March 2010. Available
at: http://www.statistics.gov.uk/pdfdir/cong0310.pdf
Updated: August 2010
114
Incidence of anencephalus
Purpose:
To help reduce the incidence of anencephalus.
Definition of indicator and its variants:
Notifications of live and still born babies with anencephalus.
Statistic
Number of notifications and
notification rate per 10,000
total births
Sex
P
Age group
0
Organisation
(see glossary)
E&W
Current
data
2008
2006-08
Trend
data
File-worksheet name
04F_083CRP1_08_V1
04F_083CRP2_08_V1
Numerator:
Numerator data - Notifications of live and still born babies with anencephalus in the respective calendar year(s).
Source of numerator data - Office for National Statistics (ONS).
Comments on numerator data - Although the ONS scheme is primarily for monitoring changes in the frequency of
reporting anomalies, it also provides the most extensive data on incidence and prevalence levels available in
England and Wales. However, the major disadvantage of using the monitoring scheme data to measure incidence
and prevalence levels arises from the deficiencies in its coverage, in that the notification scheme is voluntary. In
the period up to January 1990, only anomalies detected within seven days of birth were included, later extended to
ten days. From 1st January 1995, anomalies detected at any age can be reported.
The numerator data relate to the National Congenital Anomaly System (NCAS). ONS receives these data from two
sources: electronically from local congenital anomaly registers for the areas covered by a register, and on paper
SD56 forms directly from NHS Trusts in areas without a local register. It is recocognised that there is underreporting in NCAS, particularly in the areas not covered by a local registers.
In April 2006 several PCTs in East Midlands and Yorkshire and The Humber decided to withold funding from their
local congenital anomaly register, the East Midlands and South Yorkshire Congenital Anomaly Register. Without
funding the register was unable to process or send data to ONS. Figures for England, and England and Wales
exclude data from these areas.
As of 1995, congenital anomalies are coded on the basis of ICD-10. Detailed statistics and a description of the
monitoring scheme are published annually by ONS (Series MB3).
Denominator:
Denominator data - Live and still births occurring in the respective calendar year(s).
Source of denominator data - ONS.
Comments on denominator data - Until October 1992, stillbirths were legally defined as fetal deaths occurring after
28 weeks of gestation. In October 1992 the definition was revised to include fetal deaths occurring after 24 weeks
of gestation. The data presented here are based on the revised definition, and hence are not comparable with data
for years before 1993.
Interpretation of indicators:
Quality of indicator - Annex 12 describes the criteria that should be used to judge the quality of this indicator. The
application of the criteria is dependent on the context (e.g. describing a single organisation, comparing several
organisations) and the level (e.g. national / regional with large numbers of events, local with small numbers of
events) at which the data are to be used.
Further reading:
1. Office for National Statistics. Congenital anomaly notifications 2008. Statistical Bulletin, March 2010. Available
at: http://www.statistics.gov.uk/pdfdir/cong0310.pdf
Updated: August 2010
115
Incidence of spina bifida
Purpose:
To help reduce the incidence of spina bifida.
Definition of indicator and its variants:
Notifications of live and still born babies with spina bifida.
Statistic
Number of notifications and
notification rate per 10,000
total births
Sex
P
Age group
0
Organisation
(see glossary)
E&W
E&W
Current
data
2008
2006-08
Trend
data
File-worksheet name
04G_087CRP1_08_V1
04G_087CRP2_08_V1
Numerator:
Numerator data - Notifications of live and still born babies with spina bifida in the respective calendar year(s).
Source of numerator data - Office for National Statistics (ONS).
Comments on numerator data - Although the ONS scheme is primarily for monitoring changes in the frequency of
reporting anomalies, it also provides the most extensive data on incidence and prevalence levels available in
England and Wales. However, the major disadvantage of using the monitoring scheme data to measure incidence
and prevalence levels arises from the deficiencies in its coverage, in that the notification scheme is voluntary. In
the period up to January 1990, only anomalies detected within seven days of birth were included, later extended to
ten days. From 1st January 1995, anomalies detected at any age can be reported.
The numerator data relate to the National Congenital Anomaly System (NCAS). ONS receives these data from two
sources: electronically from local congenital anomaly registers for the areas covered by a register, and on paper
SD56 forms directly from NHS Trusts in areas without a local register. It is recocognised that there is underreporting in NCAS, particularly in the areas not covered by a local registers.
In April 2006 several PCTs in East Midlands and Yorkshire and The Humber decided to withold funding from their
local congenital anomaly register, the East Midlands and South Yorkshire Congenital Anomaly Register. Without
funding the register was unable to process or send data to ONS. Figures for England, and England and Wales
exclude data from these areas.
As of 1995, congenital anomalies are coded on the basis of ICD-10. Detailed statistics and a description of the
monitoring scheme are published annually by ONS (Series MB3).
Denominator:
Denominator data - Live and still births in the respective calendar year(s).
Source of denominator data - ONS.
Comments on denominator data - Until October 1992, stillbirths were legally defined as fetal deaths occurring after
28 weeks of gestation. In October 1992 the definition was revised to include fetal deaths occurring after 24 weeks
of gestation. The data presented here are based on the revised definition, and hence are not comparable with data
for years before 1993
Interpretation of indicators:
Quality of indicator - Annex 12 describes the criteria that should be used to judge the quality of this indicator. The
application of the criteria is dependent on the context (e.g. describing a single organisation, comparing several
organisations) and the level (e.g. national / regional with large numbers of events, local with small numbers of
events) at which the data are to be used.
Further reading:
1. Office for National Statistics. Congenital anomaly notifications 2008. Statistical Bulletin, March 2010. Available
at: http://www.statistics.gov.uk/pdfdir/cong0310.pdf
Updated: August 2010
116
Incidence of Down syndrome
Purpose:
To help reduce the incidence of Down syndrome, subject to parental choice.
Definition of indicator and its variants:
Notifications of live and still born babies with Down syndrome.
Statistic
Number of notifications and
notification rate per 10,000
total births: ONS
Number of notifications and
notification rate per 10,000
total births; percent of cases
diagnosed prenatally by
maternal age; and percent of
diagnosed cases in which
pregnancy was terminated by
maternal age: NDSCR
Sex
Age group
Organisation
(see glossary)
Current
data
Trend
data
File-worksheet name
P
0
E&W, E, GOR
2008
2006-08
04H_085CRP1_08_V1
04H_085CRP2_08_V1
P
0
E&W, E, GOR, SHA 2006-08
04H_085CRP3_08_V1
04H_085CRP4_08_V1
04H_085CRP5_08_V1
Numerator:
Numerator data - Notifications of live and still born babies with Down syndrome in the respective calendar year(s).
Source of numerator data (i) Office for National Statistics (ONS);
(ii) National Down Syndrome Cytogenetic Register (NDSCR).
Comments on numerator data (i) ONS data: Although the ONS scheme is primarily for monitoring changes in the frequency of reporting
anomalies, it also provides the most extensive data on incidence and prevalence levels available in England and
Wales. However, the major disadvantage of using the monitoring scheme data to measure incidence and
prevalence levels arises from the deficiencies in its coverage, in that the notification scheme is voluntary. In the
period up to January 1990, only anomalies detected within seven days of birth were included, later extended to ten
days. From 1st January 1995, anomalies detected at any age can be reported.
The numerator data relate to the National Congenital Anomaly System (NCAS). ONS receives these data from two
sources: electronically from local congenital anomaly registers for the areas covered by a register, and on paper
SD56 forms directly from NHS Trusts in areas without a local register. It is recocognised that there is underreporting in NCAS, particularly in the areas not covered by a local registers.
In April 2006 several PCTs in East Midlands and Yorkshire and The Humber decided to withold funding from their
local congenital anomaly register, the East Midlands and South Yorkshire Congenital Anomaly Register. Without
funding the register was unable to process or send data to ONS. Figures for England, and England and Wales
exclude data from these areas.
As of 1995, congenital anomalies are coded on the basis of ICD-10. Detailed statistics and a description of the
monitoring scheme are published annually by ONS (Series MB3).
(ii) NDSCR data: The National Down Syndrome Cytogenetic Register provides a more complete estimate of the
incidence of Down syndrome than does the Office for National Statistics' voluntary notification system. It also
provides information on diagnoses and outcomes.
Since 1989, all clinical cytogenetic laboratories dealing with constitutive disorders (congenital karyotype
anomalies) have notified the NDSCR of all diagnoses of trisomy 21 and related karyotypes. From a comparison of
the two systems, it seems that the ONS data is 46% under-reported for the years 1990-93 on terminations and
48% on births (See “Further reading”). Data from the NDSCR are constantly being updated, hence there could be
minor differences year on year. Trends in prenatal screening for and diagnosis of Down syndrome in England and
Wales are reported elsewhere (See “Further reading”). Despite the expansion of prenatal screening and diagnosis,
39% of all diagnoses were at birth in 2001 compared with 44% in 1999. Of all pregnancies with a prenatal
diagnosis of trisomy 21 in 1996-99, 94% were terminated, 5% were liveborn, and 1% were stillbirths or neonatal
deaths.
117
Denominator:
Denominator data - Live and still births occurring in the respective calendar year(s).
Source of denominator data - ONS.
Comments on denominator data - Until October 1992, stillbirths were legally defined as fetal deaths occurring after
28 weeks of gestation. In October 1992, the definition was revised to include fetal deaths occurring after 24 weeks
of gestation. The data presented here are based on the revised definition, and hence are not comparable with data
for years before 1993.
Interpretation of indicators:
Quality of indicator - Annex 12 describes the criteria that should be used to judge the quality of this indicator. The
application of the criteria is dependent on the context (e.g. describing a single organisation, comparing several
organisations) and the level (e.g. national / regional with large numbers of events, local with small numbers of
events) at which the data are to be used.
Further reading:
1.
2.
3.
4.
5.
Office for National Statistics. Congenital anomaly notifications 2008. Statistical Bulletin, March 2010. Available
at: http://www.statistics.gov.uk/pdfdir/cong0310.pdf
The National Down Syndrome Cytogenetic Register. 2005 Annual Report, February 2007. Available at:
http://www.wolfson.qmul.ac.uk/ndscr/AP2005v7.pdf
The National Down Syndrome Cytogenetic Register. 2004 Annual Report, December 2005. Available at:
http://www.wolfson.qmul.ac.uk/ndscr/AP%202004.pdf
Mutton D, Ide RG, Alberman E. Trends in prenatal screening for and diagnosis of Down’s syndrome: England
and Wales, 1989-97. British Medical Journal 1998; 317: 922-3.
Huang T, Watt HC, Wald NJ, Morris JK, Mutton DE, Alberman ED. Reliability of statistics on Down’s syndrome
notifications. Journal of Medical Screening, 1997; 4, 95-97.
Updated: August 2010
118
Incidence of cleft palate and/or cleft lip
Purpose:
To help reduce the incidence of cleft palate and/or cleft lip.
Definition of indicator and its variants:
Notifications of live and still born babies with cleft palate and/or cleft lip.
Statistic
Number of notifications and
notification rate per 10,000
total births
Sex
P
Age group
0
Organisation
(see glossary)
E&W, E, GOR
Current
data
2008
2006-08
Trend
data
File-worksheet name
04I_084CRP1_08_V1
04I_084CRP2_08_V1
Numerator:
Numerator data - Notifications of live and still born babies with cleft palate and/or cleft lip in the respective calendar
year(s).
Source of numerator data - Office for National Statistics (ONS).
Comments on numerator data - Although the ONS scheme is primarily for monitoring changes in the frequency of
reporting anomalies, it also provides the most extensive data on incidence and prevalence levels available in
England and Wales. However, the major disadvantage of using the monitoring scheme data to measure incidence
and prevalence levels arises from the deficiencies in its coverage, in that the notification scheme is voluntary. In
the period up to January 1990, only anomalies detected within seven days of birth were included, later extended to
ten days. From 1st January 1995, anomalies detected at any age can be reported.
The numerator data relate to the National Congenital Anomaly System (NCAS). ONS receives these data from two
sources: electronically from local congenital anomaly registers for the areas covered by a register, and on paper
SD56 forms directly from NHS Trusts in areas without a local register. It is recocognised that there is underreporting in NCAS, particularly in the areas not covered by a local registers.
In April 2006 several PCTs in East Midlands and Yorkshire and The Humber decided to withold funding from their
local congenital anomaly register, the East Midlands and South Yorkshire Congenital Anomaly Register. Without
funding the register was unable to process or send data to ONS. Figures for England, and England and Wales
exclude data from these areas.
As of 1995, congenital anomalies are coded on the basis of ICD-10. Detailed statistics and a description of the
monitoring scheme are published annually by ONS (Series MB3).
Denominator:
Denominator data - Live and still births in the respective calendar year(s).
Source of denominator data - ONS.
Comments on denominator data - Until October 1992, stillbirths were legally defined as fetal deaths occurring after
28 weeks of gestation. In October 1992 the definition was revised to include fetal deaths occurring after 24 weeks
of gestation. The data presented here are based on the revised definition, and hence are not comparable with data
for years before 1993.
Interpretation of indicators:
Quality of indicator - Annex 12 describes the criteria that should be used to judge the quality of this indicator. The
application of the criteria is dependent on the context (e.g. describing a single organisation, comparing several
organisations) and the level (e.g. national / regional with large numbers of events, local with small numbers of
events) at which the data are to be used.
Further reading:
1. Office for National Statistics. Congenital anomaly notifications 2008. Statistical Bulletin, March 2010. Available
at: http://www.statistics.gov.uk/pdfdir/cong0310.pdf
Updated: August 2010
119
Low birthweight births
Purpose:
To help reduce the incidence of low birthweight births.
Definition of indicator and its variants:
Live and stillborn infants with low birthweights as a percent of all live and stillborn infants with a stated birthweight.
Statistic
Percent of births under 1500
and under 2500 grams
Sex
P
Age group
0
Organisation
(see glossary)
Current
data
E&W, E, GOR, ONS
area, SHA, LA,
PCO, CTY
2008
Trend
data
File-worksheet name
04J_090PC_08_V1
Numerator:
Numerator data - Number of live and still births occurring in the respective calendar year with birthweights under
1500 grams and under 2500 grams for:
•
all maternal ages;
•
maternal ages under 20 years and 20 and over (plus live and still births by 500 gram intervals).
Source of numerator data – Office for National Statistics (ONS).
Comments on numerator data - See “Comments on denominator” data.
Denominator:
Denominator data - All live and still births occurring with a stated birthweight in the respective calendar year for
respective maternal ages.
Source of denominator data - ONS.
Comments on denominator data - Until October 1992, stillbirths were legally defined as fetal deaths occurring after
28 weeks of gestation. In October 1992 the definition was revised to include fetal deaths occurring after 24 weeks
of gestation. The data presented here are based on the revised definition, and hence are not comparable with data
for years before 1993.
Birthweight is obtained from the birth notification information provided to the registrar of births and deaths by the
local health services. Birthweight is not always stated in the notifications.
The figures presented here are expressed as percentages of total births with a stated birthweight, thereby
excluding births without a stated birthweight from the denominator. These figures are therefore not comparable
with data for years before 1994, which were expressed as percentages of total births. In England and Wales in
2007, birthweight was not stated for 1.12% of total births and in 2008 for 0.8%.
Interpretation of indicators:
Quality of indicator - Annex 12 describes the criteria that should be used to judge the quality of this indicator. The
application of the criteria is dependent on the context (e.g. describing a single organisation, comparing several
organisations) and the level (e.g. national / regional with large numbers of events, local with small numbers of
events) at which the data are to be used.
Further reading:
1.
2.
3.
Office for National Statistics. Statistical Bulletin - Infant and perinatal mortality 2008: health areas, England
and Wales. September 2009. Available at: http://www.statistics.gov.uk/pdfdir/ipm0909.pdf
Department of Health. National Service Framework for Children, Young People and Maternity Services –
Emerging findings. London: Department of Health, 2003.
Department of Health. National Service Framework for Children, Young People and Maternity Services –
Standard for Hospital Services. London: Department of Health, 2003.
Updated: December 2009
120
Stillbirths
Purpose:
To help reduce the incidence of stillbirths.
Definition of indicator and its variants:
Stillbirths, defined as fetal deaths occurring after 24 weeks’ gestation or more.
Statistic
Sex
Age group
Organisation
(see glossary)
Number of live births by
maternal age
F
Number of stillbirths and
stillbirth rate per 1000 total
(live and still) births
P
11-15, 16-19, 2024, 25-34, 35-39,
40+
0
Current
data
E&W, E, GOR, ONS
2008
area, SHA, LA,
PCO, CTY
E&W, E, GOR, ONS
2008
area, SHA, LA,
2006-08
PCO, CTY
Trend
data
File-worksheet name
04K_097NO_08_V1
04K_097CRP1_08_V1
04K_097CRP2_08_V1
Numerator:
Numerator data - Number of stillbirths for all maternal ages, and for ages under 20 years and 20 years and over
occurring in the respective calendar year(s).
Source of numerator data – Office for National Statistics (ONS).
Comments on numerator data - Until October 1992, stillbirths were legally defined as fetal deaths occurring after
28 weeks of gestation. In October 1992 the definition was revised to include fetal deaths occurring after 24 weeks
of gestation. The data presented here are based on the revised definition, and hence are not comparable with data
for years before 1993.
Denominator:
Denominator data - Live and stillbirths occurring in the respective calendar years.
Source of denominator data - ONS.
Comments on denominator data - See “Comments on numerator data”.
Interpretation of indicators:
Quality of indicator - Annex 12 describes the criteria that should be used to judge the quality of this indicator. The
application of the criteria is dependent on the context (e.g. describing a single organisation, comparing several
organisations) and the level (e.g. national / regional with large numbers of events, local with small numbers of
events) at which the data are to be used.
Further reading:
1.
2.
3.
Office for National Statistics. Statistical Bulletin - Infant and perinatal mortality 2008: health areas, England
and Wales. September 2009. Available at: http://www.statistics.gov.uk/pdfdir/ipm0909.pdf
Department of Health. National Service Framework for Children, Young People and Maternity Services –
Emerging findings. London: Department of Health, 2003.
Department of Health. National Service Framework for Children, Young People and Maternity Services –
Standard for Hospital Services. London: Department of Health, 2003.
Updated: December 2009
121
Perinatal mortality
Purpose:
To help reduce perinatal mortality.
Definition of indicator and its variants:
Stillbirths plus early neonatal deaths (deaths at under 7 completed days of life).
Statistic
Sex
Number of perinatal deaths
and perinatal mortality rate per
1000 total (live and still) births
P
Age group
Stillbirths and
deaths <7 days
Organisation
(see glossary)
Current
data
E&W, E, GOR, ONS
2008
area, SHA, LA,
2006-08
PCO, CTY
Trend
data
File-worksheet name
04L_179CRP1_08_V1
04L_179CRP2_08_V1
Numerator:
Numerator data - Number of stillbirths and deaths of infants at ages under 7 days registered in the relevant
year(s).
Source of numerator data - Office for National Statistics (ONS).
Comments on numerator data - Until October 1992, stillbirths were legally defined as fetal deaths occurring after
28 weeks of gestation. In October 1992 the definition was revised to include fetal deaths occurring after 24 weeks
of gestation. The data presented here are based on the revised definition, and hence are not comparable with data
for years before 1993.
Denominator:
Denominator data - Live and still births occurring in the respective calendar year(s).
Source of denominator data - ONS.
Comments on denominator data - See “Comments on numerator data”.
Interpretation of indicators:
Quality of indicator - Annex 12 describes the criteria that should be used to judge the quality of this indicator. The
application of the criteria is dependent on the context (e.g. describing a single organisation, comparing several
organisations) and the level (e.g. national / regional with large numbers of events, local with small numbers of
events) at which the data are to be used.
Further reading:
1.
2.
3.
Office for National Statistics. Statistical Bulletin - Infant and perinatal mortality 2008: health areas, England
and Wales. September 2009. Available at: http://www.statistics.gov.uk/pdfdir/ipm0909.pdf
Department of Health. National Service Framework for Children, Young People and Maternity Services –
Emerging findings. London: Department of Health, 2003.
Department of Health. National Service Framework for Children, Young People and Maternity Services –
Standard for Hospital Services. London: Department of Health, 2003.
Updated: December 2009
122
Postneonatal mortality
Purpose:
To help reduce postneonatal mortality.
Definition of indicator and its variants:
Deaths of infants at ages 28 days and over but under one year.
Statistic
Number of postneonatal
deaths and postneonatal
mortality rate per 1000 live
births
Sex
P
Age group
Organisation
(see glossary)
Current
data
28 days to 1 year E&W, E, GOR, ONS
2008
area, SHA, LA,
2006-08
PCO, CTY
Trend
data
File-worksheet name
04M_180CRP1_08_V1
04M_180CRP2_08_V1
Numerator:
Numerator data - Number of deaths of infants at ages 28 days to 1 year registered in the respective calendar
year(s).
Source of numerator data - Office for National Statistics (ONS).
Comments on numerator data - None.
Denominator:
Denominator data - Live births occurring in the respective calendar year(s).
Source of denominator data - ONS.
Comments on denominator data - None.
Interpretation of indicators:
Quality of indicator - Annex 12 describes the criteria that should be used to judge the quality of this indicator. The
application of the criteria is dependent on the context (e.g. describing a single organisation, comparing several
organisations) and the level (e.g. national / regional with large numbers of events, local with small numbers of
events) at which the data are to be used.
Further reading:
1.
2.
3.
Office for National Statistics. Statistical Bulletin - Infant and perinatal mortality 2008: health areas, England
and Wales. September 2009. Available at: http://www.statistics.gov.uk/pdfdir/ipm0909.pdf
Department of Health. National Service Framework for Children, Young People and Maternity Services –
Emerging findings. London: Department of Health, 2003.
Department of Health. National Service Framework for Children, Young People and Maternity Services –
Standard for Hospital Services. London: Department of Health, 2003.
Updated: December 2009
123
Mortality in infancy
Purpose:
To help reduce mortality in infancy.
Definition of indicator and its variants:
Deaths of infants at various ages under one year.
Statistic
Number of infant deaths and
infant mortality rate per 1000
live births
Sex
P
Age group
<1 year, <28
days, <7 days
Organisation
(see glossary)
Current
data
E&W, E, GOR, ONS
2008
area, SHA, LA,
2006-08
PCO, CTY
Trend
data
File-worksheet name
04N_181CRP1_08_V1
04N_181CRP2_08_V1
Numerator:
Numerator data - Number of deaths of infants at various ages (<1 year, <28 days, <7 days), for all maternal ages
and for maternal ages under 20 years and 20 years and over, registered in the respective calendar years(s).
Source of numerator data - Office for National Statistics (ONS).
Comments on numerator data - Data on infant deaths by maternal age were extracted from "linked files", where
death records are linked to corresponding birth records. A small proportion of records were not linked successfully
(e.g. the child may have been born in another country), hence totals may vary from published figures slightly.
Denominator:
Denominator data - Live births occurring in the respective calendar year(s) for respective maternal ages.
Source of denominator data - ONS.
Comments on denominator data - None.
Interpretation of indicators:
Quality of indicator - Annex 12 describes the criteria that should be used to judge the quality of this indicator. The
application of the criteria is dependent on the context (e.g. describing a single organisation, comparing several
organisations) and the level (e.g. national / regional with large numbers of events, local with small numbers of
events) at which the data are to be used.
Further reading:
1.
2.
3.
Office for National Statistics. Statistical Bulletin - Infant and perinatal mortality 2008: health areas, England
and Wales. September 2009. Available at: http://www.statistics.gov.uk/pdfdir/ipm0909.pdf
Department of Health. National Service Framework for Children, Young People and Maternity Services –
Emerging findings. London: Department of Health, 2003.
Department of Health. National Service Framework for Children, Young People and Maternity Services –
Standard for Hospital Services. London: Department of Health, 2003.
Updated: December 2009
124
Hospital procedures: orchidopexy
Purpose:
The purpose of the indicators is to help monitor the frequency and timeliness of surgery for undescended testes
(orchidopexy) in boys under 15. Undescended testes are associated with potential complications in later life such
as infertility and malignancy. Timely correction (such as surgery before the age of 5) acts as a proxy for both
timely detection through early childhood screening, and potential prevention of later complications.
Definition of indicator and its variants:
(i) Admission to hospital of boys where an orchidopexy is undertaken
(ii) Orchidopexies on boys aged 5-14 years as a percentage of all orchidopexies on boys under 15 years of age
Statistic
Sex
Age
group
Organisation
(see glossary)
(i) Indirectly
age standardised
rate per
100,000
(standardised
to 2005/06)
M
(ii) Indirectly
age standardised
percentage
(standardised
to 2005/06)
M
<5,
5-14
0-14
E; GOR; ONS
area (boundaries
as at November
2006); SHA
(boundaries as at
July 2006);
County; LA
(boundaries as at
April 2009); PCO
(boundaries as at
October 2006).
E; GOR; ONS
area (boundaries
as at November
2006); SHA
(boundaries as at
July 2006);
County; LA
(boundaries as at
April 2009); PCO
(boundaries as at
October 2006).
Period
Current
data
FY 2007/08
FY 2007/08
File-worksheet Name
Trend data
FY 2002/03,
FY 2003/04,
FY 2004/05,
FY 2005/06,
FY 2006/07
FY 2002/03,
FY 2003/04,
FY 2004/05,
FY 2005/06,
FY 2006/07
04O_095ISR7NP1_08_V1
04O_095ISR7NP2_08_V1
04O_095PC7N_08_V1
Numerator:
Numerator data for (i) - The number of finished and unfinished continuous inpatient (CIP) spells for patients of
ages either <5 or 5-14 with one of the following procedures (OPCS-4 codes N08 & N09) anywhere in the spell, in
the respective financial year:
Orchidopexy
• N08 Bilateral placement of testes in scrotum
• N09 Other placement of testes in scrotum
The following fields and values are used for the numerator:
Any episode in the CIP spell has:
A valid procedure from the above list in any operation position (OPER_NN)
AND the first episode in the CIP spell has:
ADMISORC not = 51, 52 or 53 (admission source);
AND EPITYPE = 1 (episode type);
AND SEX = 1 (sex);
AND EPIORDER = 1 (epiorder);
AND ADMIMETH = 11,12,13,21,22,23,24,28,31,32,81,82,83,84 or 89 (admission method);
AND EPISTART >= 01/04/YYYY and EPISTART <= 31/03/YYYY+1 (episode start date within year);
AND CLASSPAT = 1 or 2 (patient classification);
AND STARTAGE is either 0-4 or 7001-7007; or 5-14 (age at start of episode, two variants of indicator);
AND DOB not 01/01/1900 or 01/01/1901 (date of birth).
Fields used from the first episode in a spell where there is a valid patient postcode allowing the derivation of the
following organisation of residence codes include:
125
SPELLRESPCTC, SPELLRESLADSTC, SPELLRESSTHAC. Other organisational levels (E, GOR, ONS
Areas, Counties) are aggregates of the SPELLRESLADSTC field.
Counts are by:
age / first valid organisation of residence in CIP spell (values for England are aggregates of these)
where:
age bands are either <1, 1-4 or 5-9,10-14 (two variants of indicator);
Numerator data for (ii) - The numerator is the same as the numerator in (i), for ages 5-14.
Source of numerator data - Hospital Episode Statistics (HES) for CIP spells intersecting the respective financial
year. England, The NHS Information Centre for health and social care.
Comments on numerator data – This indicator monitors patients rather than the number of operations. Each
person having a procedure should only be counted once during each admission. This is done by counting CIP
spells (epiorder 1) only. Some transfers, which are also coded epiorder 1 could lead to double counting. In order to
avoid this, spells which have an ADMISORC of 51-53, indicating a transfer from another NHS Trust, are excluded.
Individual finished consultant episodes are linked to other episodes where all are part of one continuous spell of
care for a patient (see CIP spell construction sections in Annex 4 (Methods section of the Clinical and Health
Outcomes Knowledge Base www.nchod.nhs.uk ) for details). A spell may contain HES data from another year
only when one of its episodes spans years. For example, a spell which finished during April may contain
admission information from an episode which started during the previous March. In order to avoid double counting
that spell in both financial years, only spells where the selected procedure took place during the financial year of
analysis are counted.
Spells are attributed to the organisation of residence, based on the numerator.
There is variation in the completeness of hospital records and quality of coding (see Data Quality sections in
Annex 4 (Methods section of the Clinical and Health Outcomes Knowledge Base www.nchod.nhs.uk ) for details).
Individual spells may contain more than one eligible procedure but are only counted once. Alternatively, a single
person may have a second eligible spell (for a second orchidopexy) within the same year. Separate spells for an
individual during the same year are counted separately in the numerator.
Denominator:
Denominator data for (i) – The denominator is the resident population for the respective organisation.
Data are based on the latest revisions of ONS mid-year population estimates for the respective years, current as
at 28 September 2008.
For further details on revisions to ONS mid-year population estimates, and their availability, see the comments in
the specification for the ‘Estimates of resident population’ indicator.
Counts are by:
age / organisation of residence (values for England are aggregates of these)
where:
age bands are either <1, 1-4, or 5-9,10-14 (two variants of indicator).
Denominator data for (ii) - The denominator is the pooled total for ages 0-4 and 5-14 in (i).
Source of denominator data for (i) - Office for National Statistics.
Source of denominator data for (ii) - HES data for the respective financial year, England, The NHS Information
Centre for health and social care.
Comments on denominator data - Ideally, the denominator should include only patients in the community who
have undescended testes, who meet the eligibility criteria for orchidopexy. In the absence of routine data on such
patients, the total resident population is used as a denominator.
Statistical Methods:
(i) The indicator is indirectly standardised by age using England age rates as standards. Indirect standardisation
involves the calculation of the ratio of an organisation’s observed number of events and the number of events that
would be expected if it had experienced the same event rates as those of patients in England, given the mix of age
of its patients. This standardised ratio is then converted into a rate by multiplying it by the overall event rate of
patients in England.
126
(ii) The indicator is the indirectly age-standardised rate of orchidopexies undertaken on boys aged 5 to 14
expressed as a percentage of all such procedures carried out on boys aged 0 to 14 inclusive. This indicator is
derived from data used for (i) above.
The percentage change in procedure rate (ii) from a previous year, plus the statistical significance of this change,
have also been calculated. A positive percentage represents improvement and a negative percentage represents
deterioration.
Annex 3 ‘Explanation of statistical methods’ (Methods section of the Clinical and Health Outcomes Knowledge
Base www.nchod.nhs.uk ) describes the methods used for indirect standardisation, calculation of improvement,
estimation of confidence intervals, and banding of significance of improvement.
Interpretation of indicator:
Type of indicator - These are procedure-specific, cross-sectional annual comparative indicators, acting as proxies
for outcome. In the absence of an absolute standard, comparative data are useful for monitoring in relation to rates
achieved in comparable organisations.
Quality of Indicator - Annex 12 (Methods section of the Clinical and Health Outcomes Knowledge Base
www.nchod.nhs.uk ) describes the criteria that should be used to judge the quality of this indicator. The application
of the criteria is dependent on the context (e.g. describing a single organisation, comparing several organisations)
and the level (e.g. national / regional with large numbers of events, local with small numbers of events) at which
the data are to be used.
Confidence Intervals - Some of the values and factors influencing the indicator may be chance occurrences, with
values fluctuating at random between organisations and from year to year. Numbers of admissions may be small
at Primary Care Organisation and Local Authority level. The results should therefore be interpreted with caution
and with the aid of confidence intervals. The 95% confidence interval provides a measure of the statistical
precision of the rate for an area or institution. It indicates a range which, with 95% confidence, will contain the
underlying value of the indicator. If the confidence interval for an area’s rate does not contain the overall national
rate, the difference between the two rates is considered statistically significant. If the confidence interval overlaps
the national rate, in most cases the difference between the rates would not be considered statistically significant.
95% and 99.8% confidence intervals have been calculated.
Effect of case-mix/severity - A number of factors outside the control of hospitals, such as the socio-economic mix
of local populations and events prior to hospitalisation, may determine whether a patient gets admitted or not and
may influence rates. Differences in case-mix, concurrent illnesses and other potential risk factors also contribute to
the variation. Analyses at England level by the Index of Multiple Deprivation are presented.
Other potential confounding factors - The extent to which undescended testes are detected through early
childhood screening.
Potential value of indicator:
To stimulate discussion and encourage local investigation, and to lead to improvement in data quality and quality
of care.
Potential for follow-up action leading to change:
Studies to assess the longer term impact of late surgery.
Relevant national initiatives:
None known.
Further reading:
1.
McColl A J. Early orchidopexy for cryptorchidism. In ‘Population Health Outcome Indicators for the NHS – a
feasibility study (Eds McColl A J, Gulliford M C). London: Faculty of Public Health Medicine, 1993.
Updated: October 2009
127
Emergency hospital admissions: children with lower respiratory tract infections
Purpose:
The purpose of the indicator is to help monitor National Health Service (NHS) success in prevention and treatment
outside hospital in areas that impact on respiratory illnesses in children, e.g. encouraging smoking reduction,
especially in young mothers; improving the uptake and continuation of breast feeding; better support for young
parents in the care of their children and in management of illnesses in the home; providing support as well as
facilitating access to health advice and therapy through NHS Direct; and enhanced primary care. These initiatives
form part of NHS targets to reduce inequalities in childhood morbidity and mortality.
Respiratory infections form one of the most common reasons for hospital admission in childhood, especially in
infants. Between 1 and 3% of all babies experience an admission with bronchiolitis and about 2.5% of all child
admissions are for pneumonia. Emergency admission rates in children, especially under the age of 5 years for
lower respiratory infections - bronchiolitis, bronchopneumonia and pneumonia - reflect a variety of influences.
Rates vary across the country but are increased in areas of socio-economic deprivation. Previous analyses have
shown that they also vary between health authorities, even when social deprivation is taken into account, probably
reflecting variation in access to, and expectation of, health services and also clinical practice. Lower rates are
linked to higher breast feeding rates and reduction of exposure to tobacco smoke - preventive measures that
reduce both incidence and severity of infections.
Definition of indicator and its variants:
Emergency admissions to hospital of children with selected types of lower respiratory tract infections (bronchiolitis,
bronchopneumonia and pneumonia).
Statistic
Sex
Age
group
Organisation
Period
(see glossary)
Indirectly age
and sexstandardised
rate per 100,000
(standardised to
2005/06)
P
F
M
<16
Current
data
FY
2008/09
E; GOR; ONS
area (boundaries
as at November
2006); SHA
(boundaries as at
July 2006);
County, LA
(boundaries as at
April 2009); PCO
(boundaries as at
October 2006);
CTY.
Trend
data
FY 2002/03
FY 2003/04
FY 2004/05
FY 2005/06
FY 2006/07
FY 2007/08
File-worksheet name
04Q_524ISR7AP_09_V1
04Q_524ISR7AF_09_V1
04Q_524ISR7AM_09_V1
Numerator:
Numerator data - The number of finished and unfinished continuous inpatient (CIP) spells, excluding transfers, for
patients aged 0-15 with an emergency method of admission and with any of the following primary diagnoses
st
(DIAG_01 in the 1 episode of the spell, ICD 10 codes) in the respective financial year:
Bronchiolitis, bronchopneumonia and pneumonia:
•
•
•
J10.0
J11.0
J11.1
•
•
•
•
•
•
•
•
•
J12.J13
J14
J15.J16.J18.0
J18.1
J18.9
J21.-
Influenza with pneumonia virus identified;
Influenza with pneumonia, virus not identified;
Influenza with other respiratory manifestations, virus not identified
(bronchiolitis with influenza);
Viral pneumonia nec;
Pneumonia due to Streptococcus pneumoniae;
Pneumonia due to Haemophilus influenzae;
Bacterial pneumonia nec;
Pneumonia due to other infectious organisms nec;
Bronchopneumonia, unspecified;
Lobar pneumonia;
Pneumonia unspecified;
Acute bronchiolitis.
The following fields and values are used for the numerator:
The first episode in the CIP spell has:
DIAG_01 in the valid list for this indicator (primary diagnosis);
AND ADMISORC not = 51, 52 or 53 (admission source);
128
AND EPITYPE = 1 (episode type);
AND SEX = 1 or 2 (sex);
AND EPIORDER = 1 (episode order);
AND ADMIMETH = 21, 22, 23, 24 or 28 (admission method);
AND EPISTART is >= 01/04/YYYY and EPISTART <= 31/03/YYYY+1 (episode start date);
AND CLASSPAT = 1 (patient classification);
AND STARTAGE is 0-15 or 7001-7007 (age at start of episode);
AND DOB not 01/01/1900 or 01/01/1901 (date of birth).
Fields used from the first episode in a spell where there is a valid patient postcode allowing the
derivation of the following organisation of residence codes include:
SPELLRESPCTC, SPELLRESLADSTC, SPELLRESSTHAC. Other organisational levels
(E, GOR, ONS Areas, Counties) are aggregates of the SPELLRESLADSTC field.
Counts are by:
age / sex / organisation of residence in CIP spell (values for England are aggregates of
these)
where:
age bands are <1, 1-4, 5-9, 10-15;
sex is 1, 2 (male and female).
Source of numerator data – Hospital Episode Statistics (HES) for CIP spells intersecting the respective financial
year. England, The NHS Information Centre for health and social care.
Comments on numerator data – It is important, for the purposes of measuring incidence, to count persons as
opposed to episodes of care, as each person with the condition should only be counted once during each
admission. This is done by counting CIP spells (epiorder 1) only. Some transfers which are also coded epiorder 1
and emergency could lead to double counting. In order to avoid this, spells which have an admisorc of 51-53,
indicating a transfer from another NHS Trust, are excluded.
Individual finished consultant episodes are linked to other episodes where all are part of one continuous spell of
care for a patient (see CIP spell construction sections in Annex 4 (Methods section of the Clinical and Health
Outcomes Knowledge Base www.nchod.nhs.uk ) for details). A spell may contain HES data from another year only
when one of its episodes spans years. For example, a spell which finished during April may contain admission
information from an episode which started during the previous March. In order to avoid double counting that spell
in both financial years, only spells which started during the financial year of analysis are counted.
Deaths in the community prior to admission are not included, nor are patients who get treated in the community, as
data about them are not available.
Emergency method of admission and primary diagnosis are used to distinguish between new disease and
readmission for the same problem previously treated in hospital. However, there could be double counting if the
readmission is coded as an emergency and has the same primary diagnosis.
Spells are attributed to the organisation of residence, based on the numerator.
There is variation in the completeness of hospital records and quality of coding (see Data Quality sections in
Annex 4 (Methods section of the Clinical and Health Outcomes Knowledge Base www.nchod.nhs.uk ) for details).
These show the proportion of diagnoses not coded. There may be variation between hospitals in the way that they
code diagnoses to the fourteen diagnosis fields in each episode, particularly primary diagnosis. For instance, they
may code in the order in which diagnoses were made, or according to the perceived importance or complexity.
This may affect whether a particular spell is selected for inclusion in the numerator of this indicator.
Denominator:
Denominator data - The denominator is the resident population for the respective organisation.
Data are based on the latest revisions of ONS mid-year population estimates for the respective years, current as
at September 2009.
For further details on revisions to ONS mid-year population estimates, and their availability, see the comments in
the specification for the ‘Estimates of resident population’ indicator.
Counts are by:
age / sex / organisation of residence (values for England are aggregates of these)
where:
age bands are <1, 1-4, 5-9, 10-15;
sex is 1, 2 (male and female).
129
Source of denominator data - Office for National Statistics.
Statistical Methods:
The indicator is indirectly standardised by age and sex. The person-based rate is standardised by age and sex
using England age and sex rates as standards. The gender-specific rates are standardised by age using personbased standards, in order to highlight differences across gender. Indirect standardisation involves the calculation
of the ratio of an organisation’s observed number of events and the number of events that would be expected if it
had experienced the same event rates as those of patients in England, given the mix of age and sex of its patients.
This standardised ratio is then converted into a rate by multiplying it by the overall event rate of patients in
England.
The percentage change in admission rate from a previous year, plus the statistical significance of this change,
have also been calculated. A positive percentage represents improvement and a negative percentage represents
deterioration.
Annex 3 ‘Explanation of statistical methods’ (Methods section of the Clinical and Health Outcomes Knowledge
Base www.nchod.nhs.uk ) describes the methods used for indirect standardisation, calculation of improvement,
estimation of confidence intervals, and banding of significance of improvement.
Interpretation of indicator:
Type of indicator - This is a condition-specific, cross-sectional annual comparative indicator, acting as a proxy for
outcome. In the absence of an absolute standard, comparative data are useful for monitoring in relation to rates
achieved in comparable organisations.
Quality of Indicator – Annex 12 (Methods section of the Clinical and Health Outcomes Knowledge Base
www.nchod.nhs.uk ) describes the criteria that should be used to judge the quality of this indicator. The application
of the criteria is dependent on the context (e.g. describing a single organisation, comparing several organisations)
and the level (e.g. national / regional with large numbers of events, local with small numbers of events) at which
the data are to be used.
Confidence Intervals - Some of the values and factors influencing the indicator may be chance occurrences, with
values fluctuating at random between organisations and from year to year. Numbers of admissions may be small
at Primary Care Organisation and Local Authority level. The results should therefore be interpreted with caution
and with the aid of confidence intervals. The 95% confidence interval provides a measure of the statistical
precision of the rate for an area or institution. It indicates a range which, with 95% confidence, will contain the
underlying value of the indicator. If the confidence interval for an area’s rate does not contain the overall national
rate, the difference between the two rates is considered statistically significant. If the confidence interval overlaps
the national rate, in most cases the difference between the rates would not be considered statistically significant.
95% and 99.8% confidence intervals have been calculated.
Effect of case-mix/severity - A number of factors outside the control of hospitals, such as the socio-economic mix
of local populations and events prior to hospitalisation, may determine whether a patient gets admitted or not and
may influence rates. Differences in case-mix (beyond that accounted for by standardisation), comorbidities and
other potential risk factors also contribute to the variation. Current data do not allow assignment of severity of
illness across continuous inpatient spells, nor do they allow adjustment for any of these factors. We have tried to
deal with this constraint partially by presenting the data in clusters that are similar with respect to organisation
type. Gender-specific data standardised to person rates are available.
Other potential confounding factors - The patterns of providing care may vary between organisations in terms of:
extent of treatment in primary care settings; referral policies and practices; hospital outpatient facilities/walk-in
clinics; and hospital inpatient admission policies and practices for children.
Potential value of indicator:
To stimulate discussion and encourage local investigation, and to lead to improvement in data quality and quality
of care.
Potential for follow-up action leading to change:
Studies to assess the extent to which admissions were potentially avoidable are recommended.
Relevant national initiatives:
Reduction in hospital admission for lower respiratory tract infections was one of the selected Sure Start targets
and reduction of gradients in morbidity formed a major part of the targets for the NHS Plan. A programme of health
visiting and school nursing was implemented and included revisions of the universal child health surveillance
130
programme. All these initiatives have formed a part of the children 's task force and the National Service
Framework programme of work.
Further reading:
1.
2.
3.
4.
5.
6.
7.
8.
9.
10.
11.
12.
13.
14.
Ashley, M. J., Ferrence, R. Reducing children's exposure to environmental Tobacco smoke in homes:
issues and strategies. Tob Control 1998; 7: 61-65.
Bauchner H., Leventhal J.M., Shapiro E.D. Studies of breastfeeding and infections. How good is the
evidence? Journal of the American Medical Association1986; 256: 887-892.
Beaudry M, Dufour R, Marcoux S. Relation between infant feeding and infections during the first six months
of life. J Pediatr 1995;126:191-197.
Chen Y. Synergistic effect of passive smoking and artificial feeding on hospitalization for respiratory illness
in early childhood. Chest 1989; 95:1004-1007.
Dewey K.G., Heinig M.J., Nommsen-Rivers L.A Differences in morbidity between breastfed and Formula fed
infants. Journal of Paediatrics 1995; 126:696-702.
Frank AL, Taber LH, Glezen WP, et al. Breast-feeding and respiratory virus infection. Pediatrics
1982;70:239-245.
Hawker J, Babatunde Olowokure, Sufi F, Weinberg J, O. Gill N, Wilson W. Social inequalities and hospital
admission for respiratory infection. W Midlands PHLS : submitted 2000.
Heinig M.J., Dewey K.G. Health advantages of breastfeeding for infants. Critical review. Nutrition Research
Reviews 1996; 9: 89-110.
Howie P.W., Forsyth J.S., Ogston S.A., Clark A., Florey C. Protective effect of breastfeeding against
infection. British Medical Journal 1990; 300: 11-16.
MacFaul R, Jones S, and Werneke U. Clinical training experience in district general hospitals Arch. Dis.
Child 2000; 83: 39-44.
Spencer N, Logan S , Scholey S , Gentle S, Deprivation and bronchiolitis. Arch. Dis. Child 1996;74: 50-52.
Taylor, J., Spencer, N., Baldwin;, N., Sturge;, C., Speight, ANP, Hoghughi, M. Current topic: Social,
economic, and political context of parenting. Arch. Dis. Child 2000; 82: 113-120.
Wilson A., Forsyth S., Greene S., Irvine L., Hau C., Howie P. Relation of infant diet to childhood health:
seven year follow up of cohort of children in Dundee infant feeding study. British Medical Journal 1998; 316:
21-25.
Wright AI, Holberg CJ, Martinez FD, et al. Breast feeding and lower respiratory tract illness in the first year
of life. British Medical Journal1989; 299:945-949.
Wright AL, Holberg CJ, Taussig LM, et al. Relationship of infant feeding to recurrent wheezing at age 6
years. Arch Pediatr Adolesc Med 1995;149: 758-763.
Updated: November 2010
131
Emergency hospital admissions: children with gastroenteritis
Purpose:
The purpose of the indicator is to help monitor National Health Service (NHS) success in treatment outside
hospital of types of childhood gastroenteritis that have limited morbidity or need for hospital-based care and low
mortality, through e.g. encouraging breast feeding, better diet, hygiene, and management of infections; better
support for young parents in the care of their children and in the management of illnesses in the home; providing
support as well as facilitating access to health advice and therapy through NHS Direct; and enhanced primary
care.
Definition of indicator and its variants:
Emergency admissions to hospital of children with selected types of gastroenteritis.
Statistic
Sex
Age
group
Organisation
(see glossary)
Indirectly age and
sex-standardised
rate per 100,000
(standardised to
2005/06)
P
F
M
<5
E; GOR; ONS area
(boundaries as at
November 2006);
SHA (boundaries as
at July 2006);
County, LA
(boundaries as at
April 2009); PCO
(boundaries as at
October 2006);
CTY.
Period
Current
data
FY
2008/09
Trend
data
FY 2002/03
FY 2003/04
FY 2004/05
FY 2005/06
FY 2006/07
FY 2007/08
File-worksheet name
04R_525ISR7BP_09_V1
04R_525ISR7BF_09_V1
04R_525ISR7BM_09_V1
Numerator:
Numerator data - The number of finished and unfinished continuous inpatient (CIP) spells, excluding transfers, for
patients aged 0-4 with an emergency method of admission and with any of the following primary diagnoses
(DIAG_01 in the 1st episode of the spell, ICD 10 codes) in the respective financial year:
Intestinal infectious diseases:
•
•
•
•
•
•
•
•
•
•
A02.0
A04.A05.9
A07.2
A08.0
A08.1
A08.3
A08.4
A08.5
A09.-
Salmonella enteritis;
Other bacterial intestinal infections;
Bacterial food borne intoxication unspecified;
Cryptosporidiosis;
Rotaviral enteritis;
Acute gastroenteropathy due to Norwalk agent;
Other viral enteritis;
Viral intestinal infection unspecified;
Other specified intestinal infections;
Diarrhoea and gastroenteritis of presumed infectious origin.
Other non-infective gastroenteritis and colitis:
•
•
•
•
•
K52.0
K52.1
K52.2
K52.8
K52.9
Gastroenteritis and colitis due to radiation;
Toxic gastroenteritis and colitis;
Allergic and dietetic gastroenteritis and colitis;
Other specified non-infective gastroenteritis and colitis;
Non-infective gastroenteritis and colitis unspecified.
The following fields and values are used for the numerator:
The first episode in the CIP spell has:
DIAG_01 in the valid list for this indicator (primary diagnosis);
AND ADMISORC not = 51, 52 or 53 (admission source);
AND EPITYPE = 1 (episode type);
AND SEX = 1 or 2 (sex);
AND EPIORDER = 1 (episode order);
AND ADMIMETH = 21, 22, 23, 24 or 28 (admission method);
AND EPISTART is >= 01/04/YYYY and EPISTART <= 31/03/YYYY+1 (episode start date);
AND CLASSPAT = 1(patient classification);
132
AND STARTAGE is 0-4 or 7001-7007 (age at start of episode);
AND DOB not 01/01/1900 or 01/01/1901 (date of birth).
Fields used from the first episode in a spell where there is a valid patient postcode allowing the
derivation of the following organisation of residence codes include:
SPELLRESPCTC, SPELLRESLADSTC, SPELLRESSTHAC. Other organisational levels
(E, GOR, ONS Areas, Counties) are aggregates of the SPELLRESLADSTC field.
Counts are by:
age / sex / organisation of residence in CIP spell (values for England are aggregates of
these)
where:
age bands are <1, 1-4;
sex is 1, 2 (male and female).
Source of numerator data – Hospital Episode Statistics (HES) for CIP spells intersecting the respective financial
year. England, The NHS Information Centre for health and social care.
Comments on numerator data – It is important, for the purposes of measuring incidence, to count persons as
opposed to episodes of care, as each person with the condition should only be counted once during each
admission. This is done by counting CIP spells (epiorder 1) only. Some transfers which are also coded epiorder 1
and emergency could lead to double counting. In order to avoid this, spells which have an admisorc of 51-53,
indicating a transfer from another NHS Trust, are excluded.
Individual finished consultant episodes are linked to other episodes where all are part of one continuous spell of
care for a patient (see CIP spell construction sections in Annex 4 (Methods section of the Clinical and Health
Outcomes Knowledge Base www.nchod.nhs.uk ) for details). A spell may contain HES data from another year only
when one of its episodes spans years. For example, a spell which finished during April may contain admission
information from an episode which started during the previous March. In order to avoid double counting that spell
in both financial years, only spells which started during the financial year of analysis are counted.
Deaths in the community prior to admission are not included, nor are patients who get treated in the community, as
data about them are not available.
Emergency method of admission and primary diagnosis are used to distinguish between new disease and
readmission for the same problem previously treated in hospital. However, there could be double counting if the
readmission is coded as an emergency and has the same primary diagnosis.
Spells are attributed to the organisation of residence, based on the numerator.
There is variation in the completeness of hospital records and quality of coding (see Data Quality sections in
Annex 4 (Methods section of the Clinical and Health Outcomes Knowledge Base www.nchod.nhs.uk ) for details).
These show the proportion of diagnoses not coded. Non-infective gastroenteritis may be miscoded as infectious
and vice-versa, hence both sets of codes are used for the numerator. There may be variation between hospitals in
the way that they code diagnoses to the fourteen diagnosis fields in each episode, particularly primary diagnosis.
For instance, they may code in the order in which diagnoses were made, or according to the perceived importance
or complexity. This may affect whether a particular spell is selected for inclusion in the numerator of this indicator.
Denominator:
Denominator data - The denominator is the resident population for the respective organisation.
Data are based on the latest revisions of ONS mid-year population estimates for the respective years, current as
at September 2009.
For further details on revisions to ONS mid-year population estimates, and their availability, see the comments in
the specification for the ‘Estimates of resident population’ indicator.
Counts are by:
age / sex / organisation of residence (values for England are aggregates of these)
where:
age bands are <1, 1-4;
sex is 1, 2 (male and female).
Source of denominator data - Office for National Statistics.
133
Statistical Methods:
The indicator is indirectly standardised by age and sex. The person-based rate is standardised by age and sex
using England age and sex rates as standards. The gender-specific rates are standardised by age using personbased standards, in order to highlight differences across gender. Indirect standardisation involves the calculation
of the ratio of an organisation’s observed number of events and the number of events that would be expected if it
had experienced the same event rates as those of patients in England, given the mix of age and sex of its patients.
This standardised ratio is then converted into a rate by multiplying it by the overall event rate of patients in
England.
The percentage change in admission rate from a previous year, plus the statistical significance of this change,
have also been calculated. A positive percentage represents improvement and a negative percentage represents
deterioration.
Annex 3 ‘Explanation of statistical methods’ (Methods section of the Clinical and Health Outcomes Knowledge
Base www.nchod.nhs.uk ) describes the methods used for indirect standardisation, calculation of improvement,
estimation of confidence intervals, and banding of significance of improvement.
Interpretation of indicator:
Type of indicator - This is a condition-specific, cross-sectional annual comparative indicator, acting as a proxy for
outcome. In the absence of an absolute standard, comparative data are useful for monitoring in relation to rates
achieved in comparable organisations.
Quality of Indicator – Annex 12 (Methods section of the Clinical and Health Outcomes Knowledge Base
www.nchod.nhs.uk ) describes the criteria that should be used to judge the quality of this indicator. The application
of the criteria is dependent on the context (e.g. describing a single organisation, comparing several organisations)
and the level (e.g. national / regional with large numbers of events, local with small numbers of events) at which
the data are to be used.
Confidence Intervals - Some of the values and factors influencing the indicator may be chance occurrences, with
values fluctuating at random between organisations and from year to year. Numbers of admissions may be small
at Primary Care Organisation and Local Authority level. The results should therefore be interpreted with caution
and with the aid of confidence intervals. The 95% confidence interval provides a measure of the statistical
precision of the rate for an area or institution. It indicates a range which, with 95% confidence, will contain the
underlying value of the indicator. If the confidence interval for an area’s rate does not contain the overall national
rate, the difference between the two rates is considered statistically significant. If the confidence interval overlaps
the national rate, in most cases the difference between the rates would not be considered statistically significant.
95% and 99.8% confidence intervals have been calculated.
Effect of case-mix/severity - A number of factors outside the control of hospitals, such as the socio-economic mix
of local populations and events prior to hospitalisation, may determine whether a patient gets admitted or not and
may influence rates. Differences in case-mix (beyond that accounted for by standardisation), comorbidities and
other potential risk factors also contribute to the variation. Current data do not allow assignment of severity of
illness across continuous inpatient spells, nor do they allow adjustment for any of these factors. We have tried to
deal with this constraint partially by presenting the data in clusters that are similar with respect to organisation
type. Gender-specific data standardised to person rates are available.
Other potential confounding factors - The patterns of providing care may vary between organisations in terms of:
extent of treatment in primary care settings; referral policies and practices; hospital outpatient facilities/walk-in
clinics; and hospital inpatient admission policies and practices for children.
Potential value of indicator:
To stimulate discussion and encourage local investigation, and to lead to improvement in data quality and quality
of care.
Potential for follow-up action leading to change:
Studies to assess the extent to which admissions were potentially avoidable are recommended.
Relevant national initiatives:
Work within the Department of Health undertaken by the children’s task force, in particular in relation to the Sure
Start initiative.
Further reading:
134
1.
2.
Conway SP, Newport MJ. Are all hospital admissions for gastroenteritis necessary? J Infect 1994; 29: 5-8.
MacFaul R, Stewart M, Werneke U, Taylor-Meek J, Smith H E, Smith I J. Parental and professional perception
of need for emergency admission to hospital: prospective questionnaire based study. Arch Dis Child 1998; 79:
213-218.
Sartain S A, Maxwell M J, Todd P J, Jones K H, Bagust A, Haycox A, Bundred P. Randomised
controlled trial comparing an acute paediatric hospital at home scheme with conventional hospital
care. Arch Dis Child 2002; 87: 371-375.
Updated: November 2010
135
Emergency hospital admissions: children with asthma
Purpose:
The purpose of the indicator is to help monitor National Health Service (NHS) success in treatment outside hospital
of children with a condition that has limited morbidity or need for hospital-based care and low mortality, through e.g.
better support for young parents in the care of their children and in the management of illnesses in the home;
providing support as well as facilitating access to health advice and therapy through NHS Direct; and enhanced
primary care. It is acknowledged that admissions are appropriate for some children with severe asthma but the
indicator may help to highlight those that are not.
Definition of indicator and its variants:
Emergency admissions to hospital of children with asthma.
Statistic
Age
group
Sex
Organisation
(see glossary)
Indirectly age
and sexstandardised
rate per
100,000
(standardised
to 2005/06)
P
F
M
<16
E; GOR; ONS
area (boundaries
as at November
2006); SHA
(boundaries as at
July 2006);
County; LA
(boundaries as at
April 2009); PCO
(boundaries as at
October 2006).
Period
Current
data
FY
2007/08
File-worksheet Name
Trend data
FY 2002/03,
FY 2003/04,
FY 2004/05,
FY 2005/06,
FY 2006/07
04S_536ISR7HP_08_V1
04S_536ISR7HF_08_V1
04S_536ISR7HM_08_V1
Numerator:
Numerator data - The number of finished and unfinished continuous inpatient (CIP) spells, excluding transfers, for
patients aged 0-15 with an emergency method of admission and with any of the following primary diagnoses
(DIAG_01 in the 1st episode of the spell, ICD 10 codes) in the respective financial year:
Asthma:
•
•
•
•
J45.0
J45.1
J45.8
J45.9
Predominantly allergic asthma;
Non-allergic asthma;
Mixed asthma;
Asthma, unspecified.
Status asthmaticus:
•
J46.-
Acute severe asthma.
The following fields and values are used for the numerator:
The first episode in the CIP spell has:
DIAG_01 in the valid list for this indicator (primary diagnosis);
AND ADMISORC not = 51, 52 or 53 (admission source);
AND EPITYPE = 1 (episode type);
AND SEX = 1 or 2 (sex);
AND EPIORDER = 1 (episode order);
AND ADMIMETH = 21, 22, 23, 24 or 28 (admission method);
AND EPISTART is >= 01/04/YYYY and EPISTART <= 31/03/YYYY+1 (episode start date);
AND CLASSPAT = 1 (patient classification);
AND STARTAGE is 0-15 or 7001-7007 (age at start of episode);
AND DOB not 01/01/1900 or 01/01/1901 (date of birth).
Fields used from the first episode in a spell where there is a valid patient postcode allowing the derivation of
the following organisation of residence codes include:
SPELLRESPCTC, SPELLRESLADSTC, SPELLRESSTHAC. Other organisational levels (E, GOR,
ONS Areas, Counties) are aggregates of the SPELLRESLADSTC field.
Counts are by:
136
age / sex / organisation of residence in CIP spell (values for England are aggregates of these)
where:
age bands are <1, 1-4, 5-9, 10-15;
sex is 1, 2 (male and female).
Source of numerator data – Hospital Episode Statistics (HES) for CIP spells intersecting the respective financial
year, England, The NHS Information Centre for health and social care.
Comments on numerator data – It is important, for the purposes of measuring incidence, to count persons as
opposed to episodes of care, as each person with the condition should only be counted once during each
admission. This is done by counting CIP spells (epiorder 1) only. Some transfers which are also coded epiorder 1
and emergency could lead to double counting. In order to avoid this, spells which have an admisorc of 51-53,
indicating a transfer from another NHS Trust, are excluded.
ndividual finished consultant episodes are linked to other episodes where all are part of one continuous spell of
care for a patient (see CIP spell construction sections in Annex 4 (Methods section of the Clinical and Health
Outcomes Knowledge Base www.nchod.nhs.uk ) for details). A spell may contain HES data from another year only
when one of its episodes spans years. For example, a spell which finished during April may contain admission
information from an episode which started during the previous March. In order to avoid double counting that spell in
both financial years, only spells which started during the financial year of analysis are counted.
Deaths in the community prior to admission are not included, nor are patients who get treated in the community, as
data about them are not available.
Emergency method of admission and primary diagnosis are used to distinguish between new disease and
readmission for the same problem previously treated in hospital. However, there could be double counting if the
readmission is coded as an emergency and has the same primary diagnosis.
Spells are attributed to the organisation of residence, based on the numerator.
There is variation in the completeness of hospital records and quality of coding (see Data Quality sections in Annex
4 (Methods section of the Clinical and Health Outcomes Knowledge Base www.nchod.nhs.uk) for details). These
show the proportion of diagnoses not coded. There may be variation between hospitals in the way that they code
diagnoses to the fourteen diagnosis fields in each episode, particularly primary diagnosis. For instance, they may
code in the order in which diagnoses were made, or according to the perceived importance or complexity. This may
affect whether a particular spell is selected for inclusion in the numerator of this indicator.
Denominator:
Denominator data - The denominator is the resident population for the respective organisation.
Data are based on the latest revisions of ONS mid-year population estimates for the respective years, current as at
29 September 2008.
In the absence of published population data for the years 2002 and 2003 for the age band 10-15 for 22 PCOs not
coterminous with Local Authorities, estimated populations have been derived using the 10-14 age band plus a % of
the 15-19 year age band for that year, based on the % 15-19 year olds who are aged 15 in the published 2004
ONS population estimates. For this reason, the PCO total does not exactly equate to the England total in 2002 and
2003.
For further details on revisions to ONS mid-year population estimates, and their availability, see the comments in
the specification for the ‘Estimates of resident population’ indicator.
Counts are by:
age / sex / organisation of residence (values for England are aggregates of these)
where:
age bands are <1, 1-4, 5-9, 10-15;
sex is 1, 2 (male and female).
Source of denominator data - Office for National Statistics.
Comments on denominator data - Ideally, the denominator should include only patients in the community with
diabetes. In the absence of routine data on such patients, the total resident population is used as a denominator.
Statistical Methods:
The indicator is indirectly standardised by age and sex. The person-based rate is standardised by age and sex
using England age and sex rates as standards. The gender-specific rates are standardised by age using personbased standards, in order to highlight differences across gender. Indirect standardisation involves the calculation of
137
the ratio of an organisation’s observed number of events and the number of events that would be expected if it had
experienced the same event rates as those of patients in England, given the mix of age and sex of its patients. This
standardised ratio is then converted into a rate by multiplying it by the overall event rate of patients in England.
The percentage change in admission rate from a previous year, plus the statistical significance of this change,
have also been calculated. A positive percentage represents improvement and a negative percentage represents
deterioration.
Annex 3 ‘Explanation of statistical methods’ (Methods section of the Clinical and Health Outcomes Knowledge
Base www.nchod.nhs.uk ) describes the methods used for indirect standardisation, calculation of improvement,
estimation of confidence intervals, and banding of significance of improvement.
Interpretation of indicator:
Type of indicator - This is a condition-specific, cross-sectional annual comparative indicator, acting as a proxy for
outcome. In the absence of an absolute standard, comparative data are useful for monitoring in relation to rates
achieved in comparable organisations.
Quality of Indicator – Annex 12 (Methods section of the Clinical and Health Outcomes Knowledge Base
www.nchod.nhs.uk ) describes the criteria that should be used to judge the quality of this indicator. The application
of the criteria is dependent on the context (e.g. describing a single organisation, comparing several organisations)
and the level (e.g. national / regional with large numbers of events, local with small numbers of events) at which the
data are to be used.
Confidence Intervals - Some of the values and factors influencing the indicator may be chance occurrences, with
values fluctuating at random between organisations and from year to year. Numbers of admissions may be small at
Primary Care Organisation and Local Authority level. The results should therefore be interpreted with caution and
with the aid of confidence intervals. The 95% confidence interval provides a measure of the statistical precision of
the rate for an area or institution. It indicates a range which, with 95% confidence, will contain the underlying value
of the indicator. If the confidence interval for an area’s rate does not contain the overall national rate, the difference
between the two rates is considered statistically significant. If the confidence interval overlaps the national rate, in
most cases the difference between the rates would not be considered statistically significant. 95% and 99.8%
confidence intervals have been calculated.
Effect of case-mix/severity - A number of factors outside the control of hospitals, such as the socio-economic mix of
local populations and events prior to hospitalisation, may determine whether a patient gets admitted or not and
may influence rates. Differences in case-mix (beyond that accounted for by standardisation), comorbidities and
other potential risk factors also contribute to the variation. Current data do not allow assignment of severity of
illness across continuous inpatient spells, nor do they allow adjustment for any of these factors. We have tried to
deal with this constraint partially by presenting the data in clusters that are similar with respect to organisation type.
Gender-specific data standardised to person rates are available.
Other potential confounding factors - The patterns of providing care may vary between organisations in terms of:
extent of treatment in primary care settings; referral policies and practices; hospital outpatient facilities/walk-in
clinics; and hospital inpatient admission policies and practices for children.
Potential value of indicator:
To stimulate discussion and encourage local investigation, and to lead to improvement in data quality and quality of
care.
Potential for follow-up action leading to change:
Studies to assess the extent to which admissions were potentially avoidable are recommended.
Relevant national initiatives:
Work within the Department of Health undertaken by the children’s task force.
Further reading:
1.
2.
MacFaul R, Stewart M, Werneke U, Taylor-Meek J, Smith H E, Smith I J. Parental and professional perception
of need for emergency admission to hospital: prospective questionnaire based study. Arch Dis Child 1998; 79:
213-218.
Sartain S A, Maxwell M J, Todd P J, Jones K H, Bagust A, Haycox A, Bundred P. Randomised controlled trial
comparing an acute paediatric hospital at home scheme with conventional hospital care. Arch Dis Child 2002;
87: 371-375.
Updated: October 2009
138
Oral health in children: decayed teeth
Purpose:
To provide standardised, information about dental decay levels among child age cohorts using population
representative random samples.
Definition of indicator and its variants:
Mean number of actively decayed, untreated teeth, i.e. teeth which require treatment, per child in the whole age
group.
Statistic
Mean number per child
Sex
P
Age group
5
Organisation
(see glossary)
Current
data
E, GOR, SHA, LA,
PCO
AY
2007/08
AY
2004/05
11
E&W, E, SHA, PCO
Trend
data
File-worksheet name
40A_115MNP1_08_V2
40A_115MNP2_05_V1
Numerator:
Numerator data - Number of decayed teeth in the survey sample of children in the respective academic year.
Source of numerator data - NHS Dental Epidemiology Programme undertaken by Primary Care Organisations and
co-ordinated by The Dental Observatory and NWPHO with standardisation by the British Society for the Study of
Community Dentistry.
Comments on numerator data - The data for 5 year olds relate to deciduous (milk) teeth (dt), and the data for 11
year olds relate to permanent teet (DT).
As a result of practical difficulties in some areas in accessing twelve year old children in school, a decision was
taken in 2004/05 academic year to survey eleven year olds instead. The survey still looked at decay in their
permanent teeth and, other than the change of age, indicator specifications remained the same as in previous
surveys of twelve year olds.
Currently, the North West Public Health Observatory / The Dental Observatory (NWPHO / TDO) have taken
on responsibility for the English co-ordination of dental epidemiological surveys and released 2007/08 data
for five year olds as the first data set published under their auspices. For more details see:
http://www.nwph.net/dentalhealth/
Denominator:
Denominator data - Number of children in the survey sample.
Source of denominator data - Office for National Statistics (ONS) Single Year of Age mid year estimates.
Comments on denominator data - The data source is a series of nationally co-ordinated dental epidemiological
surveys commissioned by individual Health Authorities to standardised national protocols and diagnostic standards
(see “Further reading”) and involving the dental examination of children in the specified age-group, in state
schools. The data source is part of a cycle of nationally co-ordinated dental epidemiological surveys as outlined in
Health Service Guidelines (93)25.
Historically, the nationally co-ordinated programme consisted of a study of dental decay in the milk teeth of five
year old children undertaken in alternate academic years with surveys of the permanent teeth of twelve (now
eleven) year olds and of 14 year olds undertaken at four-yearly intervals and fitting into the years between surveys
of five year olds. However, in 2006/07 academic year it was decided that there was limited value in surveying 14
year olds, mainly because of major difficulties in some areas in obtaining access to that age group. Consequently,
14 year olds have been now removed from the survey cycle.
The data relate to children attending state schools in an area. National minimum standards are set for the random
sampling of children to obtain a sample representative of the age-group in the area. Many Health Authorities
commission larger samples in order to obtain data on intra-district variations in dental caries for local planning
purposes.
139
Data are collected locally and collated by The Dental Observatory. Summary data are reported by NWPHO
(http://www.nwph.info/dentalhealth/ ) and are also available via BASCD and the society’s journal Community
Dental Health.
Statistical methods:
The national and sub-national figures for the most recent survey of 5 year olds are weighted by deprivation quintile
and, where necessary, sample size.
Interpretation of indicators:
Quality of indicator - Annex 12 describes the criteria that should be used to judge the quality of this indicator. The
application of the criteria is dependent on the context (e.g. describing a single organisation, comparing several
organisations) and the level (e.g. national / regional with large numbers of events, local with small numbers of
events) at which the data are to be used.
Due to changes in the method of obtaining consent the survey of 5 year olds conducted in 2007/08 should not be
used for backwards comparison. There is clear evidence of bias but the measurement of this is not possible and
varies from one sample to another. The source data has clear caveats about the use of this dataset and should be
referred to, along with statements made about the dataset at :
http://www.nwph.info/dentalhealth/reports/Statements_re_NHS_DEP_5_yr_olds_2007_08.pdf
Further reading:
1.
2.
NHS Dental Epidemiology Programme for England. Oral Health Survey of 5 year old Children. Summary
report. NWPHO / TDO. October 2009. Available at:
http://www.nwph.net/dentalhealth/reports/NHS_DEP_for_England_OH_Survey_5yr_2007-08_Report.pdf
Mitropoulos C, Pitts NB, Deery C. British Association for the Study of Community Dentistry. Criteria for
standard assessment of dental health. BASCD Trainers Pack for Caries Prevalence Studies 1992-93.
Dundee: University of Dundee, 1992.
Updated: August 2010
140
Oral health in children: missing teeth
Purpose:
To provide standardised, information about dental decay levels among child age cohorts using population
representative random samples.
Definition of indicator and its variants:
Mean number of teeth per child missing due to dental caries (decay) in the whole age-group, i.e. teeth which
decayed in the past and were treated by extraction.
Statistic
Mean number per child
Sex
P
Age group
5
Organisation
(see glossary)
Current
data
E, GOR, SHA, LA,
PCO
AY
2007/08
AY
2004/05
11
E&W, E, SHA, PCO
Trend
data
File-worksheet name
40B_116MNP1_08_V2
40B_116MNP2_05_V1
Numerator:
Numerator data - Number of missing teeth in the survey sample of children in the respective academic year.
Source of numerator data - NHS Dental Epidemiology Programme undertaken by Primary Care Organisations and
co-ordinated by The Dental Observatory and NWPHO with standardisation by the British Society for the Study of
Community Dentistry.
Comments on numerator data - The data for 5 year olds relate to deciduous (milk) teeth (mt), and the data for 11
year olds relate to permanent teeth (MT).
As a result of practical difficulties in some areas in accessing twelve year old children in school, a decision was
taken in 2004/05 academic year to survey eleven year olds instead. The survey still looked at decay in their
permanent teeth and, other than the change of age, indicator specifications remained the same as in previous
surveys of twelve year olds.
Currently, the North West Public Health Observatory / The Dental Observatory (NWPHO / TDO) have taken
on responsibility for the English co-ordination of dental epidemiological surveys and released 2007/08 data
for five year olds as the first data set published under their auspices. For more details see:
http://www.nwph.net/dentalhealth/
Denominator:
Denominator data - Number of children in the survey sample.
Source of denominator data - Office for National Statistics (ONS) Single Year of Age mid year estimates.
Comments on denominator data - The data source is a series of nationally co-ordinated dental epidemiological
surveys commissioned by individual Health Authorities to standardised national protocols and diagnostic standards
(see “Further reading”) and involving the dental examination of children in the specified age-group, in state
schools. The data source is part of a cycle of nationally co-ordinated dental epidemiological surveys as outlined in
Health Service Guidelines (93)25.
Historically, the nationally co-ordinated programme consisted of a study of dental decay in the milk teeth of five
year old children undertaken in alternate academic years with surveys of the permanent teeth of twelve (now
eleven) year olds and of 14 year olds undertaken at four-yearly intervals and fitting into the years between surveys
of five year olds. However, in 2006/07 academic year it was decided that there was limited value in surveying 14
year olds, mainly because of major difficulties in some areas in obtaining access to that age group. Consequently,
14 year olds have been now removed from the survey cycle.
The data relate to children attending state schools in an area. National minimum standards are set for the random
sampling of children to obtain a sample representative of the age-group in the area. Many Health Authorities
commission larger samples in order to obtain data on intra-district variations in dental caries for local planning
purposes.
141
Data are collected locally and collated by The Dental Observatory. Summary data are reported by NWPHO
(http://www.nwph.info/dentalhealth/ ) and are also available via BASCD and the society’s journal Community
Dental Health.
Statistical methods:
The national and sub-national figures for the most recent survey of 5 year olds are weighted by deprivation quintile
and, where necessary, sample size.
Interpretation of indicators:
Quality of indicator - Annex 12 describes the criteria that should be used to judge the quality of this indicator. The
application of the criteria is dependent on the context (e.g. describing a single organisation, comparing several
organisations) and the level (e.g. national / regional with large numbers of events, local with small numbers of
events) at which the data are to be used.
Due to changes in the method of obtaining consent the survey of 5 year olds conducted in 2007/08 should not be
used for backwards comparison. There is clear evidence of bias but the measurement of this is not possible and
varies from one sample to another. The source data has clear caveats about the use of this dataset and should be
referred to, along with statements made about the dataset at :
http://www.nwph.info/dentalhealth/reports/Statements_re_NHS_DEP_5_yr_olds_2007_08.pdf
Further reading:
1.
2.
NHS Dental Epidemiology Programme for England. Oral Health Survey of 5 year old Children. Summary
report. NWPHO / TDO. October 2009. Available at:
http://www.nwph.net/dentalhealth/reports/NHS_DEP_for_England_OH_Survey_5yr_2007-08_Report.pdf
Mitropoulos C, Pitts NB, Deery C. British Association for the Study of Community Dentistry. Criteria for
standard assessment of dental health. BASCD Trainers Pack for Caries Prevalence Studies 1992-93.
Dundee: University of Dundee, 1992.
Updated: August 2010
142
Oral health in children: filled teeth
Purpose:
To provide standardised, information about dental decay levels among child age cohorts using population
representative random samples.
Definition of indicator and its variants:
Mean number of filled otherwise sound teeth per child in the whole age-group, i.e. teeth which decayed in the past,
and were treated by filling, and which do not currently require further treatment.
Statistic
Mean number per child
Sex
P
Age group
5
Organisation
(see glossary)
Current
data
E, GOR, SHA, LA,
PCO
AY
2007/08
AY
2004/05
11
E&W, E, SHA, PCO
Trend
data
File-worksheet name
40C_117MNP1_08_V2
40C_117MNP2_05_V1
Numerator:
Numerator data - Number of filled teeth in the survey sample of children in the respective academic years.
Source of numerator data - NHS Dental Epidemiology Programme undertaken by Primary Care Organisations and
co-ordinated by The Dental Observatory and NWPHO with standardisation by the British Society for the Study of
Community Dentistry.
Comments on numerator data - The data for 5 year olds relate to deciduous (milk) teeth (ft), and the data for 11
year olds relate to permament teeth (FT).
As a result of practical difficulties in some areas in accessing twelve year old children in school, a decision was
taken in 2004/05 academic year to survey eleven year olds instead. The survey still looked at decay in their
permanent teeth and, other than the change of age, indicator specifications remained the same as in previous
surveys of twelve year olds.
Currently, the North West Public Health Observatory / The Dental Observatory (NWPHO / TDO) have taken
on responsibility for the English co-ordination of dental epidemiological surveys and released 2007/08 data
for five year olds as the first data set published under their auspices. For more details see:
http://www.nwph.net/dentalhealth/
Denominator:
Denominator data - Number of children in the survey sample.
Source of denominator data - Office for National Statistics (ONS) Single Year of Age mid year estimates.
Comments on denominator data - The data source is a series of nationally co-ordinated dental epidemiological
surveys commissioned by individual Health Authorities to standardised national protocols and diagnostic standards
(see “Further reading”) and involving the dental examination of children in the specified age-group, in state
schools. The data source is part of a cycle of nationally co-ordinated dental epidemiological surveys as outlined in
Health Service Guidelines (93)25.
Historically, the nationally co-ordinated programme consisted of a study of dental decay in the milk teeth of five
year old children undertaken in alternate academic years with surveys of the permanent teeth of twelve (now
eleven) year olds and of 14 year olds undertaken at four-yearly intervals and fitting into the years between surveys
of five year olds. However, in 2006/07 academic year it was decided that there was limited value in surveying 14
year olds, mainly because of major difficulties in some areas in obtaining access to that age group. Consequently,
14 year olds have been now removed from the survey cycle.
The data relate to children attending state schools in an area. National minimum standards are set for the random
sampling of children to obtain a sample representative of the age-group in the area. Many Health Authorities
commission larger samples in order to obtain data on intra-district variations in dental caries for local planning
purposes.
143
Data are collected locally and collated by The Dental Observatory. Summary data are reported by NWPHO
(http://www.nwph.info/dentalhealth/ ) and are also available via BASCD and the society’s journal Community
Dental Health.
Statistical methods:
The national and sub-national figures for the most recent survey of 5 year olds are weighted by deprivation quintile
and, where necessary, sample size.
Interpretation of indicators:
Quality of indicator - Annex 12 describes the criteria that should be used to judge the quality of this indicator. The
application of the criteria is dependent on the context (e.g. describing a single organisation, comparing several
organisations) and the level (e.g. national / regional with large numbers of events, local with small numbers of
events) at which the data are to be used.
Due to changes in the method of obtaining consent the survey of 5 year olds conducted in 2007/08 should not be
used for backwards comparison. There is clear evidence of bias but the measurement of this is not possible and
varies from one sample to another. The source data has clear caveats about the use of this dataset and should be
referred to, along with statements made about the dataset at :
http://www.nwph.info/dentalhealth/reports/Statements_re_NHS_DEP_5_yr_olds_2007_08.pdf
Further reading:
1.
2.
NHS Dental Epidemiology Programme for England. Oral Health Survey of 5 year old Children. Summary
report. NWPHO / TDO. October 2009. Available at:
http://www.nwph.net/dentalhealth/reports/NHS_DEP_for_England_OH_Survey_5yr_2007-08_Report.pdf
Mitropoulos C, Pitts NB, Deery C. British Association for the Study of Community Dentistry. Criteria for
standard assessment of dental health. BASCD Trainers Pack for Caries Prevalence Studies 1992-93.
Dundee: University of Dundee, 1992.
Updated: August 2010
144
Oral health in children: decayed/missing/filled teeth
Purpose:
To provide standardised, information about dental decay levels among child age cohorts using population
representative random samples.
Definition of indicator and its variants:
Mean number of teeth per child in the whole age-group which are either actively decayed and require treatment or
which were treated for decay either by extraction or filling, i.e. the mean number of teeth which were affected by
decay. This is a summation of the mean number of decayed/missing/filled teeth.
Statistic
Mean number per child
Sex
P
Age group
5
Organisation
(see glossary)
Current
data
E, GOR, SHA, LA,
PCO
AY
2007/08
AY
2004/05
11
E&W, E, SHA, PCO
Trend
data
File-worksheet name
40D_118MNP1_08_V2
40D_118MNP2_05_V1
Numerator:
Numerator data - Number of decayed/missing/filled teeth in the survey sample of children in the respective
academic year.
Source of numerator data - NHS Dental Epidemiology Programme undertaken by Primary Care Organisations and
co-ordinated by The Dental Observatory and NWPHO with standardisation by the British Society for the Study of
Community Dentistry.
Comments on numerator data - The data for 5 year olds relate to deciduous (milk) teeth (dmft), and the data for 11
year olds relate to permament teeth (DMFT).
As a result of practical difficulties in some areas in accessing twelve year old children in school, a decision was
taken in 2004/05 academic year to survey eleven year olds instead. The survey still looked at decay in their
permanent teeth and, other than the change of age, indicator specifications remained the same as in previous
surveys of twelve year olds.
Currently, the North West Public Health Observatory / The Dental Observatory (NWPHO / TDO) have taken
on responsibility for the English co-ordination of dental epidemiological surveys and released 2007/08 data
for five year olds as the first data set published under their auspices. For more details see:
http://www.nwph.net/dentalhealth/
Denominator:
Denominator data - Number of children in the survey sample.
Source of denominator data - Office for National Statistics (ONS) Single Year of Age mid year estimates.
Comments on denominator data - The data source is a series of nationally co-ordinated dental epidemiological
surveys commissioned by individual Health Authorities to standardised national protocols and diagnostic standards
(see “Further reading”) and involving the dental examination of children in the specified age-group, in state
schools. The data source is part of a cycle of nationally co-ordinated dental epidemiological surveys as outlined in
Health Service Guidelines (93)25.
Historically, the nationally co-ordinated programme consisted of a study of dental decay in the milk teeth of five
year old children undertaken in alternate academic years with surveys of the permanent teeth of twelve (now
eleven) year olds and of 14 year olds undertaken at four-yearly intervals and fitting into the years between surveys
of five year olds. However, in 2006/07 academic year it was decided that there was limited value in surveying 14
year olds, mainly because of major difficulties in some areas in obtaining access to that age group. Consequently,
14 year olds have been now removed from the survey cycle.
The data relate to children attending state schools in an area. National minimum standards are set for the random
sampling of children to obtain a sample representative of the age-group in the area. Many Health Authorities
commission larger samples in order to obtain data on intra-district variations in dental caries for local planning
purposes.
145
Data are collected locally and collated by The Dental Observatory. Summary data are reported by NWPHO
(http://www.nwph.info/dentalhealth/ ) and are also available via BASCD and the society’s journal Community
Dental Health.
Statistical methods:
The national and sub-national figures for the most recent survey of 5 year olds are weighted by deprivation quintile
and, where necessary, sample size.
Interpretation of indicators:
Quality of indicator - Annex 12 describes the criteria that should be used to judge the quality of this indicator. The
application of the criteria is dependent on the context (e.g. describing a single organisation, comparing several
organisations) and the level (e.g. national / regional with large numbers of events, local with small numbers of
events) at which the data are to be used.
Due to changes in the method of obtaining consent the survey of 5 year olds conducted in 2007/08 should not be
used for backwards comparison. There is clear evidence of bias but the measurement of this is not possible and
varies from one sample to another. The source data has clear caveats about the use of this dataset and should be
referred to, along with statements made about the dataset at :
http://www.nwph.info/dentalhealth/reports/Statements_re_NHS_DEP_5_yr_olds_2007_08.pdf
Further reading:
1.
2.
NHS Dental Epidemiology Programme for England. Oral Health Survey of 5 year old Children. Summary
report. NWPHO / TDO. October 2009. Available at:
http://www.nwph.net/dentalhealth/reports/NHS_DEP_for_England_OH_Survey_5yr_2007-08_Report.pdf
Mitropoulos C, Pitts NB, Deery C. British Association for the Study of Community Dentistry. Criteria for
standard assessment of dental health. BASCD Trainers Pack for Caries Prevalence Studies 1992-93.
Dundee: University of Dundee, 1992.
Updated: August 2010
146
Oral health in children: experience of dental decay
Purpose:
To provide standardised, information about dental decay levels among child age cohorts using population
representative random samples.
Definition of indicator and its variants:
The percentage of children in the whole age-group with any decayed/missing/filled teeth i.e. the proportion of
children with a dmft/DMFT score greater than zero, and therefore some experience of dental decay.
Statistic
Percent of children with
dmft/DMFT>0
Sex
P
Age group
5
Organisation
(see glossary)
Current
data
E, GOR, SHA, LA,
PCO
AY
2007/08
AY
2004/05
11
E&W, E, SHA, PCO
Trend
data
File-worksheet name
40E_119PCP1_08_V2
40E_119PCP2_05_V1
Numerator:
Numerator data - Number of children with decayed/missing/filled teeth in the survey sample of children i.e.
dmft/DMFT > 0 in the respective academic year.
Source of numerator data - NHS Dental Epidemiology Programme undertaken by Primary Care Organisations and
co-ordinated by The Dental Observatory and NWPHO with standardisation by the British Society for the Study of
Community Dentistry.
Comments on numerator data - The data for 5 year olds relate to deciduous (milk) teeth (dmft), and the data for 11
year olds relate to permament teeth (DMFT).
As a result of practical difficulties in some areas in accessing twelve year old children in school, a decision was
taken in 2004/05 academic year to survey eleven year olds instead. The survey still looked at decay in their
permanent teeth and, other than the change of age, indicator specifications remained the same as in previous
surveys of twelve year olds.
Currently, the North West Public Health Observatory / The Dental Observatory (NWPHO / TDO) have taken
on responsibility for the English co-ordination of dental epidemiological surveys and released 2007/08 data
for five year olds as the first data set published under their auspices. For more details see:
http://www.nwph.net/dentalhealth/
Denominator:
Denominator data - Number of children in the survey sample.
Source of denominator data - Office for National Statistics (ONS) Single Year of Age mid year estimates.
Comments on denominator data - The data source is a series of nationally co-ordinated dental epidemiological
surveys commissioned by individual Health Authorities to standardised national protocols and diagnostic standards
(see “Further reading”) and involving the dental examination of children in the specified age-group, in state
schools. The data source is part of a cycle of nationally co-ordinated dental epidemiological surveys as outlined in
Health Service Guidelines (93)25.
Historically, the nationally co-ordinated programme consisted of a study of dental decay in the milk teeth of five
year old children undertaken in alternate academic years with surveys of the permanent teeth of twelve (now
eleven) year olds and of 14 year olds undertaken at four-yearly intervals and fitting into the years between surveys
of five year olds. However, in 2006/07 academic year it was decided that there was limited value in surveying 14
year olds, mainly because of major difficulties in some areas in obtaining access to that age group. Consequently,
14 year olds have been now removed from the survey cycle.
The data relate to children attending state schools in an area. National minimum standards are set for the random
sampling of children to obtain a sample representative of the age-group in the area. Many Health Authorities
commission larger samples in order to obtain data on intra-district variations in dental caries for local planning
purposes.
147
Data are collected locally and collated by The Dental Observatory. Summary data are reported by NWPHO
(http://www.nwph.info/dentalhealth/ ) and are also available via BASCD and the society’s journal Community
Dental Health.
Statistical methods:
The national and sub-national figures for the most recent survey of 5 year olds are weighted by deprivation quintile
and, where necessary, sample size.
Interpretation of indicators:
Quality of indicator - Annex 12 describes the criteria that should be used to judge the quality of this indicator. The
application of the criteria is dependent on the context (e.g. describing a single organisation, comparing several
organisations) and the level (e.g. national / regional with large numbers of events, local with small numbers of
events) at which the data are to be used.
Due to changes in the method of obtaining consent the survey of 5 year olds conducted in 2007/08 should not be
used for backwards comparison. There is clear evidence of bias but the measurement of this is not possible and
varies from one sample to another. The source data has clear caveats about the use of this dataset and should be
referred to, along with statements made about the dataset at :
http://www.nwph.info/dentalhealth/reports/Statements_re_NHS_DEP_5_yr_olds_2007_08.pdf
Further reading:
1.
2.
NHS Dental Epidemiology Programme for England. Oral Health Survey of 5 year old Children. Summary
report. NWPHO / TDO. October 2009. Available at:
http://www.nwph.net/dentalhealth/reports/NHS_DEP_for_England_OH_Survey_5yr_2007-08_Report.pdf
Mitropoulos C, Pitts NB, Deery C. British Association for the Study of Community Dentistry. Criteria for
standard assessment of dental health. BASCD Trainers Pack for Caries Prevalence Studies 1992-93.
Dundee: University of Dundee, 1992.
Updated: August 2010
148
Oral health in children: percentage with decayed teeth
Purpose:
To provide standardised, information about dental decay levels among child age cohorts using population
representative random samples.
Definition of indicator and its variants:
The percentage of children in the whole age-group who have active dental decay, i.e. the proportion of children
requiring treatment.
Statistic
Percent of children with
dt/DT>0
Sex
P
Age group
5
Organisation
(see glossary)
Current
data
E, GOR, SHA, LA,
PCO
AY
2007/08
AY
2004/05
11
E&W, E, SHA, PCO
Trend
data
File-worksheet name
40F_120PCP1_08_V2
40F_120PCP2_05_V1
Numerator:
Numerator data - Number of children with decayed teeth in the survey sample of children i.e. dt/DT > 0 in the
respective academic year.
Source of numerator data - NHS Dental Epidemiology Programme undertaken by Primary Care Organisations and
co-ordinated by The Dental Observatory and NWPHO with standardisation by the British Society for the Study of
Community Dentistry.
Comments on numerator data - The data for 5 year olds relate to deciduous (milk) teeth (dt), and the data for 11
year olds relate to permament teeth (DT).
As a result of practical difficulties in some areas in accessing twelve year old children in school, a decision was
taken in 2004/05 academic year to survey eleven year olds instead. The survey still looked at decay in their
permanent teeth and, other than the change of age, indicator specifications remained the same as in previous
surveys of twelve year olds.
Currently, the North West Public Health Observatory / The Dental Observatory (NWPHO / TDO) have taken
on responsibility for the English co-ordination of dental epidemiological surveys and released 2007/08 data
for five year olds as the first data set published under their auspices. For more details see:
http://www.nwph.net/dentalhealth/
Denominator:
Denominator data - Number of children in the survey sample.
Source of denominator data - Office for National Statistics (ONS) Single Year of Age mid year estimates.
Comments on denominator data - The data source is a series of nationally co-ordinated dental epidemiological
surveys commissioned by individual Health Authorities to standardised national protocols and diagnostic standards
(see “Further reading”) and involving the dental examination of children in the specified age-group, in state
schools. The data source is part of a cycle of nationally co-ordinated dental epidemiological surveys as outlined in
Health Service Guidelines (93)25.
Historically, the nationally co-ordinated programme consisted of a study of dental decay in the milk teeth of five
year old children undertaken in alternate academic years with surveys of the permanent teeth of twelve (now
eleven) year olds and of 14 year olds undertaken at four-yearly intervals and fitting into the years between surveys
of five year olds. However, in 2006/07 academic year it was decided that there was limited value in surveying 14
year olds, mainly because of major difficulties in some areas in obtaining access to that age group. Consequently,
14 year olds have been now removed from the survey cycle.
The data relate to children attending state schools in an area. National minimum standards are set for the random
sampling of children to obtain a sample representative of the age-group in the area. Many Health Authorities
commission larger samples in order to obtain data on intra-district variations in dental caries for local planning
purposes.
149
Data are collected locally and collated by The Dental Observatory. Summary data are reported by NWPHO
(http://www.nwph.info/dentalhealth/ ) and are also available via BASCD and the society’s journal Community
Dental Health.
Statistical methods:
The national and sub-national figures for the most recent survey of 5 year olds are weighted by deprivation quintile
and, where necessary, sample size.
Interpretation of indicators:
Quality of indicator - Annex 12 describes the criteria that should be used to judge the quality of this indicator. The
application of the criteria is dependent on the context (e.g. describing a single organisation, comparing several
organisations) and the level (e.g. national / regional with large numbers of events, local with small numbers of
events) at which the data are to be used.
Due to changes in the method of obtaining consent the survey of 5 year olds conducted in 2007/08 should not be
used for backwards comparison. There is clear evidence of bias but the measurement of this is not possible and
varies from one sample to another. The source data has clear caveats about the use of this dataset and should be
referred to, along with statements made about the dataset at :
http://www.nwph.info/dentalhealth/reports/Statements_re_NHS_DEP_5_yr_olds_2007_08.pdf
Further reading:
1.
2.
NHS Dental Epidemiology Programme for England. Oral Health Survey of 5 year old Children. Summary
report. NWPHO / TDO. October 2009. Available at:
http://www.nwph.net/dentalhealth/reports/NHS_DEP_for_England_OH_Survey_5yr_2007-08_Report.pdf
Mitropoulos C, Pitts NB, Deery C. British Association for the Study of Community Dentistry. Criteria for
standard assessment of dental health. BASCD Trainers Pack for Caries Prevalence Studies 1992-93.
Dundee: University of Dundee, 1992.
Updated: August 2010
150
Oral health in children: decayed teeth in children with active dental decay
Purpose:
To provide standardised, information about dental decay levels among child age cohorts using population
representative random samples.
Definition of indicator and its variants:
The mean number of actively decayed teeth only in those children who have active decay, i.e. the mean number of
teeth requiring treatment for decay in those children who currently require treatment.
Statistic
Mean number per child
Sex
P
Age group
5
Organisation
(see glossary)
Current
data
E, GOR, SHA, LA,
PCO
AY
2007/08
AY
2004/05
11
E&W, E, SHA, PCO
Trend
data
File-worksheet name
40G_121MNP1_08_V2
40G_121MNP2_05_V1
Numerator:
Numerator data - Number of decayed teeth in the survey sample of children in the the respective academic year.
Source of numerator data - NHS Dental Epidemiology Programme undertaken by Primary Care Organisations and
co-ordinated by The Dental Observatory and NWPHO with standardisation by the British Society for the Study of
Community Dentistry.
Comments on numerator data - The data for 5 year olds relate to deciduous (milk) teeth (dt), and the data for 11
year olds relate to permament teeth (DT).
As a result of practical difficulties in some areas in accessing twelve year old children in school, a decision was
taken in 2004/05 academic year to survey eleven year olds instead. The survey still looked at decay in their
permanent teeth and, other than the change of age, indicator specifications remained the same as in previous
surveys of twelve year olds.
Currently, the North West Public Health Observatory / The Dental Observatory (NWPHO / TDO) have taken
on responsibility for the English co-ordination of dental epidemiological surveys and released 2007/08 data
for five year olds as the first data set published under their auspices. For more details see:
http://www.nwph.net/dentalhealth/
Denominator:
Denominator data - Number of children with decayed teeth in the survey sample of children i.e. dt/DT > 0.
Source of denominator data - Office for National Statistics (ONS) Single Year of Age mid year estimates.
Comments on denominator data - The data source is a series of nationally co-ordinated dental epidemiological
surveys commissioned by individual Health Authorities to standardised national protocols and diagnostic standards
(see “Further reading”) and involving the dental examination of children in the specified age-group, in state
schools. The data source is part of a cycle of nationally co-ordinated dental epidemiological surveys as outlined in
Health Service Guidelines (93)25.
Historically, the nationally co-ordinated programme consisted of a study of dental decay in the milk teeth of five
year old children undertaken in alternate academic years with surveys of the permanent teeth of twelve (now
eleven) year olds and of 14 year olds undertaken at four-yearly intervals and fitting into the years between surveys
of five year olds. However, in 2006/07 academic year it was decided that there was limited value in surveying 14
year olds, mainly because of major difficulties in some areas in obtaining access to that age group. Consequently,
14 year olds have been now removed from the survey cycle.
The data relate to children attending state schools in an area. National minimum standards are set for the random
sampling of children to obtain a sample representative of the age-group in the area. Many Health Authorities
commission larger samples in order to obtain data on intra-district variations in dental caries for local planning
purposes.
151
Data are collected locally and collated by The Dental Observatory. Summary data are reported by NWPHO
(http://www.nwph.info/dentalhealth/ ) and are also available via BASCD and the society’s journal Community
Dental Health.
Statistical methods:
The national and sub-national figures for the most recent survey of 5 year olds are weighted by deprivation quintile
and, where necessary, sample size.
Interpretation of indicators:
Quality of indicator - Annex 12 describes the criteria that should be used to judge the quality of this indicator. The
application of the criteria is dependent on the context (e.g. describing a single organisation, comparing several
organisations) and the level (e.g. national / regional with large numbers of events, local with small numbers of
events) at which the data are to be used.
Due to changes in the method of obtaining consent the survey of 5 year olds conducted in 2007/08 should not be
used for backwards comparison. There is clear evidence of bias but the measurement of this is not possible and
varies from one sample to another. The source data has clear caveats about the use of this dataset and should be
referred to, along with statements made about the dataset at :
http://www.nwph.info/dentalhealth/reports/Statements_re_NHS_DEP_5_yr_olds_2007_08.pdf
Further reading:
1.
2.
NHS Dental Epidemiology Programme for England. Oral Health Survey of 5 year old Children. Summary
report. NWPHO / TDO. October 2009. Available at:
http://www.nwph.net/dentalhealth/reports/NHS_DEP_for_England_OH_Survey_5yr_2007-08_Report.pdf
Mitropoulos C, Pitts NB, Deery C. British Association for the Study of Community Dentistry. Criteria for
standard assessment of dental health. BASCD Trainers Pack for Caries Prevalence Studies 1992-93.
Dundee: University of Dundee, 1992.
Updated: August 2010
152
Oral health in children: decayed/missing/filled teeth in children with dental decay
Purpose:
To provide standardised, information about dental decay levels among child age cohorts using population
representative random samples.
Definition of indicator and its variants:
The mean number of teeth which are either actively decayed and require treatment or which have been treated for
decay by filling or extraction only in those children who have some experience of dental decay, i.e. the total dental
decay experience (current and past) in children who have had some dental decay experience.
Statistic
Mean number per child
Sex
P
Age group
5
Organisation
(see glossary)
Current
data
E, GOR, SHA, LA,
PCO
AY
2007/08
AY
2004/05
11
E&W, E, SHA, PCO
Trend
data
File-worksheet name
40H_122MNP1_08_V2
40H_122MNP2_05_V1
Numerator:
Numerator data - Number of decayed/missing/filled teeth in the survey sample of children in the respective
academic year.
Source of numerator data - NHS Dental Epidemiology Programme undertaken by Primary Care Organisations and
co-ordinated by The Dental Observatory and NWPHO with standardisation by the British Society for the Study of
Community Dentistry.
Comments on numerator data - The data for 5 year olds relate to deciduous (milk) teeth (dmft), and the data for 11
year olds relate to permament teeth (DMFT).
As a result of practical difficulties in some areas in accessing twelve year old children in school, a decision was
taken in 2004/05 academic year to survey eleven year olds instead. The survey still looked at decay in their
permanent teeth and, other than the change of age, indicator specifications remained the same as in previous
surveys of twelve year olds.
Currently, the North West Public Health Observatory / The Dental Observatory (NWPHO / TDO) have taken
on responsibility for the English co-ordination of dental epidemiological surveys and released 2007/08 data
for five year olds as the first data set published under their auspices. For more details see:
http://www.nwph.net/dentalhealth/
Denominator:
Denominator data - Number of children with decayed/missing/filled teeth in the survey sample of children i.e.
dmft/DMFT > 0.
Source of denominator data - Office for National Statistics (ONS) Single Year of Age mid year estimates.
Comments on denominator data - The data source is a series of nationally co-ordinated dental epidemiological
surveys commissioned by individual Health Authorities to standardised national protocols and diagnostic standards
(see “Further reading”) and involving the dental examination of children in the specified age-group, in state
schools. The data source is part of a cycle of nationally co-ordinated dental epidemiological surveys as outlined in
Health Service Guidelines (93)25.
Historically, the nationally co-ordinated programme consisted of a study of dental decay in the milk teeth of five
year old children undertaken in alternate academic years with surveys of the permanent teeth of twelve (now
eleven) year olds and of 14 year olds undertaken at four-yearly intervals and fitting into the years between surveys
of five year olds. However, in 2006/07 academic year it was decided that there was limited value in surveying 14
year olds, mainly because of major difficulties in some areas in obtaining access to that age group. Consequently,
14 year olds have been now removed from the survey cycle.
The data relate to children attending state schools in an area. National minimum standards are set for the random
sampling of children to obtain a sample representative of the age-group in the area. Many Health Authorities
commission larger samples in order to obtain data on intra-district variations in dental caries for local planning
purposes.
153
Data are collected locally and collated by The Dental Observatory. Summary data are reported by NWPHO
(http://www.nwph.info/dentalhealth/ ) and are also available via BASCD and the society’s journal Community
Dental Health.
Statistical methods:
The national and sub-national figures for the most recent survey of 5 year olds are weighted by deprivation quintile
and, where necessary, sample size.
Interpretation of indicators:
Quality of indicator - Annex 12 describes the criteria that should be used to judge the quality of this indicator. The
application of the criteria is dependent on the context (e.g. describing a single organisation, comparing several
organisations) and the level (e.g. national / regional with large numbers of events, local with small numbers of
events) at which the data are to be used.
Due to changes in the method of obtaining consent the survey of 5 year olds conducted in 2007/08 should not be
used for backwards comparison. There is clear evidence of bias but the measurement of this is not possible and
varies from one sample to another. The source data has clear caveats about the use of this dataset and should be
referred to, along with statements made about the dataset at :
http://www.nwph.info/dentalhealth/reports/Statements_re_NHS_DEP_5_yr_olds_2007_08.pdf
Further reading:
1.
2.
NHS Dental Epidemiology Programme for England. Oral Health Survey of 5 year old Children. Summary
report. NWPHO / TDO. October 2009. Available at:
http://www.nwph.net/dentalhealth/reports/NHS_DEP_for_England_OH_Survey_5yr_2007-08_Report.pdf
Mitropoulos C, Pitts NB, Deery C. British Association for the Study of Community Dentistry. Criteria for
standard assessment of dental health. BASCD Trainers Pack for Caries Prevalence Studies 1992-93.
Dundee: University of Dundee, 1992.
Updated: August 2010
154
Oral health in children: the Care index
Purpose:
To provide standardised, information about dental decay levels among child age cohorts using population
representative random samples.
Definition of indicator and its variants:
The percentage of teeth previously decayed or currently decayed that were treated by filling, i.e. an index of the
extent to which dental decay has been successfully treated by restorative techniques.
Statistic
Filled teeth as percent of
decayed/missing/filled teeth
Sex
P
Age group
5
Organisation
(see glossary)
Current
data
E, GOR, SHA, LA,
PCO
AY
2007/08
AY
2004/05
11
E&W, E, SHA, PCO
Trend
data
File-worksheet name
40I_123PCP1_08_V2
40I_123PCP2_05_V1
Numerator:
Numerator data - Number of filled teeth in the survey sample of children in the respective academic year.
Source of numerator data - NHS Dental Epidemiology Programme undertaken by Primary Care Organisations and
co-ordinated by The Dental Observatory and NWPHO with standardisation by the British Society for the Study of
Community Dentistry.
Comments on numerator data - The data for 5 year olds relate to deciduous (milk) teeth (ft), and the data for 11
year olds relate to permament teeth (FT).
As a result of practical difficulties in some areas in accessing twelve year old children in school, a decision was
taken in 2004/05 academic year to survey eleven year olds instead. The survey still looked at decay in their
permanent teeth and, other than the change of age, indicator specifications remained the same as in previous
surveys of twelve year olds.
Currently, the North West Public Health Observatory / The Dental Observatory (NWPHO / TDO) have taken
on responsibility for the English co-ordination of dental epidemiological surveys and released 2007/08 data
for five year olds as the first data set published under their auspices. For more details see:
http://www.nwph.net/dentalhealth/
Denominator:
Denominator data - Number of decayed/missing/filled teeth in the survey sample of children.
Source of denominator data - Office for National Statistics (ONS) Single Year of Age mid year estimates.
Comments on denominator data - The data source is a series of nationally co-ordinated dental epidemiological
surveys commissioned by individual Health Authorities to standardised national protocols and diagnostic standards
(see “Further reading”) and involving the dental examination of children in the specified age-group, in state
schools. The data source is part of a cycle of nationally co-ordinated dental epidemiological surveys as outlined in
Health Service Guidelines (93)25.
Historically, the nationally co-ordinated programme consisted of a study of dental decay in the milk teeth of five
year old children undertaken in alternate academic years with surveys of the permanent teeth of twelve (now
eleven) year olds and of 14 year olds undertaken at four-yearly intervals and fitting into the years between surveys
of five year olds. However, in 2006/07 academic year it was decided that there was limited value in surveying 14
year olds, mainly because of major difficulties in some areas in obtaining access to that age group. Consequently,
14 year olds have been now removed from the survey cycle.
The data relate to children attending state schools in an area. National minimum standards are set for the random
sampling of children to obtain a sample representative of the age-group in the area. Many Health Authorities
commission larger samples in order to obtain data on intra-district variations in dental caries for local planning
purposes.
155
Data are collected locally and collated by The Dental Observatory. Summary data are reported by NWPHO
(http://www.nwph.info/dentalhealth/ ) and are also available via BASCD and the society’s journal Community
Dental Health.
Statistical methods:
The national and sub-national figures for the most recent survey of 5 year olds are weighted by deprivation quintile
and, where necessary, sample size.
Interpretation of indicators:
Quality of indicator - Annex 12 describes the criteria that should be used to judge the quality of this indicator. The
application of the criteria is dependent on the context (e.g. describing a single organisation, comparing several
organisations) and the level (e.g. national / regional with large numbers of events, local with small numbers of
events) at which the data are to be used.
Due to changes in the method of obtaining consent the survey of 5 year olds conducted in 2007/08 should not be
used for backwards comparison. There is clear evidence of bias but the measurement of this is not possible and
varies from one sample to another. The source data has clear caveats about the use of this dataset and should be
referred to, along with statements made about the dataset at :
http://www.nwph.info/dentalhealth/reports/Statements_re_NHS_DEP_5_yr_olds_2007_08.pdf
Further reading:
1.
2.
NHS Dental Epidemiology Programme for England. Oral Health Survey of 5 year old Children. Summary
report. NWPHO / TDO. October 2009. Available at:
http://www.nwph.net/dentalhealth/reports/NHS_DEP_for_England_OH_Survey_5yr_2007-08_Report.pdf
Mitropoulos C, Pitts NB, Deery C. British Association for the Study of Community Dentistry. Criteria for
standard assessment of dental health. BASCD Trainers Pack for Caries Prevalence Studies 1992-93.
Dundee: University of Dundee, 1992.
Updated: August 2010
156
Fertility
Purpose:
To measure fertility.
Definition of indicator and its variants:
The general fertility rate is the number of live births per 1,000 females of childbearing age between 15-44.
Statistic
Sex
Age group
Organisation
(see glossary)
Current
data
Trend
data
File-worksheet name
Number of live births by
maternal age
F
05A_079NO_08_V1
F
E&W, E,GOR, ONS
area, SHA, LA,
PCO, CTY
E&W, E,GOR, ONS
area, SHA, LA,
PCO, CTY
2008
General fertility rate
11+, 11-15, 1619, 20-24, 25-34,
35-39, 40+
11-49
2008
05A_079CR_08_V1
Total period fertility rate
(TPFR)
F
11-49
E&W, E,GOR, ONS
area, SHA, LA,
PCO, CTY
2008
05A_079DR_08_V1
Numerator:
Numerator data - Live births occurring to females aged 11 years and over in the respective calendar year.
Source of numerator data – Office for National Statistics (ONS).
Comments on numerator data - None.
Denominator:
Denominator data - 2001 Census based mid-year female population estimates (aged 15-44) for the respective
calendar year.
Source of denominator data - ONS.
Comments on denominator data - The population figures used are ONS mid-year estimates for 2007 derived from
the 2001 Census, with allowance for subsequent births, deaths, migration, and ageing of the population.
The figures for general and total period fertility rates may differ from those published by ONS in VS1, which were
computed using population figures for a previous year.
Statistical methods:
The total period fertility rate is calculated as the sum of the age-specific fertility rates (five-year age groups)
between ages 15-44, multiplied by 5. For the first and last age groups the numerators are taken as births to
women aged under 20, and births to women aged 40 and over, respectively. In calculating general fertility rates, it
is assumed that births are occurring to females aged 11-49. This is because births to women over 49 are very
rare.
Interpretation of indicators:
Quality of indicator - Annex 12 describes the criteria that should be used to judge the quality of this indicator. The
application of the criteria is dependent on the context (e.g. describing a single organisation, comparing several
organisations) and the level (e.g. national / regional with large numbers of events, local with small numbers of
events) at which the data are to be used.
Further reading:
1.
2.
Office for National Statistics. Statistical Bulletin - Births and deaths in England and Wales, 2008. May 2009.
Available at: http://www.statistics.gov.uk/pdfdir/bdths0509.pdf
Department of Health. National Service Framework for Children, Young People and Maternity Services –
Emerging findings. London: Department of Health, 2003.
157
3.
4.
Department of Health. National Service Framework for Children, Young People and Maternity Services –
Standard for Hospital Services. London: Department of Health, 2003.
Troop P, Goldacre M, Mason A, Cleary R (eds). Health Outcome Indicators: Normal Pregnancy and Childbirth.
Report of a working group to the Department of Health. Oxford: National Centre for Health Outcomes
Development, 1999. Available at http://nchod.uhce.ox.ac.uk/pregnancy.pdf
Updated: December 2009
158
Live births in NHS hospitals
Purpose:
To measure what proportion of births occur in NHS hospitals.
Definition of indicator and its variants:
Proportion of all live births which occur in NHS hospitals (and additionally in non-NHS hospitals and at home).
Statistic
Percent
Sex
F
Age group
11+
Organisation
(see glossary)
Current
data
E&W, E, GOR, ONS
area, SHA, LA,
PCO, CTY
2008
Trend
data
File-worksheet name
05B_143PC_08_V1
Numerator:
Numerator data - Number of live births occurring in NHS hospitals and additionally in non-NHS hospitals and at
home in the respective calendar year.
Source of numerator data - Office for National Statistics (ONS).
Comments on numerator data - None.
Denominator:
Denominator data - All live births occurring in the respective calendar year.
Source of denominator data - ONS.
Comments on denominator data - None.
Interpretation of indicators:
Quality of indicator - Annex 12 describes the criteria that should be used to judge the quality of this indicator. The
application of the criteria is dependent on the context (e.g. describing a single organisation, comparing several
organisations) and the level (e.g. national / regional with large numbers of events, local with small numbers of
events) at which the data are to be used.
Further reading:
1.
2.
3.
Department of Health. National Service Framework for Children, Young People and Maternity Services –
Emerging findings. London: Department of Health, 2003.
Department of Health. National Service Framework for Children, Young People and Maternity Services –
Standard for Hospital Services. London: Department of Health, 2003.
Troop P, Goldacre M, Mason A, Cleary R (eds). Health Outcome Indicators: Normal Pregnancy and Childbirth
- Report of a working group to the Department of Health. Oxford: National Centre for Health Outcomes
Development, 1999. Available at http://nchod.uhce.ox.ac.uk/pregnancy.pdf
Updated: December 2009
159
Conceptions
Purpose:
To reduce the number of unwanted pregnancies, particularly in young girls.
Definition of indicator and its variants:
Estimates of conceptions (excluding pregnancies leading to spontaneous abortions), based on pregnancies which
lead to a maternity at which one or more live or still births occurs and is registered in England and Wales, or a
termination of pregnancy by abortion under the 1967 Act in England and Wales.
Statistic
Number and rate per 1,000
Sex
F
Age group
<16,
<18
Organisation
(see glossary)
Current
data
Trend
data
File-worksheet name
E&W, E, GOR,
2005-07
SHA, LA, CTY
E&W, E, GOR, ONS
area, SHA, LA,
PCO, CTY
2005
2006
2007
05C_138CRP1_07_V1
05C_138CRP2_07_V1
Numerator:
Numerator data - Number of conceptions estimated to have occurred based on birth registrations and legal
terminations of pregnancy recorded in the respective calendar years, in these plus the following year (e.g. 20012003 estimates are based on 2001-2004 registrations).
Source of numerator data - Office for National Statistics (ONS).
Comments on numerator data - Office for National Statistics estimates of conceptions for under 16 and under 18
year olds, i.e. in females aged 15 and younger, and 17 and younger, respectively (excluding pregnancies leading
to spontaneous abortions), based on pregnancies which lead to a maternity at which one or more live or still birth
occurs and is registered in England and Wales, or a termination of pregnancy by abortion under the 1967 Act in
England and Wales.
Estimation of conception dates: Dates of conception are not directly available from birth registrations and abortion
records. To identify the age group and year in which a conception occurs, the date of conception is estimated as
follows:
a) Maternities (one or more live births): 38 weeks is assumed (no gestation is recorded at live birth registration);
b) Maternities (all stillbirths): Recorded gestation less 2 weeks (recorded gestation is time since last menstrual
period; conception is assumed to occur 2 weeks after);
c) Abortions under the 1967 Act: Recorded gestation less 2 weeks (recorded gestation is time since last menstrual
period; conception is assumed to occur 2 weeks after).
Age at conception is derived from the mother's date of birth and the estimated date of conception. The Office for
National Statistics has recently amended the method it uses to estimate age at conception. The changes are small
and revised figures are similar to those previously published. The numerator data in this indicator are based on the
amended method. Full details of the minor revisions are given in an article in Population Trends 97 which is
available from the Stationery Office.
Denominator:
Denominator data - 2001 Census based mid-year population estimates for ages 13-15 and 15-17 for the
respective calendar years.
Source of denominator data - ONS.
Comments on denominator data - The population figures used are Office for National Statistics revised mid-year
estimates for 2005-07 derived from the 2001 Census, with allowance for subsequent births, deaths, migration, and
ageing of the population.
Statistical methods:
In calculating conception rates for under 16 and under 18 year olds (including all under 16s), the populations relate
to the ages 13-15 and 15-17 years respectively. In the latter case, a three-year age group only is used as the
160
denominator in the calculation. The reason for this is that the vast majority of conceptions to under 18 year olds
occur in this age group. Only about 5% of under 18 conceptions are to girls aged 14 or under and to include
younger age groups in the base population would produce misleading results. The 15-17 group is effectively
treated as the “population at risk”.
Interpretation of indicators:
Quality of indicator - Annex 12 describes the criteria that should be used to judge the quality of this indicator. The
application of the criteria is dependent on the context (e.g. describing a single organisation, comparing several
organisations) and the level (e.g. national / regional with large numbers of events, local with small numbers of
events) at which the data are to be used.
Further reading:
1.
2.
3.
4.
National Statistics. Conception statistics. Conceptions for women resident in England and Wales, 2007.
Newport: Office for National Statistics, 2009. Available at:
http://www.statistics.gov.uk/downloads/theme_health/conceptions2007/ConceptionsARV2007.pdf
National Statistics. Conception rate increases among under 18s, News Release, 26 February 2009. Available
at: http://www.statistics.gov.uk/pdfdir/hsq0209.pdf
National Statistics. Conception statistics. Conceptions for women resident in England and Wales, 2005.
Newport: Office for National Statistics, 2007. Available at:
http://www.statistics.gov.uk/downloads/theme_health/Conceptions2005/Conceptions2005.pdf
Griffiths C and Kirby L. Geographic variations in conceptions to women aged under 18 in Great Britain during
the 1990s. Office for National Statistics Population Trends, Vol 102; 2000: 13-23.
Updated: December 2009
161
Abortions
Purpose:
To reduce the number of unwanted pregnancies.
Definition of indicator and its variants:
Legal terminations of pregnancy.
The abortion rate is the number of abortions (NHS and private) per 1,000 women aged 11-49.
The total period abortion rate is the average number of abortions (NHS and private) that would occur per woman in
an area, if women experienced the current age-specific abortion rates of that area throughout their childbearing
ages.
Statistic
Sex
Number and rate per 1,000
women by maternal age
F
Number and rate for age under
16 per 1,000 girls
F
Total period abortion rate
(TPAR)
F
Age group
Organisation
(see glossary)
All ages, <18,
E&W, E, GOR,
18-19, <20, 20- SHA, PCO
24, 25-29, 30-34,
35+
<16
E&W, E, GOR,
SHA, PCO
11-49
E&W, E, GOR,
SHA, PCO
Current
data
Trend
data
File-worksheet name
2008
05D_139CRP1_08_V1
2006-08
05D_139CRP2_08_V1
2008
05D_139DR_08_V1
Numerator:
Numerator data - Number of abortions (NHS and private) to females aged 11 years and over in the respective
calendar year.
Source of numerator data - Department of Health.
Comments on numerator data - Figures for abortions were derived from notification forms returned to the Chief
Medical Officer.
Abortion data provided in the Compendium have been disclosure controlled at source. For more information and
guidance on disclosure issues related to abortion statistics see the advisory report available at
http://www.statistics.gov.uk/downloads/theme_health/abortion_stag_final.pdf
Denominator:
Denominator data - 2001 Census based mid-year female population (aged 11-49) estimates for the respective
calendar year.
Source of denominator data - Office for National Statistics (ONS).
Comments on denominator data - The population figures used are ONS mid-year estimates for 2008 derived from
the 2001 Census with allowance for subsequent births, deaths, migration, and ageing of the population.
Statistical methods:
In calculating abortion rates for all ages, under 18 and 35 and over, the population denominators used now are 1544, 15-17 and 35-44 respectively which is in line with the rates published by the Department of Health (see Further
reading: Statistical Bulletin 2005, footnote in Table 10b). Please note that in the previous Compendia rates for all
ages, under 18 and 35 and over were based on populations 11-49, 11-17 and 35-49 respectively therefore they
are not comparable with the rates currently published.
The total period abortion rate (TPAR) is calculated by multiplying the age-specific abortion rates by the respective
number of years in the age group, and summing the results. The age groups used are: 11-17, 18-19, 20-24, 25-29,
30-34 and 35-49.
162
Interpretation of indicators:
Quality of indicator - Annex 12 describes the criteria that should be used to judge the quality of this indicator. The
application of the criteria is dependent on the context (e.g. describing a single organisation, comparing several
organisations) and the level (e.g. national / regional with large numbers of events, local with small numbers of
events) at which the data are to be used.
Further reading:
1.
2.
3.
4.
Government Statistical Service. Statistical Bulletin - Abortion Statistics, England and Wales: 2008. Bulletin
2009/01 London: Government Statistical Service, 2009. Available at:
http://www.dh.gov.uk/prod_consum_dh/groups/dh_digitalassets/documents/digitalasset/dh_099714.pdf
Government Statistical Service. Statistical Bulletin - Abortion Statistics, England and Wales: 2006. Bulletin
2007/01 London: Government Statistical Service, 2007. Available at:
http://www.dh.gov.uk/en/Publicationsandstatistics/Publications/PublicationsStatistics/DH_075697
Government Statistical Service. Statistical Bulletin - Abortion Statistics, England and Wales: 2005. Bulletin
2006/01 London: Government Statistical Service, 2006. Available at:
http://www.dh.gov.uk/assetRoot/04/13/68/59/04136859.pdf
Government Statistical Service. Statistical Bulletin - Abortion Statistics, England and Wales: 2004. Bulletin
2005/11 London: Government Statistical Service, 2005. Available at:
http://www.dh.gov.uk/assetRoot/04/11/75/74/04117574.pdf
Updated: October 2009
163
Abortions by gestational age
Purpose:
To reduce the number of late abortions.
Definition of indicator and its variants:
Legal terminations of pregnancy by gestational age (under 10 weeks, 9-12 weeks, 13 weeks and over).
Statistic
Percent
Sex
F
Age group
All ages
Organisation
(see glossary)
E&W, E, GOR,
SHA, PCO
Current
data
Trend
data
2008
File-worksheet name
05E_140PC_08_V1
Numerator:
Numerator data - Number of abortions (NHS and private) in the respective calendar year carried out at 0-9 weeks,
10-12 weeks and 13 weeks or more.
Source of numerator data - Department of Health.
Comments on numerator data - Figures for abortions were derived from notification forms returned to the Chief
Medical Officer.
Abortion data provided in the Compendium have been disclosure controlled at source. For more information and
guidance on disclosure issues related to abortion statistics see the advisory report available at
http://www.statistics.gov.uk/downloads/theme_health/abortion_stag_final.pdf
Denominator:
Denominator data - Total abortions (NHS and private) with stated gestation weeks in the respective calendar year.
Source of denominator data - Office for National Statistics (ONS).
Comments on denominator data - The total figures do not include “Not Stated” gestation weeks.
Interpretation of indicators:
Quality of indicator - Annex 12 describes the criteria that should be used to judge the quality of this indicator. The
application of the criteria is dependent on the context (e.g. describing a single organisation, comparing several
organisations) and the level (e.g. national / regional with large numbers of events, local with small numbers of
events) at which the data are to be used.
Further reading:
1.
2.
3.
4.
Government Statistical Service. Statistical Bulletin - Abortion Statistics, England and Wales: 2008. Bulletin
2009/01 London: Government Statistical Service, 2009. Available at:
http://www.dh.gov.uk/prod_consum_dh/groups/dh_digitalassets/documents/digitalasset/dh_099714.pdf
Government Statistical Service. Statistical Bulletin - Abortion Statistics, England and Wales: 2006. Bulletin
2007/01 London: Government Statistical Service, 2007. Available at:
http://www.dh.gov.uk/en/Publicationsandstatistics/Publications/PublicationsStatistics/DH_075697
Government Statistical Service. Statistical Bulletin - Abortion Statistics, England and Wales: 2005. Bulletin
2006/01. London: Government Statistical Service, 2006. Available at:
http://www.dh.gov.uk/assetRoot/04/13/68/59/04136859.pdf
Government Statistical Service. Statistical Bulletin - Abortion Statistics, England and Wales: 2004. Bulletin
2005/11. London: Government Statistical Service, 2005. Available at:
http://www.dh.gov.uk/assetRoot/04/11/75/74/04117574.pdf
Updated: October 2009
164
Abortions performed in the NHS and privately
Purpose:
To monitor access to abortion services.
Definition of indicator and its variants:
Legal terminations of pregnancy performed in the NHS, by an NHS agency (i.e. carried out in the private sector on
NHS patients), or privately.
Statistic
Percent
Sex
F
Age group
All ages
Organisation
(see glossary)
E&W, E, GOR,
SHA, PCO
Current
data
2008
Trend
data
File-worksheet name
05F_141PC_08_V1
Numerator:
Numerator data - Number of abortions in the respective calendar year by source of service (NHS, NHS agency,
and non-NHS).
Source of numerator data - Office for National Statistics (ONS).
Comments on numerator data - Figures for abortions were derived from notification forms returned to the Chief
Medical Officer.
Abortion data provided in the Compendium have been disclosure controlled at source. For more information and
guidance on disclosure issues related to abortion statistics see the advisory report available at
http://www.statistics.gov.uk/downloads/theme_health/abortion_stag_final.pdf
Denominator:
Denominator data - Total abortions in the respective calendar year.
Source of denominator data - Department of Health.
Comments on denominator data - See “Comments on numerator data”.
Interpretation of indicators:
Quality of indicator - Annex 12 describes the criteria that should be used to judge the quality of this indicator. The
application of the criteria is dependent on the context (e.g. describing a single organisation, comparing several
organisations) and the level (e.g. national / regional with large numbers of events, local with small numbers of
events) at which the data are to be used.
Further reading:
1.
2.
3.
4.
Government Statistical Service. Statistical Bulletin - Abortion Statistics, England and Wales: 2008. Bulletin
2009/01 London: Government Statistical Service, 2009. Available at:
http://www.dh.gov.uk/prod_consum_dh/groups/dh_digitalassets/documents/digitalasset/dh_099714.pdf
Government Statistical Service. Statistical Bulletin - Abortion Statistics, England and Wales: 2006. Bulletin
2007/01 London: Government Statistical Service, 2007. Available at:
http://www.dh.gov.uk/en/Publicationsandstatistics/Publications/PublicationsStatistics/DH_075697
Government Statistical Service. Statistical Bulletin - Abortion Statistics, England and Wales: 2005. Bulletin
2006/01. London: Government Statistical Service, 2006. Available at:
http://www.dh.gov.uk/assetRoot/04/13/68/59/04136859.pdf
Government Statistical Service. Statistical Bulletin - Abortion Statistics, England and Wales: 2004. Bulletin
2005/11. London: Government Statistical Service, 2005. Available at:
http://www.dh.gov.uk/assetRoot/04/11/75/74/04117574.pdf
Updated: October 2009
165
Total period abortion rate as percentage of the potential fertility rate
Purpose:
To reduce the number of unwanted pregnancies.
Definition of indicator and its variants:
Total period abortion rate as percentage of the potential fertility rate, where potential fertility is defined as the sum
of the total period abortion rate and the total period fertility rate.
Statistic
Percent
Sex
F
Age group
11-49
Organisation
(see glossary)
E&W, E, GOR,
SHA, PCO
Current
data
2008
Trend
data
File-worksheet name
05H_142PC_08_V1
Numerator:
Numerator data - Total period abortion rate (TPAR) in the respective calendar year.
Source of numerator data - Office for National Statistics (ONS).
Comments on numerator data - None.
Denominator:
Denominator data - Total period abortion rate (TPAR) plus total period fertility rate (TPFR) in the respective
calendar year.
Source of denominator data - Office for National Statistics (ONS).
Comments on denominator data - None.
Statistical methods:
The total period abortion rate is the average number of abortions (NHS and private) that would occur per woman in
an area, if women experienced the current age-specific abortion rates of that area throughout their childbearing
ages. The total period abortion rate (TPAR) is calculated by multiplying the age-specific abortion rates by the
respective number of years in the age group, and summing the results. The age groups used are: 11-17, 18-19,
20-24, 25-29, 30-34, and 35-49.
The total period fertility rate is the average number of live births that would occur per woman in an area, if women
experienced the current age-specific fertility rates of that area throughout their childbearing ages. The total period
fertility rate is calculated as the sum of the age-specific fertility rates (five year age groups) between ages 15-44,
multiplied by 5. For the first and last age groups the numerators are taken as births to women aged under 20, and
births to women aged 40 and over, respectively.
Interpretation of indicators:
Quality of indicator - Annex 12 describes the criteria that should be used to judge the quality of this indicator. The
application of the criteria is dependent on the context (e.g. describing a single organisation, comparing several
organisations) and the level (e.g. national / regional with large numbers of events, local with small numbers of
events) at which the data are to be used.
Further reading:
1.
2.
Government Statistical Service. Statistical Bulletin - Abortion Statistics, England and Wales: 2006. Bulletin
2007/01 London: Government Statistical Service, 2007. Available at:
http://www.dh.gov.uk/en/Publicationsandstatistics/Publications/PublicationsStatistics/DH_075697
Government Statistical Service. Statistical Bulletin - Abortion Statistics, England and Wales: 2005. Bulletin
2006/01. London: Government Statistical Service, 2006. Available at:
http://www.dh.gov.uk/assetRoot/04/13/68/59/04136859.pdf
Updated: December 2009
166
Maternal mortality
Purpose:
To reduce maternal deaths.
Indicator currently under review. The Office for National Statistics (ONS) recommends that time-based (in addition
to cause-based) data from the Confidential Enquiry into Maternal Deaths (CEMD) should be used. However, they
could not be included in the current Compendium because data are still being assessed.
Definition of indicator and its variants:
Maternal mortality (ICD-10 O0-O99).
Statistic
Sex
Age group
Indirectly age-standardised
mortality ratio (SMR) and
number of deaths
Directly age-standardised
mortality rate per 100,000 and
number of deaths
F
15-44,
<20
F
15-44,
<20
Organisation
(see glossary)
Current
data
Trend
data
File-worksheet name
E&W, E, GOR,
ONS area, SHA,
LA, PCO, CTY
E&W, E, GOR,
ONS area, SHA,
LA, PCO, CTY
2006-08
05I_144SM1544_08_V1
05I_144SM1519_08_V1
2006-08
05I_144DR1544_08_V1
05I_144DR1519_08_V1
Numerator:
Numerator data - Maternal deaths, classified by underlying cause of death (ICD-10 O0-O99), registered in the
respective calendar years.
Source of numerator data - Office for National Statistics (ONS).
Comments on numerator data – Mortality data for years 1993-2006 were extracted by ONS in June 2007 with
organisational codes assigned using the postcode of usual residence and the November 2006 edition of the
National Statistics Postcode Directory (NSPD). Data for subsequent years were extracted in June of the following
year using the respective year’s November edition of the NSPD.
In January 2001, the ONS implemented a change from ICD-9 to ICD-10 for coding causes of death in England &
Wales. As part of an exercise to investigate the effects of this change, ONS also re-coded all deaths registered in
1999. Deaths for years prior to 1999 and for year 2000 have not been re-coded.
For current analysis, therefore, all data are based on ICD-10.
From the 2003 Compendium onwards, data are based on the original causes of death rather than the final causes
used in earlier Compendia.
See Annex 2 for more details.
The numbers of deaths are small in subnational areas and rates should be interpreted with caution.
Denominator:
Denominator data - 2001 Census based mid-year population estimates for respective calendar years.
Source of denominator data - ONS.
Comments on denominator data - Data are based on the latest revisions of ONS mid-year population estimates for
the respective years, current as at 1 October 2009.
Statistical methods:
Annex 2: Changes to Office for National Statistics mortality data
Annex 3: Explanations of statistical methods used in the Compendium
Annex 5: European Standard Population
Interpretation of indicators:
Quality of indicator - Annex 12 describes the criteria that should be used to judge the quality of this indicator. The
application of the criteria is dependent on the context (e.g. describing a single organisation, comparing several
167
organisations) and the level (e.g. national / regional with large numbers of events, local with small numbers of
events) at which the data are to be used.
Further reading:
1.
2.
3.
4.
Department of Health. National Service Framework for Children, Young People and Maternity Services –
Emerging findings. London: Department of Health, 2003.
Department of Health. National Service Framework for Children, Young People and Maternity Services –
Standard for Hospital Services. London: Department of Health, 2003.
Troop P, Goldacre M, Mason A, Cleary R (eds). Health Outcome Indicators: Normal Pregnancy and Childbirth.
Report of a working group to the Department of Health. Oxford: National Centre for Health Outcomes
Development, 1999. Available at: http://nchod.uhce.ox.ac.uk/pregnancy.pdf
Lewis G. Why Mothers Die 1997-1999. The Confidential Enquiries into Maternal Deaths in the United
Kingdom. The Fifth Report of the CEMD. London: RCOG Press, 2001.
Updated: December 2009
168
Hospital episodes (admissions): accidents
Purpose:
To reduce serious accidental injury. The directly age-standardised admission rate for accidents in persons of all
ages is a target indicator in the Saving Lives: Our Healthier Nation strategy (see “Further reading”). The target is a
10% reduction by the year 2010 from the baseline rate in 1995/96.
Definition of indicator and its variants:
Hospital admissions for serious accidental injury, with a length of stay exceeding 3 days (ICD-10 primary diagnosis
in the range S00 through T98X and external cause code in the following ranges: V01-V99, W00-X59, Y40-Y84).
Statistic
Directly age-standardised
hospital episode rate per
100,000 and number of
episodes
Sex
Age group
MFP All ages, <5, 514, 15-64, 65+,
75+, 85+
Organisation
(see glossary)
Current
data
E, GOR, ONS area,
FY
SHA, LA, PCO, CTY 2007/08
Trend
data
File-worksheet name
FY
2006/07
FY
2005/06
FY
2004/05
FY
2003/04
FY
2002/03
FY
2001/02
FY
2000/01
FY
1999/00
FY
1998/99
FY
1997/98
FY
1996/97
FY
1995/96
22A_182DRP1_08_V1
22A_182DRP2_08_V1
22A_182DRP3_08_V1
22A_182DRP4_08_V1
22A_182DRP5_08_V1
22A_182DRP6_08_V1
22A_182DRP7_08_V1
Numerator:
Numerator data - Hospital admissions (finished consultant episodes with episode order 1) for serious accidental
injury, with a length of stay exceeding 3 days in the respective financial years.
Source of numerator data - Hospital Episode Statistics (HES), Department of Health (DH).
Comments on numerator data - HES data for 1995/96 onwards are based on the tenth version of the International
Classification of Diseases (ICD). The codes used are derived from the National Health Service Centre for Coding
and Classifications (NHSCCC) Tables of Equivalence. The figures for the periods prior to 1999/00 have been
recalculated to Health Authority (HA) and Local Authority (LA) boundaries (as of April 2001).
The finished consultant episodes are taken from 100% HES data (based on primary diagnosis). There may be
variation in completeness of hospital records, accuracy of diagnoses, and quality of coding.
An erroneous Data Set Change Notice (DSCN) issued by the Department of Health caused some Trusts in the
South West Region to miscode the gender field in the 1997/98 data. This affects all HES-based indicators for
some HAs in the South West Region (particularly Cornwall and Isles of Scilly) and for the Region overall, resulting
in lower than expected rates/numbers because the affected episodes are not included in the analysis.
Denominator:
Denominator data - 2001 Census based mid-year population estimates for the respective calendar years (e.g.
2006 estimates used with 2006/07 hospital admissions figures).
Source of denominator data - Office for National Statistics (ONS).
169
Comments on denominator data -The population figures used for years up to 2000/01 are 1995 to 2000 ONS midyear estimates rebased to take account of the results of the 2001 Census and revised in October 2004.
The population figures used for years 2001/02, 2002/03, 2003/04, 2004/05, 2005/06 and 2006/07 are 2001, 2002,
2003, 2004, 2005 and 2006 ONS mid-year estimates respectively, derived from the 2001 Census with allowance
for subsequent births, deaths, migration, and ageing of the population. 2001 and 2002 population estimates were
revised in September 2004.
Data for 2002/03, 2003/04 and 2004/05 were revised and are based on the latest revisions of ONS population
estimates for the respective years, current as at 22 August 2007.
Statistical methods:
Figures are estimates (i.e. adjusted to include estimates of how many injury admissions without a valid cause code
relate to unintensional injury, and how many multiepisodes spells exceede 3 days).
There were problems with data quality for 1995/96 HES data for some areas (mainly for the old Trent Regional
Office). The reason for the data quality problem was that for 1995/96, the diagnosis codes for most acute Trusts in
the affected areas were lost from their data.
For the affected health authorities/local authorities (and corresponding regional offices, Government Office
Regions, and ONS area classifications), figures for observed numbers have not been presented. The rates
presented for each affected area are estimates, obtained by fitting a trend line to the rates for that area for 1996/97
to 1998/99, and extrapolating back to 1995/96.
As a consequence, figures for observed numbers have not been presented for 1995/96 England totals. The rates
presented for England are estimates, obtained in the same way by fitting a trend line to the England rates for
1996/97 to 2002/03, and extrapolating back to 1995/96.
Annex 3: Explanations of statistical methods used in the Compendium
Annex 5: European Standard Population
Interpretation of indicators:
Quality of indicator - Annex 12 describes the criteria that should be used to judge the quality of this indicator. The
application of the criteria is dependent on the context (e.g. describing a single organisation, comparing several
organisations) and the level (e.g. national / regional with large numbers of events, local with small numbers of
events) at which the data are to be used.
Further reading:
1.
Department of Health. Saving Lives: Our Healthier Nation. London: The Stationery Office, 1999.
For futher information, please contact in the Department of Health:
Sacha Keshavarz
tel: 020 7972 1039
email: [email protected]
Updated: October 2009
170
Mortality from accidents
Purpose:
To reduce deaths from accidents. The directly age-standardised mortality rate from accidents for persons of all
ages is a target indicator in the Saving Lives: Our Healthier Nation strategy (see “Further reading”). The target is a
20% reduction by the year 2010 from the baseline rate in 1995-97.
Definition of indicator and its variants:
Mortality from accidents ICD-10 V01-X59 equivalent to ICD-9 E800-E928 excluding E870-E879.
Statistic
Number of deaths
Average age-specific death
rate per 100,000 resident
population
Indirectly age-standardised
mortality ratio (SMR) and
number of deaths
Directly age-standardised
mortality rate per 100,000 and
number of deaths
Sex
Age group
MFP 1+, 1-4, 5-14,
15-34, 35-64,
65-74, 75+
MFP 1+, 1-4, 5-14,
15-34, 35-64,
65-74, 75+
MFP All ages
<5,
<15,
<75,
5-14,
15-24,
15-64,
65-84,
65+
75+
85+
All ages
<15,
<75,
15-24,
65-84,
65+
MFP All ages*
<5,
<15,
<75,
5-14,
15-24,
15-64,
65-84,
65+
75+
85+
Organisation
(see glossary)
Current
data
E&W, E, GOR,
ONS area, SHA,
LA, PCO, CTY
E&W, E, GOR,
ONS area, SHA,
LA, PCO, CTY
E&W, E, GOR,
ONS area, SHA,
LA, PCO, CTY
2008
22B_022NO_08_V1
2006-08
22B_022CR_08_V1
2006-08
22B_022SM00++_08_V1
22B_022SM0004_08_V1
22B_022SM0014_08_V1
22B_022SM0074_08_V1
22B_022SM0514_08_V1
22B_022SM1524_08_V1
22B_022SM1564_08_V1
22B_022SM6584_08_V1
22B_022SM65++_08_V1
22B_022SM75++_08_V1
22B_022SM85++_08_V1
E&W, E, GOR,
ONS area, SHA,
LA, PCO, CTY
All ages#
2006-08
1995-97#
All ages
<15,
<75,
15-24,
65-84,
65+
Trend
data
File-worksheet name
1993-08 22B_022SMT00++_08_V1
22B_022SMT0014_08_V1
22B_022SMT0074_08_V1
22B_022SMT1524_08_V1
22B_022SMT6584_08_V1
22B_022SMT65++_08_V1
22B_022DR00++_08_V1
22B_022DR0004_08_V1
22B_022DR0014_08_V1
22B_022DR0074_08_V1
22B_022DR0514_08_V1
22B_022DR1524_08_V1
22B_022DR1564_08_V1
22B_022DR6584_08_V1
22B_022DR65++_08_V1
22B_022DR75++_08_V1
22B_022DR85++_08_V1
22B_022DR00++_97_V4
1993-08 22B_022DRT00++_08_V1
22B_022DRT0014_08_V1
22B_022DRT0074_08_V1
22B_022DRT1524_08_V1
22B_022DRT6584_08_V1
22B_022DRT65++_08_V1
# Our Healthier Nation baseline
* Additional local authority based aggregates are included for Neighbourhood Renewal Fund and Working
Neighbourhood Fund target monitoring.
Numerator:
Numerator data - Deaths from accidents, classified by underlying cause of death (ICD-10 V01-X59, ICD-9 E800E928 exc E870-E879), registered in the respective calendar year(s).
171
Source of numerator data - Office for National Statistics (ONS).
Comments on numerator data – Mortality data for years 1993-2006 were extracted by ONS in June 2007 with
organisational codes assigned using the postcode of usual residence and the November 2006 edition of the
National Statistics Postcode Directory (NSPD). Data for subsequent years were extracted in June of the following
year using the respective year’s November edition of the NSPD.
In January 2001, the ONS implemented a change from ICD-9 to ICD-10 for coding causes of death in England &
Wales. As part of an exercise to investigate the effects of this change, the ONS also re-coded all deaths registered
in 1999. Deaths for years prior to 1999 and for year 2000 have not been re-coded.
For current analysis, therefore, all data are based on ICD-10.
For trend analysis, the numbers of deaths observed in the years 1993-98 and 2000 must be adjusted to give
“expected” numbers of deaths which would have been coded to this cause in ICD-10. This is done by multiplying
the ICD-9 based death counts by the appropriate ICD-10/9 comparability ratio published by the ONS. Trend data
cannot include years prior to 1993, because the ONS introduced automated coding in 1993, and the comparability
ratios are only valid from this point onwards.
For this indicator the following ICD-10/9 comparability ratios were used:
Males
Females
All Ages: 1
All Ages: 1
Adjusted person counts are the sum of the adjusted male and female counts. Once adjusted, the counts are used
to calculate rates in the usual way.
From the 2003 Compendium onwards, data are based on the original causes of death rather than the final causes
used in earlier Compendia.
See Annex 2 for more details.
Denominator:
Denominator data - 2001 Census based mid-year population estimates for the respective calendar years.
Source of denominator data – ONS.
Comments on denominator data - Data are based on the latest revisions of ONS mid-year population estimates for
the respective years, current as at 1 October 2009.
Statistical methods:
Annex 2: Changes to Office for National Statistics mortality data
Annex 3: Explanations of statistical methods used in the Compendium
Annex 5: European Standard Population
Annex 6: Goals of Our Healthier Nation
Interpretation of indicators:
Quality of indicator - Annex 12 describes the criteria that should be used to judge the quality of this indicator. The
application of the criteria is dependent on the context (e.g. describing a single organisation, comparing several
organisations) and the level (e.g. national / regional with large numbers of events, local with small numbers of
events) at which the data are to be used.
Further reading:
1.
2.
3.
Department of Health. Saving Lives: Our Healthier Nation. London: The Stationery Office, 1999.
Griffiths C, Rooney C. The effect of the introduction of ICD-10 on trends in mortality from injury and poisoning
in England and Wales. Office for National Statistics Health Statistics Quarterly, No. 19, 2003: 10-21. Available
at: http://www.statistics.gov.uk/downloads/theme_health/HSQ19.pdf
Ward H, Christie N. Strategic Review of research priorities for accidental injury. London: Department of
Health, 2000.
Updated: December 2009
172
Mortality from accidental falls
Purpose:
To reduce deaths from accidental falls.
Definition of indicator and its variants:
Mortality from accidental falls (ICD-10 W00-W19 equivalent to ICD-9 E880-888 excluding E887).
Statistic
Number of deaths
Average age-specific death
rate per 100,000 resident
population
Indirectly age-standardised
mortality ratio (SMR) and
number of deaths
Directly age-standardised
mortality rate per 100,000 and
number of deaths
Sex
Age group
MFP 1+, 1-4, 5-14,
15-34, 35-64,
65-74, 75+
MFP 1+, 1-4, 5-14,
15-34, 35-64,
65-74, 75+
MFP All ages,
<75
All ages
MFP All ages,
<75
Organisation
(see glossary)
Current
data
E&W, E, GOR,
ONS area, SHA,
LA, PCO, CTY
E&W, E, GOR,
ONS area, SHA,
LA, PCO, CTY
E&W, E, GOR,
ONS area, SHA,
LA, PCO, CTY
2008
22C_023NO_08_V1
2006-08
22C_023CR_08_V1
2006-08
22C_023SM00++_08_V1
22C_023SM0074_08_V1
E&W, E, GOR,
ONS area, SHA,
LA, PCO, CTY
2006-08
All ages
Trend
data
File-worksheet name
1993-08 22C_023SMT00++_08_V1
22C_023DR00++_08_V1
22C_023DR0074_08_V1
1993-08 22C_023DRT00++_08_V1
Numerator:
Numerator data - Deaths from accidental falls, classified by underlying cause of death (ICD-10 W00-W19, ICD-9
E880-888 excluding E887 adjusted), registered in the respective calendar year(s).
Source of numerator data - Office for National Statistics (ONS).
Comments on numerator data – Mortality data for years 1993-2006 were extracted by ONS in June 2007 with
organisational codes assigned using the postcode of usual residence and the November 2006 edition of the
National Statistics Postcode Directory (NSPD). Data for subsequent years were extracted in June of the following
year using the respective year’s November edition of the NSPD.
In January 2001, the ONS implemented a change from ICD-9 to ICD-10 for coding causes of death in England &
Wales. As part of an exercise to investigate the effects of this change, the ONS also re-coded all deaths registered
in 1999. Deaths for years prior to 1999 and for year 2000 have not been re-coded.
For current analysis, therefore, all data are based on ICD-10.
For trend analysis, the numbers of deaths observed in the years 1993-98 and 2000 must be adjusted to give
“expected” numbers of deaths which would have been coded to this cause in ICD-10. This is done by multiplying
the ICD-9 based death counts by the appropriate ICD-10/9 comparability ratio published by the ONS. Trend data
cannot include years prior to 1993, because the ONS introduced automated coding in 1993, and the comparability
ratios are only valid from this point onwards.
For this indicator the following ICD-10/9 comparability ratios were used:
Males
Females
0-74yrs: 0.954
0-74yrs: 0.767
75-84yrs: 0.664
75-84yrs: 0.544
85+yrs: 0.418
85+yrs: 0.335
Adjusted person counts are the sum of the adjusted male and female counts. Once adjusted, the counts are used
to calculate rates in the usual way.
From the 2003 Compendium onwards, data are based on the original causes of death rather than the final causes
used in earlier Compendia.
See Annex 2 for more details.
Denominator:
Denominator data - 2001 Census based mid-year population estimates for the respective calendar years.
173
Source of denominator data - ONS.
Comments on denominator data - Data are based on the latest revisions of ONS mid-year population estimates for
the respective years, current as at 1 October 2009.
Statistical methods:
Annex 2: Changes to Office for National Statistics mortality data
Annex 3: Explanations of statistical methods used in the Compendium
Annex 5: The European Standard population
Annex 6: Goals of Our Healthier Nation
Interpretation of indicators:
Quality of indicator - Annex 12 describes the criteria that should be used to judge the quality of this indicator. The
application of the criteria is dependent on the context (e.g. describing a single organisation, comparing several
organisations) and the level (e.g. national / regional with large numbers of events, local with small numbers of
events) at which the data are to be used.
Further reading:
1.
2.
Griffiths C, Rooney C. The effect of the introduction of ICD-10 on trends in mortality from injury and poisoning
in England and Wales. Office for National Statistics Health Statistics Quarterly, No. 19, 2003: 10-21. Available
at: http://www.statistics.gov.uk/downloads/theme_health/HSQ19.pdf
Ward, H. Christie, N. Strategic Review of research priorities for accidental injury. London: Department of
Health, 2000.
Updated: December 2009
174
Mortality from skull fracture and intracranial injury
Purpose:
To reduce deaths from fracture of the skull and intracranial injury.
Definition of indicator and its variants:
Mortality from fracture of the skull and intracranial injury (ICD-10 S02, S06, T90.2, T90.5).
Statistic
Sex
Age group
Organisation
(see glossary)
Current
data
Trend
data
File-worksheet name
Indirectly age-standardised
mortality ratio (SMR) and
number of deaths
MFP All ages,
<75,
1+,
1-14,
15-24
E&W, E,GOR,
ONS area,SHA,
LA, PCO, CTY
2006-08
22D_026SM00++_08_V1
22D_026SM0074_08_V1
22D_026SM01++_08_V1
22D_026SM0114_08_V1
22D_026SM1524_08_V1
Directly age-standardised
mortality rate per 100,000 and
number of deaths
MFP All ages,
<75,
1+,
1-14,
15-24
E&W, E,GOR,
ONS area,SHA,
LA, PCO, CTY
2006-08
22D_026DR00++_08_V1
22D_026DR0074_08_V1
22D_026DR01++_08_V1
22D_026DR0114_08_V1
22D_026DR1524_08_V1
Numerator:
Numerator data - Deaths from fracture of the skull and intracranial injury, classified by nature of injuries ICD-10
S02, S06, T90.2, T90.5) registered in the respective calendar years.
Source of numerator data - Office for National Statistics (ONS).
Comments on numerator data – Mortality data for years 1993-2006 were extracted by ONS in June 2007 with
organisational codes assigned using the postcode of usual residence and the November 2006 edition of the
National Statistics Postcode Directory (NSPD). Data for subsequent years were extracted in June of the following
year using the respective year’s November edition of the NSPD.
In January 2001, the ONS implemented a change from ICD-9 to ICD-10 for coding causes of death in England &
Wales. As part of an exercise to investigate the effects of this change, the ONS also re-coded all deaths registered
in 1999. Deaths for years prior to 1999 and for year 2000 have not been re-coded.
For current analysis, therefore, all data are based on ICD-10.
From the 2003 Compendium onwards, data are based on the original causes of death rather than the final causes
used in earlier Compendia.
See Annex 2 for more details.
Denominator:
Denominator data - 2001 Census based mid-year population estimates for the respective calendar years.
Source of denominator data - ONS.
Comments on denominator data - Data are based on the latest revisions of ONS mid-year population estimates for
the respective years, current as at 1 October 2009.
Statistical methods:
Annex 2: Changes to Office for National Statistics mortality data
Annex 3: Explanations of statistical methods used in the Compendium
Annex 5: European Standard Population
Interpretation of indicators:
Quality of indicator - Annex 12 describes the criteria that should be used to judge the quality of this indicator. The
application of the criteria is dependent on the context (e.g. describing a single organisation, comparing several
175
organisations) and the level (e.g. national / regional with large numbers of events, local with small numbers of
events) at which the data are to be used.
Further reading:
1.
Griffiths C, Rooney C. The effect of the introduction of ICD-10 on trends in mortality from injury and poisoning
in England and Wales. Office for National Statistics Health Statistics Quarterly, No. 19, 2003: 10-21. Available
at: http://www.statistics.gov.uk/downloads/theme_health/HSQ19.pdf
Updated: December 2009
176
Mortality from land transport accidents
Purpose:
To reduce deaths from land transport accidents.
Definition of indicator and its variants:
Mortality from land transport accidents (ICD-10 V01-V89 equivalent to ICD-9 E800-E829). This indicator replaces
the motor vehicle traffic accidents (MVTAs) indicator (ICD-9 E810-E819) which does not have equivalent ICD-10
codes.
Statistic
Number of deaths
Average age-specific death
rate per 100,000 resident
population
Indirectly age-standardised
mortality ratio (SMR) and
number of deaths
Directly age-standardised
mortality rate per 100,000 and
number of deaths
Sex
Age group
MFP 1+, 1-4, 5-14,
15-34, 35-64,
65-74, 75+
MFP 1+, 1-4, 5-14,
15-34, 35-64,
65-74, 75+
MFP All ages,
<75
All ages
MFP All ages,
<75
Organisation
(see glossary)
Current
data
E&W, E, GOR,
ONS area, SHA,
LA, PCO, CTY
E&W, E, GOR,
ONS area, SHA,
LA, PCO, CTY
E&W, E, GOR,
ONS area, SHA,
LA, PCO, CTY
2008
22E_175NO_08_V1
2006-08
22E_175CR_08_V1
2006-08
22E_175SM00++_08_V1
22E_175SM0074_08_V1
E&W, E, GOR,
ONS area, SHA,
LA, PCO, CTY
All ages
2006-08
Trend
data
File-worksheet name
1993-08 22E_175SMT00++_08_V1
22E_175DR00++_08_V1
22E_175DR0074_08_V1
1993-08 22E_175DRT00++_08_V1
Numerator:
Numerator data - Deaths from land transport accidents, classified by underlying cause of death (ICD-10 V01-V81,
ICD-9 E800-E829), registered in the relevant years.
Source of numerator data - Office for National Statistics (ONS).
Comments on numerator data – Mortality data for years 1993-2006 were extracted by ONS in June 2007 with
organisational codes assigned using the postcode of usual residence and the November 2006 edition of the
National Statistics Postcode Directory (NSPD). Data for subsequent years were extracted in June of the following
year using the respective year’s November edition of the NSPD.
In January 2001, the Office for National Statistics implemented a change from ICD-9 to ICD-10 for coding causes
of death in England & Wales. As part of an exercise to investigate the effects of this change, the Office for National
Statistics also re-coded all deaths registered in 1999. Deaths for years prior to 1999 and for year 2000 have not
been re-coded.
For current analysis, therefore, all data are based on ICD-10.
For trend analysis, the numbers of deaths observed in the years 1993-98 and 2000 must be adjusted to give
“expected” numbers of deaths which would have been coded to this cause in ICD-10. This is done by multiplying
the ICD-9 based death counts by the appropriate ICD-10/9 comparability ratio published by ONS. Trend data
cannot include years prior to 1993, because ONS introduced automated coding in 1993, and the comparability
ratios are only valid from this point onwards.
For this indicator the following ICD-10/9 comparability ratios were used:
Males
Females
All Ages: 1
All Ages: 1
Adjusted person counts are the sum of the adjusted male and female counts. Once adjusted, the counts are used
to calculate rates in the usual way.
From the 2003 Compendium onwards, data are based on the original causes of death rather than the final causes
used in earlier Compendia.
See Annex 2 for more details.
177
Denominator:
Denominator data - 2001 Census based mid-year population estimates for the respective calendar years.
Source of denominator data - ONS.
Comments on denominator data - Data are based on the latest revisions of ONS mid-year population estimates for
the respective years, current as at 1 October 2009.
Statistical methods:
Annex 2: Changes to Office for National Statistics mortality data
Annex 3: Explanations of statistical methods used in the Compendium
Annex 5: The European Standard Population
Interpretation of indicators:
Quality of indicator - Annex 12 describes the criteria that should be used to judge the quality of this indicator. The
application of the criteria is dependent on the context (e.g. describing a single organisation, comparing several
organisations) and the level (e.g. national / regional with large numbers of events, local with small numbers of
events) at which the data are to be used.
Updated: December 2009
178
Major accidents
Purpose:
To reduce serious accidental injury.
Definition of indicator and its variants:
Self-reported non-fatal accidents causing the person to consult a doctor or go to a hospital, excluding some
accidents that result in long-term stays in hospitals or other institutions.
Statistic
Mean and age-standardised
mean
Sex
Age group
Organisation
(see glossary)
MFP 16+
E, GOR, ONS area,
SHA, CTY
Current
data
1999-01
Trend
data
File-worksheet name
22F_322VSP1_01_V2
Numerator:
Numerator data - The number of major accidents per person in the six months prior to interview among persons
aged 16+ in a sample survey of the health of the population of England.
Source of numerator data - Health Survey for England (HSE), commissioned by the Department of Health and
since April 2005 The Information Centre for health and social care and carried out by the Joint Health Survey Unit
of Social and Community Planning Research and of the Department of Epidemiology and Public Health at
University College, London.
Comments on numerator data – Two types of accident were distinguished in the survey: ‘major accidents’ which
included all those about which a doctor was consulted or a hospital was visited, and ‘minor accidents’ which
included all other accidents that caused pain or discomfort for over 24 hours. For ‘major accidents’, respondents
were asked to recall how many such accidents they had had in the six months prior to interview, and in which
months these accidents occurred. For the most recent accident only, they were asked to give details about how
and where the accident occurred and the disruption it caused in work/school (where applicable) and to normal
daily activities. There was a slight underestimate because this part of the survey did not include accidents leading
to more than a six months’ stay at a hospital or institution. See also:
http://www.statistics.gov.uk/STATBASE/ssdataset.asp?vlnk=4449
Denominator:
Denominator data - Respondents (with measurements) aged 16+ in a sample survey of the health of the
population of England.
Source of denominator data - See “Numerator data”.
Comments on denominator data - The HSE is a series of annual surveys that began in 1991 with the aim of
monitoring the health of the population. It was designed to measure health and health related behaviours in adults
and children living in private households in England. For each participant, the survey included an interview and a
physical examination by a nurse, at which various physical measurements, tests, and samples of blood and saliva
were collected. These measurements provided biomedical information about known risk factors associated with
disease and objective validation for self-reported health behaviour.
Statistical methods:
The figures have been provided for three-year periods (based on three-year moving averages). No data for single
calendar years were available. All calculations of sub-national observed estimates at Government Office Region,
ONS area, Strategic Health Authority and County levels, age-standardised rates, confidence intervals and
significance tests were carried out by the National Centre for Social Research (see Annex 9 for details).
Because any one respondent may have had more than one accident during the six month reference period for
major accidents, comparisons between sub-groups are based upon the mean number of reported accidents over
the reference period. Such an approach tends to give very low figures (typically 0.1) so, to aid comparisons, the
means for major accidents have been multiplied by a factor of 200 (two six-month periods x 100 persons) to give
an annual accident rate per 100 persons.
179
Interpretation of indicators:
Quality of indicator - Annex 12 describes the criteria that should be used to judge the quality of this indicator. The
application of the criteria is dependent on the context (e.g. describing a single organisation, comparing several
organisations) and the level (e.g. national / regional with large numbers of events, local with small numbers of
events) at which the data are to be used.
Further reading:
1.
2.
Non-fatal Accidents. Official Documents Archive 1 – 1994 to2001, The Stationery Office. Available at:
http://www.archive2.official-documents.co.uk/document/deps/doh/survey01/nfa/nfa07.htm
Scholes S, Prescott A and Bajekal M. Health and lifestyle indicators for Strategic Health Authorities, 19942002, London: National Centre for Social Research, 2004. Available at:
http://www.dh.gov.uk/assetRoot/04/07/77/31/04077731.pdf
Updated: June 2008
180
Years of life lost due to mortality from accidents
Purpose:
Years of life lost (YLL) is a measure of premature mortality. Its primary purpose is to compare the relative
importance of different causes of premature death within a particular population and it can therefore be used by
health planners to define priorities for the prevention of such deaths. It can also be used to compare the premature
mortality experience of different populations for a particular cause of death. The concept of years of life lost is to
estimate the length of time a person would have lived had they not died prematurely. By inherently including the
age at which the death occurs, rather than just the fact of its occurrence, the calculation is an attempt to better
quantify the burden, or impact, on society from the specified cause of mortality.
Definition of indicator and its variants:
Years of life lost due to mortality from accidents (ICD-10 V01-X59).
Statistic
Crude rate per 10,000
population and number of
years of life lost
Directly age-standardised rate
per 10,000 population and
number of deaths
Sex
Age group
MFP <75
MFP <75
Organisation
(see glossary)
Current
data
Trend
data
File-worksheet name
E&W, E, GOR,
ONS area, SHA,
LA, PCO, CTY
E&W, E, GOR,
ONS area, SHA,
LA, PCO, CTY
2006-08
22H_071CR_08_V1
2006-08
22H_071DR_08_V1
Numerator:
Numerator data – Years of life lost and deaths from accidents classified by underlying cause of death (ICD-10
V01-X59), registered in the respective calendar year(s).
Source of numerator data – Office for National Statistics (ONS).
Comments on numerator data – The number of years of life lost is calculated by summing over ages 1 to 74 years
the number of deaths at each age multiplied by the number of years of life remaining up to age 75 years. Infant
deaths are omitted as they are mostly a result of causes specific to this age group and have different aetiologies to
deaths later in life.
The numerator presented alongside the sdirecgtly age-tandardised years of life lost rate is the number of deaths
rather than the number of years of life lost. This is because the standardisation calculation has been performed
using 5-year age bands. In each age band the number of deaths is weighted by the number of years of life
remaining from the mid-point of the age band up to age 75 years. See annex 3 for more details.
Mortality data for years 1993-2006 were extracted by ONS in June 2007 with organisational codes assigned using
the postcode of usual residence and the November 2006 edition of the National Statistics Postcode Directory
(NSPD). Data for subsequent years were extracted in June of the following year using the respective year’s
November edition of the NSPD.
In January 2001, the ONS implemented a change from ICD-9 to ICD-10 for coding causes of death in England &
Wales. As part of an exercise to investigate the effects of this change, the ONS also re-coded all deaths registered
in 1999. Deaths for years prior to 1999 and for year 2000 have not been re-coded.
For current analysis, therefore, all data are based on ICD-10.
From the 2003 Compendium onwards, data are based on the original causes of death rather than the final causes
used in earlier Compendia.
See Annex 2 for more details.
Denominator:
Denominator data - 2001 Census based mid-year population estimates for the respective calendar years.
Source of denominator data - ONS.
Comments on denominator data - Data are based on the latest revisions of ONS mid-year population estimates for
the respective years, current as at 1 October 2009.
181
Statistical methods:
Annex 2: Changes to Office for National Statistics mortality data
Annex 3: Explanations of statistical methods used in the Compendium
Annex 5: European Standard Population
Interpretation of indicators:
Quality of indicator - Annex 12 describes the criteria that should be used to judge the quality of this indicator. The
application of the criteria is dependent on the context (e.g. describing a single organisation, comparing several
organisations) and the level (e.g. national / regional with large numbers of events, local with small numbers of
events) at which the data are to be used.
Further reading:
1.
2.
3.
Department of Health. Saving Lives: Our Healthier Nation. London: The Stationery Office, 1999.
Griffiths C, Rooney C. The effect of the introduction of ICD-10 on trends in mortality from injury and poisoning
in England and Wales. Office for National Statistics Health Statistics Quarterly, No. 19, 2003: 10-21. Available
at: http://www.statistics.gov.uk/downloads/theme_health/HSQ19.pdf
Ward H, Christie N. Strategic Review of research priorities for accidental injury. London: Department of Health,
2000.
Updated: December 2009
182
Years of life lost due to mortality from accidental falls
Purpose:
Years of life lost (YLL) is a measure of premature mortality. Its primary purpose is to compare the relative
importance of different causes of premature death within a particular population and it can therefore be used by
health planners to define priorities for the prevention of such deaths. It can also be used to compare the premature
mortality experience of different populations for a particular cause of death. The concept of years of life lost is to
estimate the length of time a person would have lived had they not died prematurely. By inherently including the
age at which the death occurs, rather than just the fact of its occurrence, the calculation is an attempt to better
quantify the burden, or impact, on society from the specified cause of mortality.
Definition of indicator and its variants:
Years of life lost due to mortality from accidental falls (ICD-10 W00-W19).
Statistic
Crude rate per 10,000
population and number of
years of life lost
Directly age-standardised rate
per 10,000 population and
number of deaths
Sex
Age group
MFP <75
MFP <75
Organisation
(see glossary)
Current
data
Trend
data
File-worksheet name
E&W, E, GOR,
ONS area, SHA,
LA, PCO, CTY
E&W, E, GOR,
ONS area, SHA,
LA, PCO, CTY
2006-08
22I_021CR_08_V1
2006-08
22I_021DR_08_V1
Numerator:
Numerator data – Years of life lost and deaths from accidental falls classified by underlying cause of death (ICD10 W00-W19), registered in the respective calendar year(s).
Source of numerator data – Office for National Statistics (ONS).
Comments on numerator data – The number of years of life lost is calculated by summing over ages 1 to 74 years
the number of deaths at each age multiplied by the number of years of life remaining up to age 75 years. Infant
deaths are omitted as they are mostly a result of causes specific to this age group and have different aetiologies to
deaths later in life.
The numerator presented alongside the sdirecgtly age-tandardised years of life lost rate is the number of deaths
rather than the number of years of life lost. This is because the standardisation calculation has been performed
using 5-year age bands. In each age band the number of deaths is weighted by the number of years of life
remaining from the mid-point of the age band up to age 75 years. See annex 3 for more details.
Mortality data for years 1993-2006 were extracted by ONS in June 2007 with organisational codes assigned using
the postcode of usual residence and the November 2006 edition of the National Statistics Postcode Directory
(NSPD). Data for subsequent years were extracted in June of the following year using the respective year’s
November edition of the NSPD.
In January 2001, the ONS implemented a change from ICD-9 to ICD-10 for coding causes of death in England &
Wales. As part of an exercise to investigate the effects of this change, the ONS also re-coded all deaths registered
in 1999. Deaths for years prior to 1999 and for year 2000 have not been re-coded.
For current analysis, therefore, all data are based on ICD-10.
From the 2003 Compendium onwards, data are based on the original causes of death rather than the final causes
used in earlier Compendia.
See Annex 2 for more details.
Denominator:
Denominator data - 2001 Census based mid-year population estimates for the respective calendar years.
Source of denominator data - ONS.
Comments on denominator data - Data are based on the latest revisions of ONS mid-year population estimates for
the respective years, current as at 1 October 2009.
183
Statistical methods:
Annex 2: Changes to Office for National Statistics mortality data
Annex 3: Explanations of statistical methods used in the Compendium
Annex 5: European Standard Population
Interpretation of indicators:
Quality of indicator - Annex 12 describes the criteria that should be used to judge the quality of this indicator. The
application of the criteria is dependent on the context (e.g. describing a single organisation, comparing several
organisations) and the level (e.g. national / regional with large numbers of events, local with small numbers of
events) at which the data are to be used.
Further reading:
1.
2.
Griffiths C, Rooney C. The effect of the introduction of ICD-10 on trends in mortality from injury and poisoning
in England and Wales. Office for National Statistics Health Statistics Quarterly, No. 19, 2003: 10-21. Available
at: http://www.statistics.gov.uk/downloads/theme_health/HSQ19.pdf
Ward, H. Christie, N. Strategic Review of research priorities for accidental injury. London: Department of
Health, 2000.
Updated: December 2009
184
Years of life lost due to mortality from land transport accidents
Purpose:
Years of life lost (YLL) is a measure of premature mortality. Its primary purpose is to compare the relative
importance of different causes of premature death within a particular population and it can therefore be used by
health planners to define priorities for the prevention of such deaths. It can also be used to compare the premature
mortality experience of different populations for a particular cause of death. The concept of years of life lost is to
estimate the length of time a person would have lived had they not died prematurely. By inherently including the
age at which the death occurs, rather than just the fact of its occurrence, the calculation is an attempt to better
quantify the burden, or impact, on society from the specified cause of mortality.
Definition of indicator and its variants:
Years of life lost due to mortality from land transport accidents (ICD-10 V01-V89).
Statistic
Crude rate per 10,000
population and number of
years of life lost
Directly age-standardised rate
per 10,000 population and
number of deaths
Sex
Age group
MFP <75
MFP <75
Organisation
(see glossary)
Current
data
Trend
data
File-worksheet name
E&W, E, GOR,
ONS area, SHA,
LA, PCO, CTY
E&W, E, GOR,
ONS area, SHA,
LA, PCO, CTY
2006-08
22J_024CR_08_V1
2006-08
22J_024DR_08_V1
Numerator:
Numerator data – Years of life lost and deaths from land transport accidents classified by underlying cause of
death (ICD-10 V01-V89), registered in the respective calendar year(s).
Source of numerator data – Office for National Statistics (ONS).
Comments on numerator data – The number of years of life lost is calculated by summing over ages 1 to 74 years
the number of deaths at each age multiplied by the number of years of life remaining up to age 75 years. Infant
deaths are omitted as they are mostly a result of causes specific to this age group and have different aetiologies to
deaths later in life.
The numerator presented alongside the sdirecgtly age-tandardised years of life lost rate is the number of deaths
rather than the number of years of life lost. This is because the standardisation calculation has been performed
using 5-year age bands. In each age band the number of deaths is weighted by the number of years of life
remaining from the mid-point of the age band up to age 75 years. See annex 3 for more details.
Mortality data for years 1993-2006 were extracted by ONS in June 2007 with organisational codes assigned using
the postcode of usual residence and the November 2006 edition of the National Statistics Postcode Directory
(NSPD). Data for subsequent years were extracted in June of the following year using the respective year’s
November edition of the NSPD.
In January 2001, the ONS implemented a change from ICD-9 to ICD-10 for coding causes of death in England &
Wales. As part of an exercise to investigate the effects of this change, the ONS also re-coded all deaths registered
in 1999. Deaths for years prior to 1999 and for year 2000 have not been re-coded.
For current analysis, therefore, all data are based on ICD-10.
From the 2003 Compendium onwards, data are based on the original causes of death rather than the final causes
used in earlier Compendia.
See Annex 2 for more details.
Denominator:
Denominator data - 2001 Census based mid-year population estimates for the respective calendar years.
Source of denominator data - ONS.
Comments on denominator data - Data are based on the latest revisions of ONS mid-year population estimates for
the respective years, current as at 1 October 2009.
185
Statistical methods:
Annex 2: Changes to Office for National Statistics mortality data
Annex 3: Explanations of statistical methods used in the Compendium
Annex 5: European Standard Population
Interpretation of indicators:
Quality of indicator - Annex 12 describes the criteria that should be used to judge the quality of this indicator. The
application of the criteria is dependent on the context (e.g. describing a single organisation, comparing several
organisations) and the level (e.g. national / regional with large numbers of events, local with small numbers of
events) at which the data are to be used.
Further reading:
1.
2.
Office for National Statistics. Twentieth Century Mortality Trends in England and Wales. Office for National
Statistics Health Statistics Quarterly, No. 18, 2003: 5-17. Available at:
http://www.statistics.gov.uk/downloads/theme_health/HSQ18_revised_21Aug03.pdf
Brock A, Griffiths C. Trends in the mortality of young adults aged 15-44 in England and Wales, 1961-2001.
Office for National Statistics Health Statistics Quarterly, No. 19, 2003: 22-31. Available at:
http://www.statistics.gov.uk/downloads/theme_health/HSQ19.pdf
Updated: December 2009
186
Mortality from asthma
Purpose:
To reduce deaths from asthma.
Definition of indicator and its variants:
Mortality from asthma (ICD-10 J45-46 equivalent to ICD-9 493).
Statistic
Number of deaths
Average age-specific death
rate per 100,000 resident
population
Indirectly age-standardised
mortality ratio (SMR) and
number of deaths
Directly age-standardised
mortality rate per 100,000 and
number of deaths
Sex
Age group
MFP 1+, 1-4, 5-14,
15-34, 35-64,
65-74, 75+
MFP 1+, 1-4, 5-14,
15-34, 35-64,
65-74, 75+
MFP All ages,
5-44
All ages
MFP All ages,
5-44
Organisation
(see glossary)
Current
data
E&W, E, GOR,
ONS area, SHA,
LA, PCO, CTY
E&W, E, GOR,
ONS area, SHA,
LA, PCO, CTY
E&W, E, GOR,
ONS area, SHA,
LA, PCO, CTY
2008
23A_028NO_08_V1
2006-08
23A_028CR_08_V1
2006-08
23A_028SM00++_08_V1
23A_028SM0544_08_V1
E&W, E, GOR,
ONS area, SHA,
LA, PCO, CTY
All ages
2006-08
Trend
data
File-worksheet name
1993-08 23A_028SMT00++_08_V1
23A_028DR00++_08_V1
23A_028DR0544_08_V1
1993-08 23A_028DRT00++_08_V1
Numerator:
Numerator data - Deaths from asthma, classified by underlying cause of death (ICD-10 J45-46, ICD-9 493
adjusted), registered in the respective calendar year(s).
Source of numerator data - Office for National Statistics (ONS).
Comments on numerator data – Mortality data for years 1993-2006 were extracted by ONS in June 2007 with
organisational codes assigned using the postcode of usual residence and the November 2006 edition of the
National Statistics Postcode Directory (NSPD). Data for subsequent years were extracted in June of the following
year using the respective year’s November edition of the NSPD.
In January 2001, the ONS implemented a change from ICD-9 to ICD-10 for coding causes of death in England &
Wales. As part of an exercise to investigate the effects of this change, the ONS also re-coded all deaths registered
in 1999. Deaths for years prior to 1999 and for year 2000 have not been re-coded.
For current analysis, therefore, all data are based on ICD-10.
For trend analysis, the numbers of deaths observed in the years 1993-98 and 2000 must be adjusted to give
“expected” numbers of deaths which would have been coded to this cause in ICD-10. This is done by multiplying
the ICD-9 based death counts by the appropriate ICD-10/9 comparability ratio published by the ONS. Trend data
cannot include years prior to 1993, because the ONS introduced automated coding in 1993, and the comparability
ratios are only valid from this point onwards.
For this indicator the following ICD-10/9 comparability ratios were used:
Males
Females
All Ages: 1
All Ages: 1.056
Adjusted person counts are the sum of the adjusted male and female counts. Once adjusted, the counts are used
to calculate rates in the usual way.
From the 2003 Compendium onwards, data are based on the original causes of death rather than the final causes
used in earlier Compendia.
See Annex 2 for more details.
Denominator:
Denominator data - 2001 Census based mid-year population estimates for the respective calendar years.
187
Source of denominator data - ONS.
Comments on denominator data - Data are based on the latest revisions of ONS mid-year population estimates for
the respective years, current as at 1 October 2009.
Statistical methods:
Annex 2: Changes to Office for National Statistics mortality data
Annex 3: Explanations of statistical methods used in the Compendium
Annex 5: European Standard Population
Interpretation of indicators:
Quality of indicator - Annex 12 describes the criteria that should be used to judge the quality of this indicator. The
application of the criteria is dependent on the context (e.g. describing a single organisation, comparing several
organisations) and the level (e.g. national / regional with large numbers of events, local with small numbers of
events) at which the data are to be used.
Further reading:
1.
2.
3.
4.
Scottish Intercollegiate Guidelines Network / British Thoracic Society. British guideline on the management of
Asthma – a national clinical guideline (revised). Edinburgh: Scottish Intercollegiate Guidelines Network, 2004.
Available at: http://www.show.scot.nhs.uk/sign/pdf/sign63.pdf
Pearson M, Goldacre M, Coles J, Amess M, Cleary R, Fletcher J, Mason A, Dixon P, Eastwood A (eds).
Health Outcome Indicators: Asthma. Report of a working group to the Department of Health. Oxford: National
Centre for Health Outcomes Development, 1999. Available at http:// nchod.uhce.ox.ac.uk/asthma.pdf
Prescott-Clarke P, Primatesta P. Health Survey for England - The Health of Young People '95 - 97. London:
TSO, 1998.
World Health Organization pages on asthma : http://www.who.int/topics/asthma/en/
Updated: December 2009
188
Wheeze or diagnosed asthma
Purpose:
To reduce the prevalence of asthma.
Definition of indicator and its variants:
Adults who have ever had wheezing or whistling in the chest or doctor-diagnosed asthma.
Statistic
Sex
Age group
Organisation
(see glossary)
Number, percent and
age-standardised percent
MFP
16+
E, GOR, ONS area,
SHA, CTY
Period
Current
data
Trend
data
2001
File_worksheet name
23B_320VSP2_01_V1
Numerator:
Numerator data - The number of persons aged 16 + who had ever had wheezing or whistling in the chest or
doctor-diagnosed asthma in a sample survey of the health of the population of England.
Source of numerator data - Health Survey for England (HSE), commissioned by the Department of Health and
since April 2005 The Information Centre for health and social care and carried out by the Joint Health Survey Unit
of Social and Community Planning Research and of the Department of Epidemiology and Public Health at
University College, London.
Comments on numerator data - Wheezing is the most commonly used indicator of asthma in prevalence surveys.
Overall 33% of respondents had a history of wheezing and 11% of these were diagnosed asthmatics. A few
respondents (1%) who were diagnosed as suffering from asthma reported not to have a history of wheezing.
Denominator:
Denominator data - Respondents aged 16+ in a sample survey of the health of the population of England.
Source of denominator data - See “Numerator data”.
Comments on denominator data - The Health Survey for England is a series of annual surveys that began in 1991
with the aim of monitoring the health of the population. It was designed to measure health and health related
behaviours in adults and children living in private households in England. For each participant, the survey included
an interview and a physical examination by a nurse, at which various physical measurements, tests, and samples
of blood and saliva were collected. These measurements provided biomedical information about known risk factors
associated with disease and objective validation for self-reported health behaviour.
Statistical methods:
The figures have been provided for three-year periods (based on three-year moving averages) and for calendar
years. All calculations of sub-national observed estimates at Government Office Region, ONS area, Strategic
Health Authority and County levels, age-standardised rates, confidence intervals and significance tests were
carried out by the National Centre for Social Research (see Annex 9 for details).
Interpretation of indicators:
Quality of indicator - Annex 12 describes the criteria that should be used to judge the quality of this indicator. The
application of the criteria is dependent on the context (e.g. describing a single organisation, comparing several
organisations) and the level (e.g. national / regional with large numbers of events, local with small numbers of
events) at which the data are to be used.
Further reading:
1.
2.
Scholes S, Prescott A and Bajekal M. Health and lifestyle indicators for Strategic Health Authorities, 19942002, London: National Centre for Social Research, 2004. Available at:
http://www.dh.gov.uk/assetRoot/04/07/77/31/04077731.pdf
Joint Health Surveys Unit, National Centre for Social Research and Department of Epidemiology and Public
Health, the Royal Free and University College Medical School, London. The Health Survey for England Cardiovascular disease. London: Her Majesty’s Stationery Office, 1998.
Updated: June 2008
189
Prevalence: asthma and prescribed medication
Purpose:
To ascertain the prevalence of asthma from General Practice records and help ensure high standards of primary
health care and treatment delivered to NHS patients.
Asthma is a chronic, episodic disease which is not easy to define. One of the main difficulties in asthma is its
variable and intermittent nature. This makes definition of asthma prevalence complex and open to interpretation
and opinion. It is a common condition which responds well to appropriate management and which is principally
managed in primary care. The diagnosis of asthma is a clinical one and there is no confirmatory diagnostic blood
test, radiological investigation or histopathological investigation. In most people, the diagnosis can be corroborated
by suggestive changes in lung function tests.
Definition of indicator and its variants:
Proportion of all patients with asthma, excluding patients with an asthma diagnosis who have not been prescribed
any asthma related drugs in the previous twelve months, in a GP registered population. A proportion of patients
st
with COPD will also have asthma. From 1 April 2006 these patients should be recorded on both the asthma and
COPD registers.
Because of the need to focus on patients most likely to benefit from intensive monitoring, the QOF asthma
registers exclude patients who have had no prescription for asthma drugs during the last 12 months. Such patients
may still have a diagnosis of asthma, but may have minimal symptoms not requiring treatment.
Statistic
Sex
Age
group
Organisation
(see glossary)
Number and percent of
patients
P
All Ages
E, GOR, SHA,
PCO
Period
Current
data
FY 2008/09
File_worksheet Name
Trend data
23C_649PC_09_V1
Numerator:
Numerator data - Patients registered with GP practices with a coded diagnosis of asthma who have been
prescribed asthma related drugs.
Source of numerator data - Quality and Outcomes Framework (QOF).
Comments on numerator data - The data for this primary care indicator are derived from the Quality Management
Analysis System (QMAS) and supplied by the Prescribing Support Unit at The NHS Information Centre for health
and social care. The QOF is part of the General Medical Services (GMS) contract, with a focus on prevalence and
management of common chronic diseases at general practice level. It is aimed at measuring the achievement of
general practices against a set of evidence based negotiated standards and encouraging good practice.
The data to support the clinical quality indicators (i.e. clinical achievement data) are extracted from individual GP
practice clinical systems and sent automatically to QMAS once a month. Practices can make additional
submissions of clinical data at any time.
Denominator:
Denominator data - All patients registered with GP practices (total practice list size).
Source of denominator data - See “Numerator data”.
Comments on denominator data - The practice list sizes are supplied to QMAS from the National Health
Applications and Infrastructure Services (NHAIS).
Statistical methods:
The data are presented as raw (unadjusted) figures as recorded by the practices. Ideally, comparisons between
PCOs should take into account differences between their populations in terms of age, gender and case-mix.
However, this is not possible at present as the supplied data are not broken down by these characteristics
Interpretation of indicators:
Quality of indicator - Users of data derived from QMAS should recognise that QMAS was established as a
mechanism to support the calculation of practice QOF payments and not as a person based epidemiological tool.
190
It is not a comprehensive source of data on quality of care in general practice, but it is potentially a rich and
valuable source of such information, providing that the limitations of the data are acknowledged.
st
th
From 2009 onwards, National Prevalence Day has been moved to 31 March (previously 14 February) so that
prevalence is calculated on the same basis as disease registers for indicator denominators.
There have been some significant revisions to the QOF, compared to previous years. Therefore direct
comparisons cannot be made except for the indicators that have not been subject to definitional changes.
Further reading:
1.
The NHS Information Centre for health and social care. National Quality and Outcomes Framework
Achievement Data 2008/09, September 2009. Available at: http://www.ic.nhs.uk/webfiles/QOF/200809/QOF%20Achievement%20and%20Prevalence%20Bulletin%202008-09.pdf
2. NHS Employers and General Practitioners Committee BMA. Quality and Outcomes Framework guidance for
GMS contract 2008/09, April 2008. Available at:
http://www.nhsemployers.org/SiteCollectionDocuments/QUALITY_OUT_COMPLETE_CD_110209.pdf
3. The NHS Information Centre for health and social care. National Quality and Outcomes Framework Statistics
for England 2007/08. Available at:
http://www.ic.nhs.uk/webfiles/QOF/2007-08/QOF%20200708%20Statistical%20Bulletin.pdf
4. The Information Centre for health and social care, Prescribing Support Unit. National Quality and Outcomes
Framework Statistics for England 2006/07, 2007. Available at:
http://www.ic.nhs.uk/webfiles/QOF/2006-07/QOF%202006-07%20Statistical%20Bulletin.pdf
5. The Information Centre for health and social care, Prescribing Support Unit. National Quality and Outcomes
Framework or England 2005/06, 2007. Available at:
http://www.ic.nhs.uk/webfiles/publications/qof/NationalQualityOutcomesFramework280906_PDF.pdf
6. The Health and Social Care Information Centre, National Quality and Outcomes Framework Statistics for
England 2004/05. London: Bulletin, Available at:
http://www.ic.nhs.uk/webfiles/publications/qof0405/QOF0405_Statistical_Bulletin.pdf
7. Ashworth M, Armstrong D. The relationship between general practice characteristics and quality of care: a
national survey of quality indicators used in the UK Quality and Outcomes Framework, 2004-5, BMC Family
Practice, London: Ashworth and Armstrong, 2006 7:68. Available at:
http://www.biomedcentral.com/1471-2296/7/68
8. Department of Health, Investing in General Practice. The New General Medical Services Contract. Available
at: http://www.dh.gov.uk/assetRoot/04/07/86/58/04078658.pdf
9. Eastern Region Public Health Observatory, The limitations of Quality and Outcomes Framework (QOF) data.
Briefing No. 3, 2005. Available at:
http://www.erpho.org.uk/Download/Public/12597/1/Briefing%2003%20The%20limitations%20of%20QOF%20d
ata.pdf
10. Lung & Asthma Information Agency, Estimating the prevalence of asthma: QOF v Health Survey for England,
2006. Available at: http://www.laia.ac.uk/QOF.htm
Updated: October 2010
191
Prevalence: asthma with measures of variability or reversibility
Purpose:
To ascertain the prevalence of asthma from General Practice records and help ensure high standards of primary
health care and treatment delivered to NHS patients.
Accurate diagnosis is fundamental in order to avoid untreated symptoms as a result of under-diagnosis, and
inappropriate treatment as a result of over-diagnosis. Measurements of airflow limitation, its reversibility and its
variability are considered useful in establishing a clear diagnosis of asthma.
Definition of indicator and its variants:
Proportion of patients aged eight and over diagnosed as having asthma with measures of variability or reversibility.
Statistic
Sex
Age
group
Organisation
(see glossary)
Number and percent of
patients
P
8+
E, GOR, SHA,
PCO
Period
Current
data
FY 2008/09
File_worksheet Name
Trend data
23D_673PC_09_V1
Numerator:
Numerator data - Patients on the asthma register (diagnosed after 1st April 2006) whose diagnosis has been
confirmed by spirometry or peak expiratory flow rate carried out at any time after and up to three months before a
diagnosis was recorded.
Source of numerator data - Quality and Outcomes Framework (QOF).
Comments on numerator data - The data for this primary care indicator are derived from the Quality Management
Analysis System (QMAS) and supplied by the Prescribing Support Unit at The NHS Information Centre for health
and social care. The QOF is part of the General Medical Services (GMS) contract, with a focus on prevalence and
management of common chronic diseases at general practice level. It is aimed at measuring the achievement of
general practices against a set of evidence based negotiated standards and encouraging good practice.
The data to support the clinical quality indicators (i.e. clinical achievement data) are extracted from individual GP
practice clinical systems and sent automatically to QMAS once a month. Practices can make additional
submissions of clinical data at any time.
The ‘reference date’ is the specified date of patient records held by the general practice modelled for the end of the
st
QOF year (midnight 31 March). It is the same for the data from all practices and may differ from the date of data
submission.
Denominator:
Denominator data - Patients on the asthma register where the diagnosis has been confirmed by spirometry or
peak flow measurement excluding those who have been exception reported. Patients may be exception reported
for the following reasons:
•
aged under eight years;
•
asthma diagnosis recorded before 1st April 2006;
•
registered in the three months before the reference date;
•
asthma exception reported in the 15 months before the reference date;
•
asthma diagnosis recorded in the three months before the reference date.
For more details regarding the description of the selection criteria and dataset rules of the relevant indicator set
see the following documentation available at: http://www.wmrlmc.co.uk/gms2/informationtechnology.htm
Source of denominator data - See “Numerator data”.
Comments on denominator data - The denominator is a count of patients for whom the clinical indicator should be
met. However, the selection rules do not provide the same opportunity for all patients included in the denominator
to take advantage of the full period (maximum number of months after the diagnosis) allowed by good practice for
the test, measurement or treatment to be undertaken (e.g. if good practice for angina patients allows for a
particular test to be conducted up to 12 months after diagnosis then patients diagnosed between four and 11
months before the reference date do not have the full period of 12 months for the test). Additionally, patients can
be removed from the denominator through the application of exception reporting.
192
Statistical methods:
The data are presented as raw (unadjusted) figures as recorded by the practices. Ideally, comparisons between
PCOs should take into account differences between their populations in terms of age, gender and case-mix.
However, this is not possible at present as the supplied data are not broken down by these characteristics.
Interpretation of indicators:
Quality of indicator - Users of data derived from QMAS should recognise that QMAS was established as a
mechanism to support the calculation of practice QOF payments and not as a person based epidemiological tool.
It is not a comprehensive source of data on quality of care in general practice, but it is potentially a rich and
valuable source of such information, providing that the limitations of the data are acknowledged.
There have been some significant revisions to the QOF, compared to previous years. Therefore direct
comparisons cannot be made except for the indicators that have not been subject to definitional changes.
Further reading:
1.
The NHS Information Centre for health and social care. National Quality and Outcomes Framework
Achievement Data 2008/09, September 2009. Available at: http://www.ic.nhs.uk/webfiles/QOF/200809/QOF%20Achievement%20and%20Prevalence%20Bulletin%202008-09.pdf
2. NHS Employers and General Practitioners Committee BMA. Quality and Outcomes Framework guidance for
GMS contract 2008/09, April 2008. Available at:
http://www.nhsemployers.org/SiteCollectionDocuments/QUALITY_OUT_COMPLETE_CD_110209.pdf
3. The NHS Information Centre for health and social care. National Quality and Outcomes Framework Statistics
for England 2007/08. Available at:
http://www.ic.nhs.uk/webfiles/QOF/2007-08/QOF%20200708%20Statistical%20Bulletin.pdf
4. The Information Centre for health and social care, Prescribing Support Unit. National Quality and Outcomes
Framework Statistics for England 2006/07. Available at:
http://www.ic.nhs.uk/webfiles/QOF/2006-07/QOF%202006-07%20Statistical%20Bulletin.pdf
5. The Information Centre for health and social care, Prescribing Support Unit. National Quality and Outcomes
Framework or England 2005/06. Available at:
http://www.ic.nhs.uk/webfiles/publications/qof/NationalQualityOutcomesFramework280906_PDF.pdf
6. The Health and Social Care Information Centre, National Quality and Outcomes Framework Statistics for
England 2004/05. Available at:
http://www.ic.nhs.uk/webfiles/publications/qof0405/QOF0405_Statistical_Bulletin.pdf
7. Ashworth M, Armstrong D. The relationship between general practice characteristics and quality of care: a
national survey of quality indicators used in the UK Quality and Outcomes Framework, 2004-5, BMC Family
Practice, London: Ashworth and Armstrong, 2006 7:68. Available at:
http://www.biomedcentral.com/1471-2296/7/68
8. Department of Health, Investing in General Practice. The New General Medical Services Contract. Available
at: http://www.dh.gov.uk/assetRoot/04/07/86/58/04078658.pdf
9. Eastern Region Public Health Observatory, The limitations of Quality and Outcomes Framework (QOF) data.
Briefing No. 3, 2005. Available at:
http://www.erpho.org.uk/Download/Public/12597/1/Briefing%2003%20The%20limitations%20of%20QOF%20
data.pdf
10. Lung & Asthma Information Agency, Estimating the prevalence of asthma: QOF v Health Survey for England,
2006. Available at: http://www.laia.ac.uk/QOF.htm
Updated: October 2010
193
Asthma review among patients with asthma
Purpose:
To help reduce the level of risk to health for NHS patients with asthma and ensure high standards of primary
health care and treatment delivered to them.
Structured care has been shown to produce benefits for patients with asthma. Although there is good evidence on
the use of personalised asthma plans in secondary care, there is very limited evidence in primary care. A typical
asthma review should include assessing symptoms, measuring peak flow, assessing inhaler technique and
considering a personalised asthma plan. It is recognised that a significant number of patients with asthma do not
regularly attend for review.
Definition of indicator and its variants:
Proportion of patients on the asthma register who have had an asthma review in the last 15 months.
Statistic
Sex
Age
group
Organisation
(see glossary)
Number and percent of
patients
P
All Ages
E, GOR, SHA,
PCO
Period
Current
data
FY 2008/09
File_worksheet Name
Trend data
23F_652PC_09_V1
Numerator:
Numerator data - Patients on the asthma register who have had an asthma review in the 15 months before the
reference date.
Source of numerator data - Quality and Outcomes Framework (QOF).
Comments on numerator data - The data for this primary care indicator are derived from the Quality Management
Analysis System (QMAS) and supplied by the Prescribing Support Unit at The NHS Information Centre for health
and social care. The QOF is part of the General Medical Services (GMS) contract, with a focus on prevalence and
management of common chronic diseases at general practice level. It is aimed at measuring the achievement of
general practices against a set of evidence based negotiated standards and encouraging good practice.
The data to support the clinical quality indicators (i.e. clinical achievement data) are extracted from individual GP
practice clinical systems and sent automatically to QMAS once a month. Practices can make additional
submissions of clinical data at any time.
The ‘reference date’ is the specified date of patient records held by the general practice modelled for the end of the
st
QOF year (midnight 31 March). It is the same for the data from all practices and may differ from the date of data
submission.
Denominator:
Denominator data - Patients on the asthma register excluding those who have been exception reported. Patients
may be exception reported for the following reasons:
•
registered in the three months before the reference date;
•
asthma exception reported in the 15 months before the reference date;
•
asthma diagnosis recorded in the three months before the reference date.
For more details regarding the description of the selection criteria and dataset rules of the relevant indicator set
see the following documentation available at: http://www.wmrlmc.co.uk/gms2/informationtechnology.htm
Source of denominator data - See “Numerator data”.
Comments on denominator data - The denominator is a count of patients for whom the clinical indicator should be
met. However, the selection rules do not provide the same opportunity for all patients included in the denominator
to take advantage of the full period (maximum number of months after the diagnosis) allowed by good practice for
the test, measurement or treatment to be undertaken (e.g. if good practice for angina patients allows for a
particular test to be conducted up to 12 months after diagnosis then patients diagnosed between four and 11
months before the reference date do not have the full period of 12 months for the test). Additionally, patients can
be removed from the denominator through the application of exception reporting.
194
Statistical methods:
The data are presented as raw (unadjusted) figures as recorded by the practices. Ideally, comparisons between
PCOs should take into account differences between their populations in terms of age, gender and case-mix.
However, this is not possible at present as the supplied data are not broken down by these characteristics.
Interpretation of indicators:
Quality of indicator - Users of data derived from QMAS should recognise that QMAS was established as a
mechanism to support the calculation of practice QOF payments and not as a person based epidemiological tool.
It is not a comprehensive source of data on quality of care in general practice, but it is potentially a rich and
valuable source of such information, providing that the limitations of the data are acknowledged.
There have been some significant revisions to the QOF, compared to previous years. Therefore direct
comparisons cannot be made except for the indicators that have not been subject to definitional changes.
Further reading:
1.
The NHS Information Centre for health and social care. National Quality and Outcomes Framework
Achievement Data 2008/09, September 2009. Available at: http://www.ic.nhs.uk/webfiles/QOF/200809/QOF%20Achievement%20and%20Prevalence%20Bulletin%202008-09.pdf
2. NHS Employers and General Practitioners Committee BMA. Quality and Outcomes Framework guidance for
GMS contract 2008/09, April 2008. Available at:
http://www.nhsemployers.org/SiteCollectionDocuments/QUALITY_OUT_COMPLETE_CD_110209.pdf
3. The NHS Information Centre for health and social care. National Quality and Outcomes Framework Statistics
for England 2007/08. Available at:
http://www.ic.nhs.uk/webfiles/QOF/2007-08/QOF%20200708%20Statistical%20Bulletin.pdf
4. The Information Centre for health and social care, Prescribing Support Unit. National Quality and Outcomes
Framework Statistics for England 2006/07. Available at:
http://www.ic.nhs.uk/webfiles/QOF/2006-07/QOF%202006-07%20Statistical%20Bulletin.pdf
5. The Information Centre for health and social care, Prescribing Support Unit. National Quality and Outcomes
Framework or England 2005/06. Available at:
http://www.ic.nhs.uk/webfiles/publications/qof/NationalQualityOutcomesFramework280906_PDF.pdf
6. The Health and Social Care Information Centre, National Quality and Outcomes Framework Statistics for
England 2004/05. Available at:
http://www.ic.nhs.uk/webfiles/publications/qof0405/QOF0405_Statistical_Bulletin.pdf
7. Ashworth M, Armstrong D. The relationship between general practice characteristics and quality of care: a
national survey of quality indicators used in the UK Quality and Outcomes Framework, 2004-5, BMC Family
Practice, London: Ashworth and Armstrong, 2006 7:68. Available at:
http://www.biomedcentral.com/1471-2296/7/68
8. Department of Health, Investing in General Practice. The New General Medical Services Contract. Available
at: http://www.dh.gov.uk/assetRoot/04/07/86/58/04078658.pdf
9. Eastern Region Public Health Observatory, The limitations of Quality and Outcomes Framework (QOF) data.
Briefing No. 3, 2005. Available at:
http://www.erpho.org.uk/Download/Public/12597/1/Briefing%2003%20The%20limitations%20of%20QOF%20
data.pdf
10. Lung & Asthma Information Agency, Estimating the prevalence of asthma: QOF v Health Survey for England,
2006. Available at: http://www.laia.ac.uk/QOF.htm
Updated: October 2010
195
Years of life lost due to mortality from asthma
Purpose:
Years of life lost (YLL) is a measure of premature mortality. Its primary purpose is to compare the relative
importance of different causes of premature death within a particular population and it can therefore be used by
health planners to define priorities for the prevention of such deaths. It can also be used to compare the premature
mortality experience of different populations for a particular cause of death. The concept of years of life lost is to
estimate the length of time a person would have lived had they not died prematurely. By inherently including the
age at which the death occurs, rather than just the fact of its occurrence, the calculation is an attempt to better
quantify the burden, or impact, on society from the specified cause of mortality.
Definition of indicator and its variants:
Years of life lost due to mortality from asthma (ICD-10 J45-J46).
Statistic
Crude rate per 10,000
population and number of
years of life lost
Directly age-standardised rate
per 10,000 population and
number of deaths
Sex
Age group
MFP <75
MFP <75
Organisation
(see glossary)
Current
data
Trend
data
File-worksheet name
E&W, E, GOR,
ONS area, SHA,
LA, PCO, CTY
E&W, E, GOR,
ONS area, SHA,
LA, PCO, CTY
2006-08
23H_027CR_08_V1
2006-08
23H_027DR_08_V1
Numerator:
Numerator data – Years of life lost and deaths from asthmaclassified by underlying cause of death (ICD-10 J45J46), registered in the respective calendar year(s).
Source of numerator data – Office for National Statistics (ONS).
Comments on numerator data – The number of years of life lost is calculated by summing over ages 1 to 74 years
the number of deaths at each age multiplied by the number of years of life remaining up to age 75 years. Infant
deaths are omitted as they are mostly a result of causes specific to this age group and have different aetiologies to
deaths later in life.
The numerator presented alongside the sdirecgtly age-tandardised years of life lost rate is the number of deaths
rather than the number of years of life lost. This is because the standardisation calculation has been performed
using 5-year age bands. In each age band the number of deaths is weighted by the number of years of life
remaining from the mid-point of the age band up to age 75 years. See annex 3 for more details.
Mortality data for years 1993-2006 were extracted by ONS in June 2007 with organisational codes assigned using
the postcode of usual residence and the November 2006 edition of the National Statistics Postcode Directory
(NSPD). Data for subsequent years were extracted in June of the following year using the respective year’s
November edition of the NSPD.
In January 2001, the ONS implemented a change from ICD-9 to ICD-10 for coding causes of death in England &
Wales. As part of an exercise to investigate the effects of this change, the ONS also re-coded all deaths registered
in 1999. Deaths for years prior to 1999 and for year 2000 have not been re-coded.
For current analysis, therefore, all data are based on ICD-10.
From the 2003 Compendium onwards, data are based on the original causes of death rather than the final causes
used in earlier Compendia.
See Annex 2 for more details.
Denominator:
Denominator data - 2001 Census based mid-year population estimates for the respective calendar years.
Source of denominator data - ONS.
Comments on denominator data - Data are based on the latest revisions of ONS mid-year population estimates for
the respective years, current as at 1 October 2009.
196
Statistical methods:
Annex 2: Changes to Office for National Statistics mortality data
Annex 3: Explanations of statistical methods used in the Compendium
Annex 5: European Standard Population
Interpretation of indicators:
Quality of indicator - Annex 12 describes the criteria that should be used to judge the quality of this indicator. The
application of the criteria is dependent on the context (e.g. describing a single organisation, comparing several
organisations) and the level (e.g. national / regional with large numbers of events, local with small numbers of
events) at which the data are to be used.
Further reading:
1.
2.
3.
4.
Scottish Intercollegiate Guidelines Network / British Thoracic Society. British guideline on the management of
Asthma – a national clinical guideline (revised). Edinburgh: Scottish Intercollegiate Guidelines Network, 2004.
Available at: http://www.show.scot.nhs.uk/sign/pdf/sign63.pdf
Pearson M, Goldacre M, Coles J, Amess M, Cleary R, Fletcher J, Mason A, Dixon P, Eastwood A (eds).
Health Outcome Indicators: Asthma. Report of a working group to the Department of Health. Oxford: National
Centre for Health Outcomes Development, 1999. Available at http:// nchod.uhce.ox.ac.uk/asthma.pdf
Prescott-Clarke P, Primatesta P. Health Survey for England - The Health of Young People '95 - 97. London:
TSO, 1998.
World Health Organization pages on asthma : http://www.who.int/topics/asthma/en/
Updated: December 2009
197
Mortality from bronchitis and emphysema
Purpose:
To reduce deaths from bronchitis and emphysema.
Definition of indicator and its variants:
Mortality from bronchitis and emphysema (ICD-10 J40-J43 equivalent to ICD-9 490-492). This indicator is included
for continuity with previous Compendia. However, it is recommended that the new indicator ‘mortality from
bronchitis, emphysema and other chronic obstructive pulmonary disease’ be used instead, especially when
analysing trend data.
Statistic
Number of deaths
Average age-specific death
rate per 100,000 resident
population
Indirectly age-standardised
mortality ratio (SMR) and
number of deaths
Sex
Age group
MFP 1+, 1-4, 5-14,
15-34, 35-64,
65-74, 75+
MFP 1+, 1-4, 5-14,
15-34, 35-64,
65-74, 75+
MFP All ages,
<75
Organisation
(see glossary)
Current
data
E&W, E, GOR,
ONS area, SHA,
LA, PCO, CTY
E&W, E, GOR,
ONS area, SHA,
LA, PCO, CTY
E&W, E, GOR,
ONS area, SHA,
LA, PCO, CTY
2008
24A_037NO_08_V1
2006-08
24A_037CR_08_V1
2006-08
24A_037SM00++_08_V1
24A_037SM0074_08_V1
All ages
Directly age-standardised
mortality rate per 100,000 and
numbers of deaths
MFP All ages,
<75
Trend
data
File-worksheet name
1993-08 24A_037SMT00++_08_V1
E&W, E, GOR,
ONS area, SHA,
LA, PCO, CTY
All ages
2006-08
24A_037DR00++_08_V1
24A_037DR0074_08_V1
1993-08 24A_037DRT00++_08_V1
Numerator:
Numerator data - Deaths from bronchitis and emphysema, classified by underlying cause of death (ICD-10 J40J43, ICD-9 490-492 adjusted), registered in the respective calendar year(s).
Source of numerator data - Office for National Statistics (ONS).
Comments on numerator data – Mortality data for years 1993-2006 were extracted by ONS in June 2007 with
organisational codes assigned using the postcode of usual residence and the November 2006 edition of the
National Statistics Postcode Directory (NSPD). Data for subsequent years were extracted in June of the following
year using the respective year’s November edition of the NSPD.
In January 2001, the ONS implemented a change from ICD-9 to ICD-10 for coding causes of death in England &
Wales. As part of an exercise to investigate the effects of this change, the ONS also re-coded all deaths registered
in 1999. Deaths for years prior to 1999 and for year 2000 have not been re-coded.
For current analysis, therefore, all data are based on ICD-10.
For trend analysis, the numbers of deaths observed in the years 1993-98 and 2000 must be adjusted to give
“expected” numbers of deaths which would have been coded to this cause in ICD-10. This is done by multiplying
the ICD-9 based death counts by the appropriate ICD-10/9 comparability ratio published by the ONS. Trend data
cannot include years prior to 1993, because the ONS introduced automated coding in 1993, and the comparability
ratios are only valid from this point onwards.
For this indicator the following ICD-10/9 comparability ratios were used:
Males
Females
All Ages: 0.66
All Ages: 0.787
Adjusted person counts are the sum of the adjusted male and female counts. Once adjusted, the counts are used
to calculate rates in the usual way.
From the 2003 Compendium onwards, data are based on the original causes of death rather than the final causes
used in earlier Compendia.
198
See Annex 2 for more details.
Denominator:
Denominator data - 2001 Census based mid-year population estimates for the respective calendar years.
Source of denominator data - ONS.
Comments on denominator data - Data are based on the latest revisions of ONS mid-year population estimates for
the respective years, current as at 1 October 2009.
Statistical methods:
Annex 2: Changes to Office for National Statistics mortality data
Annex 3: Explanations of statistical methods used in the Compendium
Interpretation of indicators:
Quality of indicator - Annex 12 describes the criteria that should be used to judge the quality of this indicator. The
application of the criteria is dependent on the context (e.g. describing a single organisation, comparing several
organisations) and the level (e.g. national / regional with large numbers of events, local with small numbers of
events) at which the data are to be used.
Relevant National initiatives:
1.
NHS Scotland. A smoking cessation policy for Scotland. Health Education Board for Scotland, ASH Scotland
Further reading:
1.
2.
3.
4.
5.
World Health Organization. Tobacco-Free Initiative. Geneva: World Health Organization, 2005. Available at:
http://www.who.int/tobacco/en/
British Heart Foundation. Stopping Smoking: evidence-based guidance. British Heart Foundation, 2001.
Department of Health. The Expert Patient: New Approaches to Chronic Disease Management for the 21st
Century. London: Department of Health, 2001. Available at:
http://www.dh.gov.uk/assetRoot/04/10/27/61/04102761.pdf
World Bank. Economics of Tobacco Control. Washington: World Bank, 1999.
Centre for Disease Control. National Tobacco information Online system. Centre for Disease Control website:
http://apps.nccd.cdc.gov/nations/
Updated: December 2009
199
Mortality from bronchitis, emphysema and other chronic obstructive pulmonary disease
Purpose:
To reduce deaths from bronchitis, emphysema and other chronic obstructive pulmonary disease.
Definition of indicator and its variants:
Mortality from bronchitis and emphysema and other chronic obstructive pulmonary disease (ICD-10 J40-J44
equivalent to ICD-9 490-492, 496). This is a new indicator included from the December 2006 Compendium release
and is designed to replace the previous indicator ‘mortality from bronchitis and emphysema’ .
Statistic
Number of deaths
Average age-specific death
rate per 100,000 resident
population
Indirectly age-standardised
mortality ratio (SMR) and
numbers of deaths
Sex
Age group
MFP 1+, 1-4, 5-14,
15-34, 35-64,
65-74, 75+
MFP 1+, 1-4, 5-14,
15-34, 35-64,
65-74, 75+
MFP All ages,
<75
Organisation
(see glossary)
Current
data
E&W, E, GOR,
ONS area, SHA,
LA, PCO, CTY
E&W, E, GOR,
ONS area, SHA,
LA, PCO, CTY
E&W, E, GOR,
ONS area, SHA,
LA, PCO, CTY
2008
24B_038NO_08_V1
2006-08
24B_038CR_08_V1
2006-08
24B_038SM00++_08_V1
24B_038SM0074_08_V1
All ages
Directly age-standardised
mortality rate per 100,000 and
number of deaths
MFP All ages,
<75
Trend
data
File-worksheet name
1993-08 24B_038SMT00++_08_V1
E&W, E, GOR,
ONS area, SHA,
LA, PCO, CTY
All ages
2006-08
24B_038DR00++_08_V1
24B_038DR0074_08_V1
1993-08 24B_038DRT00++_08_V1
Numerator:
Numerator data - Deaths from bronchitis, emphysema and other chronic obstructive pulmonary disease, classified
by underlying cause of death (ICD-10 J40-J44, ICD-9 490-492, 496 adjusted), registered in the respective
calendar year(s).
Source of numerator data - Office for National Statistics (ONS).
Comments on numerator data – Mortality data for years 1993-2006 were extracted by ONS in June 2007 with
organisational codes assigned using the postcode of usual residence and the November 2006 edition of the
National Statistics Postcode Directory (NSPD). Data for subsequent years were extracted in June of the following
year using the respective year’s November edition of the NSPD.
In January 2001, the ONS implemented a change from ICD-9 to ICD-10 for coding causes of death in England &
Wales. As part of an exercise to investigate the effects of this change, the ONS also re-coded all deaths registered
in 1999. Deaths for years prior to 1999 and for year 2000 have not been re-coded.
For current analysis, therefore, all data are based on ICD-10.
For trend analysis, the numbers of deaths observed in the years 1993-98 and 2000 must be adjusted to give
“expected” numbers of deaths which would have been coded to this cause in ICD-10. This is done by multiplying
the ICD-9 based death counts by the appropriate ICD-10/9 comparability ratio published by the ONS. Trend data
cannot include years prior to 1993, because the ONS introduced automated coding in 1993, and the comparability
ratios are only valid from this point onwards.
For this indicator the following ICD-10/9 comparability ratios were used:
Males
Females
All Ages: 1.035
All Ages: 1.035
Adjusted person counts are the sum of the adjusted male and female counts. Once adjusted, the counts are used
to calculate rates in the usual way.
From the 2003 Compendium onwards, data are based on the original causes of death rather than the final causes
used in earlier Compendia.
200
See Annex 2 for more details.
Denominator:
Denominator data - 2001 Census based mid-year population estimates for the respective calendar years.
Source of denominator data - ONS.
Comments on denominator data - Data are based on the latest revisions of ONS mid-year population estimates for
the respective years, current as at 1 October 2009.
Statistical methods:
Annex 2: Changes to Office for National Statistics mortality data
Annex 3: Explanations of statistical methods used in the Compendium
Interpretation of indicators:
Quality of indicator - Annex 12 describes the criteria that should be used to judge the quality of this indicator. The
application of the criteria is dependent on the context (e.g. describing a single organisation, comparing several
organisations) and the level (e.g. national / regional with large numbers of events, local with small numbers of
events) at which the data are to be used.
Relevant National initiatives:
1.
NHS Scotland. A smoking cessation policy for Scotland. Health Education Board for Scotland, ASH Scotland
Further reading:
1.
2.
3.
4.
5.
World Health Organization. Tobacco-Free Initiative. Geneva: World Health Organization, 2005. Available at:
http://www.who.int/tobacco/en/
British Heart Foundation. Stopping Smoking: evidence-based guidance. British Heart Foundation, 2001.
Department of Health. The Expert Patient: New Approaches to Chronic Disease Management for the 21st
Century. London: Department of Health, 2001. Available at:
http://www.dh.gov.uk/assetRoot/04/10/27/61/04102761.pdf
World Bank. Economics of Tobacco Control. Washington: World Bank, 1999.
Centre for Disease Control. National Tobacco information Online system. Centre for Disease Control website:
http://apps.nccd.cdc.gov/nations/
Updated: December 2009
201
Prevalence: chronic obstructive pulmonary disease
Purpose:
To ascertain the prevalence of chronic obstructive pulmonary disease (COPD) from General Practice records and
help ensure high standards of primary health care and treatment delivered to NHS patients.
COPD is a common disabling condition with a high mortality. A diagnosis of COPD should be considered in any
patient who has symptoms of persistent cough, sputum production, dyspnoea, and/or a history of exposure to risk
factors for the disease.
The majority of patients with COPD are managed by general practitioners and members of the primary healthcare
team with onward referral to secondary care when required.
The most effective treatment is smoking cessation.
Definition of indicator and its variants:
Proportion of all patients with COPD in a GP registered population.
Where patients have co-existing COPD and asthma then they should be on both disease registers. Approximately
15 per cent of patients with COPD will also have asthma.
Statistic
Sex
Age
group
Organisation
(see glossary)
Number and percent of
patients
P
All Ages
E, GOR, SHA,
PCO
Period
Current
data
FY 2008/09
File_worksheet Name
Trend data
24C_634PC_09_V1
Numerator:
Numerator data - Patients registered with GP practices with a coded diagnosis of COPD.
Source of numerator data - Quality and Outcomes Framework (QOF).
Comments on numerator data - The data for this primary care indicator are derived from the Quality Management
Analysis System (QMAS) and supplied by the Prescribing Support Unit at The NHS Information Centre for health
and social care. The QOF is part of the General Medical Services (GMS) contract, with a focus on prevalence and
management of common chronic diseases at general practice level. It is aimed at measuring the achievement of
general practices against a set of evidence based negotiated standards and encouraging good practice.
The data to support the clinical quality indicators (i.e. clinical achievement data) are extracted from individual GP
practice clinical systems and sent automatically to QMAS once a month. Practices can make additional
submissions of clinical data at any time.
Denominator:
Denominator data - All patients registered with GP practices (total practice list size).
Source of denominator data - See “Numerator data”.
Comments on denominator data - The practice list sizes are supplied to QMAS from the National Health
Applications and Infrastructure Services (NHAIS).
Statistical methods:
The data are presented as raw (unadjusted) figures as recorded by the practices. Ideally, comparisons between
PCOs should take into account differences between their populations in terms of age, gender and case-mix.
However, this is not possible at present as the supplied data are not broken down by these characteristics.
Interpretation of indicators:
Quality of indicator - Users of data derived from QMAS should recognise that QMAS was established as a
mechanism to support the calculation of practice QOF payments and not as a person based epidemiological tool.
It is not a comprehensive source of data on quality of care in general practice, but it is potentially a rich and
valuable source of such information, providing that the limitations of the data are acknowledged.
202
From 2009 onwards, National Prevalence Day has been moved to 31st March (previously 14th February) so that
prevalence is calculated on the same basis as disease registers for indicator denominators.
There have been some significant revisions to the QOF, compared to previous years. Therefore direct
comparisons cannot be made except for the indicators that have not been subject to definitional changes.
Further reading:
11. The NHS Information Centre for health and social care. National Quality and Outcomes Framework
Achievement Data 2008/09, September 2009. Available at: http://www.ic.nhs.uk/webfiles/QOF/200809/QOF%20Achievement%20and%20Prevalence%20Bulletin%202008-09.pdf
12. NHS Employers and General Practitioners Committee BMA. Quality and Outcomes Framework guidance for
GMS contract 2008/09, April 2008. Available at:
http://www.nhsemployers.org/SiteCollectionDocuments/QUALITY_OUT_COMPLETE_CD_110209.pdf
13. The NHS Information Centre for health and social care. National Quality and Outcomes Framework Statistics
for England 2007/08. Available at:
http://www.ic.nhs.uk/webfiles/QOF/2007-08/QOF%20200708%20Statistical%20Bulletin.pdf
14. The Information Centre for health and social care, Prescribing Support Unit. National Quality and Outcomes
Framework Statistics for England 2006/07, 2007. Available at:
http://www.ic.nhs.uk/webfiles/QOF/2006-07/QOF%202006-07%20Statistical%20Bulletin.pdf
15. The Information Centre for health and social care, Prescribing Support Unit. National Quality and Outcomes
Framework or England 2005/06, 2007. Available at:
http://www.ic.nhs.uk/webfiles/publications/qof/NationalQualityOutcomesFramework280906_PDF.pdf
16. The Health and Social Care Information Centre, National Quality and Outcomes Framework Statistics for
England 2004/05. London: Bulletin, Available at:
http://www.ic.nhs.uk/webfiles/publications/qof0405/QOF0405_Statistical_Bulletin.pdf
17. Ashworth M, Armstrong D. The relationship between general practice characteristics and quality of care: a
national survey of quality indicators used in the UK Quality and Outcomes Framework, 2004-5, BMC Family
Practice, London: Ashworth and Armstrong, 2006 7:68. Available at:
http://www.biomedcentral.com/1471-2296/7/68
18. Department of Health, Investing in General Practice. The New General Medical Services Contract. Available
at: http://www.dh.gov.uk/assetRoot/04/07/86/58/04078658.pdf
19. Eastern Region Public Health Observatory, The limitations of Quality and Outcomes Framework (QOF) data.
Briefing No. 3, 2005. Available at:
http://www.erpho.org.uk/Download/Public/12597/1/Briefing%2003%20The%20limitations%20of%20QOF%20d
ata.pdf
Updated: October 2010
203
Prevalence: chronic obstructive pulmonary disease confirmed by spirometry
Purpose:
To ascertain the prevalence of chronic obstructive pulmonary disease (COPD) from General Practice records and
help ensure high standards of primary health care and treatment delivered to NHS patients.
Where patients have a long standing diagnosis of COPD and the clinical picture is clear, it would not be essential
to confirm the diagnosis by spirometry. However, where there is doubt about the diagnosis, spirometry may be
carried out for confirmation.
Definition of indicator and its variants:
Proportion of all patients for whom the diagnosis has been confirmed by post bronchodilator spirometry.
Statistic
Sex
Age
group
Organisation
(see glossary)
Number and percent of
patients
P
All Ages
E, GOR, SHA,
PCO
Period
Current
data
FY 2008/09
File_worksheet Name
Trend data
24D_635PC_09_V1
Numerator:
Numerator data - Patients on the COPD register (diagnosed after 1st April 2008) with a record of a post
bronchodilator spirometry undertaken at any time between three months before and 12 months after a diagnosis is
recorded.
Source of numerator data - Quality and Outcomes Framework (QOF).
Comments on numerator data - The data for this primary care indicator are derived from the Quality Management
Analysis System (QMAS) and supplied by the Prescribing Support Unit at The NHS Information Centre for health
and social care. The QOF is part of the General Medical Services (GMS) contract, with a focus on prevalence and
management of common chronic diseases at general practice level. It is aimed at measuring the achievement of
general practices against a set of evidence based negotiated standards and encouraging good practice.
The data to support the clinical quality indicators (i.e. clinical achievement data) are extracted from individual GP
practice clinical systems and sent automatically to QMAS once a month. Practices can make additional
submissions of clinical data at any time.
The ‘reference date’ is the specified date of patient records held by the general practice modelled for the end of the
st
QOF year (midnight 31 March). It is the same for the data from all practices and may differ from the date of data
submission.
There have been some definitional changes in 2008/09 which have affected the data for this indicator. The
spirometry has been made more explicit in asking for post bronchodilator. The changes apply to new diagnoses
st
from 1 April 2008. For more details see ‘Changes to Quality and Outcomes Framework for 2008’ available at:
http://www.nhsemployers.org/SiteCollectionDocuments/27_3_08_Proposed_Changes_to_Quality_and_Outcomes
_Framework_for_2008__FINAL_CD_110209.pdf
Denominator:
Denominator data - Patients on the COPD register excluding those who have been exception reported. Patients
may be exception reported for the following reasons:
•
COPD diagnosis not recorded
•
COPD diagnosis recorded before 1st April 2008;
•
registered in the three months before the reference date;
•
COPD exception reported in the 15 months before the reference date;
•
spirometry exception reported in the 15 months before the reference date
•
COPD diagnosis recorded in the three months before the reference date.
For more details regarding the description of the selection criteria and dataset rules of the relevant indicator set
see the following documentation available at: http://www.wmrlmc.co.uk/gms2/informationtechnology.htm
Source of denominator data - See “Numerator data”.
Comments on denominator data - The denominator is a count of patients for whom the clinical indicator should be
met. However, the selection rules do not provide the same opportunity for all patients included in the denominator
to take advantage of the full period (maximum number of months after the diagnosis) allowed by good practice for
204
the test, measurement or treatment to be undertaken (e.g. if good practice for angina patients allows for a
particular test to be conducted up to 12 months after diagnosis then patients diagnosed between four and 11
months before the reference date do not have the full period of 12 months for the test). Additionally, patients can
be removed from the denominator through the application of exception reporting.
Statistical methods:
The data are presented as raw (unadjusted) figures as recorded by the practices. Ideally, comparisons between
PCOs should take into account differences between their populations in terms of age, gender and case-mix.
However, this is not possible at present as the supplied data are not broken down by these characteristics.
Interpretation of indicators:
Quality of indicator - Users of data derived from QMAS should recognise that QMAS was established as a
mechanism to support the calculation of practice QOF payments and not as a person based epidemiological tool.
It is not a comprehensive source of data on quality of care in general practice, but it is potentially a rich and
valuable source of such information, providing that the limitations of the data are acknowledged.
There have been some significant revisions to the QOF, compared to previous years. Therefore direct
comparisons cannot be made except for the indicators that have not been subject to definitional changes.
Further reading:
1.
2.
3.
4.
5.
6.
7.
8.
9.
The NHS Information Centre for health and social care. National Quality and Outcomes Framework
Achievement Data 2008/09, September 2009. Available at: http://www.ic.nhs.uk/webfiles/QOF/200809/QOF%20Achievement%20and%20Prevalence%20Bulletin%202008-09.pdf
NHS Employers and General Practitioners Committee BMA. Quality and Outcomes Framework guidance for
GMS contract 2008/09, April 2008. Available at:
http://www.nhsemployers.org/SiteCollectionDocuments/QUALITY_OUT_COMPLETE_CD_110209.pdf
The NHS Information Centre for health and social care. National Quality and Outcomes Framework Statistics
for England 2007/08. Available at:
http://www.ic.nhs.uk/webfiles/QOF/2007-08/QOF%20200708%20Statistical%20Bulletin.pdf
The Information Centre for health and social care, Prescribing Support Unit. National Quality and Outcomes
Framework Statistics for England 2006/07. Available at:
http://www.ic.nhs.uk/webfiles/QOF/2006-07/QOF%202006-07%20Statistical%20Bulletin.pdf
The Information Centre for health and social care, Prescribing Support Unit. National Quality and Outcomes
Framework or England 2005/06. Available at:
http://www.ic.nhs.uk/webfiles/publications/qof/NationalQualityOutcomesFramework280906_PDF.pdf
The Health and Social Care Information Centre, National Quality and Outcomes Framework Statistics for
England 2004/05. Available at:
http://www.ic.nhs.uk/webfiles/publications/qof0405/QOF0405_Statistical_Bulletin.pdf
Ashworth M, Armstrong D. The relationship between general practice characteristics and quality of care: a
national survey of quality indicators used in the UK Quality and Outcomes Framework, 2004-5, BMC Family
Practice, London: Ashworth and Armstrong, 2006 7:68. Available at:
http://www.biomedcentral.com/1471-2296/7/68
Department of Health, Investing in General Practice. The New General Medical Services Contract. Available
at: http://www.dh.gov.uk/assetRoot/04/07/86/58/04078658.pdf
Eastern Region Public Health Observatory, The limitations of Quality and Outcomes Framework (QOF) data.
Briefing No. 3, 2005. Available at:
http://www.erpho.org.uk/Download/Public/12597/1/Briefing%2003%20The%20limitations%20of%20QOF%20d
ata.pdf
Updated: October 2010
205
FeV1 checks for patients with chronic obstructive pulmonary disease
Purpose:
To help reduce the level of risk to health for NHS patients with chronic obstructive pulmonary disease (COPD) and
ensure high standards of primary health care and treatment delivered to them.
There is a gradual deterioration in lung function in patients with COPD. This deterioration accelerates with the
passage of time. There are important interventions which can improve quality of life in patients with severe COPD.
It is therefore important to monitor respiratory function in order to identify patients who might benefit from
pulmonary rehabilitation or continuous oxygen therapy.
Definition of indicator and its variants:
Proportion of patients with COPD with a record of a FeV1 test in the previous 15 months. COPD is diagnosed if
patient has an FeV1 of less than 80 per cent of predicted normal and has an FeV1/FVC ratio of less than 70 per
cent and the patient has symptoms consistent with COPD.
Statistic
Sex
Age
group
Organisation
(see glossary)
Number and percent of
patients
P
All Ages
E, GOR, SHA,
PCO
Period
Current
data
FY 2008/09
File_worksheet Name
Trend data
24F_637PC_09_V1
Numerator:
Numerator data - Patients on the COPD register with a record of a FeV1 test undertaken in the 15 months before
the reference date.
Source of numerator data - Quality and Outcomes Framework (QOF).
Comments on numerator data - The data for this primary care indicator are derived from the Quality Management
Analysis System (QMAS) and supplied by the Prescribing Support Unit at The NHS Information Centre for health
and social care. The QOF is part of the General Medical Services (GMS) contract, with a focus on prevalence and
management of common chronic diseases at general practice level. It is aimed at measuring the achievement of
general practices against a set of evidence based negotiated standards and encouraging good practice.
The data to support the clinical quality indicators (i.e. clinical achievement data) are extracted from individual GP
practice clinical systems and sent automatically to QMAS once a month. Practices can make additional
submissions of clinical data at any time.
The ‘reference date’ is the specified date of patient records held by the general practice modelled for the end of the
QOF year (midnight 31st March). It is the same for the data from all practices and may differ from the date of data
submission.
Denominator:
Denominator data - Patients on the COPD register excluding those who have been exception reported. Patients
may be exception reported for the following reasons:
•
registered in the three months before the reference date;
•
COPD exception reported in the 15 months before the reference date;
•
COPD diagnosis recorded in the three months before the reference date.
For more details regarding the description of the selection criteria and dataset rules of the relevant indicator set
see the following documentation available at: http://www.wmrlmc.co.uk/gms2/informationtechnology.htm
Source of denominator data - See “Numerator data”.
Comments on denominator data - The denominator is a count of patients for whom the clinical indicator should be
met. However, the selection rules do not provide the same opportunity for all patients included in the denominator
to take advantage of the full period (maximum number of months after the diagnosis) allowed by good practice for
the test, measurement or treatment to be undertaken (e.g. if good practice for angina patients allows for a
particular test to be conducted up to 12 months after diagnosis then patients diagnosed between four and 11
months before the reference date do not have the full period of 12 months for the test). Additionally, patients can
be removed from the denominator through the application of exception reporting.
206
Statistical methods:
The data are presented as raw (unadjusted) figures as recorded by the practices. Ideally, comparisons between
PCOs should take into account differences between their populations in terms of age, gender and case-mix.
However, this is not possible at present as the supplied data are not broken down by these characteristics.
Interpretation of indicators:
Quality of indicator - Users of data derived from QMAS should recognise that QMAS was established as a
mechanism to support the calculation of practice QOF payments and not as a person based epidemiological tool.
It is not a comprehensive source of data on quality of care in general practice, but it is potentially a rich and
valuable source of such information, providing that the limitations of the data are acknowledged.
There have been some significant revisions to the QOF, compared to previous years. Therefore direct
comparisons cannot be made except for the indicators that have not been subject to definitional changes.
Further reading:
1.
2.
3.
4.
5.
6.
7.
8.
9.
The NHS Information Centre for health and social care. National Quality and Outcomes Framework
Achievement Data 2008/09, September 2009. Available at: http://www.ic.nhs.uk/webfiles/QOF/200809/QOF%20Achievement%20and%20Prevalence%20Bulletin%202008-09.pdf
NHS Employers and General Practitioners Committee BMA. Quality and Outcomes Framework guidance for
GMS contract 2008/09, April 2008. Available at:
http://www.nhsemployers.org/SiteCollectionDocuments/QUALITY_OUT_COMPLETE_CD_110209.pdf
The NHS Information Centre for health and social care. National Quality and Outcomes Framework Statistics
for England 2007/08. Available at:
http://www.ic.nhs.uk/webfiles/QOF/2007-08/QOF%20200708%20Statistical%20Bulletin.pdf
The Information Centre for health and social care, Prescribing Support Unit. National Quality and Outcomes
Framework Statistics for England 2006/07. Available at:
http://www.ic.nhs.uk/webfiles/QOF/2006-07/QOF%202006-07%20Statistical%20Bulletin.pdf
The Information Centre for health and social care, Prescribing Support Unit. National Quality and Outcomes
Framework or England 2005/06. Available at:
http://www.ic.nhs.uk/webfiles/publications/qof/NationalQualityOutcomesFramework280906_PDF.pdf
The Health and Social Care Information Centre, National Quality and Outcomes Framework Statistics for
England 2004/05. Available at:
http://www.ic.nhs.uk/webfiles/publications/qof0405/QOF0405_Statistical_Bulletin.pdf
Ashworth M, Armstrong D. The relationship between general practice characteristics and quality of care: a
national survey of quality indicators used in the UK Quality and Outcomes Framework, 2004-5, BMC Family
Practice, London: Ashworth and Armstrong, 2006 7:68. Available at:
http://www.biomedcentral.com/1471-2296/7/68
Department of Health, Investing in General Practice. The New General Medical Services Contract. Available
at: http://www.dh.gov.uk/assetRoot/04/07/86/58/04078658.pdf
Eastern Region Public Health Observatory, The limitations of Quality and Outcomes Framework (QOF) data.
Briefing No. 3, 2005. Available at:
http://www.erpho.org.uk/Download/Public/12597/1/Briefing%2003%20The%20limitations%20of%20QOF%20d
ata.pdf
Updated: October 2010
207
Inhaler technique checks for patients with chronic obstructive pulmonary disease
Purpose:
To help reduce the level of risk to health for NHS patients with chronic obstructive pulmonary disease (COPD) and
ensure high standards of primary health care and treatment delivered to them.
There is evidence that inhaled therapies can improve the quality of life in some patients with COPD. However,
there is evidence that patients require training in inhaler technique and that such training requires reinforcement.
Definition of indicator and its variants:
Proportion of patients with COPD receiving inhaled treatment for whom there is a record that inhaler technique has
been checked in the previous 15 months.
Statistic
Sex
Age
group
Organisation
(see glossary)
Number and percent of
patients
P
All Ages
E, GOR, SHA,
PCO
Period
Current
data
FY 2008/09
File_worksheet Name
Trend data
24G_638PC_09_V1
Numerator:
Numerator data - Patients on the COPD register receiving inhaled treatment for whom there is a record that inhaler
technique has been checked in the 15 months before the reference date.
Source of numerator data - Quality and Outcomes Framework (QOF).
Comments on numerator data - The data for this primary care indicator are derived from the Quality Management
Analysis System (QMAS) and supplied by the Prescribing Support Unit at The NHS Information Centre for health
and social care. The QOF is part of the General Medical Services (GMS) contract, with a focus on prevalence and
management of common chronic diseases at general practice level. It is aimed at measuring the achievement of
general practices against a set of evidence based negotiated standards and encouraging good practice.
The data to support the clinical quality indicators (i.e. clinical achievement data) are extracted from individual GP
practice clinical systems and sent automatically to QMAS once a month. Practices can make additional
submissions of clinical data at any time.
The ‘reference date’ is the specified date of patient records held by the general practice modelled for the end of the
st
QOF year (midnight 31 March). It is the same for the data from all practices and may differ from the date of data
submission.
Denominator:
Denominator data - Patients on the COPD register excluding those who have been exception reported. Patients
may be exception reported for the following reasons:
•
no record of inhaled treatment in the 6 months before the reference date;
•
registered in the three months before the reference date;
•
COPD exception reported in the 15 months before the reference date;
•
COPD diagnosis recorded in the three months before the reference date.
For more details regarding the description of the selection criteria and dataset rules of the relevant indicator set
see the following documentation available at: http://www.wmrlmc.co.uk/gms2/informationtechnology.htm
Source of denominator data - See “Numerator data”.
Comments on denominator data - The denominator is a count of patients for whom the clinical indicator should be
met. However, the selection rules do not provide the same opportunity for all patients included in the denominator
to take advantage of the full period (maximum number of months after the diagnosis) allowed by good practice for
the test, measurement or treatment to be undertaken (e.g. if good practice for angina patients allows for a
particular test to be conducted up to 12 months after diagnosis then patients diagnosed between four and 11
months before the reference date do not have the full period of 12 months for the test). Additionally, patients can
be removed from the denominator through the application of exception reporting.
208
Statistical methods:
The data are presented as raw (unadjusted) figures as recorded by the practices. Ideally, comparisons between
PCOs should take into account differences between their populations in terms of age, gender and case-mix.
However, this is not possible at present as the supplied data are not broken down by these characteristics.
Interpretation of indicators:
Quality of indicator - Users of data derived from QMAS should recognise that QMAS was established as a
mechanism to support the calculation of practice QOF payments and not as a person based epidemiological tool.
It is not a comprehensive source of data on quality of care in general practice, but it is potentially a rich and
valuable source of such information, providing that the limitations of the data are acknowledged.
There have been some significant revisions to the QOF, compared to previous years. Therefore direct
comparisons cannot be made except for the indicators that have not been subject to definitional changes.
Further reading:
1.
2.
3.
4.
5.
6.
7.
8.
9.
The NHS Information Centre for health and social care. National Quality and Outcomes Framework
Achievement Data 2008/09, September 2009. Available at: http://www.ic.nhs.uk/webfiles/QOF/200809/QOF%20Achievement%20and%20Prevalence%20Bulletin%202008-09.pdf
NHS Employers and General Practitioners Committee BMA. Quality and Outcomes Framework guidance for
GMS contract 2008/09, April 2008. Available at:
http://www.nhsemployers.org/SiteCollectionDocuments/QUALITY_OUT_COMPLETE_CD_110209.pdf
The NHS Information Centre for health and social care. National Quality and Outcomes Framework Statistics
for England 2007/08. Available at:
http://www.ic.nhs.uk/webfiles/QOF/2007-08/QOF%20200708%20Statistical%20Bulletin.pdf
The Information Centre for health and social care, Prescribing Support Unit. National Quality and Outcomes
Framework Statistics for England 2006/07. Available at:
http://www.ic.nhs.uk/webfiles/QOF/2006-07/QOF%202006-07%20Statistical%20Bulletin.pdf
The Information Centre for health and social care, Prescribing Support Unit. National Quality and Outcomes
Framework or England 2005/06. Available at:
http://www.ic.nhs.uk/webfiles/publications/qof/NationalQualityOutcomesFramework280906_PDF.pdf
The Health and Social Care Information Centre, National Quality and Outcomes Framework Statistics for
England 2004/05. Available at:
http://www.ic.nhs.uk/webfiles/publications/qof0405/QOF0405_Statistical_Bulletin.pdf
Ashworth M, Armstrong D. The relationship between general practice characteristics and quality of care: a
national survey of quality indicators used in the UK Quality and Outcomes Framework, 2004-5, BMC Family
Practice, London: Ashworth and Armstrong, 2006 7:68. Available at:
http://www.biomedcentral.com/1471-2296/7/68
Department of Health, Investing in General Practice. The New General Medical Services Contract. Available
at: http://www.dh.gov.uk/assetRoot/04/07/86/58/04078658.pdf
Eastern Region Public Health Observatory, The limitations of Quality and Outcomes Framework (QOF) data.
Briefing No. 3, 2005. Available at:
http://www.erpho.org.uk/Download/Public/12597/1/Briefing%2003%20The%20limitations%20of%20QOF%20d
ata.pdf
Updated: October 2010
209
Vaccination: influenza, for patients with chronic obstructive pulmonary disease
Purpose:
To help reduce the level of risk to health for NHS patients with chronic obstructive pulmonary disease (COPD) and
ensure high standards of primary health care and treatment delivered to them.
The Department of Health and the Joint Committee on Vaccination and Immunisation currently recommend
influenza vaccination for patients with COPD.
Definition of indicator and its variants:
Proportion of patients on the COPD register who have had an influenza vaccination administered.
Statistic
Sex
Age
group
Organisation
(see glossary)
Number and percent of
patients
P
All Ages
E, GOR, SHA,
PCO
Period
Current
data
FY 2008/09
File_worksheet Name
Trend data
24H_639PC_09_V1
Numerator:
Numerator data - Patients on the COPD register who have a record of influenza vaccination in the relevant period
(in the preceding 1st September to 31st March), unless contraindications or side-effects are recorded.
Source of numerator data - Quality and Outcomes Framework (QOF).
Comments on numerator data - The data for this primary care indicator are derived from the Quality Management
Analysis System (QMAS) and supplied by the Prescribing Support Unit at The NHS Information Centre for health
and social care. The QOF is part of the General Medical Services (GMS) contract, with a focus on prevalence and
management of common chronic diseases at general practice level. It is aimed at measuring the achievement of
general practices against a set of evidence based negotiated standards and encouraging good practice.
The data to support the clinical quality indicators (i.e. clinical achievement data) are extracted from individual GP
practice clinical systems and sent automatically to QMAS once a month. Practices can make additional
submissions of clinical data at any time.
The ‘reference date’ is the specified date of patient records held by the general practice modelled for the end of the
st
QOF year (midnight 31 March). It is the same for the data from all practices and may differ from the date of data
submission.
Denominator:
Denominator data - Patients on the COPD register excluding those who have been exception reported. Patients
may be exception reported for the following reasons:
•
registered in the three months before the reference date;
•
COPD exception reported in the 15 months before the reference date;
•
COPD diagnosis recorded in the three months before the reference date;
•
persistent influenza vaccination contraindications recorded;
•
expiring influenza vaccination contraindications recorded in the 15 months before the reference date.
For more details regarding the description of the selection criteria and dataset rules of the relevant indicator set
see the following documentation available at: http://www.wmrlmc.co.uk/gms2/informationtechnology.htm
Source of denominator data - See “Numerator data”.
Comments on denominator data - The denominator is a count of patients for whom the clinical indicator should be
met. However, the selection rules do not provide the same opportunity for all patients included in the denominator
to take advantage of the full period (maximum number of months after the diagnosis) allowed by good practice for
the test, measurement or treatment to be undertaken (e.g. if good practice for angina patients allows for a
particular test to be conducted up to 12 months after diagnosis then patients diagnosed between four and 11
months before the reference date do not have the full period of 12 months for the test). Additionally, patients can
be removed from the denominator through the application of exception reporting.
210
Statistical methods:
The data are presented as raw (unadjusted) figures as recorded by the practices. Ideally, comparisons between
PCOs should take into account differences between their populations in terms of age, gender and case-mix.
However, this is not possible at present as the supplied data are not broken down by these characteristics.
Interpretation of indicators:
Quality of indicator - Users of data derived from QMAS should recognise that QMAS was established as a
mechanism to support the calculation of practice QOF payments and not as a person based epidemiological tool.
It is not a comprehensive source of data on quality of care in general practice, but it is potentially a rich and
valuable source of such information, providing that the limitations of the data are acknowledged.
There have been some significant revisions to the QOF, compared to previous years. Therefore direct
comparisons cannot be made except for the indicators that have not been subject to definitional changes.
Further reading:
1.
2.
3.
4.
5.
6.
7.
8.
9.
The NHS Information Centre for health and social care. National Quality and Outcomes Framework
Achievement Data 2008/09, September 2009. Available at: http://www.ic.nhs.uk/webfiles/QOF/200809/QOF%20Achievement%20and%20Prevalence%20Bulletin%202008-09.pdf
NHS Employers and General Practitioners Committee BMA. Quality and Outcomes Framework guidance for
GMS contract 2008/09, April 2008. Available at:
http://www.nhsemployers.org/SiteCollectionDocuments/QUALITY_OUT_COMPLETE_CD_110209.pdf
The NHS Information Centre for health and social care. National Quality and Outcomes Framework Statistics
for England 2007/08. Available at:
http://www.ic.nhs.uk/webfiles/QOF/2007-08/QOF%20200708%20Statistical%20Bulletin.pdf
The Information Centre for health and social care, Prescribing Support Unit. National Quality and Outcomes
Framework Statistics for England 2006/07. Available at:
http://www.ic.nhs.uk/webfiles/QOF/2006-07/QOF%202006-07%20Statistical%20Bulletin.pdf
The Information Centre for health and social care, Prescribing Support Unit. National Quality and Outcomes
Framework or England 2005/06. Available at:
http://www.ic.nhs.uk/webfiles/publications/qof/NationalQualityOutcomesFramework280906_PDF.pdf
The Health and Social Care Information Centre, National Quality and Outcomes Framework Statistics for
England 2004/05. Available at:
http://www.ic.nhs.uk/webfiles/publications/qof0405/QOF0405_Statistical_Bulletin.pdf
Ashworth M, Armstrong D. The relationship between general practice characteristics and quality of care: a
national survey of quality indicators used in the UK Quality and Outcomes Framework, 2004-5, BMC Family
Practice, London: Ashworth and Armstrong, 2006 7:68. Available at:
http://www.biomedcentral.com/1471-2296/7/68
Department of Health, Investing in General Practice. The New General Medical Services Contract. Available
at: http://www.dh.gov.uk/assetRoot/04/07/86/58/04078658.pdf
Eastern Region Public Health Observatory, The limitations of Quality and Outcomes Framework (QOF) data.
Briefing No. 3, 2005. Available at:
http://www.erpho.org.uk/Download/Public/12597/1/Briefing%2003%20The%20limitations%20of%20QOF%20d
ata.pdf
Updated: October 2010
211
Years of life lost due to mortality from bronchitis and emphysema
Purpose:
Years of life lost (YLL) is a measure of premature mortality. Its primary purpose is to compare the relative
importance of different causes of premature death within a particular population and it can therefore be used by
health planners to define priorities for the prevention of such deaths. It can also be used to compare the premature
mortality experience of different populations for a particular cause of death. The concept of years of life lost is to
estimate the length of time a person would have lived had they not died prematurely. By inherently including the
age at which the death occurs, rather than just the fact of its occurrence, the calculation is an attempt to better
quantify the burden, or impact, on society from the specified cause of mortality.
Definition of indicator and its variants:
Years of life lost due to mortality from bronchitis and emphysema (ICD-10 J40-J43).
Statistic
Crude rate per 10,000
population and number of
years of life lost
Directly age-standardised rate
per 10,000 population and
number of deaths
Sex
Age group
MFP <75
MFP <75
Organisation
(see glossary)
Current
data
Trend
data
File-worksheet name
E&W, E, GOR,
ONS area, SHA,
LA, PCO, CTY
E&W, E, GOR,
ONS area, SHA,
LA, PCO, CTY
2006-08
24I_031CR_08_V1
2006-08
24I_031DR_08_V1
Numerator:
Numerator data – Years of life lost and deaths from bronchitis and emphysema classified by underlying cause of
death (ICD-10 J40-J43), registered in the respective calendar year(s).
Source of numerator data – Office for National Statistics (ONS).
Comments on numerator data – The number of years of life lost is calculated by summing over ages 1 to 74 years
the number of deaths at each age multiplied by the number of years of life remaining up to age 75 years. Infant
deaths are omitted as they are mostly a result of causes specific to this age group and have different aetiologies to
deaths later in life.
The numerator presented alongside the sdirecgtly age-tandardised years of life lost rate is the number of deaths
rather than the number of years of life lost. This is because the standardisation calculation has been performed
using 5-year age bands. In each age band the number of deaths is weighted by the number of years of life
remaining from the mid-point of the age band up to age 75 years. See annex 3 for more details.
Mortality data for years 1993-2006 were extracted by ONS in June 2007 with organisational codes assigned using
the postcode of usual residence and the November 2006 edition of the National Statistics Postcode Directory
(NSPD). Data for subsequent years were extracted in June of the following year using the respective year’s
November edition of the NSPD.
In January 2001, the ONS implemented a change from ICD-9 to ICD-10 for coding causes of death in England &
Wales. As part of an exercise to investigate the effects of this change, the ONS also re-coded all deaths registered
in 1999. Deaths for years prior to 1999 and for year 2000 have not been re-coded.
For current analysis, therefore, all data are based on ICD-10.
From the 2003 Compendium onwards, data are based on the original causes of death rather than the final causes
used in earlier Compendia.
See Annex 2 for more details.
Denominator:
Denominator data - 2001 Census based mid-year population estimates for the respective calendar years.
Source of denominator data - ONS.
Comments on denominator data - Data are based on the latest revisions of ONS mid-year population estimates for
the respective years, current as at 1 October 2009.
212
Statistical methods:
Annex 2: Changes to Office for National Statistics mortality data
Annex 3: Explanations of statistical methods used in the Compendium
Annex 5: European Standard Population
Interpretation of indicators:
Quality of indicator - Annex 12 describes the criteria that should be used to judge the quality of this indicator. The
application of the criteria is dependent on the context (e.g. describing a single organisation, comparing several
organisations) and the level (e.g. national / regional with large numbers of events, local with small numbers of
events) at which the data are to be used.
Relevant National initiatives:
1.
NHS Scotland. A smoking cessation policy for Scotland. Health Education Board for Scotland, ASH Scotland
Further reading:
1.
2.
3.
4.
5.
World Health Organization. Tobacco-Free Initiative. Geneva: World Health Organization, 2005. Available at:
http://www.who.int/tobacco/en/
British Heart Foundation. Stopping Smoking: evidence-based guidance. British Heart Foundation, 2001.
Department of Health. The Expert Patient: New Approaches to Chronic Disease Management for the 21st
Century. London: Department of Health, 2001. Available at:
http://www.dh.gov.uk/assetRoot/04/10/27/61/04102761.pdf
World Bank. Economics of Tobacco Control. Washington: World Bank, 1999.
Centre for Disease Control. National Tobacco information Online system. Centre for Disease Control website:
http://apps.nccd.cdc.gov/nations/
Updated: December 2009
213
Years of life lost due to mortality from bronchitis, emphysema and
other chronic obstructive pulmonary disease
Purpose:
Years of life lost (YLL) is a measure of premature mortality. Its primary purpose is to compare the relative
importance of different causes of premature death within a particular population and it can therefore be used by
health planners to define priorities for the prevention of such deaths. It can also be used to compare the premature
mortality experience of different populations for a particular cause of death. The concept of years of life lost is to
estimate the length of time a person would have lived had they not died prematurely. By inherently including the
age at which the death occurs, rather than just the fact of its occurrence, the calculation is an attempt to better
quantify the burden, or impact, on society from the specified cause of mortality.
Definition of indicator and its variants:
Years of life lost due to mortality from bronchitis, emphysema and other chronic obstructive pulmonary disease
(ICD-10 J40-J44).
Statistic
Crude rate per 10,000
population and number of
years of life lost
Directly age-standardised rate
per 10,000 population and
number of deaths
Sex
Age group
MFP <75
MFP <75
Organisation
(see glossary)
Current
data
Trend
data
File-worksheet name
E&W, E, GOR,
ONS area, SHA,
LA, PCO, CTY
E&W, E, GOR,
ONS area, SHA,
LA, PCO, CTY
2006-08
24J_032CR_08_V1
2006-08
24J_032DR_08_V1
Numerator:
Numerator data – Years of life lost and deaths from bronchitis, emphysema and other chronic obstructive
pulmonary disease classified by underlying cause of death (ICD-10 J40-J44), registered in the respective calendar
year(s).
Source of numerator data – Office for National Statistics (ONS).
Comments on numerator data – The number of years of life lost is calculated by summing over ages 1 to 74 years
the number of deaths at each age multiplied by the number of years of life remaining up to age 75 years. Infant
deaths are omitted as they are mostly a result of causes specific to this age group and have different aetiologies to
deaths later in life.
The numerator presented alongside the sdirecgtly age-tandardised years of life lost rate is the number of deaths
rather than the number of years of life lost. This is because the standardisation calculation has been performed
using 5-year age bands. In each age band the number of deaths is weighted by the number of years of life
remaining from the mid-point of the age band up to age 75 years. See annex 3 for more details.
Mortality data for years 1993-2006 were extracted by ONS in June 2007 with organisational codes assigned using
the postcode of usual residence and the November 2006 edition of the National Statistics Postcode Directory
(NSPD). Data for subsequent years were extracted in June of the following year using the respective year’s
November edition of the NSPD.
In January 2001, the ONS implemented a change from ICD-9 to ICD-10 for coding causes of death in England &
Wales. As part of an exercise to investigate the effects of this change, the ONS also re-coded all deaths registered
in 1999. Deaths for years prior to 1999 and for year 2000 have not been re-coded.
For current analysis, therefore, all data are based on ICD-10.
From the 2003 Compendium onwards, data are based on the original causes of death rather than the final causes
used in earlier Compendia.
See Annex 2 for more details.
Denominator:
Denominator data - 2001 Census based mid-year population estimates for the respective calendar years.
Source of denominator data - ONS.
214
Comments on denominator data - Data are based on the latest revisions of ONS mid-year population estimates for
the respective years, current as at 1 October 2009.
Statistical methods:
Annex 2: Changes to Office for National Statistics mortality data
Annex 3: Explanations of statistical methods used in the Compendium
Annex 5: European Standard Population
Interpretation of indicators:
Quality of indicator - Annex 12 describes the criteria that should be used to judge the quality of this indicator. The
application of the criteria is dependent on the context (e.g. describing a single organisation, comparing several
organisations) and the level (e.g. national / regional with large numbers of events, local with small numbers of
events) at which the data are to be used.
Relevant National initiatives:
1.
NHS Scotland. A smoking cessation policy for Scotland. Health Education Board for Scotland, ASH Scotland
Further reading:
1.
2.
3.
4.
5.
World Health Organization. Tobacco-Free Initiative. Geneva: World Health Organization, 2005. Available at:
http://www.who.int/tobacco/en/
British Heart Foundation. Stopping Smoking: evidence-based guidance. British Heart Foundation, 2001.
Department of Health. The Expert Patient: New Approaches to Chronic Disease Management for the 21st
Century. London: Department of Health, 2001. Available at:
http://www.dh.gov.uk/assetRoot/04/10/27/61/04102761.pdf
World Bank. Economics of Tobacco Control. Washington: World Bank, 1999.
Centre for Disease Control. National Tobacco information Online system. Centre for Disease Control website:
http://apps.nccd.cdc.gov/nations/
Updated: December 2009
215
Incidence of all cancers
Purpose:
To reduce the incidence of all cancers.
Definition of indicator and its variants:
Registrations for all cancers excluding skin cancers other than malignant melanoma (ICD-10 C00-C97 exc C44,
equivalent to ICD-9 140-208 exc 173).
Statistic
Indirectly age-standardised
registration ratio (SRR) and
number of registrations
Directly age-standardised
registration rate and number of
registrations
Sex
Age group
Organisation
(see glossary)
Current
data
MFP All ages
<75
E&W, E, GOR, ONS 2004-06
area, SHA, LA, PCO
All ages
MFP All ages
<75
E&W, E, GOR, ONS 2004-06
area, SHA, LA, PCO
All ages
Trend
data
File-worksheet name
11A_077SR00++_06_V1
11A_077SR0074_06_V1
1993-06
11A_077SRT00++_06_V1
11A_077DR00++_06_V1
11A_077DR0074_06_V1
1993-06
11A_077DRT00++_06_V1
Numerator:
Numerator data - Cancer registrations for all cancers excluding skin cancers other than malignant melanoma (ICD10 C00-C97 exc C44, equivalent to ICD-9 140-208 exc 173) in the respective calendar years.
Source of numerator data - Regional Cancer Registries and the Office for National Statistics (ONS).
Comments on numerator data - Registration data for years 1993-2005 were extracted by ONS in November 2008.
Data for 2006 are as registered by the end of September 2008. For all data organisational codes were assigned
using the postcode of usual residence and the August 2008 edition of the National Statistics Postcode Directory.
Results in the current Compendium may differ from those of previous issues because of changes in methodology
to extract data by area, and also because of data enhancements by ONS. Cancer registrations are also
continuously being updated retrospectively and ONS records may have been updated since previous analyses.
Skin cancers other than malignant melanoma (ICD-10 C44, ICD-9 173) are believed to be greatly under reported.
The registration of such cancers varies widely between the regional registries and depends on their ability to
access out-patient records and general practioners. Following ONS practice, the figures presented in the
Compendium for ‘incidence of all cancers’ exclude skin cancers other than malignant melanoma.
Denominator:
Denominator data - 2001 Census based mid-year population estimates for the respective calendar years.
Source of denominator data - ONS.
Comments on denominator data - Data are based on the latest revisions of ONS mid-year population estimates for
the respective years, current as at 29 September 2008.
Statistical methods:
Annex 3: Explanations of statistical methods used in the Compendium
Interpretation of indicators:
Quality of indicator - Annex 12 describes the criteria that should be used to judge the quality of this indicator. The
application of the criteria is dependent on the context (e.g. describing a single organisation, comparing several
organisations) and the level (e.g. national / regional with large numbers of events, local with small numbers of
events) at which the data are to be used.
Further reading:
1.
2.
Department of Health. The NHS cancer plan and the new NHS: Providing a patient-centred service. London:
Department of Health, 2004.
Department of Health. Day Surgery: Operational Guide. Waiting, booking and choice. London: Department of
Health, 2002.
216
3.
4.
Kuper H, Boffetta P, Adami H-O. Tobacco use and cancer causation: association by tumour type. J Intern Med
2002; 252(3): 206-224.
ONS. Cancer Statistics Registrations - Registrations of cancer diagnosed in 2004, England. Series MB1 No
35. London: ONS, 2006. Available at: http://www.statistics.gov.uk/StatBase/Product.asp?vlnk=8843
Updated: May 2009
217
Mortality from all cancers
Purpose:
To reduce deaths from cancer. The directly age-standardised mortality rate from all cancers for persons aged
under 75 is a target indicator in the Saving Lives: Our Healthier Nation strategy (See “Further reading ”). The
target is a 20% reduction by the year 2010 from the baseline rate in 1995-97.
Definition of indicator and its variants:
Mortality from all malignant neoplasms (ICD-10 C00-C97 equivalent to ICD-9 140-208).
Statistic
Number of deaths
Average age-specific death
rate per 100,000 resident
population
Indirectly age-standardised
mortality ratio (SMR) and
number of deaths
Directly age-standardised
mortality rate per 100,000 and
number of deaths
Sex
Age group
MFP 1+, 1-4, 5-14,
15-34, 35-64,
65-74, 75+
MFP 1+, 1-4, 5-14,
15-34, 35-64,
65-74, 75+
MFP All ages,
<65,
<75
65-74
All ages,
<65,
<75
65-74
MFP All ages,
<65,
<75*
65-74
Organisation
(see glossary)
Current
data
E&W, E, GOR,
ONS area, SHA,
LA, PCO, CTY
E&W, E, GOR,
ONS area, SHA,
LA, PCO, CTY
E&W, E, GOR,
ONS area, SHA,
LA, PCO, CTY
2008
11B_075NO_08_V1
2006-08
11B_075CR_08_V1
2006-08
11B_075SM00++_08_V1
11B_075SM0064_08_V1
11B_075SM0074_08_V1
11B_075SM6574_08_V1
E&W, E, GOR,
ONS area, SHA,
LA, PCO, CTY
<75#
2006-08
1995-97#
All ages,
<65,
<75*
65-74
Trend
data
File-worksheet name
1993-08 11B_075SMT00++_08_V1
11B_075SMT0064_08_V1
11B_075SMT0074_08_V1
11B_075SMT6574_08_V1
11B_075DR00++_08_V1
11B_075DR0064_08_V1
11B_075DR0074_08_V1
11B_075DR6574_08_V1
11B_075DR0074_97_V4
1993-08 11B_075DRT00++_08_V1
11B_075DRT0064_08_V1
11B_075DRT0074_08_V1
11B_075DRT6574_08_V1
# Our Healthier Nation baseline
*Additional local authority based aggregates are included for Neighbourhood Renewal Fund and Working
Neighbourhood Fund target monitoring.
Numerator:
Numerator data - Deaths from all malignant neoplasms, classified by underlying cause of death (ICD-10 C00-C97,
ICD-9 140-208 adjusted), registered in the respective calendar year(s).
Source of numerator data - Office for National Statistics (ONS).
Comments on numerator data – Mortality data for years 1993-2006 were extracted by ONS in June 2007 with
organisational codes assigned using the postcode of usual residence and the November 2006 edition of the
National Statistics Postcode Directory (NSPD). Data for subsequent years were extracted in June of the following
year using the respective year’s November edition of the NSPD.
In January 2001, the ONS implemented a change from ICD-9 to ICD-10 for coding causes of death in England &
Wales. As part of an exercise to investigate the effects of this change, the ONS also re-coded all deaths registered
in 1999. Deaths for years prior to 1999 and for year 2000 have not been re-coded.
For current analysis, therefore, all data are based on ICD-10.
For trend analysis, the numbers of deaths observed in the years 1993-98 and 2000 must be adjusted to give
“expected” numbers of deaths which would have been coded to this cause in ICD-10. This is done by multiplying
the ICD-9 based death counts by the appropriate ICD-10/9 comparability ratio published by the ONS. Trend data
cannot include years prior to 1993, because the ONS introduced automated coding in 1993, and the comparability
ratios are only valid from this point onwards.
218
For this indicator the following ICD-10/9 comparability ratios were used:
Males
Females
0-74yrs: 1.013
0-74yrs: 1.009
75-84yrs: 1.028
75-84yrs: 1.025
85+yrs: 1.069
85+yrs: 1.05
Adjusted person counts are the sum of the adjusted male and female counts. Once adjusted, the counts are used
to calculate rates in the usual way.
From the 2003 Compendium onwards, data are based on the original causes of death rather than the final causes
used in earlier Compendia.
See Annex 2 for more details.
Denominator:
Denominator data - 2001 Census based mid-year population estimates for the respective calendar years.
Source of denominator data - ONS.
Comments on denominator data - Data are based on the latest revisions of ONS mid-year population estimates for
the respective years, current as at 1 October 2009.
Statistical methods:
Annex 2: Changes to Office for National Statistics mortality data
Annex 3: Explanations of statistical methods used in the Compendium
Annex 5: European Standard Population
Annex 6: Goals of Our Healthier Nation
Interpretation of indicators:
Quality of indicator - Annex 12 describes the criteria that should be used to judge the quality of this indicator. The
application of the criteria is dependent on the context (e.g. describing a single organisation, comparing several
organisations) and the level (e.g. national / regional with large numbers of events, local with small numbers of
events) at which the data are to be used.
Relevant National initiatives:
1.
2.
3.
4.
5.
6.
Department of Health. The NHS cancer plan and the new NHS: Providing a patient-centred service. London:
Department of Health, 2004.
Department of Health. NHS Cancer Plan. London: Department of Health, 2000.
NHS Executive. Manual of Cancer Services Standards. London: NHS Executive, 2000.
Department of Health. Saving lives: Our Healthier Nation. London: The Stationery Office, 1999.
Department of Health. Smoking kills – a White Paper on tobacco. London: The Stationery Office, 1998.
Department of Health. The Health of the Nation: A Policy Assessed. London: The Stationery Office, 1998.
Further reading:
1.
2.
World Health Organization. WHO Framework on Tobacco Control. Geneva: World Health Organization, 2003.
Available at: http://www.who.int/tobacco/fctc/text/en/fctc_en.pdf
Brock A, Griffiths C. Trends in the mortality of young adults aged 15-44 in England and Wales, 1961-2001.
Office for National Statistics Health Statistics Quarterly, No. 19, 2003: 22-31. Available at:
http://www.statistics.gov.uk/downloads/theme_health/HSQ19.pdf
Updated: December 2009
219
Deaths at home from all cancers
Purpose:
To improve palliative care and service planning for cancer patients in the terminal stages of life, allowing more of
them the choice of dying at home.
Definition of indicator and its variants:
The proportion of deaths from all cancers (ICD-10 C00-C97) that occur at home.
Statistic
Sex
Age group
Percent of deaths at home and
number of deaths at home
MFP All ages
Indirectly age-standardised
deaths at home rate per 100
deaths and number of deaths
at home
MFP All ages
Organisation
(see glossary)
Current
data
E&W, E, GOR, ONS 2006-08
area, SHA, LA,
PCO, CTY
E&W, E, GOR, ONS 2006-08
area, SHA, LA,
PCO, CTY
Trend
data
File-worksheet name
11C_191PC_08_V1
11C_191ISR_08_V1
Numerator:
Numerator data - Deaths at home from all cancers, classified by underlying cause of death (ICD-10 C00-C97),
registered in the respective calendar year(s).
Source of numerator data - Office for National Statistics (ONS).
Comments on numerator data – Mortality data for years 1993-2006 were extracted by ONS in June 2007 with
organisational codes assigned using the postcode of usual residence and the November 2006 edition of the
National Statistics Postcode Directory (NSPD). Data for subsequent years were extracted in June of the following
year using the respective year’s November edition of the NSPD.
Information about the place of death is found on the mortality record in the communal establishment field. It
contains one of:
•
•
•
a 5 digit code identifying a communal establishment or institution (e.g. hospital, nursing home, residential
home);
an “H” code which indicates that the person is certified as having died at their home address and that this
is not a communal establishment or;
an “E” code which indicates that the person died elsewhere.
The communal establishments are themselves classified into 84 categories (e.g. general hospital, mental nursing
home, nursing home etc) and can be further distinguished by whether they are an NHS or Non-NHS
establishment.
It is currently ONS practice to include nursing homes with hospitals under a broader group - “Other hospitals and
communal establishments for the care of the sick” - and also to include residential homes under “Other communal
establishments”. This is because of concerns highlighted by the ONS regarding the accuracy of the recorded
status of some communal establishments, particularly nursing homes and residential homes.
It is therefore not possible to include nursing home or residential home deaths as a “home” death. For this
indicator, a “home” death is defined as one that has the ”H” code in the communal establishment field, i.e. where
the death has occurred at the home address and that address is not of a communal establishment.
Denominator:
Denominator data - All deaths from all cancers, classified by underlying cause of death (ICD-10 C00-C97),
registered in the respective calendar year(s).
Source of denominator data - ONS.
Comments on denominator data - Includes deaths in all categories of communal establishment code, i.e. deaths in
all communal establishments, at home, and elsewhere.
From the 2003 Compendium onwards, data are based on the original causes of death rather than the final causes
used in earlier Compendia. See Annex 2 for more details.
220
Statistical methods:
The age-standardised deaths at home rate utilises the indirect method of standardisation. The direct method was
found not to be robust as it was affected by small numerator and denominator counts in specific age groups.
Indirect standardisation requires the computation of the ratio of an area’s observed number of events to its
expected number of events if it had experienced the standard age-specific rates. This age-standardised ratio can
be converted into a rate by multiplying it by the crude rate of the standard population.
The standard rates used are those of England for the respective calendar year(s). Male and female rates have
been standardised separately. The rate for persons is standardised for both age and sex.
This methodology is similar to that used for the Clinical Indicators and is described in detail in:
Annex 3: Explanations of statistical methods used in the Compendium (under the sections entitled “Indirectly
Standardised Rates For Clinical Indicators” and “Confidence Intervals Of Indirectly Standardised Rates For Clinical
Indicators”).
Interpretation of indicators:
Type of Indicator - This is a generic cross-sectional comparative indicator reflecting events which act as a proxy for
outcome (quality of dying). In the absence of an absolute standard, comparative data are useful for monitoring in
relation to rates achieved in comparable areas.
Quality of indicator - Annex 12 describes the criteria that should be used to judge the quality of this indicator. The
application of the criteria is dependent on the context (e.g. describing a single organisation, comparing several
organisations) and the level (e.g. national / regional with large numbers of events, local with small numbers of
events) at which the data are to be used.
Confidence Intervals - 95%. Some of the values and factors influencing them may be chance occurrences, with
values fluctuating at random between organisations and from year to year. Numbers of deaths may be small at
individual organisational level. The results should therefore be interpreted with caution and with the aid of
confidence intervals. The 95% confidence interval provides a measure of the statistical precision of the rate for an
area or institution. It indicates a range which, with 95% probability, will contain the underlying value of the
indicator. If the confidence interval for an organisation’s rate is outside the range of the national confidence
intervals, the difference between the two rates is considered statistically significant. If the confidence intervals for
two rates overlap, in most cases the difference between the rates would not be considered statistically significant.
Effect of Case-Mix / severity - Severity of the cancer and need for hospital care have implications for those who
wish to die at home being able to do so. The data available do not allow adjustment for these factors.
Other Potential Confounding Factors - A number of factors outside the control of the NHS such as personal
choice, availability of hospices, and family/community support may contribute to the variation shown by the
indicator.
Relevant National initiatives:
1.
2.
3.
4.
Department of Health. End of life care strategy : Promoting high quality care for all adults at the end of life.
London: Department of Health , 2008.
http://www.dh.gov.uk/en/Publicationsandstatistics/Publications/PublicationsPolicyAndGuidance/DH_086277
Department of Health. The NHS cancer plan and the new NHS: Providing a patient-centred service. London:
Department of Health, 2004.
Department of Health. Pioneering Schemes Named Best of the Best. NHS Beacons – Part of a Concerted
Campaign to Improve Cancer Services. Department of Health, 1999. Press release: reference 1999/0375
Commission for Health Improvement. NHS Cancer Care in England and Wales. National Service Framework
Assessments No.1. London: Commission for Health Improvement, 2001.
Further reading:
1.
2.
3.
Higginson I.J, Thompson M. Children and young people who die from cancer: epidemiology and place of
death in England (1995-9). British Medical Journal 2003; 327: 478-479.
Grande GE, Todd CJ, Barclay SIG, Farquhar MC. Does hospital at home for palliative care facilitate death at
home? Randomised controlled trial. British Medical Journal 1999; 319: 1472-1475.
Higginson I.J, Jarman B, Astin P, Dolan S. Do social factors affect where patients die: an analysis of 10 years
of cancer deaths in England. Journal of Public Health Medicine 1999; 21(1): 23-28.
Updated: December 2009
221
Years of life lost due to mortality from all cancers
Purpose:
Years of life lost (YLL) is a measure of premature mortality. Its primary purpose is to compare the relative
importance of different causes of premature death within a particular population and it can therefore be used by
health planners to define priorities for the prevention of such deaths. It can also be used to compare the premature
mortality experience of different populations for a particular cause of death. The concept of years of life lost is to
estimate the length of time a person would have lived had they not died prematurely. By inherently including the
age at which the death occurs, rather than just the fact of its occurrence, the calculation is an attempt to better
quantify the burden, or impact, on society from the specified cause of mortality.
Definition of indicator and its variants:
Years of life lost due to mortality from all cancers (ICD-10 C00-C97).
Statistic
Crude rate per 10,000
population and number of
years of life lost
Directly age-standardised rate
per 10,000 population and
number of deaths
Sex
Age group
MFP <75
MFP <75
Organisation
(see glossary)
Current
data
Trend
data
File-worksheet name
E&W, E, GOR,
ONS area, SHA,
LA, PCO, CTY
E&W, E, GOR,
ONS area, SHA,
LA, PCO, CTY
2006-08
11D_072CR_08_V1
2006-08
11D_072DR_08_V1
Numerator:
Numerator data – Years of life lost and deaths from all cancers classified by underlying cause of death (ICD-10
C00-C97), registered in the respective calendar year(s).
Source of numerator data – Office for National Statistics (ONS).
Comments on numerator data – The number of years of life lost is calculated by summing over ages 1 to 74 years
the number of deaths at each age multiplied by the number of years of life remaining up to age 75 years. Infant
deaths are omitted as they are mostly a result of causes specific to this age group and have different aetiologies to
deaths later in life.
The numerator presented alongside the sdirecgtly age-tandardised years of life lost rate is the number of deaths
rather than the number of years of life lost. This is because the standardisation calculation has been performed
using 5-year age bands. In each age band the number of deaths is weighted by the number of years of life
remaining from the mid-point of the age band up to age 75 years. See annex 3 for more details.
Mortality data for years 1993-2006 were extracted by ONS in June 2007 with organisational codes assigned using
the postcode of usual residence and the November 2006 edition of the National Statistics Postcode Directory
(NSPD). Data for subsequent years were extracted in June of the following year using the respective year’s
November edition of the NSPD.
In January 2001, the ONS implemented a change from ICD-9 to ICD-10 for coding causes of death in England &
Wales. As part of an exercise to investigate the effects of this change, the ONS also re-coded all deaths registered
in 1999. Deaths for years prior to 1999 and for year 2000 have not been re-coded.
For current analysis, therefore, all data are based on ICD-10.
From the 2003 Compendium onwards, data are based on the original causes of death rather than the final causes
used in earlier Compendia.
See Annex 2 for more details.
Denominator:
Denominator data - 2001 Census based mid-year population estimates for the respective calendar years.
Source of denominator data - ONS.
Comments on denominator data - Data are based on the latest revisions of ONS mid-year population estimates for
the respective years, current as at 1 October 2009.
222
Statistical methods:
Annex 2: Changes to Office for National Statistics mortality data
Annex 3: Explanations of statistical methods used in the Compendium
Annex 5: European Standard Population
Interpretation of indicators:
Quality of indicator - Annex 12 describes the criteria that should be used to judge the quality of this indicator. The
application of the criteria is dependent on the context (e.g. describing a single organisation, comparing several
organisations) and the level (e.g. national / regional with large numbers of events, local with small numbers of
events) at which the data are to be used.
Relevant National initiatives:
1.
2.
3.
4.
5.
6.
Department of Health. The NHS cancer plan and the new NHS: Providing a patient-centred service. London:
Department of Health, 2004.
Department of Health. NHS Cancer Plan. London: Department of Health, 2000.
NHS Executive. Manual of Cancer Services Standards. London: NHS Executive, 2000.
Department of Health. Saving lives: Our Healthier Nation. London: The Stationery Office, 1999.
Department of Health. Smoking kills – a White Paper on tobacco. London: The Stationery Office, 1998.
Department of Health. The Health of the Nation: A Policy Assessed. London: The Stationery Office, 1998.
Further reading:
1.
2.
World Health Organization. WHO Framework on Tobacco Control. Geneva: World Health Organization, 2003.
Available at: http://www.who.int/tobacco/fctc/text/en/fctc_en.pdf
Brock A, Griffiths C. Trends in the mortality of young adults aged 15-44 in England and Wales, 1961-2001.
Office for National Statistics Health Statistics Quarterly, No. 19, 2003: 22-31. Available at:
http://www.statistics.gov.uk/downloads/theme_health/HSQ19.pdf
Updated: December 2009
223
Prevalence: all cancers
Purpose:
To ascertain the prevalence of cancer cases from General Practice records and help ensure appropriate care and
follow-up for NHS patients with a diagnosis of cancer.
The principal active management of cancers occurs in the secondary care setting. General practitioners often have
a key role in the referral and subsequently in providing a support role and in ensuring that care is appropriately coordinated.
Definition of indicator and its variants:
st
Proportion of all patients with a diagnosis of cancer excluding non-melanotic skin cancers from 1 April 2003 in a
GP registered population.
Statistic
Sex
Age
group
Organisation
(see glossary)
Number and percent of
patients
P
All Ages
E, GOR, SHA,
PCO
Period
Current
data
FY 2008/09
File_worksheet Name
Trend data
11E_676C_09_V1
Numerator:
Numerator data - Patients registered with GP practices with a coded diagnosis of cancer excluding non-melanotic
skin cancers.
Source of numerator data - Quality and Outcomes Framework (QOF).
Comments on numerator data - The data for this primary care indicator are derived from the Quality Management
Analysis System (QMAS) and supplied by the Prescribing Support Unit at The NHS Information Centre for health
and social care. The QOF is part of the General Medical Services (GMS) contract, with a focus on prevalence and
management of common chronic diseases at general practice level. It is aimed at measuring the achievement of
general practices against a set of evidence based negotiated standards and encouraging good practice.
The data to support the clinical quality indicators (i.e. clinical achievement data) are extracted from individual GP
practice clinical systems and sent automatically to QMAS once a month. Practices can make additional
submissions of clinical data at any time.
Denominator:
Denominator data - All patients registered with GP practices (total practice list size).
Source of denominator data - See “Numerator data”.
Comments on denominator data - The practice list sizes are supplied to QMAS from the National Health
Applications and Infrastructure Services (NHAIS).
Statistical methods:
The data are presented as raw (unadjusted) figures as recorded by the practices. Ideally, comparisons between
PCOs should take into account differences between their populations in terms of age, gender and case-mix.
However, this is not possible at present as the supplied data are not broken down by these characteristics.
Interpretation of indicators:
Quality of indicator - Users of data derived from QMAS should recognise that QMAS was established as a
mechanism to support the calculation of practice QOF payments and not as a person based epidemiological tool.
It is not a comprehensive source of data on quality of care in general practice, but it is potentially a rich and
valuable source of such information, providing that the limitations of the data are acknowledged.
st
th
From 2009 onwards, National Prevalence Day has been moved to 31 March (previously 14 February) so that
prevalence is calculated on the same basis as disease registers for indicator denominators.
There have been some significant revisions to the QOF, compared to previous years. Therefore direct
comparisons cannot be made except for the indicators that have not been subject to definitional changes.
224
Further reading:
1.
The NHS Information Centre for health and social care. National Quality and Outcomes Framework
Achievement Data 2008/09, September 2009. Available at: http://www.ic.nhs.uk/webfiles/QOF/200809/QOF%20Achievement%20and%20Prevalence%20Bulletin%202008-09.pdf
2. NHS Employers and General Practitioners Committee BMA. Quality and Outcomes Framework guidance for
GMS contract 2008/09, April 2008. Available at:
http://www.nhsemployers.org/SiteCollectionDocuments/QUALITY_OUT_COMPLETE_CD_110209.pdf
3. The NHS Information Centre for health and social care. National Quality and Outcomes Framework Statistics
for England 2007/08. Available at:
http://www.ic.nhs.uk/webfiles/QOF/2007-08/QOF%20200708%20Statistical%20Bulletin.pdf
4. The Information Centre for health and social care, Prescribing Support Unit. National Quality and Outcomes
Framework Statistics for England 2006/07. Available at:
http://www.ic.nhs.uk/webfiles/QOF/2006-07/QOF%202006-07%20Statistical%20Bulletin.pdf
5. The Information Centre for health and social care, Prescribing Support Unit. National Quality and Outcomes
Framework or England 2005/06. Available at:
http://www.ic.nhs.uk/webfiles/publications/qof/NationalQualityOutcomesFramework280906_PDF.pdf
6. The Health and Social Care Information Centre, National Quality and Outcomes Framework Statistics for
England 2004/05. Available at:
http://www.ic.nhs.uk/webfiles/publications/qof0405/QOF0405_Statistical_Bulletin.pdf
7. Ashworth M, Armstrong D. The relationship between general practice characteristics and quality of care: a
national survey of quality indicators used in the UK Quality and Outcomes Framework, 2004-5, BMC Family
Practice, London: Ashworth and Armstrong, 2006 7:68. Available at:
http://www.biomedcentral.com/1471-2296/7/68
8. Department of Health, Investing in General Practice. The New General Medical Services Contract. Available
at: http://www.dh.gov.uk/assetRoot/04/07/86/58/04078658.pdf
9. Eastern Region Public Health Observatory, The limitations of Quality and Outcomes Framework (QOF) data.
Briefing No. 3, 2005. Available at:
http://www.erpho.org.uk/Download/Public/12597/1/Briefing%2003%20The%20limitations%20of%20QOF%20d
ata.pdf
10. Patient UK., Looking After People With Cancer. Available at: http://www.patient.co.uk/showdoc/40002159/
Updated: October 2010
225
Incidence of bladder cancer
Purpose:
To reduce the incidence of bladder cancer.
Definition of indicator and its variants:
Registrations for bladder cancer (ICD-10 C67 equivalent to ICD-9 188).
Statistic
Indirectly age-standardised
registration ratio (SRR) and
number of registrations
Sex
Age group
MFP All ages
<75
Organisation
(see glossary)
E&W, E, GOR,
ONS area, SHA,
LA, PCO
Current
data
2004-06
All ages
Directly age-standardised
registration rate and number of
registrations
MFP All ages
<75
Trend
data
File-worksheet name
19A_029SR00++_06_V1
19A_029SR0074_06_V1
1993-06 19A_029SRT00++_06_V1
E&W, E, GOR,
ONS area, SHA,
LA, PCO
All ages
2004-06
19A_029DR00++_06_V1
19A_029DR0074_06_V1
1993-06 19A_029DRT00++_06_V1
Numerator:
Numerator data - Cancer registrations for bladder cancer (ICD-10 C67, ICD-9 188) in the respective calendar
years.
Source of numerator data - Regional Cancer Registries and the Office for National Statistics (ONS).
Comments on numerator data - Registration data for years 1993-2005 were extracted by ONS in November 2008.
Data for 2006 are as registered by the end of September 2008. For all data organisational codes were assigned
using the postcode of usual residence and the August 2008 edition of the National Statistics Postcode Directory.
Results in the current Compendium may differ from those of previous issues because of changes in methodology
to extract data by area, and also because of data enhancements by ONS. Cancer registrations are also
continuously being updated retrospectively and ONS records may have been updated since previous analyses.
Denominator:
Denominator data - 2001 Census based mid-year population estimates for the respective calendar years.
Source of denominator data - ONS.
Comments on denominator data - Data are based on the latest revisions of ONS mid-year population estimates for
the respective years, current as at 29 September 2008.
Statistical methods:
Annex 3: Explanations of statistical methods used in the Compendium
Interpretation of indicators:
Quality of indicator - Annex 12 describes the criteria that should be used to judge the quality of this indicator. The
application of the criteria is dependent on the context (e.g. describing a single organisation, comparing several
organisations) and the level (e.g. national / regional with large numbers of events, local with small numbers of
events) at which the data are to be used.
Further reading:
1.
2.
3.
Department of Health. The NHS cancer plan and the new NHS: Providing a patient-centred service. London:
Department of Health, 2004.
Department of Health. Day Surgery: Operational Guide. Waiting, booking and choice. London: Department of
Health, 2002.
Kuper H, Boffetta P, Adami H-O. Tobacco use and cancer causation: association by tumour type. J Intern
Med 2002; 252(3): 206-224.
Updated: May 2009
226
Mortality from bladder cancer
Purpose:
To reduce deaths from bladder cancer.
Definition of indicator and its variants:
Mortality from bladder cancer (ICD-10 C67 equivalent to ICD-9 188).
Statistic
Number of deaths
Average age-specific death
rate per 100,000 resident
population
Indirectly age-standardised
mortality ratio (SMR) and
number of deaths
Sex
Age group
MFP 1+, 1-4, 5-14,
15-34, 35-64,
65-74, 75+
MFP 1+, 1-4, 5-14,
15-34, 35-64,
65-74, 75+
MFP All ages,
<75
Organisation
(see glossary)
Current
data
E&W, E, GOR,
ONS area, SHA,
LA, PCO, CTY
E&W, E, GOR,
ONS area, SHA,
LA, PCO, CTY
E&W, E, GOR,
ONS area, SHA,
LA, PCO, CTY
2008
19B_030NO_08_V1
2006-08
19B_030CR_08_V1
2006-08
19B_030SM00++_08_V1
19B_030SM0074_08_V1
All ages
Directly age-standardised
mortality rate per 100,000 and
number of deaths
MFP All ages,
<75
Trend
data
File-worksheet name
1993-08 19B_030SMT00++_08_V1
E&W, E, GOR,
ONS area, SHA,
LA, PCO, CTY
All ages
2006-08
19B_030DR00++_08_V1
19B_030DR0074_08_V1
1993-08 19B_030DRT00++_08_V1
Numerator:
Numerator data - Deaths from bladder cancer, classified by underlying cause of death (ICD-10 C67, ICD-9 188
adjusted), registered in the respective calendar year(s).
Source of numerator data - Office for National Statistics (ONS).
Comments on numerator data – Mortality data for years 1993-2006 were extracted by ONS in June 2007 with
organisational codes assigned using the postcode of usual residence and the November 2006 edition of the
National Statistics Postcode Directory (NSPD). Data for subsequent years were extracted in June of the following
year using the respective year’s November edition of the NSPD.
In January 2001, the ONS implemented a change from ICD-9 to ICD-10 for coding causes of death in England &
Wales. As part of an exercise to investigate the effects of this change, the ONS also re-coded all deaths registered
in 1999. Deaths for years prior to 1999 and for year 2000 have not been re-coded.
For current analysis, therefore, all data are based on ICD-10.
For trend analysis, the numbers of deaths observed in the years 1993-98 and 2000 must be adjusted to give
“expected” numbers of deaths which would have been coded to this cause in ICD-10. This is done by multiplying
the ICD-9 based death counts by the appropriate ICD-10/9 comparability ratio published by the ONS. Trend data
cannot include years prior to 1993, because the ONS introduced automated coding in 1993, and the comparability
ratios are only valid from this point onwards.
For this indicator the following ICD-10/9 comparability ratios were used:
Males
Females
All Ages: 1
All Ages: 1.016
Adjusted person counts are the sum of the adjusted male and female counts. Once adjusted, the counts are used
to calculate rates in the usual way.
From the 2003 Compendium onwards, data are based on the original causes of death rather than the final causes
used in earlier Compendia.
See Annex 2 for more details.
227
Denominator:
Denominator data - 2001 Census based mid-year population estimates for the respective calendar years.
Source of denominator data - ONS.
Comments on denominator data - Data are based on the latest revisions of ONS mid-year population estimates for
the respective years, current as at 1 October 2009.
Statistical methods:
Annex 2: Changes to Office for National Statistics mortality data
Annex 3: Explanations of statistical methods used in the Compendium
Interpretation of indicators:
Quality of indicator - Annex 12 describes the criteria that should be used to judge the quality of this indicator. The
application of the criteria is dependent on the context (e.g. describing a single organisation, comparing several
organisations) and the level (e.g. national / regional with large numbers of events, local with small numbers of
events) at which the data are to be used.
Relevant National initiatives:
1.
2.
3.
4.
5.
Department of Health. The NHS cancer plan and the new NHS: Providing a patient-centred service. London:
Department of Health, 2004.
National Institute for Clinical Excellence. Improving Outcomes in Urological Cancers - The Manual. London:
National Institute for Clinical Excellence, 2002. Available at: http://www.nice.org.uk/pdf/Urological_Manual.pdf
Department of Health. NHS Cancer Plan. London: Department of Health, 2000.
NHS Executive. Manual of Cancer Services Standards. London: NHS Executive, 2000.
Department of Health. Saving Lives: Our Healthier Nation. London: The Stationery Office, 1999.
Further reading:
1.
2.
World Health Organization. WHO Framework on Tobacco Control. Avaliable at:
http://www.who.int/tobacco/fctc/text/en/fctc_en.pdf
Brock A, Griffiths C. Trends in the mortality of young adults aged 15-44 in England and Wales, 1961-2001.
Office for National Statistics Health Statistics Quarterly, No. 19, 2003: 22-31. Available at:
http://www.statistics.gov.uk/downloads/theme_health/HSQ19.pdf
Updated: December 2009
228
Survival following diagnosis of bladder cancer
Purpose:
To provide comparative measures of the outcome of cancer treatment by area of residence, using geographical
variations in cancer survival. Cancer survival is a key operational measure of the success of cancer treatment
services. The principle of equity of access to optimal standards of National Health Service (NHS) cancer treatment
was explicitly endorsed in the Calman-Hine report of 1995, which noted: "All patients should have access to a
uniformly high quality of care in the community or hospital wherever they may live to ensure the maximum possible
1
cure rates and best quality of life" . A further policy document stated that from April 1999, patients with suspected
breast cancer "will be able to see a specialist within two weeks of their GP deciding they need to be seen urgently,
2
and requesting an appointment" . Similar commitments have come into force for other cancers since April 2000.
These policies are expected to lead to earlier diagnosis for all patients and more equitable access to treatment.
The NHS Cancer Plan extended these commitments to improve cancer survival in England to amongst the best in
3
Europe . Cancer survival rates are outcome measures that can form part of the baseline for monitoring the future
impact of these policies. Geographic differences in cancer survival are expected to decline over time if policy goals
are achieved.
Definition of indicator and its variants:
Relative survival rate at one and five years after diagnosis for patients diagnosed in England during 2001-03 and
followed up to the end of the year 2008. Cancer patients have higher mortality than the general population, but
they do not all die of cancer. The relative survival rate is the ratio of the survival rate actually observed among the
cancer patients and the survival rate that would have been expected if they had only had the same overall
mortality rates as the general population. Thus, if five-year survival is 60% among a group of cancer patients of
whom 90% would have been expected to survive that long, the relative survival is 67% (60/90). By convention,
relative survival is described as a rate, although strictly it is a ratio of two percentages.
Statistic
Number and one-year relative
survival rate (%)
Number and five-year relative
survival rate (%)
Sex
Age group
Organisation
(see glossary)
Current
data
Trend
data
File-worksheet name
MFP 15-99
E, GOR, SHA, CN
2001-03
19C_406PCP1_03_V1
MFP 15-99
E, GOR, SHA, CN
2001-03
19C_406PCP2_03_V1
Numerator:
Numerator data - Observed survival rate, derived from the distribution of survival times from the date of diagnosis
(of a primary, invasive, malignant neoplasm) to the earliest date among the date of death, the date of emigration,
and the cut-off date of follow-up (31 December 2008), for cancer patients who were diagnosed 2001-03 and
resident in England at the time of diagnosis. Analyses published prior to the July 2009 Compendium release
include only first primary malignancies. From the July 2009 release onwards, higher order primary malignancies
are also retained. The geographical area of each patient is defined by residence at the time of diagnosis. Records
with faulty data, and those of patients diagnosed with in situ tumours, tumours uncertain as to whether benign or
malignant, metastatic, or uncertain whether primary or metastatic, are excluded from analysis.
Source of numerator data - National Cancer Intelligence Centre (NCIC), Office for National Statistics (ONS)
derived from NHS regional cancer registries; National Health Service Central Register.
Comments on numerator data - European recommendations for coding bladder tumours changed in 1995 to
exclude some urothelial papillary tumours of the bladder that would previously have been classified as invasive.
Similar recommendations were implemented by UK cancer registries, but formally only for tumours registered from
2000 although some registries initiated such implementation earlier. Because of the excellent prognosis of these
urothelial papillary tumours, their inclusion or not in the analysis explains some of the apparent geographical
variations in survival.
Denominator:
Denominator data - The expected survival rate among the cancer patients, derived from life tables specific for the
calendar year of death, single year of age, sex, Government Office Region of residence and deprivation.
Source of denominator data - Office for National Statistics (ONS).
Statistical methods:
The cumulative probability of death at a given time since diagnosis, relative to the corresponding probability in the
general population, is estimated by comparing the death rates among the cancer patients in successive intervals
229
of time since diagnosis with the all-causes death rate in the general population for the same sex and age group4.
This is derived from life tables for the Government Office Region in which the patient lives. Life tables were
created that were specific for calendar year of death, single year of age, sex, Government Office Region and
deprivation. Life tables were constructed for the years 1991, 2001 and 2005 using ONS mid-year population
estimates and the mean annual number of deaths in the three years centred on those index years. Life tables for
the intervening years were then created by linear interpolation. The life tables for 2005 were used for years 2006
to 2008 without interpolation.
The relative survival rates for the pooled three-year time period have been directly age-standardised to take into
account any variation in relative survival by age. The standard population used is the number of persons who were
diagnosed with the particular cancer under consideration in England and Wales during the period 1986-90. These
were broken down into three age (at diagnosis) groups: 15-69, 70-79, and 80-99 years.
Male, female, and person relative survival rates are age-standardised using the same person standard population
and may therefore be compared against each other. Rates for different cancers, however, are standardised using
different standard populations, and in some instances different age groupings, and should therefore not be
compared.
Annex 3 of the Compendium User Guide: Explanations of statistical methods used in the Compendium.
Interpretation of indicators:
Type of Indicator - The relative survival rate can be interpreted as an estimate of the proportion of cancer patients
who die of their disease, after adjustment for death from other causes. A relative survival rate of 100% for a given
period would imply that the cancer patients had had the same survival (or death) rates as the general population,
not that they had all survived. Similarly, if the relative survival rate remains constant at (say) ten or more years
after diagnosis, this implies that the ten-year survivors no longer have higher mortality than the general population.
Quality of indicator - Annex 12 of the Compendium User Guide describes the criteria that should be used to judge
the quality of this indicator. The application of the criteria is dependent on the context (e.g. describing a single
organisation, comparing several organisations) and the level (e.g. national / regional with large numbers of events,
local with small numbers of events) at which the data are to be used.
Potential value of indicator:
Cancer survival is a broad indicator - differences may be due to a range of factors, of which the quality of
treatment is only one. Differences in cancer survival between geographical areas should therefore be the origin of
further enquiry, not the basis for simplistic conclusions about the efficacy of cancer treatment. The geographical
area of residence at cancer diagnosis is a proxy for several aspects of health care, including the quality of primary
care, the speed of referral and the quality of treatment services. It may also be a proxy for other factors, not readily
measured, such as the degree of understanding of cancer symptoms and what to do about them among the local
population, variations in the extent of disease at diagnosis (stage) and in the histology and grade of tumours, and
artefacts in the data. If geographical survival differences can be attributed to differences in knowledge of cancer or
the extent of disease at diagnosis, public health responses could be organised. Differences in cancer survival
between geographical areas may also "turn out to be due to the persistence of outmoded practices, or other
remediable deficiencies in service provision or therapeutic regimes, and correcting these should lead to an
5
improvement in overall standards of care" .
Further reading:
A comprehensive monograph on cancer survival in England and Wales has been published6, covering 2.9 million
patients diagnosed with one of 47 adult cancers and 11 childhood cancers during 1971-90, and followed up to the
end of 1995. It includes comprehensive analyses by age, sex, and NHS Region, and by socio-economic status (in
five categories from affluent to deprived). Updated results for England and Wales have been published in 2004
7, 8
and 2008 with a chapter for each of the 21 most common cancers. More limited analyses have also been
published for cancer patients diagnosed during 1991-93 and followed up to 1998, and diagnosed during 1993-95
and followed up to 2000. 9, 10 Five-year age-standardised relative survival rates for 21 major cancers based on
diagnoses in five year periods between 1998 and 2007 are available on the National Statistics website.11 An early
12
assessment of the impact of the NHS National Cancer Plan on relative survival has been published. An allcancer relative survival index for patients diagnosed 1991-2006 has been presented by PCT in England.13 Cancer
13
survival by Cancer Network has been presented for patients diagnosed with one of six cancers 1991-2006.
1.
2.
3.
4.
Expert Advisory Group on Cancer. A policy framework for commissioning cancer services. London:
Department of Health, 1995.
NHS Executive. The new NHS. Modern. Dependable. London: Department of Health, 1997.
Department of Health. The NHS Cancer Plan: three-year progress report - maintaining the momentum.
London: Department of Health, 2003.
Estève J, Benhamou E, Croasdale M, Raymond L. Relative survival and the estimation of net survival:
elements for further discussion. Stat Med 1990; 9: 529-38.
230
5.
6.
7.
8.
9.
10.
11.
12.
13.
Clinical Outcomes Working Group. Clinical outcome indicators, July 1996. Edinburgh: The Scottish Office,
1996.
Coleman M.P, Babb P, Damiecki P, Grosclaude P, Honjo S, Jones J et al. Cancer survival trends in England
and Wales 1971-1995: deprivation and NHS Region. Series SMPS No.61. London: The Stationery Office,
1999, 1-695.
Coleman M.P, Rachet B, Woods L.M, Mitry E, Riga M, Cooper N et al. Trends and socioeconomic inequalities
in cancer survival in England and Wales up to 2001. British Journal of Cancer 2004; 90:1367-1373.
Shah A, Rachet B, Mitry E, Cooper N, Brown C.M, Coleman M.P. Survival from bladder cancer in England &
Wales up to 2001. British Journal of Cancer 2008; 99:S86-S89.
Coleman M.P, Babb P, Harris S, Quinn M.J, Sloggett A, De Stavola B.L. Cancer survival in England and
Wales, 1991-1998. Office for National Statistics Health Statistics Quarterly 2000; 6: 71-80.
Office for National Statistics. Cancer survival in the health authorities of England,1993-2000. Report. Office for
National Statistics Health Statistics Quarterly 2002;13: 95-103.
Office for National Statistics. Survival Rates in England and Wales, 1998-2001, 1999-2002, 1999-03; Survival
Rates in England 2000-04, 2001-06. National Statistics website. Available at:
http://www.statistics.gov.uk/StatBase/Product.asp?vlnk=14007&Pos=3&ColRank=1&Rank=422 , accessed 16
September 2010.
Rachet B, Maringe C, Nur U, Quaresma M, Shah A, Woods LM, et al. Population-based cancer survival
trends in England and Wales up to 2007: an assessment of the NHS cancer plan for England. Lancet Oncol
2009;10:351-69.
Office for National Statistics. Cancer survival by cancer network, patients diagnosed 1991-2006, followed up
to 2007. National Statistics website. Available at:
http://www.statistics.gov.uk/STATBASE/Product.asp?vlnk=15387. Accessed 15 September 2010.
Updated: October 2010
231
Deaths at home from bladder cancer
Purpose:
To improve palliative care and service planning for cancer patients in the terminal stages of life, allowing more of
them the choice of dying at home.
Definition of indicator and its variants:
The proportion of deaths from bladder cancer (ICD-10 C67) that occur at home.
Statistic
Sex
Age group
Percent of deaths at home
MFP All ages
Indirectly age-standardised
deaths at home rate per 100
deaths and number of deaths
at home
MFP All ages
Organisation
(see glossary)
Current
data
E&W, E, GOR, ONS 2006-08
area, SHA, LA,
PCO, CTY
E&W, E, GOR, ONS 2006-08
area, SHA, LA,
PCO, CTY
Trend
data
File-worksheet name
19D_198PC_08_V1
19D_198ISR_08_V1
Numerator:
Numerator data - Deaths at home from bladder cancer, classified by underlying cause of death (ICD-10 C67),
registered in the respective calendar year(s).
Source of numerator data - Office for National Statistics (ONS).
Comments on numerator data – Mortality data for years 1993-2006 were extracted by ONS in June 2007 with
organisational codes assigned using the postcode of usual residence and the November 2006 edition of the
National Statistics Postcode Directory (NSPD). Data for subsequent years were extracted in June of the following
year using the respective year’s November edition of the NSPD.
Information about the place of death is found on the mortality record in the communal establishment field. It
contains one of:
•
•
•
a 5 digit code identifying a communal establishment or institution (e.g. hospital, nursing home, residential
home);
an “H” code which indicates that the person is certified as having died at their home address and that this
is not a communal establishment or;
an “E” code which indicates that the person died elsewhere.
The communal establishments are themselves classified into 84 categories (e.g. general hospital, mental nursing
home, nursing home etc) and can be further distinguished by whether they are an NHS or Non-NHS
establishment.
It is currently ONS practice to include nursing homes with hospitals under a broader group - “Other hospitals and
communal establishments for the care of the sick” - and also to include residential homes under “Other communal
establishments”. This is because of concerns highlighted by the ONS regarding the accuracy of the recorded
status of some communal establishments, particularly nursing homes and residential homes.
It is therefore not possible to include nursing home or residential home deaths as a “home” death. For this
indicator, a “home” death is defined as one that has the ”H” code in the communal establishment field, i.e. where
the death has occurred at the home address and that address is not of a communal establishment.
Denominator:
Denominator data - All deaths from bladder cancer, classified by underlying cause of death (ICD-10 C67),
registered in the respective calendar year(s).
Source of denominator data - ONS.
Comments on denominator data - Includes deaths in all categories of communal establishment code, i.e. deaths in
all communal establishments, at home, and elsewhere.
From the 2003 Compendium onwards, data are based on the original causes of death rather than the final causes
used in earlier Compendia. See Annex 2 for more details.
232
Statistical methods:
The age-standardised deaths at home rate utilises the indirect method of standardisation. The direct method was
found not to be robust as it was affected by small numerator and denominator counts in specific age groups.
Indirect standardisation requires the computation of the ratio of an area’s observed number of events to its
expected number of events if it had experienced the standard age-specific rates. This age-standardised ratio can
be converted into a rate by multiplying it by the crude rate of the standard population.
The standard rates used are those of England for the respective calendar year(s). Male and female rates have
been standardised separately. The rate for persons is standardised for both age and sex.
This methodology is similar to that used for the Clinical Indicators and is described in detail in:
Annex 3: Explanations of statistical methods used in the Compendium (under the sections entitled “Indirectly
Standardised Rates For Clinical Indicators” and “Confidence Intervals Of Indirectly Standardised Rates For Clinical
Indicators”).
Interpretation of indicators:
Type of Indicator - This is a condition-specific cross-sectional comparative indicator reflecting events which act as
a proxy for outcome (quality of dying). In the absence of an absolute standard, comparative data are useful for
monitoring in relation to rates achieved in comparable areas.
Quality of indicator – Annex 12 describes the criteria that should be used to judge the quality of this indicator. The
application of the criteria is dependent on the context (e.g. describing a single organisation, comparing several
organisations) and the level (e.g. national / regional with large numbers of events, local with small numbers of
events) at which the data are to be used.
Confidence Intervals - 95%. Some of the values and factors influencing them may be chance occurrences, with
values fluctuating at random between organisations and from year to year. Numbers of deaths may be small at
individual organisational level. The results should therefore be interpreted with caution and with the aid of
confidence intervals. The 95% confidence interval provides a measure of the statistical precision of the rate for an
area or institution. It indicates a range which, with 95% probability, will contain the underlying value of the
indicator. If the confidence interval for an organisation’s rate is outside the range of the national confidence
intervals, the difference between the two rates is considered statistically significant. If the confidence intervals for
two rates overlap, in most cases the difference between the rates would not be considered statistically significant.
Effect of Case-Mix / severity - Severity of the cancer and need for hospital care have implications for those who
wish to die at home being able to do so. The data available do not allow adjustment for these factors.
Other Potential Confounding Factors - A number of factors outside the control of the NHS such as personal
choice, availability of hospices, and family/community support may contribute to the variation shown by the
indicator.
Relevant National initiatives:
1.
2.
3.
4.
Department of Health. End of life care strategy : Promoting high quality care for all adults at the end of life.
London: Department of Health , 2008.
http://www.dh.gov.uk/en/Publicationsandstatistics/Publications/PublicationsPolicyAndGuidance/DH_086277
Department of Health. The NHS cancer plan and the new NHS: Providing a patient-centred service. London:
Department of Health, 2004.
Department of Health. Pioneering Schemes Named Best of the Best. NHS Beacons – Part of a Concerted
Campaign to Improve Cancer Services. Department of Health, 1999. Press release: reference 1999/0375
Commission for Health Improvement. NHS Cancer Care in England and Wales. National Service Framework
Assessments No.1. London: Commission for Health Improvement, 2001.
Further reading:
1.
2.
3.
Higginson IJ, Thompson M. Children and young people who die from cancer: epidemiology and place of death
in England (1995-9). British Medical Journal 2003; 327: 478-479.
Grande G.E, Todd C.J, Barclay SIG, Farquhar MC. Does hospital at home for palliative care facilitate death at
home? Randomised controlled trial. British Medical Journal 1999; 319: 1472-1475.
Higginson IJ, Jarman B, Astin P, Dolan S. Do social factors affect where patients die: an analysis of 10 years
of cancer deaths in England. Journal of Public Health Medicine 1999; 21(1): 23-28.
Updated: December 2009
233
Years of life lost due to mortality from bladder cancer
Purpose:
Years of life lost (YLL) is a measure of premature mortality. Its primary purpose is to compare the relative
importance of different causes of premature death within a particular population and it can therefore be used by
health planners to define priorities for the prevention of such deaths. It can also be used to compare the premature
mortality experience of different populations for a particular cause of death. The concept of years of life lost is to
estimate the length of time a person would have lived had they not died prematurely. By inherently including the
age at which the death occurs, rather than just the fact of its occurrence, the calculation is an attempt to better
quantify the burden, or impact, on society from the specified cause of mortality.
Definition of indicator and its variants:
Years of life lost due to mortality from bladder cancer (ICD-10 C67).
Statistic
Crude rate per 10,000
population and number of
years of life lost
Directly age-standardised rate
per 10,000 population and
number of deaths
Sex
Age group
MFP <75
MFP <75
Organisation
(see glossary)
Current
data
Trend
data
File-worksheet name
E&W, E, GOR,
ONS area, SHA,
LA, PCO, CTY
E&W, E, GOR,
ONS area, SHA,
LA, PCO, CTY
2006-08
19E_035CR_08_V1
2006-08
19E_035DR_08_V1
Numerator:
Numerator data – Years of life lost and deaths from bladder cancer classified by underlying cause of death (ICD10 C67), registered in the respective calendar year(s).
Source of numerator data – Office for National Statistics (ONS).
Comments on numerator data – The number of years of life lost is calculated by summing over ages 1 to 74 years
the number of deaths at each age multiplied by the number of years of life remaining up to age 75 years. Infant
deaths are omitted as they are mostly a result of causes specific to this age group and have different aetiologies to
deaths later in life.
The numerator presented alongside the sdirecgtly age-tandardised years of life lost rate is the number of deaths
rather than the number of years of life lost. This is because the standardisation calculation has been performed
using 5-year age bands. In each age band the number of deaths is weighted by the number of years of life
remaining from the mid-point of the age band up to age 75 years. See annex 3 for more details.
Mortality data for years 1993-2006 were extracted by ONS in June 2007 with organisational codes assigned using
the postcode of usual residence and the November 2006 edition of the National Statistics Postcode Directory
(NSPD). Data for subsequent years were extracted in June of the following year using the respective year’s
November edition of the NSPD.
In January 2001, the ONS implemented a change from ICD-9 to ICD-10 for coding causes of death in England &
Wales. As part of an exercise to investigate the effects of this change, the ONS also re-coded all deaths registered
in 1999. Deaths for years prior to 1999 and for year 2000 have not been re-coded.
For current analysis, therefore, all data are based on ICD-10.
From the 2003 Compendium onwards, data are based on the original causes of death rather than the final causes
used in earlier Compendia.
See Annex 2 for more details.
Denominator:
Denominator data - 2001 Census based mid-year population estimates for the respective calendar years.
Source of denominator data - ONS.
Comments on denominator data - Data are based on the latest revisions of ONS mid-year population estimates for
the respective years, current as at 1 October 2009.
234
Statistical methods:
Annex 2: Changes to Office for National Statistics mortality data
Annex 3: Explanations of statistical methods used in the Compendium
Annex 5: European Standard Population
Interpretation of indicators:
Quality of indicator - Annex 12 describes the criteria that should be used to judge the quality of this indicator. The
application of the criteria is dependent on the context (e.g. describing a single organisation, comparing several
organisations) and the level (e.g. national / regional with large numbers of events, local with small numbers of
events) at which the data are to be used.
Relevant National initiatives:
1.
2.
3.
4.
5.
Department of Health. The NHS cancer plan and the new NHS: Providing a patient-centred service. London:
Department of Health, 2004.
National Institute for Clinical Excellence. Improving Outcomes in Urological Cancers - The Manual. London:
National Institute for Clinical Excellence, 2002. Available at: http://www.nice.org.uk/pdf/Urological_Manual.pdf
Department of Health. NHS Cancer Plan. London: Department of Health, 2000.
NHS Executive. Manual of Cancer Services Standards. London: NHS Executive, 2000.
Department of Health. Saving Lives: Our Healthier Nation. London: The Stationery Office, 1999.
Further reading:
1.
2.
World Health Organization. WHO Framework on Tobacco Control. Avaliable at:
http://www.who.int/tobacco/fctc/text/en/fctc_en.pdf
Brock A, Griffiths C. Trends in the mortality of young adults aged 15-44 in England and Wales, 1961-2001.
Office for National Statistics Health Statistics Quarterly, No. 19, 2003: 22-31. Available at:
http://www.statistics.gov.uk/downloads/theme_health/HSQ19.pdf
Updated: December 2009
235
Incidence of breast cancer
Purpose:
To reduce the incidence of breast cancer.
Definition of indicator and its variants:
Registrations for breast cancer (ICD-10 C50 equivalent to ICD-9 174).
Statistic
Sex
Indirectly age-standardised
registration ratio (SRR) and
number of registrations
F
Directly age-standardised
registration rate and number of
registrations
F
Age group
Organisation
(see glossary)
Current
data
All ages
<75
E&W, E, GOR, ONS 2004-06
area, SHA, LA, PCO
All ages
All ages
<75
E&W, E, GOR, ONS 2004-06
area, SHA, LA, PCO
All ages
Trend
data
File-worksheet name
16A_033SR00++_06_V1
16A_033SR0074_06_V1
1993-06 16A_033SRT00++_06_V1
16A_033DR00++_06_V1
16A_033DR0074_06_V1
1993-06 16A_033DRT00++_06_V1
Numerator:
Numerator data - Cancer registrations for breast cancer (ICD-10 C50 equivalent to ICD-9 174) in the respective
calendar years.
Source of numerator data - Regional Cancer Registries and the Office for National Statistics (ONS).
Comments on numerator data - Registration data for years 1993-2005 were extracted by ONS in November 2008.
Data for 2006 are as registered by the end of September 2008. For all data organisational codes were assigned
using the postcode of usual residence and the August 2008 edition of the National Statistics Postcode Directory.
Results in the current Compendium may differ from those of previous issues because of changes in methodology
to extract data by area, and also because of data enhancements by ONS. Cancer registrations are also
continuously being updated retrospectively and ONS records may have been updated since previous analyses.
Denominator:
Denominator data - 2001 Census based mid-year population estimates for the respective calendar years.
Source of denominator data - ONS.
Comments on denominator data - Data are based on the latest revisions of ONS mid-year population estimates for
the respective years, current as at 29 September 2008.
Statistical methods:
Annex 3: Explanations of statistical methodologies used in the Compendium
Interpretation of indicators:
Quality of indicator - Annex 12 describes the criteria that should be used to judge the quality of this indicator. The
application of the criteria is dependent on the context (e.g. describing a single organisation, comparing several
organisations) and the level (e.g. national / regional with large numbers of events, local with small numbers of
events) at which the data are to be used.
Further reading:
1.
2.
3.
Department of Health. The NHS cancer plan and the new NHS: Providing a patient-centred service. London:
Department of Health, 2004.
Birkhead J, Goldacre M, Mason A, Wilkinson E, Amess M, Cleary R. Health Outcome Indicators - Breast
Cancer. London: NCHOD, 1999. Available at http://nchod.uhce.ox.ac.uk/breastcancer.pdf
NHS. Improving Outcomes in Breast Cancer - The Research Evidence. London: Department of Health, 1996.
Updated: May 2009
236
Mortality from breast cancer
Purpose:
To reduce deaths from breast cancer.
Definition of indicator and its variants:
Mortality from breast cancer (ICD-10 C50 equivalent to ICD-9 174).
Statistic
Sex
Number of deaths
F
Average age-specific death
rate per 100,000 resident
population
Indirectly age-standardised
mortality ratio (SMR) and
number of deaths
F
Directly age-standardised
mortality rate per 100,000 and
number of deaths
F
F
Age group
1+, 1-4, 5-14,
15-34, 35-64,
65-74, 75+
1+, 1-4, 5-14,
15-34, 35-64,
65-74, 75+
All ages,
<75,
50-64,
50-69
All ages
50-69
All ages,
<75,
50-64,
50-69
Organisation
(see glossary)
Current
data
E&W, E, GOR,
ONS area, SHA,
LA, PCO, CTY
E&W, E, GOR,
ONS area, SHA,
LA, PCO, CTY
E&W, E, GOR,
ONS area, SHA,
LA, PCO, CTY
2008
16B_034NO_08_V1
2006-08
16B_034CR_08_V1
2006-08
16B_034SM00++_08_V1
16B_034SM0074_08_V1
16B_034SM5064_08_V1
16B_034SM5069_08_V1
E&W, E, GOR,
ONS area, SHA,
LA, PCO, CTY
2006-08
All ages
50-69
Trend
data
File-worksheet name
1993-08 16B_034SMT00++_08_V1
16B_034SMT5069_08_V1
16B_034DR00++_08_V1
16B_034DR0074_08_V1
16B_034DR5064_08_V1
16B_034DR5069_08_V1
1993-08 16B_034DRT00++_08_V1
16B_034DRT5069_08_V1
Numerator:
Numerator data - Deaths from breast cancer, classified by underlying cause of death (ICD-10 C50, ICD-9 174
adjusted), registered in the respective calendar year(s).
Source of numerator data - Office for National Statistics (ONS).
Comments on numerator data – Mortality data for years 1993-2006 were extracted by ONS in June 2007 with
organisational codes assigned using the postcode of usual residence and the November 2006 edition of the
National Statistics Postcode Directory (NSPD). Data for subsequent years were extracted in June of the following
year using the respective year’s November edition of the NSPD.
The directly age-standardised mortality rate from breast cancer for women aged 50-69 was a target indicator in the
Health of the Nation strategy (See ”Further reading”).
In January 2001, the ONS implemented a change from ICD-9 to ICD-10 for coding causes of death in England &
Wales. As part of an exercise to investigate the effects of this change, the ONS also re-coded all deaths registered
in 1999. Deaths for years prior to 1999 and for year 2000 have not been re-coded.
For current analysis, therefore, all data are based on ICD-10.
For trend analysis, the numbers of deaths observed in the years 1993-98 and 2000 must be adjusted to give
“expected” numbers of deaths which would have been coded to this cause in ICD-10. This is done by multiplying
the ICD-9 based death counts by the appropriate ICD-10/9 comparability ratio published by the ONS. Trend data
cannot include years prior to 1993, because the ONS introduced automated coding in 1993, and the comparability
ratios are only valid from this point onwards.
For this indicator the following ICD-10/9 comparability ratios were used:
Females
0-74yrs: 1.003
75-84yrs: 1.032
85+yrs: 1.097
From the 2003 Compendium onwards, data are based on the original causes of death rather than the final causes
used in earlier Compendia.
237
See Annex 2 for more details.
Denominator:
Denominator data - 2001 Census based mid-year population estimates for the respective calendar years.
Source of denominator data - ONS.
Comments on denominator data - Data are based on the latest revisions of ONS mid-year population estimates for
the respective years, current as at 1 October 2009.
Statistical methods:
Annex 2: Changes to Office for National Statistics mortality data
Annex 3: Explanations of statistical methodologies used in the Compendium
Annex 5: European Standard Population
Annex 6: Goals of Our Healthier Nation
Interpretation of indicators:
Quality of indicator - Annex 12 describes the criteria that should be used to judge the quality of this indicator. The
application of the criteria is dependent on the context (e.g. describing a single organisation, comparing several
organisations) and the level (e.g. national / regional with large numbers of events, local with small numbers of
events) at which the data are to be used.
Further reading:
1.
2.
3.
4.
5.
6.
Department of Health. The NHS cancer plan and the new NHS: Providing a patient-centred service. London:
Department of Health, 2004.
Department of Health. NHS Cancer Plan. London: Department of Health, 2000.
NHS. Manual of Cancer Services Standards. London: NHS Executive, 2000.
Department of Health. Saving Lives: Our Healthier Nation. London: The Stationery Office, 1999.
Haward R, Goldacre M, Mason A, Wilkinson E, Amess M. Health Outcome Indicators: Breast Cancer . Oxford:
NCHOD, 1999. Available at http://nchod.uhce.ox.ac.uk/breastcancer.pdf
Department of Health. Health of the Nation - A Strategy for Health in England. London: Her Majesty’s
Stationery Office, 1992.
Updated: December 2009
238
Survival following diagnosis of breast cancer
Purpose:
To provide comparative measures of the outcome of cancer treatment by area of residence, using geographical
variations in cancer survival. Cancer survival is a key operational measure of the success of cancer treatment
services. The principle of equity of access to optimal standards of National Health Service (NHS) cancer treatment
was explicitly endorsed in the Calman-Hine report of 1995, which noted: "All patients should have access to a
uniformly high quality of care in the community or hospital wherever they may live to ensure the maximum possible
1
cure rates and best quality of life" . A further policy document stated that from April 1999, patients with suspected
breast cancer "will be able to see a specialist within two weeks of their GP deciding they need to be seen urgently,
2
and requesting an appointment" . Similar commitments have come into force for other cancers since April 2000.
These policies are expected to lead to earlier diagnosis for all patients and more equitable access to treatment.
The NHS Cancer Plan extended these commitments to improve cancer survival in England to amongst the best in
3
Europe . Cancer survival rates are outcome measures that can form part of the baseline for monitoring the future
impact of these policies. Geographic differences in cancer survival are expected to decline over time if policy goals
are achieved.
Definition of indicator and its variants:
Relative survival rate at one and five years after diagnosis for patients diagnosed in England during 2001-03 and
followed up to the end of the year 2008. Cancer patients have higher mortality than the general population, but
they do not all die of cancer. The relative survival rate is the ratio of the survival rate actually observed among the
cancer patients and the survival rate that would have been expected if they had only had the same overall
mortality rates as the general population. Thus, if five-year survival is 60% among a group of cancer patients of
whom 90% would have been expected to survive that long, the relative survival is 67% (60/90). By convention,
relative survival is described as a rate, although strictly it is a ratio of two percentages.
Statistic
Number and one-year relative
survival rate (%)
Number and five-year relative
survival rate (%)
Sex
Age group
Organisation
(see glossary)
Current
data
Trend
data
File-worksheet name
F
15-99
E, GOR, SHA, CN
2001-03
16C_407PCP1_03_V1
F
15-99
E, GOR, SHA, CN
2001-03
16C_407PCP2_03_V1
Numerator:
Numerator data - Observed survival rate, derived from the distribution of survival times from the date of diagnosis
(of a primary, invasive, malignant neoplasm) to the earliest date among the date of death, the date of emigration,
and the cut-off date of follow-up (31 December 2008), for cancer patients who were diagnosed during 2001-03 and
resident in England at the time of diagnosis. Analyses published prior to the July 2009 Compendium release
include only first primary malignancies. From the July 2009 release onwards, higher order primary malignancies
are also retained. The geographical area of each patient is defined by residence at the time of diagnosis. Records
with faulty data, and those of patients diagnosed with in situ tumours, tumours uncertain as to whether benign or
malignant, metastatic, or uncertain whether primary or metastatic, are excluded from analysis.
Source of numerator data - National Cancer Intelligence Centre (NCIC), Office for National Statistics (ONS)
derived from NHS regional cancer registries; National Health Service Central Register.
Comments on numerator data Denominator:
Denominator data - The expected survival rate among the cancer patients, derived from life tables specific for the
calendar year of death, single year of age, sex, Government Office Region of residence and deprivation.
Source of denominator data - Office for National Statistics (ONS).
Statistical methods:
The cumulative probability of death at a given time since diagnosis, relative to the corresponding probability in the
general population, is estimated by comparing the death rates among the cancer patients in successive intervals
4
of time since diagnosis with the all-causes death rate in the general population for the same sex and age group .
This is derived from life tables for the Government Office Region in which the patient lives. Life tables were
created that were specific for calendar year of death, single year of age, sex, Government Office Region and
deprivation. Life tables were constructed for the years 1991, 2001 and 2005 using ONS mid-year population
estimates and the mean annual number of deaths in the three years centred on those index years. Life tables for
239
the intervening years were then created by linear interpolation. The life tables for 2005 were used for years 2006
to 2008 without interpolation.
The relative survival rates for the pooled three-year time period have been directly age-standardised to take into
account any variation in relative survival by age. The standard population used is the number of persons who were
diagnosed with the particular cancer under consideration in England and Wales during the period 1986-90. These
were broken down into three age (at diagnosis) groups: 15-69, 70-79, and 80-99 years.
Rates for different cancers are standardised using different standard populations, and in some instances different
age groupings, and should therefore not be compared.
Annex 3 of the Compendium User Guide: Explanations of statistical methods used in the Compendium.
Interpretation of indicators:
Type of Indicator - The relative survival rate can be interpreted as an estimate of the proportion of cancer patients
who die of their disease, after adjustment for death from other causes. A relative survival rate of 100% for a given
period would imply that the cancer patients had had the same survival (or death) rates as the general population,
not that they had all survived. Similarly, if the relative survival rate remains constant at (say) ten or more years
after diagnosis, this implies that the ten-year survivors no longer have higher mortality than the general population.
Quality of indicator - Annex 12 of the Compendium User Guide describes the criteria that should be used to judge
the quality of this indicator. The application of the criteria is dependent on the context (e.g. describing a single
organisation, comparing several organisations) and the level (e.g. national / regional with large numbers of events,
local with small numbers of events) at which the data are to be used.
Potential value of indicator:
Cancer survival is a broad indicator - differences may be due to a range of factors, of which the quality of
treatment is only one. Differences in cancer survival between geographical areas should therefore be the origin of
further enquiry, not the basis for simplistic conclusions about the efficacy of cancer treatment. The geographical
area of residence at cancer diagnosis is a proxy for several aspects of health care, including the quality of primary
care, the speed of referral and the quality of treatment services. It may also be a proxy for other factors, not readily
measured, such as the degree of understanding of cancer symptoms and what to do about them among the local
population, variations in the extent of disease at diagnosis (stage) and in the histology and grade of tumours, and
artefacts in the data. If geographical survival differences can be attributed to differences in knowledge of cancer or
the extent of disease at diagnosis, public health responses could be organised. Differences in cancer survival
between geographical areas may also "turn out to be due to the persistence of outmoded practices, or other
remediable deficiencies in service provision or therapeutic regimes, and correcting these should lead to an
5
improvement in overall standards of care" .
Further reading:
6
A comprehensive monograph on cancer survival in England and Wales has been published , covering 2.9 million
patients diagnosed with one of 47 adult cancers and 11 childhood cancers during 1971-90, and followed up to the
end of 1995. It includes comprehensive analyses by age, sex, and NHS Region, and by socio-economic status (in
five categories from affluent to deprived). Updated results for England and Wales have been published in 2004
and 2008 with a chapter for each of the 21 most common cancers. 7, 8 More limited analyses have also been
published for cancer patients diagnosed during 1991-93 and followed up to 1998, and diagnosed during 1993-95
and followed up to 2000. 9, 10 Five-year age-standardised relative survival rates for 21 major cancers based on
11
diagnoses in five year periods between 1998 and 2007 are available on the National Statistics website. An early
12
assessment of the impact of the NHS National Cancer Plan on relative survival has been published. An all13
cancer relative survival index for patients diagnosed 1991-2006 has been presented by PCT in England. Cancer
survival by Cancer Network has been presented for patients diagnosed with one of six cancers 1991-2006.13
1.
2.
3.
4.
5.
6.
7.
Expert Advisory Group on Cancer. A policy framework for commissioning cancer services. London:
Department of Health, 1995.
NHS Executive. The new NHS. Modern. Dependable. London: Department of Health, 1997.
Department of Health. The NHS Cancer Plan: three-year progress report - maintaining the momentum.
London: Department of Health, 2003.
Estève J, Benhamou E, Croasdale M, Raymond L. Relative survival and the estimation of net survival:
elements for further discussion. Stat Med 1990; 9: 529-38.
Clinical Outcomes Working Group. Clinical outcome indicators, July 1996. Edinburgh: The Scottish Office,
1996.
Coleman M.P, Babb P, Damiecki P, Grosclaude P, Honjo S, Jones J et al. Cancer survival trends in England
and Wales 1971-1995: deprivation and NHS Region. Series SMPS No.61. London: The Stationery Office,
1999, 1-695.
Coleman M.P, Rachet B, Woods L.M, Mitry E, Riga M, Cooper N et al. Trends and socioeconomic inequalities
in cancer survival in England and Wales up to 2001. British Journal of Cancer 2004; 90:1367-1373.
240
8.
9.
10.
11.
12.
13.
Quinn M.J, Cooper N, Rachet B, Mitry E, Coleman M.P. Survival from cancer of the breast in women in
England & Wales up to 2001. British Journal of Cancer 2008; 99:S53-S55.
Coleman M.P, Babb P, Harris S, Quinn M.J, Sloggett A, De Stavola B.L. Cancer survival in England and
Wales, 1991-1998. Office for National Statistics Health Statistics Quarterly 2000; 6: 71-80.
Office for National Statistics. Cancer survival in the health authorities of England,1993-2000. Report. Office for
National Statistics Health Statistics Quarterly 2002;13: 95-103.
Office for National Statistics. Survival Rates in England and Wales, 1998-2001, 1999-2002, 1999-03; Survival
Rates in England 2000-04, 2001-06. National Statistics website. Available at:
http://www.statistics.gov.uk/StatBase/Product.asp?vlnk=14007&Pos=3&ColRank=1&Rank=422 , accessed 16
September 2010.
Rachet B, Maringe C, Nur U, Quaresma M, Shah A, Woods LM, et al. Population-based cancer survival
trends in England and Wales up to 2007: an assessment of the NHS cancer plan for England. Lancet Oncol
2009;10:351-69.
Office for National Statistics. Cancer survival by cancer network, patients diagnosed 1991-2006, followed up
to 2007. National Statistics website. Available at:
http://www.statistics.gov.uk/STATBASE/Product.asp?vlnk=15387. Accessed 15 September 2010.
Updated: October 2010
241
Deaths at home from breast cancer
Purpose:
To improve palliative care and service planning for cancer patients in the terminal stages of life, allowing more of
them the choice of dying at home.
Definition of indicator and its variants:
The proportion of deaths from breast cancer (ICD-10 C50) that occur at home.
Statistic
Sex
Age group
Percent of deaths at home
F
All ages
Indirectly age-standardised
deaths at home rate per 100
deaths and number of deaths
at home
F
All ages
Organisation
(see glossary)
Current
data
E&W, E, GOR, ONS 2006-08
area, SHA, LA,
PCO, CTY
E&W, E, GOR, ONS 2006-08
area, SHA, LA,
PCO, CTY
Trend
data
File-worksheet name
16D_195PC_08_V1
16D_195ISR_08_V1
Numerator:
Numerator data - Deaths at home from breast cancer, classified by underlying cause of death (ICD-10 C50),
registered in the respective calendar year(s).
Source of numerator data - Office for National Statistics (ONS).
Comments on numerator data – Mortality data for years 1993-2006 were extracted by ONS in June 2007 with
organisational codes assigned using the postcode of usual residence and the November 2006 edition of the
National Statistics Postcode Directory (NSPD). Data for subsequent years were extracted in June of the following
year using the respective year’s November edition of the NSPD.
Information about the place of death is found on the mortality record in the communal establishment field. It
contains one of:
•
•
•
a 5 digit code identifying a communal establishment or institution (e.g. hospital, nursing home, residential
home);
an “H” code which indicates that the person is certified as having died at their home address and that this
is not a communal establishment or;
an “E” code which indicates that the person died elsewhere.
The communal establishments are themselves classified into 84 categories (e.g. general hospital, mental nursing
home, nursing home etc) and can be further distinguished by whether they are an NHS or Non-NHS
establishment.
It is currently ONS practice to include nursing homes with hospitals under a broader group - “Other hospitals and
communal establishments for the care of the sick” and also to include residential homes under “Other communal
establishments”. This is because of concerns highlighted by ONS regarding the accuracy of the recorded status of
some communal establishments, particularly nursing homes and residential homes.
It is therefore not possible to include nursing home or residential home deaths as a “home” death. For this
indicator, a “home” death is defined as one that has the ”H” code in the communal establishment field, i.e. where
the death has occurred at the home address and that address is not of a communal establishment.
Denominator:
Denominator data - All deaths from breast cancer, classified by underlying cause of death (ICD-10 C50),
registered in the respective calendar year(s).
Source of denominator data - ONS.
Comments on denominator data - Includes deaths in all categories of communal establishment code, i.e. deaths in
all communal establishments, at home, and elsewhere.
From the 2003 Compendium onwards, data are based on the original causes of death rather than the final causes
used in earlier Compendia. See Annex 2 for more details.
242
Statistical methods:
The age-standardised deaths at home rate utilises the indirect method of standardisation. The direct method was
found not to be robust as it was affected by small numerator and denominator counts in specific age groups.
Indirect standardisation requires the computation of the ratio of an area’s observed number of events to its
expected number of events if it had experienced the standard age-specific rates. This age-standardised ratio can
be converted into a rate by multiplying it by the crude rate of the standard population.
The standard rates used are those of England for the respective calendar year(s). Male and female rates have
been standardised separately. The rate for persons is standardised for both age and sex.
This methodology is similar to that used for the Clinical Indicators and is described in detail in:
Annex 3: Explanations of statistical methods used in the Compendium (under the sections entitled “Indirectly
Standardised Rates For Clinical Indicators” and “Confidence Intervals Of Indirectly Standardised Rates For Clinical
Indicators”).
Interpretation of indicators:
Type of Indicator - This is a condition-specific cross-sectional comparative indicator reflecting events which act as
a proxy for outcome (quality of dying). In the absence of an absolute standard, comparative data are useful for
monitoring in relation to rates achieved in comparable areas.
Quality of indicator - Annex 12 describes the criteria that should be used to judge the quality of this indicator. The
application of the criteria is dependent on the context (e.g. describing a single organisation, comparing several
organisations) and the level (e.g. national / regional with large numbers of events, local with small numbers of
events) at which the data are to be used.
Confidence Intervals - 95%. Some of the values and factors influencing them may be chance occurrences, with
values fluctuating at random between organisations and from year to year. Numbers of deaths may be small at
individual organisational level. The results should therefore be interpreted with caution and with the aid of
confidence intervals. The 95% confidence interval provides a measure of the statistical precision of the rate for an
area or institution. It indicates a range which, with 95% probability, will contain the underlying value of the
indicator. If the confidence interval for an organisation’s rate is outside the range of the national confidence
intervals, the difference between the two rates is considered statistically significant. If the confidence intervals for
two rates overlap, in most cases the difference between the rates would not be considered statistically significant.
Effect of Case-Mix / severity - Severity of the cancer and need for hospital care have implications for those who
wish to die at home being able to do so. The data available do not allow adjustment for these factors.
Other Potential Confounding Factors - A number of factors outside the control of the NHS such as personal
choice, availability of hospices, and family/community support may contribute to the variation shown by the
indicator.
Relevant National initiatives:
1.
2.
3.
4.
Department of Health. End of life care strategy : Promoting high quality care for all adults at the end of life.
London: Department of Health , 2008.
http://www.dh.gov.uk/en/Publicationsandstatistics/Publications/PublicationsPolicyAndGuidance/DH_086277
Department of Health. The NHS cancer plan and the new NHS: Providing a patient-centred service. London:
Department of Health, 2004.
Department of Health. Pioneering Schemes Named Best of the Best. NHS Beacons – Part of a Concerted
Campaign to Improve Cancer Services. Department of Health, 1999. Press release: reference 1999/0375
Commission for Health Improvement. NHS Cancer Care in England and Wales. National Service Framework
Assessments No.1. London: Commission for Health Improvement, 2001.
Further reading:
1.
2.
3.
Higginson I.J, Thompson M. Children and young people who die from cancer: epidemiology and place of
death in England (1995-9). British Medical Journal 2003; 327: 478-479.
Grande GE, Todd CJ, Barclay SIG, Farquhar MC. Does hospital at home for palliative care facilitate death at
home? Randomised controlled trial. British Medical Journal 1999; 319: 1472-1475.
Higginson I.J, Jarman B, Astin P, Dolan S. Do social factors affect where patients die: an analysis of 10 years
of cancer deaths in England. Journal of Public Health Medicine 1999; 21(1): 23-28.
Updated: December 2009
243
Breast screening programme coverage
Purpose:
To reduce the death toll from breast cancer. Early diagnosis can have a major impact on breast cancer survival.
National policy for the screening programme is that eligible women aged 50-70 are invited for screening every 3
years. Because the programme is a rolling one which invites women from GP practices (or geographical areas) in
a three year cycle, not every woman will receive an invitation as soon as she is 50. However, every woman should
receive her first invitation before her 53rd birthday. Women who are over the upper age limit for routine invitations
for breast screening are encouraged to make their own appointments at three yearly intervals. Previously only
women aged 50-64 were eligible to be invited as part of the NHS Breast Screening Programme. However, this was
extended in April 2001 to include women aged 65-70. The last screening unit began inviting older women in April
2006. While the majority of PCOs are now inviting all women aged 50-70 full national coverage should be
achieved in 2010.
In September 2000, the first research was published which demonstrated that the National Health Service Breast
1
Screening Programme has lowered mortality rates from breast cancer in the 55-69 age group. In 2002 the World
Health Organization's International Agency for Research on Cancer (IARC) concluded that mammography
screening for breast cancer reduces mortality. The IARC working group, comprising 24 experts from 11 countries,
evaluated all the available evidence on breast screening and determined that there is a 35 per cent reduction in
mortality from breast cancer among screened women aged 50-69 years old. This means that out of every 500
women screened, one life will be saved.2
Definition of indicator and its variants:
The coverage of the screening programme is defined as the proportion of women eligible for screening who have
had a test with a recorded result at least once in the previous 3 years. Women ineligible for screening, and
therefore excluded from both the numerator and denominator of the coverage calculation, are those whose recall
has been ceased for clinical reasons (e.g. those who have had a bilateral mastectomy). Coverage of the screening
programme is best assessed using the 53-64 and 53-70 year age groups as women may be first called at any
time between their 50th and 53rd birthdays.
Statistic
Percent
Sex
F
Age group
53-64
Organisation
(see glossary)
Current
data
E, GOR, SHA, PCO
2009
16E_426PCP1_09_V1
2009
16E_426PCP2_09_V1
53-70
Trend
data
File-worksheet name
Numerator:
Numerator data - Numerator data – Eligible women recorded as having had a test with a recorded result at least
once in the previous 3 years as at 31 March for the respective year.
Source of numerator data – The NHS Information Centre for health and social care. Breast Screening Programme,
England: 2008-09. Leeds: The NHS Information Centre for health and social care, 2010.
Comments on numerator data - Local level coverage is calculated for Primary Care Organisations (PCOs).
Although PCOs have a defined geographical boundary, the populations used are NOT those of women resident
within the PCO boundaries. Instead, the populations of women for whom each of the PCOs is responsible are
used. Where women on the call/recall screening register are not registered with a GP at the time coverage is
calculated, they are allocated to a PCO on a geographical basis. Similarly, the populations used for Strategic
Health Authorities and Government Office Regions are NOT those of women resident within their boundaries, but
are the aggregates of the responsible populations of their constituent PCOs.
PCOs report the population coverage of the screening programme on the NHS Information Centre for health and
social care return KC63.
Denominator:
Denominator data - Eligible women. Responsible population estimates based on Exeter System GP lists as at 31
March for the respective year, less the number of women recorded as ineligible.
Source of denominator data - The NHS Information Centre for health and social care.
Comments on denominator data - See “Comments on numerator data”.
244
Statistical methods:
Annex 3: Explanations of statistical methods used in the Compendium.
Interpretation of indicators:
Quality of indicator - Annex 12 describes the criteria that should be used to judge the quality of this indicator. The
application of the criteria is dependent on the context (e.g. describing a single organisation, comparing several
organisations) and the level (e.g. national / regional with large numbers of events, local with small numbers of
events) at which the data are to be used.
Confidence Intervals - 95%. Some of the values and factors influencing them may be chance occurrences, with
values fluctuating at random between organisations and from year to year. Numbers of deaths may be small at
individual organisational level. The results should therefore be interpreted with caution and with the aid of
confidence intervals. The 95% confidence interval provides a measure of the statistical precision of the rate for an
area or institution. It indicates a range which, with 95% probability, will contain the underlying value of the
indicator. If the confidence interval for an organisation’s rate is outside the range of the national confidence
intervals, the difference between the two rates is considered statistically significant. If the confidence intervals for
two rates overlap, in most cases the difference between the rates would not be considered statistically significant.
Further reading:
1.
2.
3.
4.
5.
6.
7.
Blanks RG et al. Effect of NHS Breast Cancer Screening Programme on Mortality from Breast Cancer in
England and Wales, 1990-8: Comparison of Observed with Predicted Mortality. British Medical Journal 2000;
321:665-669.
IARC. Handbooks of Cancer Prevention Volume 7 – Breast Cancer Screening. Lyons: IARC, 2002
NHS Cancer Screening Programmes Web Site: http://www.cancerscreening.nhs.uk
NHS Information Centre for health and social care web site: NHS Breast Screening Programme Statistics:
http://www.cancerscreening.nhs.uk/breastscreen/statistics.html
NHS. NHS Breast Screening Programme Annual Review 2009 – Expanding our reach. Sheffield: NHS Cancer
Screening Programmes, 2009. Available at:
http://www.cancerscreening.nhs.uk/breastscreen/publications/nhsbsp-annualreview2009.pdf
Department of Health. The NHS Cancer Plan. London: The Stationery Office, 2000.
Department of Health. The NHS cancer plan and the new NHS: Providing a patient-centred service. London:
Department of Health, 2004.
Updated: August 2010
245
Years of life lost due to mortality from breast cancer
Purpose:
Years of life lost (YLL) is a measure of premature mortality. Its primary purpose is to compare the relative
importance of different causes of premature death within a particular population and it can therefore be used by
health planners to define priorities for the prevention of such deaths. It can also be used to compare the premature
mortality experience of different populations for a particular cause of death. The concept of years of life lost is to
estimate the length of time a person would have lived had they not died prematurely. By inherently including the
age at which the death occurs, rather than just the fact of its occurrence, the calculation is an attempt to better
quantify the burden, or impact, on society from the specified cause of mortality.
Definition of indicator and its variants:
Years of life lost due to mortality from breast cancer (ICD-10 C50).
Statistic
Sex
Age group
Crude rate per 10,000
population and number of
years of life lost
Directly age-standardised rate
per 10,000 population and
number of deaths
F
<75
F
<75
Organisation
(see glossary)
Current
data
Trend
data
File-worksheet name
E&W, E, GOR,
ONS area, SHA,
LA, PCO, CTY
E&W, E, GOR,
ONS area, SHA,
LA, PCO, CTY
2006-08
16G_036CR_08_V1
2006-08
16G_036DR_08_V1
Numerator:
Numerator data – Years of life lost and deaths from breast cancer classified by underlying cause of death (ICD-10
C50), registered in the respective calendar year(s).
Source of numerator data – Office for National Statistics (ONS).
Comments on numerator data – The number of years of life lost is calculated by summing over ages 1 to 74 years
the number of deaths at each age multiplied by the number of years of life remaining up to age 75 years. Infant
deaths are omitted as they are mostly a result of causes specific to this age group and have different aetiologies to
deaths later in life.
The numerator presented alongside the sdirecgtly age-tandardised years of life lost rate is the number of deaths
rather than the number of years of life lost. This is because the standardisation calculation has been performed
using 5-year age bands. In each age band the number of deaths is weighted by the number of years of life
remaining from the mid-point of the age band up to age 75 years. See annex 3 for more details.
Mortality data for years 1993-2006 were extracted by ONS in June 2007 with organisational codes assigned using
the postcode of usual residence and the November 2006 edition of the National Statistics Postcode Directory
(NSPD). Data for subsequent years were extracted in June of the following year using the respective year’s
November edition of the NSPD.
In January 2001, the ONS implemented a change from ICD-9 to ICD-10 for coding causes of death in England &
Wales. As part of an exercise to investigate the effects of this change, the ONS also re-coded all deaths registered
in 1999. Deaths for years prior to 1999 and for year 2000 have not been re-coded.
For current analysis, therefore, all data are based on ICD-10.
From the 2003 Compendium onwards, data are based on the original causes of death rather than the final causes
used in earlier Compendia.
See Annex 2 for more details.
Denominator:
Denominator data - 2001 Census based mid-year population estimates for the respective calendar years.
Source of denominator data - ONS.
Comments on denominator data - Data are based on the latest revisions of ONS mid-year population estimates for
the respective years, current as at 1 October 2009.
246
Statistical methods:
Annex 2: Changes to Office for National Statistics mortality data
Annex 3: Explanations of statistical methods used in the Compendium
Annex 5: European Standard Population
Interpretation of indicators:
Quality of indicator - Annex 12 describes the criteria that should be used to judge the quality of this indicator. The
application of the criteria is dependent on the context (e.g. describing a single organisation, comparing several
organisations) and the level (e.g. national / regional with large numbers of events, local with small numbers of
events) at which the data are to be used.
Further reading:
1.
2.
3.
4.
5.
6.
Department of Health. The NHS cancer plan and the new NHS: Providing a patient-centred service. London:
Department of Health, 2004.
Department of Health. NHS Cancer Plan. London: Department of Health, 2000.
NHS. Manual of Cancer Services Standards. London: NHS Executive, 2000.
Department of Health. Saving Lives: Our Healthier Nation. London: The Stationery Office, 1999.
Haward R, Goldacre M, Mason A, Wilkinson E, Amess M. Health Outcome Indicators: Breast Cancer . Oxford:
NCHOD, 1999. Available at http://nchod.uhce.ox.ac.uk/breastcancer.pdf
Department of Health. Health of the Nation - A Strategy for Health in England. London: Her Majesty’s
Stationery Office, 1992.
Updated: December 2009
247
Incidence of cervical cancer
Purpose:
To reduce the incidence of cervical cancer.
Definition of indicator and its variants:
Registrations for cervical cancer (ICD-10 C53 equivalent to ICD-9 180).
Statistic
Sex
Indirectly age-standardised
registration ratio (SRR) and
number of registrations
F
Directly age-standardised
registration rate and number of
registrations
F
Age group
Organisation
(see glossary)
Current
data
All ages
<75
E&W, E, GOR, ONS 2004-06
area, SHA, LA, PCO
All ages
All ages
<75
E&W, E, GOR, ONS 2004-06
area, SHA, LA, PCO
All ages
Trend
data
File-worksheet name
17A_039SR00++_06_V1
17A_039SR0074_06_V1
1993-06 17A_039SRT00++_06_V1
17A_039DR00++_06_V1
17A_039DR0074_06_V1
1993-06 17A_039DRT00++_06_V1
Numerator:
Numerator data - Cancer registrations for cervical cancer (ICD-10 C53, ICD-9 180) in the respective calendar
years.
Source of numerator data - Regional Cancer Registries and the Office for National Statistics (ONS).
Comments on numerator data - Registration data for years 1993-2005 were extracted by ONS in November 2008.
Data for 2006 are as registered by the end of September 2008. For all data organisational codes were assigned
using the postcode of usual residence and the August 2008 edition of the National Statistics Postcode Directory.
Results in the current Compendium may differ from those of previous issues because of changes in methodology
to extract data by area, and also because of data enhancements by ONS. Cancer registrations are also
continuously being updated retrospectively and ONS records may have been updated since previous analyses.
The directly age-standardised registration rate for cervical cancer for women of all ages was a target indicator in
the Health of the Nation strategy (See “Further reading”).
Denominator:
Denominator data - 2001 Census based mid-year population estimates for the respective calendar years.
Source of denominator data - ONS.
Comments on denominator data - Data are based on the latest revisions of ONS mid-year population estimates for
the respective years, current as at 29 September 2008.
Statistical methods:
Annex 3: Explanations of statistical methods used in the Compendium
Annex 5: European Standard Population
Interpretation of indicators:
Quality of indicator - Annex 12 describes the criteria that should be used to judge the quality of this indicator. The
application of the criteria is dependent on the context (e.g. describing a single organisation, comparing several
organisations) and the level (e.g. national / regional with large numbers of events, local with small numbers of
events) at which the data are to be used.
Further reading:
1.
2.
Department of Health. The NHS cancer plan and the new NHS: Providing a patient-centred service. London:
Department of Health, 2004.
Department of Health. Health of the Nation - a strategy for health in England. London: Her Majesty’s
Stationery Office, 1992.
Updated: May 2009
248
Mortality from cervical cancer
Purpose:
To reduce deaths from cervical cancer.
Definition of indicator and its variants:
Mortality from cervical cancer (ICD-10 C53 equivalent to ICD-9 180).
Statistic
Sex
Number of deaths
F
Average age-specific death
rate per 100,000 resident
population
Indirectly age-standardised
mortality ratio (SMR) and
number of deaths
F
Directly age-standardised
mortality rate per 100,000 and
number of deaths
F
F
Age group
1+, 1-4, 5-14,
15-34, 35-64,
65-74, 75+
1+, 1-4, 5-14,
15-34, 35-64,
65-74, 75+
All ages,
<75,
15-64,
65-74
All ages
All ages,
<75,
15-64,
65-74
Organisation
(see glossary)
Current
data
E&W, E, GOR,
ONS area, SHA,
LA, PCO, CTY
E&W, E, GOR,
ONS area, SHA,
LA, PCO, CTY
E&W, E, GOR,
ONS area, SHA,
LA, PCO, CTY
2008
17B_040NO_08_V1
2006-08
17B_040CR_08_V1
2006-08
17B_040SM00++_08_V1
17B_040SM0074_08_V1
17B_040SM1564_08_V1
17B_040SM6574_08_V1
E&W, E, GOR,
ONS area, SHA,
LA, PCO, CTY
All ages
2006-08
Trend
data
File-worksheet name
1993-08 17B_040SMT00++_08_V1
17B_040DR00++_08_V1
17B_040DR0074_08_V1
17B_040DR1564_08_V1
17B_040DR6574_08_V1
1993-08 17B_040DRT00++_08_V1
Numerator:
Numerator data - Deaths from cervical cancer, classified by underlying cause of death (ICD-10 C53, ICD-9 180),
registered in the respective calendar year(s).
Source of numerator data - Office for National Statistics (ONS).
Comments on numerator data – Mortality data for years 1993-2006 were extracted by ONS in June 2007 with
organisational codes assigned using the postcode of usual residence and the November 2006 edition of the
National Statistics Postcode Directory (NSPD). Data for subsequent years were extracted in June of the following
year using the respective year’s November edition of the NSPD.
In January 2001, the ONS implemented a change from ICD-9 to ICD-10 for coding causes of death in England &
Wales. As part of an exercise to investigate the effects of this change, the ONS also re-coded all deaths registered
in 1999. Deaths for years prior to 1999 and for year 2000 have not been re-coded.
For current analysis, therefore, all data are based on ICD-10.
For trend analysis, the numbers of deaths observed in the years 1993-98 and 2000 must be adjusted to give
“expected” numbers of deaths which would have been coded to this cause in ICD-10. This is done by multiplying
the ICD-9 based death counts by the appropriate ICD-10/9 comparability ratio published by the ONS. Trend data
cannot include years prior to 1993, because the ONS introduced automated coding in 1993, and the comparability
ratios are only valid from this point onwards.
For this indicator the following ICD-10/9 comparability ratios were used:
Females
All Ages: 1
From the 2003 Compendium onwards, data are based on the original causes of death rather than the final causes
used in earlier Compendia.
See Annex 2 for more details.
Denominator:
Denominator data - 2001 Census based mid-year population estimates for the respective calendar years.
249
Source of denominator data - ONS.
Comments on denominator data - Data are based on the latest revisions of ONS mid-year population estimates for
the respective years, current as at 1 October 2009.
Statistical methods:
Annex 2: Changes to Office for National Statistics mortality data
Annex 3: Explanations of statistical methods used in the Compendium
Annex 5: European Standard Population
Interpretation of indicators:
Quality of indicator - Annex 12 describes the criteria that should be used to judge the quality of this indicator. The
application of the criteria is dependent on the context (e.g. describing a single organisation, comparing several
organisations) and the level (e.g. national / regional with large numbers of events, local with small numbers of
events) at which the data are to be used.
Further reading:
1.
2.
3.
4.
5.
6.
7.
8.
Department of Health. The NHS cancer plan and the new NHS: Providing a patient-centred service. London:
Department of Health, 2004.
Brock A, Griffiths C. Trends in the mortality of young adults aged 15-44 in England and Wales, 1961-2001.
Office for National Statistics Health Statistics Quarterly, No. 19, 2003: 22-31. Available at:
http://www.statistics.gov.uk/downloads/theme_health/HSQ19.pdf
World Health Organization. WHO Framework on Tobacco Control. Geneva: World Health Organization, 2003.
Available at: http://www.who.int/tobacco/fctc/text/en/fctc_en.pdf
Department of Health. NHS Cancer Plan. London: Department of Health, 2000.
NHS. Manual of Cancer Services Standards. London: NHS Executive, 2000.
Department of Health. Saving lives: Our Healthier Nation. London: The Stationery Office, 1999.
World Bank. Economics of Tobacco Control. Washington: World Bank, 1999. Available at:
http://www1.worldbank.org/tobacco/book/pdf/tobacco.pdf
Department of Health. Smoking kills – a White Paper on tobacco. London: The Stationery Office, 1998.
Updated: December 2009
250
Survival following diagnosis of cervical cancer
Purpose:
To provide comparative measures of the outcome of cancer treatment by area of residence, using geographical
variations in cancer survival. Cancer survival is a key operational measure of the success of cancer treatment
services. The principle of equity of access to optimal standards of National Health Service (NHS) cancer treatment
was explicitly endorsed in the Calman-Hine report of 1995, which noted: "All patients should have access to a
uniformly high quality of care in the community or hospital wherever they may live to ensure the maximum possible
1
cure rates and best quality of life" . A further policy document stated that from April 1999, patients with suspected
breast cancer "will be able to see a specialist within two weeks of their GP deciding they need to be seen urgently,
2
and requesting an appointment" . Similar commitments have come into force for other cancers since April 2000.
These policies are expected to lead to earlier diagnosis for all patients and more equitable access to treatment.
The NHS Cancer Plan extended these commitments to improve cancer survival in England to amongst the best in
3
Europe . Cancer survival rates are outcome measures that can form part of the baseline for monitoring the future
impact of these policies. Geographic differences in cancer survival are expected to decline over time if policy goals
are achieved.
Definition of indicator and its variants:
Relative survival rate at one and five years after diagnosis for patients diagnosed in England during 2001-03 and
followed up to the end of the year 2008. Cancer patients have higher mortality than the general population, but
they do not all die of cancer. The relative survival rate is the ratio of the survival rate actually observed among the
cancer patients and the survival rate that would have been expected if they had only had the same overall
mortality rates as the general population. Thus, if five-year survival is 60% among a group of cancer patients of
whom 90% would have been expected to survive that long, the relative survival is 67% (60/90). By convention,
relative survival is described as a rate, although strictly it is a ratio of two percentages.
Statistic
Number and one-year relative
survival rate (%)
Number and five-year relative
survival rate (%)
Sex
Age group
Organisation
(see glossary)
Current
data
Trend
data
File-worksheet name
F
15-99
E, GOR, SHA, CN
2001-03
17C_408PCP1_03_V1
F
15-99
E, GOR, SHA, CN
2001-03
17C_408PCP2_03_V1
Numerator:
Numerator data - Observed survival rate, derived from the distribution of survival times from the date of diagnosis
(of a primary, invasive, malignant neoplasm) to the earliest date among the date of death, the date of emigration,
and the cut-off date of follow-up (31 December 2008), for cancer patients who were diagnosed during 2001-03 and
resident in England at the time of diagnosis. Analyses published prior to the July 2009 Compendium release
include only first primary malignancies. From the July 2009 release onwards, higher order primary malignancies
are also retained. The geographical area of each patient is defined by residence at the time of diagnosis. Records
with faulty data, and those of patients diagnosed with in situ tumours, tumours uncertain as to whether benign or
malignant, metastatic, or uncertain whether primary or metastatic, are excluded from analysis.
Source of numerator data - National Cancer Intelligence Centre (NCIC), Office for National Statistics (ONS)
derived from NHS regional cancer registries; National Health Service Central Register.
Comments on numerator data Denominator:
Denominator data - The expected survival rate among the cancer patients, derived from life tables specific for the
calendar year of death, single year of age, sex, Government Office Region of residence and deprivation.
Source of denominator data - Office for National Statistics (ONS).
Statistical methods:
The cumulative probability of death at a given time since diagnosis, relative to the corresponding probability in the
general population, is estimated by comparing the death rates among the cancer patients in successive intervals
4
of time since diagnosis with the all-causes death rate in the general population for the same sex and age group .
This is derived from life tables for the Government Office Region in which the patient lives. Life tables were
created that were specific for calendar year of death, single year of age, sex, Government Office Region and
deprivation. Life tables were constructed for the years 1991, 2001 and 2005 using ONS mid-year population
estimates and the mean annual number of deaths in the three years centred on those index years. Life tables for
251
the intervening years were then created by linear interpolation. The life tables for 2005 were used for years 2006
to 2008 without interpolation.
The relative survival rates for the pooled three-year time period have been directly age-standardised to take into
account any variation in relative survival by age. The standard population used is the number of persons who were
diagnosed with the particular cancer under consideration in England and Wales during the period 1986-90. These
were broken down into three age (at diagnosis) groups: 15-69, 70-79, and 80-99 years.
Rates for different cancers are standardised using different standard populations, and in some instances different
age groupings, and should therefore not be compared.
Annex 3 of the Compendium User Guide: Explanations of statistical methods used in the Compendium.
Interpretation of indicators:
Type of Indicator - The relative survival rate can be interpreted as an estimate of the proportion of cancer patients
who die of their disease, after adjustment for death from other causes. A relative survival rate of 100% for a given
period would imply that the cancer patients had had the same survival (or death) rates as the general population,
not that they had all survived. Similarly, if the relative survival rate remains constant at (say) ten or more years
after diagnosis, this implies that the ten-year survivors no longer have higher mortality than the general population.
Quality of indicator - Annex 12 of the Compendium User Guide describes the criteria that should be used to judge
the quality of this indicator. The application of the criteria is dependent on the context (e.g. describing a single
organisation, comparing several organisations) and the level (e.g. national / regional with large numbers of events,
local with small numbers of events) at which the data are to be used.
Potential value of indicator:
Cancer survival is a broad indicator - differences may be due to a range of factors, of which the quality of
treatment is only one. Differences in cancer survival between geographical areas should therefore be the origin of
further enquiry, not the basis for simplistic conclusions about the efficacy of cancer treatment. The geographical
area of residence at cancer diagnosis is a proxy for several aspects of health care, including the quality of primary
care, the speed of referral and the quality of treatment services. It may also be a proxy for other factors, not readily
measured, such as the degree of understanding of cancer symptoms and what to do about them among the local
population, variations in the extent of disease at diagnosis (stage) and in the histology and grade of tumours, and
artefacts in the data. If geographical survival differences can be attributed to differences in knowledge of cancer or
the extent of disease at diagnosis, public health responses could be organised. Differences in cancer survival
between geographical areas may also "turn out to be due to the persistence of outmoded practices, or other
remediable deficiencies in service provision or therapeutic regimes, and correcting these should lead to an
5
improvement in overall standards of care" .
Further reading:
6
A comprehensive monograph on cancer survival in England and Wales has been published , covering 2.9 million
patients diagnosed with one of 47 adult cancers and 11 childhood cancers during 1971-90, and followed up to the
end of 1995. It includes comprehensive analyses by age, sex, and NHS Region, and by socio-economic status (in
five categories from affluent to deprived). Updated results for England and Wales have been published in 2004
and 2008 with a chapter for each of the 21 most common cancers. 7, 8 More limited analyses have also been
published for cancer patients diagnosed during 1991-93 and followed up to 1998, and diagnosed during 1993-95
and followed up to 2000. 9, 10 Five-year age-standardised relative survival rates for 21 major cancers based on
11
diagnoses in five year periods between 1998 and 2007 are available on the National Statistics website. An early
12
assessment of the impact of the NHS National Cancer Plan on relative survival has been published. An all13
cancer relative survival index for patients diagnosed 1991-2006 has been presented by PCT in England. Cancer
survival by Cancer Network has been presented for patients diagnosed with one of six cancers 1991-2006.13
1.
2.
3.
4.
5.
6.
7.
Expert Advisory Group on Cancer. A policy framework for commissioning cancer services. London:
Department of Health, 1995.
NHS Executive. The new NHS. Modern. Dependable. London: Department of Health, 1997.
Department of Health. The NHS Cancer Plan: three-year progress report - maintaining the momentum.
London: Department of Health, 2003.
Estève J, Benhamou E, Croasdale M, Raymond L. Relative survival and the estimation of net survival:
elements for further discussion. Stat Med 1990; 9: 529-38.
Clinical Outcomes Working Group. Clinical outcome indicators, July 1996. Edinburgh: The Scottish Office,
1996.
Coleman M.P, Babb P, Damiecki P, Grosclaude P, Honjo S, Jones J et al. Cancer survival trends in England
and Wales 1971-1995: deprivation and NHS Region. Series SMPS No.61. London: The Stationery Office,
1999, 1-695.
Coleman M.P, Rachet B, Woods L.M, Mitry E, Riga M, Cooper N et al. Trends and socioeconomic inequalities
in cancer survival in England and Wales up to 2001. British Journal of Cancer 2004; 90:1367-1373.
252
8.
9.
10.
11.
12.
13.
Quinn M.j, Cooper N, Rachet B, Mitry E, Woods L.M, Coleman M.P. Survival from cancer of the uterine cervix
in England & Wales up to 2001. British Journal of Cancer 2008; 99:S59-S62
Coleman M.P, Babb P, Harris S, Quinn M.J, Sloggett A, De Stavola B.L. Cancer survival in England and
Wales, 1991-1998. Office for National Statistics Health Statistics Quarterly 2000; 6: 71-80.
Office for National Statistics. Cancer survival in the health authorities of England,1993-2000. Report. Office for
National Statistics Health Statistics Quarterly 2002;13: 95-103.
Office for National Statistics. Survival Rates in England and Wales, 1998-2001, 1999-2002, 1999-03; Survival
Rates in England 2000-04, 2001-06. National Statistics website. Available at:
http://www.statistics.gov.uk/StatBase/Product.asp?vlnk=14007&Pos=3&ColRank=1&Rank=422 , accessed 16
September 2010.
Rachet B, Maringe C, Nur U, Quaresma M, Shah A, Woods LM, et al. Population-based cancer survival trends
in England and Wales up to 2007: an assessment of the NHS cancer plan for England. Lancet Oncol
2009;10:351-69.
Office for National Statistics. Cancer survival by cancer network, patients diagnosed 1991-2006, followed up to
2007. National Statistics website. Available at:
http://www.statistics.gov.uk/STATBASE/Product.asp?vlnk=15387. Accessed 15 September 2010.
Updated: October 2010
253
Deaths at home from cervical cancer
Purpose:
To improve palliative care and service planning for cancer patients in the terminal stages of life, allowing more of
them the choice of dying at home.
Definition of indicator and its variants:
The proportion of deaths from cervical cancer (ICD-10 C53) that occur at home.
Statistic
Sex
Age group
Percent of deaths at home
F
All ages
Indirectly age-standardised
deaths at home rate per 100
deaths and number of deaths
at home
F
All Ages
Organisation
(see glossary)
Current
data
E&W, E, GOR, ONS 2006-08
area, SHA, LA,
PCO, CTY
E&W, E, GOR, ONS 2006-08
area, SHA, LA,
PCO, CTY
Trend
data
File-worksheet name
17D_196PC_08_V1
17D_196ISR_08_V1
Numerator:
Numerator data - Deaths at home from cervical cancer, classified by underlying cause of death (ICD-10 C53),
registered in the respective calendar year(s).
Source of numerator data - Office for National Statistics (ONS).
Comments on numerator data – Mortality data for years 1993-2006 were extracted by ONS in June 2007 with
organisational codes assigned using the postcode of usual residence and the November 2006 edition of the
National Statistics Postcode Directory (NSPD). Data for subsequent years were extracted in June of the following
year using the respective year’s November edition of the NSPD.
Information about the place of death is found on the mortality record in the communal establishment field. It
contains one of:
•
•
•
a 5 digit code identifying a communal establishment or institution (e.g. hospital, nursing home, residential
home);
an “H” code which indicates that the person is certified as having died at their home address and that this
is not a communal establishment or;
an “E” code which indicates that the person died elsewhere.
The communal establishments are themselves classified into 84 categories (e.g. general hospital, mental nursing
home, nursing home etc) and can be further distinguished by whether they are an NHS or Non-NHS
establishment.
It is currently ONS practice to include nursing homes with hospitals under a broader group - “Other hospitals and
communal establishments for the care of the sick” - and also to include residential homes under “Other communal
establishments”. This is because of concerns highlighted by the ONS regarding the accuracy of the recorded
status of some communal establishments, particularly nursing homes and residential homes.
It is therefore not possible to include nursing home or residential home deaths as a “home” death. For this
indicator, a “home” death is defined as one that has the ”H” code in the communal establishment field, i.e. where
the death has occurred at the home address and that address is not of a communal establishment.
Denominator:
Denominator data - All deaths from cervical cancer, classified by underlying cause of death (ICD-10 C53),
registered in the respective calendar year(s).
Source of denominator data - ONS.
Comments on denominator data - Includes deaths in all categories of communal establishment code, i.e. deaths in
all communal establishments, at home, and elsewhere.
From the 2003 Compendium onwards, data are based on the original causes of death rather than the final causes
used in earlier Compendia. See Annex 2 for more details.
254
Statistical methods:
The age-standardised deaths at home rate utilises the indirect method of standardisation. The direct method was
found not to be robust as it was affected by small numerator and denominator counts in specific age groups.
Indirect standardisation requires the computation of the ratio of an area’s observed number of events to its
expected number of events if it had experienced the standard age-specific rates. This age-standardised ratio can
be converted into a rate by multiplying it by the crude rate of the standard population.
The standard rates used are those of England for the respective calendar year(s). Male and female rates have
been standardised separately. The rate for persons is standardised for both age and sex.
This methodology is similar to that used for the Clinical Indicators and is described in detail in:
Annex 3: Explanations of statistical methods used in the Compendium (under the sections entitled “Indirectly
Standardised Rates For Clinical Indicators” and “Confidence Intervals Of Indirectly Standardised Rates For Clinical
Indicators”).
Interpretation of indicators:
Type of Indicator - This is a condition-specific cross-sectional comparative indicator reflecting events which act as
a proxy for outcome (quality of dying). In the absence of an absolute standard, comparative data are useful for
monitoring in relation to rates achieved in comparable areas.
Quality of indicator - Annex 12 describes the criteria that should be used to judge the quality of this indicator. The
application of the criteria is dependent on the context (e.g. describing a single organisation, comparing several
organisations) and the level (e.g. national / regional with large numbers of events, local with small numbers of
events) at which the data are to be used.
Confidence Intervals - 95%. Some of the values and factors influencing them may be chance occurrences, with
values fluctuating at random between organisations and from year to year. Numbers of deaths may be small at
individual organisational level. The results should therefore be interpreted with caution and with the aid of
confidence intervals. The 95% confidence interval provides a measure of the statistical precision of the rate for an
area or institution. It indicates a range which, with 95% probability, will contain the underlying value of the
indicator. If the confidence interval for an organisation’s rate is outside the range of the national confidence
intervals, the difference between the two rates is considered statistically significant. If the confidence intervals for
two rates overlap, in most cases the difference between the rates would not be considered statistically significant.
Effect of Case-Mix / severity - Severity of the cancer and need for hospital care have implications for those who
wish to die at home being able to do so. The data available do not allow adjustment for these factors.
Other Potential Confounding Factors - A number of factors outside the control of the NHS such as personal
choice, availability of hospices, and family/community support may contribute to the variation shown by the
indicator.
Relevant National initiatives:
1.
2.
3.
4.
Department of Health. End of life care strategy : Promoting high quality care for all adults at the end of life.
London: Department of Health , 2008.
http://www.dh.gov.uk/en/Publicationsandstatistics/Publications/PublicationsPolicyAndGuidance/DH_086277
Department of Health. The NHS cancer plan and the new NHS: Providing a patient-centred service. London:
Department of Health, 2004.
Department of Health. Pioneering Schemes Named Best of the Best. NHS Beacons – Part of a Concerted
Campaign to Improve Cancer Services. Department of Health, 1999. Press release: reference 1999/0375
Commission for Health Improvement. NHS Cancer Care in England and Wales. National Service Framework
Assessments No.1. London: Commission for Health Improvement, 2001.
Further reading:
1.
2.
3.
Higginson I.J, Thompson M. Children and young people who die from cancer: epidemiology and place of
death in England (1995-9). British Medical Journal 2003; 327: 478-479.
Grande GE, Todd CJ, Barclay SIG, Farquhar MC. Does hospital at home for palliative care facilitate death at
home? Randomised controlled trial. British Medical Journal 1999; 319: 1472-1475.
Higginson I.J, Jarman B, Astin P, Dolan S. Do social factors affect where patients die: an analysis of 10 years
of cancer deaths in England. Journal of Public Health Medicine 1999; 21(1): 23-28.
Updated: December 2009
255
Cervical screening programme coverage
Purpose:
To reduce the incidence of, and mortality from, invasive cervical cancer. Cervical screening is not a test for cancer. It
is a method of preventing cancer by detecting and treating early abnormalities which, if left untreated, could lead to
cancer in a woman's cervix (the neck of the womb). Early detection and treatment can prevent 80 to 90 per cent of
cancers developing. National policy for the screening programme is that eligible women between the ages of 25 and
64 years should be screened every 3 to 5 years. This varies according to age, women aged 25-49 are invited every 3
years, those aged 50-64 every 5 years. Since 2003, women have been eligible for routine screening from age 25
(previously age 20).
Definition of indicator and its variants:
The coverage of the screening programme is defined as the proportion of women eligible for screening who have
had a test with a recorded result at least once in the previous 5 years (age groups 25-64 and 50-64 years) or 3.5
years (age group 25-49 years). Women ineligible for screening, and therefore excluded from both the numerator
and denominator of the coverage calculation, are those whose recall has been ceased for clinical reasons (e.g.
those who have had a hysterectomy). Coverage of the screening programme continues to be assessed using the
25-64 year age group as previously used when women were first called at any time between their 20th and 25th
birthdays.
Statistic
Percent
Sex
F
Age group
Organisation
(see glossary)
Current
data
E, GOR, SHA, PCO
2010
17E_427PCP1_10_V1
25-49
2010
17E_427PCP2_10_V1
50-64
2010
17E_427PCP3_10_V1
25-64
Trend
data
File-worksheet name
Numerator:
Numerator data - Eligible women recorded as having had a test with a recorded result at least once in the previous
5 years (age groups 25-64 and 50-64 years) or 3.5 years (age group 25-49 years ) at 31 March for the respective
year.
Source of numerator data - The NHS Information Centre for health and social care. Cervical Screening
Programme, England: 2009-10. Leeds: The NHS Information Centre for health and social care, 2010.
Comments on numerator data - Local level coverage is calculated for Primary Care Organisations (PCOs).
Although PCOs have a defined geographical boundary, the populations used are NOT those of women resident
within the PCO boundaries. Instead, the populations of women for whom each of the PCOs is responsible are
used. Where women on the call/recall screening register are not registered with a GP at the time coverage is
calculated they are allocated to a PCO on a geographical basis. Similarly, the populations used for Strategic
Health Authorities and Government Office Regions are NOT those of women resident within their boundaries, but
are the aggregates of the responsible populations of their constituent PCOs.
PCOs report the population coverage of the screening programme on the NHS Information Centre for health and
social care return KC53.
Denominator:
Denominator data - Eligible women. Responsible population estimates based on Exeter System GP lists as at 31
March for the respective year, less the number of women recorded as ineligible.
Source of denominator data - The NHS Information Centre for health and social care.
Comments on denominator data - See “Comments on numerator data”.
Statistical methods:
Annex 3: Explanations of statistical methods used in the Compendium
Interpretation of indicators:
Quality of indicator - Annex 12 describes the criteria that should be used to judge the quality of this indicator. The
application of the criteria is dependent on the context (e.g. describing a single organisation, comparing several
256
organisations) and the level (e.g. national / regional with large numbers of events, local with small numbers of
events) at which the data are to be used.
Confidence Intervals - 95%. Some of the values and factors influencing them may be chance occurrences, with
values fluctuating at random between organisations and from year to year. Numbers of deaths may be small at
individual organisational level. The results should therefore be interpreted with caution and with the aid of
confidence intervals. The 95% confidence interval provides a measure of the statistical precision of the rate for an
area or institution. It indicates a range which, with 95% probability, will contain the underlying value of the
indicator. If the confidence interval for an organisation’s rate is outside the range of the national confidence
intervals, the difference between the two rates is considered statistically significant. If the confidence intervals for
two rates overlap, in most cases the difference between the rates would not be considered statistically significant.
Further reading:
1.
2.
3.
4.
5.
NHS Cancer Screening Programmes Web Site: http://www.cancerscreening.nhs.uk
NHS Information Centre for health and social care web site: NHS Cervical Screening Programme statistics:
http://www.cancerscreening.nhs.uk/cervical/statistics.html
NHS. NHS Cervical Screening Programme Annual Review 2009. Sheffield: NHS Cancer Screening
Programmes, 2009. Available at:
http://www.cancerscreening.nhs.uk/cervical/publications/cervical-annual-review-2009.pdf
Department of Health. The NHS Cancer Plan. London: The Stationery Office, 2000.
Department of Health. The NHS cancer plan and the new NHS: Providing a patient-centred service. London:
Department of Health, 2004.
Updated: November 2010
257
Cytology: cervical cancer screening
Purpose:
To help reduce the level of risk of cervical cancer for NHS patients and ensure high standards of primary health
care and treatment delivered to them.
Cervical cancer screening is a regular early detection intervention for women. Primary care is central to the overall
success of the cervical screening programme. General practitioners are in a unique position to invite women for a
smear test, to take smears, to ensure that abnormal smear test results are followed up, and to check on reasons
for non-attendance. Numerous studies have looked at the involvement of general practice in cervical screening,
identifying many ways in which the programme can be improved. Many practices are now running well organised
and effective programmes.
Definition of indicator and its variants:
Proportion of female patients aged 25 to 64 years whose notes record that a cervical smear test has been
performed in the last five years.
Statistic
Sex
Age
group
Organisation
(see glossary)
Number and percent of
patients
F
25-64
E, GOR, SHA,
PCO
Period
Current
data
FY 2008/09
File_worksheet Name
Trend data
17F_654PC_09_V1
Numerator:
Numerator data - Female patients aged 25 to 64 years whose notes record a cervical smear test performed in the
five years before the reference date.
Source of numerator data - Quality and Outcomes Framework (QOF).
Comments on numerator data - The data for this primary care indicator are derived from the Quality Management
Analysis System (QMAS) and supplied by the Prescribing Support Unit at The NHS Information Centre for health
and social care. The QOF is part of the General Medical Services (GMS) contract, with a focus on prevalence and
management of common chronic diseases at general practice level. It is aimed at measuring the achievement of
general practices against a set of evidence based negotiated standards and encouraging good practice.
The data to support the clinical quality indicators (i.e. clinical achievement data) are extracted from individual GP
practice clinical systems and sent automatically to QMAS once a month. Practices can make additional
submissions of clinical data at any time.
The ‘reference date’ is the specified date of patient records held by the general practice modelled for the end of the
st
QOF year (midnight 31 March). It is the same for the data from all practices and may differ from the date of data
submission.
Denominator:
Denominator data - Female patients aged 25-64 years excluding those who have been exception reported.
Patients may be exception reported for the following reasons:
•
a record of hysterectomy;
•
cervical cytology exception reported in the five years before the reference date;
•
registered in the three months before the reference date.
For more details regarding the description of the selection criteria and dataset rules of the relevant indicator set
see the following documentation available at: http://www.wmrlmc.co.uk/gms2/informationtechnology.htm
Source of denominator data - See “Numerator data”.
Comments on denominator data - The denominator is a count of patients for whom the clinical indicator should be
met. However, the selection rules do not provide the same opportunity for all patients included in the denominator
to take advantage of the full period (maximum number of months) allowed by good practice for the test,
measurement or treatment to be undertaken (e.g. if good practice for angina patients allows for a particular test to
be conducted up to 12 months after diagnosis then patients diagnosed between four and 11 months before the
reference date do not have the full period of 12 months for the test). Additionally, patients can be removed from
the denominator through the application of exception reporting.
258
Statistical methods:
The data are presented as raw (unadjusted) figures as recorded by the practices. Ideally, comparisons between
PCOs should take into account differences between their populations in terms of age, gender and case-mix.
However, this is not possible at present as the supplied data are not broken down by these characteristics.
Interpretation of indicators:
Quality of indicator - Users of data derived from QMAS should recognise that QMAS was established as a
mechanism to support the calculation of practice QOF payments and not as a person based epidemiological tool.
It is not a comprehensive source of data on quality of care in general practice, but it is potentially a rich and
valuable source of such information, providing that the limitations of the data are acknowledged.
There have been some significant revisions to the QOF, compared to previous years. Therefore direct
comparisons cannot be made except for the indicators that have not been subject to definitional changes.
Further reading:
1.
The NHS Information Centre for health and social care. National Quality and Outcomes Framework
Achievement Data 2008/09, September 2009. Available at: http://www.ic.nhs.uk/webfiles/QOF/200809/QOF%20Achievement%20and%20Prevalence%20Bulletin%202008-09.pdf
2. NHS Employers and General Practitioners Committee BMA. Quality and Outcomes Framework guidance for
GMS contract 2008/09, April 2008. Available at:
http://www.nhsemployers.org/SiteCollectionDocuments/QUALITY_OUT_COMPLETE_CD_110209.pdf
3. The NHS Information Centre for health and social care. National Quality and Outcomes Framework Statistics
for England 2007/08. Available at:
http://www.ic.nhs.uk/webfiles/QOF/2007-08/QOF%20200708%20Statistical%20Bulletin.pdf
4. The Information Centre for health and social care, Prescribing Support Unit. National Quality and Outcomes
Framework Statistics for England 2006/07. Available at:
http://www.ic.nhs.uk/webfiles/QOF/2006-07/QOF%202006-07%20Statistical%20Bulletin.pdf
5. The Information Centre for health and social care, Prescribing Support Unit. National Quality and Outcomes
Framework or England 2005/06. Available at:
http://www.ic.nhs.uk/webfiles/publications/qof/NationalQualityOutcomesFramework280906_PDF.pdf
6. The Health and Social Care Information Centre, National Quality and Outcomes Framework Statistics for
England 2004/05. Available at:
http://www.ic.nhs.uk/webfiles/publications/qof0405/QOF0405_Statistical_Bulletin.pdf
7. Ashworth M, Armstrong D. The relationship between general practice characteristics and quality of care: a
national survey of quality indicators used in the UK Quality and Outcomes Framework, 2004-5, BMC Family
Practice, London: Ashworth and Armstrong, 2006 7:68. Available at:
http://www.biomedcentral.com/1471-2296/7/68
8. Department of Health, Investing in General Practice. The New General Medical Services Contract. Available
at: http://www.dh.gov.uk/assetRoot/04/07/86/58/04078658.pdf
9. Eastern Region Public Health Observatory, The limitations of Quality and Outcomes Framework (QOF) data.
Briefing No. 3, 2005. Available at:
http://www.erpho.org.uk/Download/Public/12597/1/Briefing%2003%20The%20limitations%20of%20QOF%20d
ata.pdf
10. Austoker J. Cancer Prevention in Primary Care: Screening for cervical cancer. BMJ, 1994, 309:241-248.
Available at: http://www.bmj.com/cgi/content/full/309/6949/241
Updated: October 2010
259
Years of life lost due to mortality from cervical cancer
Purpose:
Years of life lost (YLL) is a measure of premature mortality. Its primary purpose is to compare the relative
importance of different causes of premature death within a particular population and it can therefore be used by
health planners to define priorities for the prevention of such deaths. It can also be used to compare the premature
mortality experience of different populations for a particular cause of death. The concept of years of life lost is to
estimate the length of time a person would have lived had they not died prematurely. By inherently including the
age at which the death occurs, rather than just the fact of its occurrence, the calculation is an attempt to better
quantify the burden, or impact, on society from the specified cause of mortality.
Definition of indicator and its variants:
Years of life lost due to mortality from cervical cancer (ICD-10 C53).
Statistic
Sex
Age group
Crude rate per 10,000
population and number of
years of life lost
Directly age-standardised rate
per 10,000 population and
number of deaths
F
<75
F
<75
Organisation
(see glossary)
Current
data
Trend
data
File-worksheet name
E&W, E, GOR,
ONS area, SHA,
LA, PCO, CTY
E&W, E, GOR,
ONS area, SHA,
LA, PCO, CTY
2006-08
17G_041CR_08_V1
2006-08
17G_041DR_08_V1
Numerator:
Numerator data – Years of life lost and deaths from cervical cancer classified by underlying cause of death (ICD10 C53), registered in the respective calendar year(s).
Source of numerator data – Office for National Statistics (ONS).
Comments on numerator data – The number of years of life lost is calculated by summing over ages 1 to 74 years
the number of deaths at each age multiplied by the number of years of life remaining up to age 75 years. Infant
deaths are omitted as they are mostly a result of causes specific to this age group and have different aetiologies to
deaths later in life.
The numerator presented alongside the sdirecgtly age-tandardised years of life lost rate is the number of deaths
rather than the number of years of life lost. This is because the standardisation calculation has been performed
using 5-year age bands. In each age band the number of deaths is weighted by the number of years of life
remaining from the mid-point of the age band up to age 75 years. See annex 3 for more details.
Mortality data for years 1993-2006 were extracted by ONS in June 2007 with organisational codes assigned using
the postcode of usual residence and the November 2006 edition of the National Statistics Postcode Directory
(NSPD). Data for subsequent years were extracted in June of the following year using the respective year’s
November edition of the NSPD.
In January 2001, the ONS implemented a change from ICD-9 to ICD-10 for coding causes of death in England &
Wales. As part of an exercise to investigate the effects of this change, the ONS also re-coded all deaths registered
in 1999. Deaths for years prior to 1999 and for year 2000 have not been re-coded.
For current analysis, therefore, all data are based on ICD-10.
From the 2003 Compendium onwards, data are based on the original causes of death rather than the final causes
used in earlier Compendia.
See Annex 2 for more details.
Denominator:
Denominator data - 2001 Census based mid-year population estimates for the respective calendar years.
Source of denominator data - ONS.
Comments on denominator data - Data are based on the latest revisions of ONS mid-year population estimates for
the respective years, current as at 1 October 2009.
260
Statistical methods:
Annex 2: Changes to Office for National Statistics mortality data
Annex 3: Explanations of statistical methods used in the Compendium
Annex 5: European Standard Population
Interpretation of indicators:
Quality of indicator - Annex 12 describes the criteria that should be used to judge the quality of this indicator. The
application of the criteria is dependent on the context (e.g. describing a single organisation, comparing several
organisations) and the level (e.g. national / regional with large numbers of events, local with small numbers of
events) at which the data are to be used.
Further reading:
1.
2.
3.
4.
5.
6.
7.
8.
Department of Health. The NHS cancer plan and the new NHS: Providing a patient-centred service. London:
Department of Health, 2004.
Brock A, Griffiths C. Trends in the mortality of young adults aged 15-44 in England and Wales, 1961-2001.
Office for National Statistics Health Statistics Quarterly, No. 19, 2003: 22-31. Available at:
http://www.statistics.gov.uk/downloads/theme_health/HSQ19.pdf
World Health Organization. WHO Framework on Tobacco Control. Geneva: World Health Organization, 2003.
Available at: http://www.who.int/tobacco/fctc/text/en/fctc_en.pdf
Department of Health. NHS Cancer Plan. London: Department of Health, 2000.
NHS. Manual of Cancer Services Standards. London: NHS Executive, 2000.
Department of Health. Saving lives: Our Healthier Nation. London: The Stationery Office, 1999.
World Bank. Economics of Tobacco Control. Washington: World Bank, 1999. Available at:
http://www1.worldbank.org/tobacco/book/pdf/tobacco.pdf
Department of Health. Smoking kills – a White Paper on tobacco. London: The Stationery Office, 1998.
Updated: December 2009
261
Incidence of colorectal cancer
Purpose:
To reduce the incidence of colorectal cancer.
Definition of indicator and its variants:
Registrations for colorectal cancer (ICD-10 C17-C21 equivalent to ICD-9 152-154).
Statistic
Indirectly age-standardised
registration ratio (SRR) and
number of registrations
Directly age-standardised
registration rate and number of
registrations
Sex
Age group
Organisation
(see glossary)
Current
data
MFP All ages
<75
E&W, E, GOR, ONS
area, SHA, LA, PCO
2004-06
All ages
MFP All ages
<75
All ages
E&W, E, GOR, ONS
area, SHA, LA, PCO
2004-06
Trend
data
File-worksheet name
13A_046SR00++_06_V1
13A_046SR0074_06_V1
1993-06
1993-06
13A_046SRT00++_06_V1
13A_046DR00++_06_V1
13A_046DR0074_06_V1
13A_046DRT00++_06_V1
Numerator:
Numerator data - Cancer registrations for colorectal cancer (ICD-10 C17-C21, ICD-9 152-154) in the respective
calendar years.
Source of numerator data - Regional Cancer Registries and Office for National Statistics (ONS).
Comments on numerator data - Registration data for years 1993-2005 were extracted by ONS in November 2008.
Data for 2006 are as registered by the end of September 2008. For all data organisational codes were assigned
using the postcode of usual residence and the August 2008 edition of the National Statistics Postcode Directory.
Results in the current Compendium may differ from those of previous issues because of changes in methodology
to extract data by area, and also because of data enhancements by ONS. Cancer registrations are also
continuously being updated retrospectively and ONS records may have been updated since previous analyses.
Denominator:
Denominator data - 2001 Census based mid-year population estimates for the respective calendar years.
Source of denominator data - ONS.
Comments on denominator data - Data are based on the latest revisions of ONS mid-year population estimates for
the respective years, current as at 29 September 2008.
Statistical methods:
Annex 3: Explanations of statistical methods used in the Compendium
Interpretation of indicators:
Quality of indicator - Annex 12 describes the criteria that should be used to judge the quality of this indicator. The
application of the criteria is dependent on the context (e.g. describing a single organisation, comparing several
organisations) and the level (e.g. national / regional with large numbers of events, local with small numbers of
events) at which the data are to be used.
Further reading:
1.
2.
3.
4.
5.
Anonymous. Advances in reducing colorectal cancer risk. Colorectal cancer is the third most common cancer
in women and the second leading cause of cancer death. These statistics belie how preventable this disease
really is. Harv Womens Health Watch 2003;10(9):1-2.
Urbach DR, Bell CM, Austin PC. Differences in operative mortality between high- and low-volume hospitals in
Ontario for 5 major surgical procedures: estimating the number of lives potentially saved through
regionalization. Cmaj 2003;168(11):1409-14.
Kuper H, Boffetta P, Adami H-O. Tobacco use and cancer causation: association by tumour type. J Intern Med
2002;252(3):206-224.
NHS. Improving Outcomes in Colorectal Cancer - The Research Evidence. Department of Health, 2001.
NHS. Improving Outcomes in Colorectal Cancer - The Manual. London: Department of Health, 1997
262
Updated: May 2009
263
Mortality from colorectal cancer
Purpose:
To reduce deaths from colorectal cancer.
Definition of indicator and its variants:
Mortality from colorectal cancer (ICD-10 C17-C21 equivalent to ICD-9 152-154).
Statistic
Number of deaths
Average age-specific death
rate per 100,000 resident
population
Indirectly age-standardised
mortality ratio (SMR) and
number of deaths
Sex
Age group
MFP 1+, 1-4, 5-14,
15-34, 35-64,
65-74, 75+
MFP 1+, 1-4, 5-14,
15-34, 35-64,
65-74, 75+
F
All ages,
<75
Directly age-standardised
mortality rate per 100,000 and
number of deaths
F
All ages
All ages,
<75
Organisation
(see glossary)
Current
data
E&W, E, GOR,
ONS area, SHA,
LA, PCO, CTY
E&W, E, GOR,
ONS area, SHA,
LA, PCO, CTY
E&W, E, GOR,
ONS area, SHA,
LA, PCO, CTY
2008
13B_047NO_08_V1
2006-08
13B_047CR_08_V1
2006-08
13B_047SM00++_08_V1
13B_047SM0074_08_V1
E&W, E, GOR,
ONS area, SHA,
LA, PCO, CTY
2006-08
All ages
Trend
data
File-worksheet name
1993-08 13B_047SMT00++_08_V1
13B_047DR00++_08_V1
13B_047DR0074_08_V1
1993-08 13B_047DRT00++_08_V1
Numerator:
Numerator data - Deaths from colorectal cancer, classified by underlying cause of death (ICD-10 C17-C21, ICD-9
152-154 adjusted), registered in the respective calendar year(s).
Source of numerator data - Office for National Statistics (ONS).
Comments on numerator data - Mortality data for years 1993-2006 were extracted by ONS in June 2007 with
organisational codes assigned using the postcode of usual residence and the November 2006 edition of the
National Statistics Postcode Directory (NSPD). Data for subsequent years were extracted in June of the following
year using the respective year’s November edition of the NSPD.
In January 2001, the ONS implemented a change from ICD-9 to ICD-10 for coding causes of death in England &
Wales. As part of an exercise to investigate the effects of this change, the ONS also re-coded all deaths registered
in 1999. Deaths for years prior to 1999 and for year 2000 have not been re-coded.
For current analysis, therefore, all data are based on ICD-10.
For trend analysis, the numbers of deaths observed in the years 1993-98 and 2000 must be adjusted to give
“expected” numbers of deaths which would have been coded to this cause in ICD-10. This is done by multiplying
the ICD-9 based death counts by the appropriate ICD-10/9 comparability ratio published by the ONS. Trend data
cannot include years prior to 1993, because the ONS introduced automated coding in 1993, and the comparability
ratios are only valid from this point onwards.
For this indicator the following ICD-10/9 comparability ratios were used:
Males
Females
0-74yrs: 1.008
0-74yrs: 0.999
75-84yrs: 1.007
75-84yrs: 1.017
85+yrs: 1.048
85+yrs: 1.033
Adjusted person counts are the sum of the adjusted male and female counts. Once adjusted, the counts are used
to calculate rates in the usual way.
From the 2003 Compendium onwards, data are based on the original causes of death rather than the final causes
used in earlier Compendia.
See Annex 2 for more details.
Denominator:
Denominator data - 2001 Census based mid-year population estimates for the respective calendar years.
264
Source of denominator data - ONS.
Comments on denominator data - Data are based on the latest revisions of ONS mid-year population estimates for
the respective years, current as at 1 October 2009.
Statistical methods:
Annex 2: Changes to Office for National Statistics mortality data
Annex 3: Explanations of statistical methods used in the Compendium
Interpretation of indicators:
Quality of indicator - Annex 12 describes the criteria that should be used to judge the quality of this indicator. The
application of the criteria is dependent on the context (e.g. describing a single organisation, comparing several
organisations) and the level (e.g. national / regional with large numbers of events, local with small numbers of
events) at which the data are to be used.
Further reading:
1.
2.
3.
4.
5.
6.
7.
8.
Department of Health. The NHS cancer plan and the new NHS: Providing a patient-centred service. London:
Department of Health, 2004.
World Health Organization. WHO Framework on Tobacco Control. Geneva: World Health Organization, 2003.
Available at: http://www.who.int/tobacco/fctc/text/en/fctc_en.pdf
NHS. Improving Outcomes in Colorectal Cancer The Research Evidence. NHS Executive, 2001.
Department of Health. NHS Cancer Plan. London: Department of Health, 2000.
NHS. Manual of Cancer Services Standards. London: NHS Executive, 2000.
Department of Health. Saving lives: Our Healthier Nation. London: The Stationery Office, 1999.
Department of Health. Smoking kills – a White Paper on tobacco. London: The Stationery Office, 1998.
NHS. Improving Outcomes in Colorectal Cancer The Manual. London: NHS Executive, 1997.
Updated: December 2009
265
Survival following diagnosis of colon cancer
Purpose:
To provide comparative measures of the outcome of cancer treatment by area of residence, using geographical
variations in cancer survival. Cancer survival is a key operational measure of the success of cancer treatment
services. The principle of equity of access to optimal standards of National Health Service (NHS) cancer treatment
was explicitly endorsed in the Calman-Hine report of 1995, which noted: "All patients should have access to a
uniformly high quality of care in the community or hospital wherever they may live to ensure the maximum possible
1
cure rates and best quality of life" . A further policy document stated that from April 1999, patients with suspected
breast cancer "will be able to see a specialist within two weeks of their GP deciding they need to be seen urgently,
2
and requesting an appointment" . Similar commitments have come into force for other cancers since April 2000.
These policies are expected to lead to earlier diagnosis for all patients and more equitable access to treatment.
The NHS Cancer Plan extended these commitments to improve cancer survival in England to amongst the best in
3
Europe . Cancer survival rates are outcome measures that can form part of the baseline for monitoring the future
impact of these policies. Geographic differences in cancer survival are expected to decline over time if policy goals
are achieved.
Definition of indicator and its variants:
Relative survival rate at one and five years after diagnosis for patients diagnosed in England during 2001-03 and
followed up to the end of the year 2008. Cancer patients have higher mortality than the general population, but
they do not all die of cancer. The relative survival rate is the ratio of the survival rate actually observed among the
cancer patients and the survival rate that would have been expected if they had only had the same overall
mortality rates as the general population. Thus, if five-year survival is 60% among a group of cancer patients of
whom 90% would have been expected to survive that long, the relative survival is 67% (60/90). By convention,
relative survival is described as a rate, although strictly it is a ratio of two percentages.
Statistic
Number and one-year relative
survival rate (%)
Number and five-year relative
survival rate (%)
Sex
Age group
Organisation
(see glossary)
Current
data
Trend
data
File-worksheet name
MFP 15-99
E, GOR, SHA, CN
2001-03
13C_410PCP1_03_V1
MFP 15-99
E, GOR, SHA, CN
2001-03
13C_410PCP2_03_V1
Numerator:
Numerator data - Observed survival rate, derived from the distribution of survival times from the date of diagnosis
(of a primary, invasive, malignant neoplasm) to the earliest date among the date of death, the date of emigration,
and the cut-off date of follow-up (31 December 2008), for cancer patients who were diagnosed during 2001-03 and
resident in England at the time of diagnosis. Analyses published prior to the July 2009 Compendium release
include only first primary malignancies. From the July 2009 release onwards, higher order primary malignancies
are also retained. The geographical area of each patient is defined by residence at the time of diagnosis. Records
with faulty data, and those of patients diagnosed with in situ tumours, tumours uncertain as to whether benign or
malignant, metastatic, or uncertain whether primary or metastatic, are excluded from analysis.
Source of numerator data - National Cancer Intelligence Centre (NCIC), Office for National Statistics (ONS)
derived from NHS regional cancer registries; National Health Service Central Register.
Comments on numerator data Denominator:
Denominator data - The expected survival rate among the cancer patients, derived from life tables specific for the
calendar year of death, single year of age, sex, Government Office Region of residence and deprivation.
Source of denominator data - Office for National Statistics (ONS).
Statistical methods:
The cumulative probability of death at a given time since diagnosis, relative to the corresponding probability in the
general population, is estimated by comparing the death rates among the cancer patients in successive intervals
4
of time since diagnosis with the all-causes death rate in the general population for the same sex and age group .
This is derived from life tables for the Government Office Region in which the patient lives. Life tables were
created that were specific for calendar year of death, single year of age, sex, Government Office Region and
deprivation. Life tables were constructed for the years 1991, 2001 and 2005 using ONS mid-year population
estimates and the mean annual number of deaths in the three years centred on those index years. Life tables for
266
the intervening years were then created by linear interpolation. The life tables for 2005 were used for years 2006
to 2008 without interpolation.
The relative survival rates for the pooled three-year time period have been directly age-standardised to take into
account any variation in relative survival by age. The standard population used is the number of persons who were
diagnosed with the particular cancer under consideration in England and Wales during the period 1986-90. These
were broken down into three age (at diagnosis) groups: 15-69, 70-79, and 80-99 years.
Male, female, and person relative survival rates are age-standardised using the same person standard population
and may therefore be compared against each other. Rates for different cancers, however, are standardised using
different standard populations, and in some instances different age groupings, and should therefore not be
compared.
Annex 3 of the Compendium User Guide: Explanations of statistical methods used in the Compendium.
Interpretation of indicators:
Type of Indicator - The relative survival rate can be interpreted as an estimate of the proportion of cancer patients
who die of their disease, after adjustment for death from other causes. A relative survival rate of 100% for a given
period would imply that the cancer patients had had the same survival (or death) rates as the general population,
not that they had all survived. Similarly, if the relative survival rate remains constant at (say) ten or more years
after diagnosis, this implies that the ten-year survivors no longer have higher mortality than the general population.
Quality of indicator - Annex 12 of the Compendium User Guide describes the criteria that should be used to judge
the quality of this indicator. The application of the criteria is dependent on the context (e.g. describing a single
organisation, comparing several organisations) and the level (e.g. national / regional with large numbers of events,
local with small numbers of events) at which the data are to be used.
Potential value of indicator:
Cancer survival is a broad indicator - differences may be due to a range of factors, of which the quality of
treatment is only one. Differences in cancer survival between geographical areas should therefore be the origin of
further enquiry, not the basis for simplistic conclusions about the efficacy of cancer treatment. The geographical
area of residence at cancer diagnosis is a proxy for several aspects of health care, including the quality of primary
care, the speed of referral and the quality of treatment services. It may also be a proxy for other factors, not readily
measured, such as the degree of understanding of cancer symptoms and what to do about them among the local
population, variations in the extent of disease at diagnosis (stage) and in the histology and grade of tumours, and
artefacts in the data. If geographical survival differences can be attributed to differences in knowledge of cancer or
the extent of disease at diagnosis, public health responses could be organised. Differences in cancer survival
between geographical areas may also "turn out to be due to the persistence of outmoded practices, or other
remediable deficiencies in service provision or therapeutic regimes, and correcting these should lead to an
5
improvement in overall standards of care" .
Further reading:
A comprehensive monograph on cancer survival in England and Wales has been published6, covering 2.9 million
patients diagnosed with one of 47 adult cancers and 11 childhood cancers during 1971-90, and followed up to the
end of 1995. It includes comprehensive analyses by age, sex, and NHS Region, and by socio-economic status (in
five categories from affluent to deprived). Updated results for England and Wales have been published in 2004
and 2008 with a chapter for each of the 21 most common cancers. 7, 8 More limited analyses have also been
published for cancer patients diagnosed during 1991-93 and followed up to 1998, and diagnosed during 1993-95
and followed up to 2000. 9, 10 Five-year age-standardised relative survival rates for 21 major cancers based on
11
diagnoses in five year periods between 1998 and 2007 are available on the National Statistics website. An early
12
assessment of the impact of the NHS National Cancer Plan on relative survival has been published. An all13
cancer relative survival index for patients diagnosed 1991-2006 has been presented by PCT in England. Cancer
survival by Cancer Network has been presented for patients diagnosed with one of six cancers 1991-2006.13
1.
2.
3.
4.
5.
6.
Expert Advisory Group on Cancer. A policy framework for commissioning cancer services. London:
Department of Health, 1995.
NHS Executive. The new NHS. Modern. Dependable. London: Department of Health, 1997.
Department of Health. The NHS Cancer Plan: three-year progress report - maintaining the momentum.
London: Department of Health, 2003.
Estève J, Benhamou E, Croasdale M, Raymond L. Relative survival and the estimation of net survival:
elements for further discussion. Stat Med 1990; 9: 529-38.
Clinical Outcomes Working Group. Clinical outcome indicators, July 1996. Edinburgh: The Scottish Office,
1996.
Coleman M.P, Babb P, Damiecki P, Grosclaude P, Honjo S, Jones J et al. Cancer survival trends in England
and Wales 1971-1995: deprivation and NHS Region. Series SMPS No.61. London: The Stationery Office,
1999, 1-695.
267
7.
8.
9.
10.
11.
12.
13.
Coleman M.P, Rachet B, Woods L.M, Mitry E, Riga M, Cooper N et al. Trends and socioeconomic inequalities
in cancer survival in England and Wales up to 2001. British Journal of Cancer 2004; 90:1367-1373.
Mitry E, Rachet B, Quinn M.J, Cooper N, Coleman M.P. Survival from cancer of the colon in England & Wales
up to 2001. British Journal of Cancer 2008; 99:S26-S29.
Coleman M.P, Babb P, Harris S, Quinn M.J, Sloggett A, De Stavola B.L. Cancer survival in England and
Wales, 1991-1998. Office for National Statistics Health Statistics Quarterly 2000; 6: 71-80.
Office for National Statistics. Cancer survival in the health authorities of England,1993-2000. Report. Office for
National Statistics Health Statistics Quarterly 2002;13: 95-103.
Office for National Statistics. Survival Rates in England and Wales, 1998-2001, 1999-2002, 1999-03; Survival
Rates in England 2000-04, 2001-06. National Statistics website. Available at:
http://www.statistics.gov.uk/StatBase/Product.asp?vlnk=14007&Pos=3&ColRank=1&Rank=422 , accessed 16
September 2010.
Rachet B, Maringe C, Nur U, Quaresma M, Shah A, Woods LM, et al. Population-based cancer survival trends
in England and Wales up to 2007: an assessment of the NHS cancer plan for England. Lancet Oncol
2009;10:351-69.
Office for National Statistics. Cancer survival by cancer network, patients diagnosed 1991-2006, followed up to
2007. National Statistics website. Available at:
http://www.statistics.gov.uk/STATBASE/Product.asp?vlnk=15387. Accessed 15 September 2010.
Updated: October 2010
268
Deaths at home from colorectal cancer
Purpose:
To improve palliative care and service planning for cancer patients in the terminal stages of life, allowing more of
them the choice of dying at home.
Definition of indicator and its variants:
The proportion of deaths from colorectal cancer (ICD-10 C17-C21) that occur at home.
Statistic
Sex
Age group
Percent of deaths at home
MFP All ages
Indirectly age-standardised
deaths at home rate per 100
deaths and number of deaths
at home
MFP All ages
Organisation
(see glossary)
Current
data
E&W, E, GOR, ONS 2006-08
area, SHA, LA,
PCO, CTY
E&W, E, GOR, ONS 2006-08
area, SHA, LA,
PCO, CTY
Trend
data
File-worksheet name
13D_193PC_08_V1
13D_193ISR_08_V1
Numerator:
Numerator data - Deaths at home from colorectal cancer, classified by underlying cause of death (ICD-10 C17C21), registered in the respective calendar year(s).
Source of numerator data - Office for National Statistics (ONS).
Comments on numerator data - Mortality data for years 1993-2006 were extracted by ONS in June 2007 with
organisational codes assigned using the postcode of usual residence and the November 2006 edition of the
National Statistics Postcode Directory (NSPD). Data for subsequent years were extracted in June of the following
year using the respective year’s November edition of the NSPD.
Information about the place of death is found on the mortality record in the communal establishment field. It
contains one of:
•
•
•
a 5 digit code identifying a communal establishment or institution (e.g. hospital, nursing home, residential
home);
an “H” code which indicates that the person is certified as having died at their home address and that this
is not a communal establishment or;
an “E” code which indicates that the person died elsewhere.
The communal establishments are themselves classified into 84 categories (e.g. general hospital, mental nursing
home, nursing home etc) and can be further distinguished by whether they are an NHS or Non-NHS
establishment.
It is currently ONS practice to include nursing homes with hospitals under a broader group - “Other hospitals and
communal establishments for the care of the sick” - and also to include residential homes under “Other communal
establishments”. This is because of concerns highlighted by the ONS regarding the accuracy of the recorded
status of some communal establishments, particularly nursing homes and residential homes.
It is therefore not possible to include nursing home or residential home deaths as a “home” death. For this
indicator, a “home” death is defined as one that has the ”H” code in the communal establishment field, i.e. where
the death has occurred at the home address and that address is not of a communal establishment.
Denominator:
Denominator data - All deaths from colorectal cancer, classified by underlying cause of death (ICD-10 C17-C21),
registered in the respective calendar year(s).
Source of denominator data - ONS.
Comments on denominator data - Includes deaths in all categories of communal establishment code, i.e. deaths in
all communal establishments, at home, and elsewhere.
From the 2003 Compendium onwards, data are based on the original causes of death rather than the final causes
used in earlier Compendia. See Annex 2 for more details.
269
Statistical methods:
The age-standardised deaths at home rate utilises the indirect method of standardisation. The direct method was
found not to be robust as it was affected by small numerator and denominator counts in specific age groups.
Indirect standardisation requires the computation of the ratio of an area’s observed number of events to its
expected number of events if it had experienced the standard age-specific rates. This age-standardised ratio can
be converted into a rate by multiplying it by the crude rate of the standard population.
The standard rates used are those of England for the respective calendar year(s). Male and female rates have
been standardised separately. The rate for persons is standardised for both age and sex.
This methodology is similar to that used for the Clinical Indicators and is described in detail in:
Annex 3: Explanations of statistical methods used in the Compendium (under the sections entitled “Indirectly
Standardised Rates For Clinical Indicators” and “Confidence Intervals Of Indirectly Standardised Rates For Clinical
Indicators”).
Interpretation of indicators:
Type of Indicator - This is a condition-specific cross-sectional comparative indicator reflecting events which act as
a proxy for outcome (quality of dying). In the absence of an absolute standard, comparative data are useful for
monitoring in relation to rates achieved in comparable areas.
Quality of indicator - Annex 12 describes the criteria that should be used to judge the quality of this indicator. The
application of the criteria is dependent on the context (e.g. describing a single organisation, comparing several
organisations) and the level (e.g. national / regional with large numbers of events, local with small numbers of
events) at which the data are to be used.
Confidence Intervals - 95%. Some of the values and factors influencing them may be chance occurrences, with
values fluctuating at random between organisations and from year to year. Numbers of deaths may be small at
individual organisational level. The results should therefore be interpreted with caution and with the aid of
confidence intervals. The 95% confidence interval provides a measure of the statistical precision of the rate for an
area or institution. It indicates a range which, with 95% probability, will contain the underlying value of the
indicator. If the confidence interval for an organisation’s rate is outside the range of the national confidence
intervals, the difference between the two rates is considered statistically significant. If the confidence intervals for
two rates overlap, in most cases the difference between the rates would not be considered statistically significant.
Effect of Case-Mix / severity - Severity of the cancer and need for hospital care have implications for those who
wish to die at home being able to do so. The data available do not allow adjustment for these factors.
Other Potential Confounding Factors - A number of factors outside the control of the NHS such as personal
choice, availability of hospices, and family/community support may contribute to the variation shown by the
indicator.
Relevant National initiatives:
1.
2.
3.
4.
Department of Health. End of life care strategy : Promoting high quality care for all adults at the end of life.
London: Department of Health , 2008.
http://www.dh.gov.uk/en/Publicationsandstatistics/Publications/PublicationsPolicyAndGuidance/DH_086277
Department of Health. The NHS cancer plan and the new NHS: Providing a patient-centred service. London:
Department of Health, 2004.
Department of Health. Pioneering Schemes Named Best of the Best. NHS Beacons – Part of a Concerted
Campaign to Improve Cancer Services. Department of Health, 1999. Press release: reference 1999/0375
Commission for Health Improvement. NHS Cancer Care in England and Wales. National Service Framework
Assessments No.1. London: Commission for Health Improvement, 2001.
Further reading:
1.
2.
3.
Higginson I.J, Thompson M. Children and young people who die from cancer: epidemiology and place of
death in England (1995-9). British Medical Journal 2003; 327: 478-479.
Grande GE, Todd CJ, Barclay SIG, Farquhar MC. Does hospital at home for palliative care facilitate death at
home? Randomised controlled trial. British Medical Journal 1999; 319: 1472-1475.
Higginson I.J, Jarman B, Astin P, Dolan S. Do social factors affect where patients die: an analysis of 10 years
of cancer deaths in England. Journal of Public Health Medicine 1999; 21(1): 23-28.
Updated: December 2009
270
Years of life lost due to mortality from colorectal cancer
Purpose:
Years of life lost (YLL) is a measure of premature mortality. Its primary purpose is to compare the relative
importance of different causes of premature death within a particular population and it can therefore be used by
health planners to define priorities for the prevention of such deaths. It can also be used to compare the premature
mortality experience of different populations for a particular cause of death. The concept of years of life lost is to
estimate the length of time a person would have lived had they not died prematurely. By inherently including the
age at which the death occurs, rather than just the fact of its occurrence, the calculation is an attempt to better
quantify the burden, or impact, on society from the specified cause of mortality.
Definition of indicator and its variants:
Years of life lost due to mortality from colorectal cancer (ICD-10 C17-C21).
Statistic
Crude rate per 10,000
population and number of
years of life lost
Directly age-standardised rate
per 10,000 population and
number of deaths
Sex
Age group
MFP <75
MFP <75
Organisation
(see glossary)
Current
data
Trend
data
File-worksheet name
E&W, E, GOR,
ONS area, SHA,
LA, PCO, CTY
E&W, E, GOR,
ONS area, SHA,
LA, PCO, CTY
2006-08
13F_042CR_08_V1
2006-08
13F_042DR_08_V1
Numerator:
Numerator data – Years of life lost and deaths from colorectal cancer classified by underlying cause of death (ICD10 C17-C21), registered in the respective calendar year(s).
Source of numerator data – Office for National Statistics (ONS).
Comments on numerator data – The number of years of life lost is calculated by summing over ages 1 to 74 years
the number of deaths at each age multiplied by the number of years of life remaining up to age 75 years. Infant
deaths are omitted as they are mostly a result of causes specific to this age group and have different aetiologies to
deaths later in life.
The numerator presented alongside the sdirecgtly age-tandardised years of life lost rate is the number of deaths
rather than the number of years of life lost. This is because the standardisation calculation has been performed
using 5-year age bands. In each age band the number of deaths is weighted by the number of years of life
remaining from the mid-point of the age band up to age 75 years. See annex 3 for more details.
Mortality data for years 1993-2006 were extracted by ONS in June 2007 with organisational codes assigned using
the postcode of usual residence and the November 2006 edition of the National Statistics Postcode Directory
(NSPD). Data for subsequent years were extracted in June of the following year using the respective year’s
November edition of the NSPD.
In January 2001, the ONS implemented a change from ICD-9 to ICD-10 for coding causes of death in England &
Wales. As part of an exercise to investigate the effects of this change, the ONS also re-coded all deaths registered
in 1999. Deaths for years prior to 1999 and for year 2000 have not been re-coded.
For current analysis, therefore, all data are based on ICD-10.
From the 2003 Compendium onwards, data are based on the original causes of death rather than the final causes
used in earlier Compendia.
See Annex 2 for more details.
Denominator:
Denominator data - 2001 Census based mid-year population estimates for the respective calendar years.
Source of denominator data - ONS.
Comments on denominator data - Data are based on the latest revisions of ONS mid-year population estimates for
the respective years, current as at 1 October 2009.
271
Statistical methods:
Annex 2: Changes to Office for National Statistics mortality data
Annex 3: Explanations of statistical methods used in the Compendium
Annex 5: European Standard Population
Interpretation of indicators:
Quality of indicator - Annex 12 describes the criteria that should be used to judge the quality of this indicator. The
application of the criteria is dependent on the context (e.g. describing a single organisation, comparing several
organisations) and the level (e.g. national / regional with large numbers of events, local with small numbers of
events) at which the data are to be used.
Further reading:
1.
2.
3.
4.
5.
6.
7.
8.
Department of Health. The NHS cancer plan and the new NHS: Providing a patient-centred service. London:
Department of Health, 2004.
World Health Organization. WHO Framework on Tobacco Control. Geneva: World Health Organization, 2003.
Available at: http://www.who.int/tobacco/fctc/text/en/fctc_en.pdf
NHS. Improving Outcomes in Colorectal Cancer The Research Evidence. NHS Executive, 2001.
Department of Health. NHS Cancer Plan. London: Department of Health, 2000.
NHS. Manual of Cancer Services Standards. London: NHS Executive, 2000.
Department of Health. Saving lives: Our Healthier Nation. London: The Stationery Office, 1999.
Department of Health. Smoking kills – a White Paper on tobacco. London: The Stationery Office, 1998.
NHS. Improving Outcomes in Colorectal Cancer The Manual. London: NHS Executive, 1997.
Updated: December 2009
272
Mortality from Hodgkin's disease
Purpose:
To reduce deaths from Hodgkin’s disease.
Definition of indicator and its variants:
Mortality from Hodgkin’s disease (ICD-10 C81 equivalent to ICD-9 201).
Statistic
Number of deaths
Average age-specific death
rate per 100,000 resident
population
Indirectly age-standardised
mortality ratio (SMR) and
number of deaths
Sex
Age group
MFP 1+, 1-4, 5-14,
15-34, 35-64,
65-74, 75+
MFP 1+, 1-4, 5-14,
15-34, 35-64,
65-74, 75+
F
All ages,
<75,
5-64
Directly age-standardised
mortality rate per 100,000 and
number of deaths
F
All ages
All ages,
<75,
5-64
Organisation
(see glossary)
Current
data
E&W, E, GOR,
ONS area, SHA,
LA, PCO, CTY
E&W, E, GOR,
ONS area, SHA,
LA, PCO, CTY
E&W, E, GOR,
ONS area, SHA,
LA, PCO, CTY
2008
20A_078NO_08_V1
2006-08
20A_078CR_08_V1
2006-08
20A_078SM00++_08_V1
20A_078SM0074_08_V1
20A_078SM0564_08_V1
E&W, E, GOR,
ONS area, SHA,
LA, PCO, CTY
All ages
2006-08
Trend
data
File-worksheet name
1993-08 20A_078SMT00++_08_V1
20A_078DR00++_08_V1
20A_078DR0074_08_V1
20A_078DR0564_08_V1
1993-08 20A_078DRT00++_08_V1
Numerator:
Numerator data - Deaths from Hodgkin’s disease, classified by underlying cause of death (ICD-10 C81, ICD-9 201
adjusted), registered in the respective calendar year(s).
Source of numerator data - Office for National Statistics (ONS).
Comments on numerator data - Mortality data for years 1993-2006 were extracted by ONS in June 2007 with
organisational codes assigned using the postcode of usual residence and the November 2006 edition of the
National Statistics Postcode Directory (NSPD). Data for subsequent years were extracted in June of the following
year using the respective year’s November edition of the NSPD.
In January 2001, the ONS implemented a change from ICD-9 to ICD-10 for coding causes of death in England &
Wales. As part of an exercise to investigate the effects of this change, the ONS also re-coded all deaths registered
in 1999. Deaths for years prior to 1999 and for year 2000 have not been re-coded.
For current analysis, therefore, all data are based on ICD-10.
For trend analysis, the numbers of deaths observed in the years 1993-98 and 2000 must be adjusted to give
“expected” numbers of deaths which would have been coded to this cause in ICD-10. This is done by multiplying
the ICD-9 based death counts by the appropriate ICD-10/9 comparability ratio published by the Office for National
Statistics. Trend data cannot include years prior to 1993, because the Office for National Statistics introduced
automated coding in 1993, and the comparability ratios are only valid from this point onwards.
For this indicator the following ICD-10/9 comparability ratios were used:
Males
Females
All Ages: 1
All Ages: 1.079
Adjusted person counts are the sum of the adjusted male and female counts. Once adjusted, the counts are used
to calculate rates in the usual way.
From the 2003 Compendium onwards, data are based on the original causes of death rather than the final causes
used in earlier Compendia.
See Annex 2 for more details.
273
Denominator:
Denominator data - 2001 Census based mid-year population estimates for the respective calendar years.
Source of denominator data - ONS.
Comments on denominator data - Data are based on the latest revisions of ONS mid-year population estimates for
the respective years, current as at 1 October 2009.
Statistical methods:
Annex 2: Changes to Office for National Statistics mortality data
Annex 3: Explanations of statistical methods used in the Compendium
Annex 5: European Standard Population
Interpretation of indicators:
Quality of indicator - Annex 12 describes the criteria that should be used to judge the quality of this indicator. The
application of the criteria is dependent on the context (e.g. describing a single organisation, comparing several
organisations) and the level (e.g. national / regional with large numbers of events, local with small numbers of
events) at which the data are to be used.
Further reading:
1.
2.
3.
4.
5.
Department of Health Cancer pages. Available at:
http://www.dh.gov.uk/PolicyAndGuidance/HealthAndSocialCareTopics/Cancer/fs/en
Department of Health. The NHS cancer plan and the new NHS: Providing a patient-centred service. London:
Department of Health, 2004.
Department of Health. NHS Cancer Plan. London: Department of Health, 2000.
NHS Executive. Manual of Cancer Services Standards. London: NHS Executive, 2000.
Department of Health. Saving lives: Our Healthier Nation. London: The Stationery Office, 1999.
Updated: December 2009
274
Years of life lost due to mortality from Hodgkin's disease
Purpose:
Years of life lost (YLL) is a measure of premature mortality. Its primary purpose is to compare the relative
importance of different causes of premature death within a particular population and it can therefore be used by
health planners to define priorities for the prevention of such deaths. It can also be used to compare the premature
mortality experience of different populations for a particular cause of death. The concept of years of life lost is to
estimate the length of time a person would have lived had they not died prematurely. By inherently including the
age at which the death occurs, rather than just the fact of its occurrence, the calculation is an attempt to better
quantify the burden, or impact, on society from the specified cause of mortality.
Definition of indicator and its variants:
Years of life lost due to mortality from Hodgkin's disease (ICD-10 C81).
Statistic
Crude rate per 10,000
population and number of
years of life lost
Directly age-standardised rate
per 10,000 population and
number of deaths
Sex
Age group
MFP <75
MFP <75
Organisation
(see glossary)
Current
data
Trend
data
File-worksheet name
E&W, E, GOR,
ONS area, SHA,
LA, PCO, CTY
E&W, E, GOR,
ONS area, SHA,
LA, PCO, CTY
2006-08
20B_048CR_08_V1
2006-08
20B_048DR_08_V1
Numerator:
Numerator data – Years of life lost and deaths from Hodgkin's disease classified by underlying cause of death
(ICD-10 C81), registered in the respective calendar year(s).
Source of numerator data – Office for National Statistics (ONS).
Comments on numerator data – The number of years of life lost is calculated by summing over ages 1 to 74 years
the number of deaths at each age multiplied by the number of years of life remaining up to age 75 years. Infant
deaths are omitted as they are mostly a result of causes specific to this age group and have different aetiologies to
deaths later in life.
The numerator presented alongside the sdirecgtly age-tandardised years of life lost rate is the number of deaths
rather than the number of years of life lost. This is because the standardisation calculation has been performed
using 5-year age bands. In each age band the number of deaths is weighted by the number of years of life
remaining from the mid-point of the age band up to age 75 years. See annex 3 for more details.
Mortality data for years 1993-2006 were extracted by ONS in June 2007 with organisational codes assigned using
the postcode of usual residence and the November 2006 edition of the National Statistics Postcode Directory
(NSPD). Data for subsequent years were extracted in June of the following year using the respective year’s
November edition of the NSPD.
In January 2001, the ONS implemented a change from ICD-9 to ICD-10 for coding causes of death in England &
Wales. As part of an exercise to investigate the effects of this change, the ONS also re-coded all deaths registered
in 1999. Deaths for years prior to 1999 and for year 2000 have not been re-coded.
For current analysis, therefore, all data are based on ICD-10.
From the 2003 Compendium onwards, data are based on the original causes of death rather than the final causes
used in earlier Compendia.
See Annex 2 for more details.
Denominator:
Denominator data - 2001 Census based mid-year population estimates for the respective calendar years.
Source of denominator data - ONS.
Comments on denominator data - Data are based on the latest revisions of ONS mid-year population estimates for
the respective years, current as at 1 October 2009.
275
Statistical methods:
Annex 2: Changes to Office for National Statistics mortality data
Annex 3: Explanations of statistical methods used in the Compendium
Annex 5: European Standard Population
Interpretation of indicators:
Quality of indicator - Annex 12 describes the criteria that should be used to judge the quality of this indicator. The
application of the criteria is dependent on the context (e.g. describing a single organisation, comparing several
organisations) and the level (e.g. national / regional with large numbers of events, local with small numbers of
events) at which the data are to be used.
Further reading:
1.
2.
3.
4.
5.
Department of Health Cancer pages. Available at:
http://www.dh.gov.uk/PolicyAndGuidance/HealthAndSocialCareTopics/Cancer/fs/en
Department of Health. The NHS cancer plan and the new NHS: Providing a patient-centred service. London:
Department of Health, 2004.
Department of Health. NHS Cancer Plan. London: Department of Health, 2000.
NHS Executive. Manual of Cancer Services Standards. London: NHS Executive, 2000.
Department of Health. Saving lives: Our Healthier Nation. London: The Stationery Office, 1999.
Updated: December 2009
276
Mortality from leukaemia
Purpose:
To reduce deaths from leukaemia.
Definition of indicator and its variants:
Mortality from leukaemia (ICD-10 C91-C95 equivalent to ICD-9 204-208).
Statistic
Number of deaths
Average age-specific death
rate per 100,000 resident
population
Indirectly age-standardised
mortality ratio (SMR) and
number of deaths
Sex
Age group
MFP 1+, 1-4, 5-14,
15-34, 35-64,
65-74, 75+
MFP 1+, 1-4, 5-14,
15-34, 35-64,
65-74, 75+
F
All ages,
<75
Directly age-standardised
mortality rate per 100,000 and
number of deaths
F
All ages
All ages,
<75
Organisation
(see glossary)
Current
data
E&W, E, GOR,
ONS area, SHA,
LA, PCO, CTY
E&W, E, GOR,
ONS area, SHA,
LA, PCO, CTY
E&W, E, GOR,
ONS area, SHA,
LA, PCO, CTY
2008
21A_103NO_08_V1
2006-08
21A_103CR_08_V1
2006-08
21A_103SM00++_08_V1
21A_103SM0074_08_V1
E&W, E, GOR,
ONS area, SHA,
LA, PCO, CTY
All ages
2006-08
Trend
data
File-worksheet name
1993-08 21A_103SMT00++_08_V1
21A_103DR00++_08_V1
21A_103DR0074_08_V1
1993-08 21A_103DRT00++_08_V1
Numerator:
Numerator data - Deaths from leukaemia, classified by underlying cause of death (ICD-10 C91-C95, ICD-9 204208 adjusted), registered in the respective calendar year(s).
Source of numerator data - Office for National Statistics (ONS).
Comments on numerator data - Mortality data for years 1993-2006 were extracted by ONS in June 2007 with
organisational codes assigned using the postcode of usual residence and the November 2006 edition of the
National Statistics Postcode Directory (NSPD). Data for subsequent years were extracted in June of the following
year using the respective year’s November edition of the NSPD.
In January 2001, the ONS implemented a change from ICD-9 to ICD-10 for coding causes of death in England &
Wales. As part of an exercise to investigate the effects of this change, the ONS also re-coded all deaths registered
in 1999. Deaths for years prior to 1999 and for year 2000 have not been re-coded.
For current analysis, therefore, all data are based on ICD-10.
For trend analysis, the numbers of deaths observed in the years 1993-98 and 2000 must be adjusted to give
“expected” numbers of deaths which would have been coded to this cause in ICD-10. This is done by multiplying
the ICD-9 based death counts by the appropriate ICD-10/9 comparability ratio published by the ONS. Trend data
cannot include years prior to 1993, because the ONS introduced automated coding in 1993, and the comparability
ratios are only valid from this point onwards.
For this indicator the following ICD-10/9 comparability ratios were used:
Males
Females
All Ages: 1.061
All Ages: 1.049
Adjusted person counts are the sum of the adjusted male and female counts. Once adjusted, the counts are used
to calculate rates in the usual way.
From the 2003 Compendium onwards, data are based on the original causes of death rather than the final causes
used in earlier Compendia.
See Annex 2 for more details.
Denominator:
Denominator data - 2001 Census based mid-year population estimates for the respective calendar years.
277
Source of denominator data - ONS.
Comments on denominator data - Data are based on the latest revisions of ONS mid-year population estimates for
the respective years, current as at 1 October 2009.
Statistical methods:
Annex 2: Changes to Office for National Statistics mortality data
Annex 3: Explanations of statistical methods used in the Compendium
Interpretation of indicators:
Quality of indicator - Annex 12 describes the criteria that should be used to judge the quality of this indicator. The
application of the criteria is dependent on the context (e.g. describing a single organisation, comparing several
organisations) and the level (e.g. national / regional with large numbers of events, local with small numbers of
events) at which the data are to be used.
Further reading:
1.
2.
3.
4.
5.
6.
7.
Department of Health. The NHS cancer plan and the new NHS: Providing a patient-centred service. London:
Department of Health, 2004.
World Health Organization. WHO Framework on Tobacco Control. Geneva: World Health Organization, 2003.
Available at: http://www.who.int/tobacco/fctc/text/en/fctc_en.pdf
NHS Executive. Manual of Cancer Services Standards. London: NHS Executive, 2000.
Department of Health. NHS Cancer Plan. London: Department of Health, 2000.
Department of Health. Saving lives: Our Healthier Nation. London: The Stationery Office, 1999.
World Bank. Economics of Tobacco Control. Washington: World Bank, 1999. Available at:
http://www1.worldbank.org/tobacco/book/pdf/tobacco.pdf
Department of Health. Smoking kills – a White Paper on tobacco. London: The Stationery Office, 1998.
Updated: December 2009
278
Years of life lost due to mortality from leukaemia
Purpose:
Years of life lost (YLL) is a measure of premature mortality. Its primary purpose is to compare the relative
importance of different causes of premature death within a particular population and it can therefore be used by
health planners to define priorities for the prevention of such deaths. It can also be used to compare the premature
mortality experience of different populations for a particular cause of death. The concept of years of life lost is to
estimate the length of time a person would have lived had they not died prematurely. By inherently including the
age at which the death occurs, rather than just the fact of its occurrence, the calculation is an attempt to better
quantify the burden, or impact, on society from the specified cause of mortality.
Definition of indicator and its variants:
Years of life lost due to mortality from leukaemia (ICD-10 C91-C95).
Statistic
Crude rate per 10,000
population and number of
years of life lost
Directly age-standardised rate
per 10,000 population and
number of deaths
Sex
Age group
MFP <75
MFP <75
Organisation
(see glossary)
Current
data
Trend
data
File-worksheet name
E&W, E, GOR,
ONS area, SHA,
LA, PCO, CTY
E&W, E, GOR,
ONS area, SHA,
LA, PCO, CTY
2006-08
21B_049CR_08_V1
2006-08
21B_049DR_08_V1
Numerator:
Numerator data – Years of life lost and deaths from leukaemia classified by underlying cause of death (ICD-10
C91-C95), registered in the respective calendar year(s).
Source of numerator data – Office for National Statistics (ONS).
Comments on numerator data – The number of years of life lost is calculated by summing over ages 1 to 74 years
the number of deaths at each age multiplied by the number of years of life remaining up to age 75 years. Infant
deaths are omitted as they are mostly a result of causes specific to this age group and have different aetiologies to
deaths later in life.
The numerator presented alongside the sdirecgtly age-tandardised years of life lost rate is the number of deaths
rather than the number of years of life lost. This is because the standardisation calculation has been performed
using 5-year age bands. In each age band the number of deaths is weighted by the number of years of life
remaining from the mid-point of the age band up to age 75 years. See annex 3 for more details.
Mortality data for years 1993-2006 were extracted by ONS in June 2007 with organisational codes assigned using
the postcode of usual residence and the November 2006 edition of the National Statistics Postcode Directory
(NSPD). Data for subsequent years were extracted in June of the following year using the respective year’s
November edition of the NSPD.
In January 2001, the ONS implemented a change from ICD-9 to ICD-10 for coding causes of death in England &
Wales. As part of an exercise to investigate the effects of this change, the ONS also re-coded all deaths registered
in 1999. Deaths for years prior to 1999 and for year 2000 have not been re-coded.
For current analysis, therefore, all data are based on ICD-10.
From the 2003 Compendium onwards, data are based on the original causes of death rather than the final causes
used in earlier Compendia.
See Annex 2 for more details.
Denominator:
Denominator data - 2001 Census based mid-year population estimates for the respective calendar years.
Source of denominator data - ONS.
Comments on denominator data - Data are based on the latest revisions of ONS mid-year population estimates for
the respective years, current as at 1 October 2009.
279
Statistical methods:
Annex 2: Changes to Office for National Statistics mortality data
Annex 3: Explanations of statistical methods used in the Compendium
Annex 5: European Standard Population
Interpretation of indicators:
Quality of indicator - Annex 12 describes the criteria that should be used to judge the quality of this indicator. The
application of the criteria is dependent on the context (e.g. describing a single organisation, comparing several
organisations) and the level (e.g. national / regional with large numbers of events, local with small numbers of
events) at which the data are to be used.
Further reading:
1.
2.
3.
4.
5.
6.
7.
Department of Health. The NHS cancer plan and the new NHS: Providing a patient-centred service. London:
Department of Health, 2004.
World Health Organization. WHO Framework on Tobacco Control. Geneva: World Health Organization, 2003.
Available at: http://www.who.int/tobacco/fctc/text/en/fctc_en.pdf
NHS Executive. Manual of Cancer Services Standards. London: NHS Executive, 2000.
Department of Health. NHS Cancer Plan. London: Department of Health, 2000.
Department of Health. Saving lives: Our Healthier Nation. London: The Stationery Office, 1999.
World Bank. Economics of Tobacco Control. Washington: World Bank, 1999. Available at:
http://www1.worldbank.org/tobacco/book/pdf/tobacco.pdf
Department of Health. Smoking kills – a White Paper on tobacco. London: The Stationery Office, 1998.
Updated: December 2009
280
Incidence of lung cancer
Purpose:
To reduce the incidence of lung cancer.
Definition of indicator and its variants:
Registrations for lung cancer (ICD-10 C33-C34 equivalent to ICD-9 162).
Statistic
Indirectly age-standardised
registration ratio (SRR) and
number of registrations
Directly age-standardised
registration rate and number of
registrations
Sex
Age group
Organisation
(see glossary)
Current
data
MFP All ages
<75
E&W, E, GOR, ONS 2004-06
area, SHA, LA, PCO
All ages
MFP All ages
<75
E&W, E, GOR, ONS 2004-06
area, SHA, LA, PCO
All ages
Trend
data
File-worksheet name
14A_104SR00++_06_V1
14A_104SR0074_06_V1
1993-06 14A_104SRT00++_06_V1
14A_104DR00++_06_V1
14A_104DR0074_06_V1
1993-06 14A_104DRT00++_06_V1
Numerator:
Numerator data - Cancer registrations for lung cancer (ICD-10 C33-C34, ICD-9 162) in the respective calendar
years.
Source of numerator data - Regional Cancer Registries and the Office for National Statistics (ONS).
Comments on numerator data - Registration data for years 1993-2005 were extracted by ONS in November 2008.
Data for 2006 are as registered by the end of September 2008. For all data organisational codes were assigned
using the postcode of usual residence and the August 2008 edition of the National Statistics Postcode Directory.
Results in the current Compendium may differ from those of previous issues because of changes in methodology
to extract data by area, and also because of data enhancements by ONS. Cancer registrations are also
continuously being updated retrospectively and ONS records may have been updated since previous analyses.
Denominator:
Denominator data - 2001 Census based mid-year population estimates for the respective calendar years.
Source of denominator data - ONS.
Comments on denominator data - Data are based on the latest revisions of ONS mid-year population estimates for
the respective years, current as at 29 September 2008.
Statistical methods:
Annex 3: Explanations of statistical methods used in the Compendium
Interpretation of indicators:
Quality of indicator - Annex 12 describes the criteria that should be used to judge the quality of this indicator. The
application of the criteria is dependent on the context (e.g. describing a single organisation, comparing several
organisations) and the level (e.g. national / regional with large numbers of events, local with small numbers of
events) at which the data are to be used.
Further reading:
1.
2.
3.
Department of Health. The NHS cancer plan and the new NHS: Providing a patient-centred service. London:
Department of Health, 2004.
Department of Health. Improving Outcomes in Lung Cancer - The Manual. London: Department of Health,
1998.
Department of Health. Improving Outcomes in Lung Cancer - The Research Evidence. London: Department of
Health, 1998.
Updated: May 2009
281
Mortality from lung cancer
Purpose:
To reduce deaths from lung cancer.
Definition of indicator and its variants:
Mortality from lung cancer (ICD-10 C33-C34 equivalent to ICD-9 162).
Statistic
Number of deaths
Average age-specific death
rate per 100,000 resident
population
Indirectly age-standardised
mortality ratio (SMR) and
number of deaths
Directly age-standardised
mortality rate per 100,000 and
number of deaths
Sex
Age group
MFP 1+, 1-4, 5-14,
15-34, 35-64,
65-74, 75+
MFP 1+, 1-4, 5-14,
15-34, 35-64,
65-74, 75+
MFP All ages,
<75
All ages
<75
MFP All ages,
<75
Organisation
(see glossary)
Current
data
E&W, E, GOR,
ONS area, SHA,
LA, PCO, CTY
E&W, E, GOR,
ONS area, SHA,
LA, PCO, CTY
E&W, E, GOR,
ONS area, SHA,
LA, PCO, CTY
2008
14B_105NO_08_V1
2006-08
14B_105CR_08_V1
2006-08
14B_105SM00++_08_V1
14B_105SM0074_08_V1
E&W, E, GOR,
ONS area, SHA,
LA, PCO, CTY
All ages
<75
2006-08
Trend
data
File-worksheet name
1993-08 14B_105SMT00++_08_V1
14B_105SMT0074_08_V1
14B_105DR00++_08_V1
14B_105DR0074_08_V1
1993-08 14B_105DRT00++_08_V1
14B_105DRT0074_08_V1
Numerator:
Numerator data - Deaths from lung cancer, classified by underlying cause of death (ICD-10 C33-C34, ICD-9 162
adjusted), registered in the respective calendar year(s).
Source of numerator data - Office for National Statistics (ONS).
Comments on numerator data - Mortality data for years 1993-2006 were extracted by ONS in June 2007 with
organisational codes assigned using the postcode of usual residence and the November 2006 edition of the
National Statistics Postcode Directory (NSPD). Data for subsequent years were extracted in June of the following
year using the respective year’s November edition of the NSPD.
The directly age-standardised mortality rates from lung cancer for men and women aged under 75 were target
indicators in the Health of the Nation (See “Further reading”).
In January 2001, the ONS implemented a change from ICD-9 to ICD-10 for coding causes of death in England &
Wales. As part of an exercise to investigate the effects of this change, the ONS also re-coded all deaths registered
in 1999. Deaths for years prior to 1999 and for year 2000 have not been re-coded.
For current analysis, therefore, all data are based on ICD-10.
For trend analysis, the numbers of deaths observed in the years 1993-98 and 2000 must be adjusted to give
“expected” numbers of deaths which would have been coded to this cause in ICD-10. This is done by multiplying
the ICD-9 based death counts by the appropriate ICD-10/9 comparability ratio published by the ONS. Trend data
cannot include years prior to 1993, because the ONS introduced automated coding in 1993, and the comparability
ratios are only valid from this point onwards.
For this indicator the following ICD-10/9 comparability ratios were used:
Males
Females
All Ages: 0.996
All Ages: 0.996
Adjusted person counts are the sum of the adjusted male and female counts. Once adjusted, the counts are used
to calculate rates in the usual way.
From the 2003 Compendium onwards, data are based on the original causes of death rather than the final causes
used in earlier Compendia.
282
See Annex 2 for more details.
Denominator:
Denominator data - 2001 Census based mid-year population estimates for the respective calendar years.
Source of denominator data - ONS.
Comments on denominator data - Data are based on the latest revisions of ONS mid-year population estimates for
the respective years, current as at 1 October 2009.
Statistical methods:
Annex 2: Changes to Office for National Statistics mortality data
Annex 3: Explanations of statistical methods used in the Compendium
Annex 5: European Standard Population
Annex 6: Goals of Our Healthier Nation
Interpretation of indicators:
Quality of indicator - Annex 12 describes the criteria that should be used to judge the quality of this indicator. The
application of the criteria is dependent on the context (e.g. describing a single organisation, comparing several
organisations) and the level (e.g. national / regional with large numbers of events, local with small numbers of
events) at which the data are to be used.
Further reading:
1.
2.
3.
4.
5.
6.
7.
8.
9.
World Health Organization. WHO Tobacco Free Initiative. Available at: http://www.who.int/tobacco/en/
World Health Organization. WHO Framework Convention on Tobacco Control. Geneva: World Health
Organization, 2003. Available at http://www.who.int/tobacco/fctc/text/en/fctc_en.pdf
Department of Health. The NHS cancer plan and the new NHS: Providing a patient-centred service. London:
Department of Health, 2004.
NHS Executive. Manual of Cancer Services Standards. London: NHS Executive, 2000.
Department of Health. NHS Cancer Plan. London: Department of Health, 2000.
World Bank. Economics of Tobacco Control. Wasthington: World Bank, 1999. Available at:
http://www1.worldbank.org/tobacco/book/pdf/tobacco.pdf
Department of Health. Saving lives: Our Healthier Nation. London: The Stationery Office, 1999.
Department of Health. Smoking kills – a White Paper on tobacco. London: The Stationery Office, 1998.
Department of Health. Health of the Nation - A Strategy for Health in England. London: Her Majesty’s
Stationery Office, 1992.
Updated: December 2009
283
Survival following diagnosis of lung cancer
Purpose:
To provide comparative measures of the outcome of cancer treatment by area of residence, using geographical
variations in cancer survival. Cancer survival is a key operational measure of the success of cancer treatment
services. The principle of equity of access to optimal standards of National Health Service (NHS) cancer treatment
was explicitly endorsed in the Calman-Hine report of 1995, which noted: "All patients should have access to a
uniformly high quality of care in the community or hospital wherever they may live to ensure the maximum possible
1
cure rates and best quality of life" . A further policy document stated that from April 1999, patients with suspected
breast cancer "will be able to see a specialist within two weeks of their GP deciding they need to be seen urgently,
2.
and requesting an appointment" Similar commitments have come into force for other cancers since April 2000.
These policies are expected to lead to earlier diagnosis for all patients and more equitable access to treatment.
The NHS Cancer Plan extended these commitments to improve cancer survival in England to amongst the best in
3
Europe . Cancer survival rates are outcome measures that can form part of the baseline for monitoring the future
impact of these policies. Geographic differences in cancer survival are expected to decline over time if policy goals
are achieved.
Definition of indicator and its variants:
Relative survival rate at one and five years after diagnosis for patients diagnosed in England during 2001-03 and
followed up to the end of the year 2008. Cancer patients have higher mortality than the general population, but
they do not all die of cancer. The relative survival rate is the ratio of the survival rate actually observed among the
cancer patients and the survival rate that would have been expected if they had only had the same overall
mortality rates as the general population. Thus if 5-year survival is 60% among a group of cancer patients of whom
90% would have been expected to survive that long, the relative survival is 67% (60/90). By convention, relative
survival is described as a rate, although strictly it is a ratio of two percentages.
Statistic
Number and one-year relative
survival rate (%)
Number and five-year relative
survival rate (%)
Sex
Age group
Organisation
(see glossary)
Current
data
Trend
data
File-worksheet name
MFP 15-99
E, GOR, SHA, CN
2001-03
14C_409PCP1_03_V1
MFP 15-99
E, GOR, SHA, CN
2001-03
14C_409PCP2_03_V1
Numerator:
Numerator data - Observed survival rate, derived from the distribution of survival times from the date of diagnosis
(of a primary, invasive, malignant neoplasm) to the earliest date among the date of death, the date of emigration,
and the cut-off date of follow-up (31 December 2008), for cancer patients who were diagnosed during 2001-03 and
resident in England at the time of diagnosis. Analyses published prior to the July 2009 Compendium release
include only first primary malignancies. From the July 2009 release onwards, higher order primary malignancies
are also retained. The geographical area of each patient is defined by residence at the time of diagnosis. Records
with faulty data, and those of patients diagnosed with in situ tumours, tumours uncertain as to whether benign or
malignant, metastatic, or uncertain whether primary or metastatic, are excluded from analysis.
Source of numerator data - National Cancer Intelligence Centre (NCIC), Office for National Statistics (ONS)
derived from NHS regional cancer registries; National Health Service Central Register.
Comments on numerator data Denominator:
Denominator data - The expected survival rate among the cancer patients, derived from life tables specific for the
calendar year of death, single year of age, sex, Government Office Region of residence and deprivation.
Source of denominator data - Office for National Statistics (ONS).
Statistical methods:
The cumulative probability of death at a given time since diagnosis, relative to the corresponding probability in the
general population, is estimated by comparing the death rates among the cancer patients in successive intervals
4
of time since diagnosis with the all-causes death rate in the general population for the same sex and age group .
This is derived from life tables for the Government Office Region in which the patient lives. Life tables were
created that were specific for calendar year of death, single year of age, sex, Government Office Region and
deprivation. Life tables were constructed for the years 1991, 2001 and 2005 using ONS mid-year population
estimates and the mean annual number of deaths in the three years centred on those index years. Life tables for
284
the intervening years were then created by linear interpolation. The life tables for 2005 were used for years 2006
to 2008 without interpolation.
The relative survival rates for the pooled three-year time period have been directly age-standardised to take into
account any variation in relative survival by age. The standard population used is the number of persons who were
diagnosed with the particular cancer under consideration in England and Wales during the period 1986-90. These
were broken down into three age (at diagnosis) groups: 15-69, 70-79, and 80-99 years.
Male, female, and person relative survival rates are age-standardised using the same person standard population
and may therefore be compared against each other. Rates for different cancers, however, are standardised using
different standard populations, and in some instances different age groupings, and should therefore not be
compared.
Annex 3 of the Compendium User Guide: Explanations of statistical methods used in the Compendium.
Interpretation of indicators:
Type of Indicator - The relative survival rate can be interpreted as an estimate of the proportion of cancer patients
who die of their disease, after adjustment for death from other causes. A relative survival rate of 100% for a given
period would imply that the cancer patients had had the same survival (or death) rates as the general population,
not that they had all survived. Similarly, if the relative survival rate remains constant at (say) ten or more years
after diagnosis, this implies that the ten-year survivors no longer have higher mortality than the general population.
Quality of indicator - Annex 12 of the Compendium User Guide describes the criteria that should be used to judge
the quality of this indicator. The application of the criteria is dependent on the context (e.g. describing a single
organisation, comparing several organisations) and the level (e.g. national / regional with large numbers of events,
local with small numbers of events) at which the data are to be used.
Potential value of indicator:
Cancer survival is a broad indicator - differences may be due to a range of factors, of which the quality of
treatment is only one. Differences in cancer survival between geographical areas should therefore be the origin of
further enquiry, not the basis for simplistic conclusions about the efficacy of cancer treatment. The geographical
area of residence at cancer diagnosis is a proxy for several aspects of health care, including the quality of primary
care, the speed of referral and the quality of treatment services. It may also be a proxy for other factors, not readily
measured, such as the degree of understanding of cancer symptoms and what to do about them among the local
population, variations in the extent of disease at diagnosis (stage) and in the histology and grade of tumours, and
artefacts in the data. If geographical survival differences can be attributed to differences in knowledge of cancer or
the extent of disease at diagnosis, public health responses could be organised. Differences in cancer survival
between geographical areas may also "turn out to be due to the persistence of outmoded practices, or other
remediable deficiencies in service provision or therapeutic regimes, and correcting these should lead to an
5
improvement in overall standards of care" .
Further reading:
A comprehensive monograph on cancer survival in England and Wales has been published6, covering 2.9 million
patients diagnosed with one of 47 adult cancers and 11 childhood cancers during 1971-90, and followed up to the
end of 1995. It includes comprehensive analyses by age, sex, and NHS Region, and by socio-economic status (in
five categories from affluent to deprived). Updated results for England and Wales have been published in 2004
and 2008 with a chapter for each of the 21 most common cancers. 7, 8 More limited analyses have also been
published for cancer patients diagnosed during 1991-93 and followed up to 1998, and diagnosed during 1993-95
and followed up to 2000. 9, 10 Five-year age-standardised relative survival rates for 21 major cancers based on
11
diagnoses in five year periods between 1998 and 2007 are available on the National Statistics website. An early
12
assessment of the impact of the NHS National Cancer Plan on relative survival has been published. An all13
cancer relative survival index for patients diagnosed 1991-2006 has been presented by PCT in England. Cancer
survival by Cancer Network has been presented for patients diagnosed with one of six cancers 1991-2006.13
1.
2.
3.
4.
5.
6.
Expert Advisory Group on Cancer. A policy framework for commissioning cancer services. London:
Department of Health, 1995.
NHS Executive. The new NHS. Modern. Dependable. London: Department of Health, 1997.
Department of Health. The NHS Cancer Plan: three-year progress report - maintaining the momentum.
London: Department of Health, 2003.
Estève J, Benhamou E, Croasdale M, Raymond L. Relative survival and the estimation of net survival:
elements for further discussion. Stat Med 1990; 9: 529-38.
Clinical Outcomes Working Group. Clinical outcome indicators, July 1996. Edinburgh: The Scottish Office,
1996.
Coleman M.P, Babb P, Damiecki P, Grosclaude P, Honjo S, Jones J et al. Cancer survival trends in England
and Wales 1971-1995: deprivation and NHS Region. Series SMPS No.61. London: The Stationery Office,
1999, 1-695.
285
7.
8.
9.
10.
11.
12.
13.
Coleman M.P, Rachet B, Woods L.M, Mitry E, Riga M, Cooper N et al. Trends and socioeconomic inequalities
in cancer survival in England and Wales up to 2001. British Journal of Cancer 2004; 90:1367-1373.
Rachet B, Quinn M.J, Cooper N, Coleman M.P. Survival from cancer of the lung in England & Wales up to
2001. British Journal of Cancer 2008; 99:S40-S42.
Coleman M.P, Babb P, Harris S, Quinn M.J, Sloggett A, De Stavola B.L. Cancer survival in England and
Wales, 1991-1998. Office for National Statistics Health Statistics Quarterly 2000; 6: 71-80.
Office for National Statistics. Cancer survival in the health authorities of England,1993-2000. Report. Office for
National Statistics Health Statistics Quarterly 2002;13: 95-103.
Office for National Statistics. Survival Rates in England and Wales, 1998-2001, 1999-2002, 1999-03; Survival
Rates in England 2000-04, 2001-06. National Statistics website. Available at:
http://www.statistics.gov.uk/StatBase/Product.asp?vlnk=14007&Pos=3&ColRank=1&Rank=422 , accessed 16
September 2010.
Rachet B, Maringe C, Nur U, Quaresma M, Shah A, Woods LM, et al. Population-based cancer survival trends
in England and Wales up to 2007: an assessment of the NHS cancer plan for England. Lancet Oncol
2009;10:351-69.
Office for National Statistics. Cancer survival by cancer network, patients diagnosed 1991-2006, followed up to
2007. National Statistics website. Available at:
http://www.statistics.gov.uk/STATBASE/Product.asp?vlnk=15387. Accessed 15 September 2010.
Updated: October 2010
286
Deaths at home from lung cancer
Purpose:
To improve palliative care and service planning for cancer patients in the terminal stages of life, allowing more of
them the choice of dying at home.
Definition of indicator and its variants:
The proportion of deaths from lung cancer (ICD-10 C33-C34) that occur at home.
Statistic
Sex
Age group
Percent of deaths at home
MFP All ages
Indirectly age-standardised
deaths at home rate per 100
deaths and number of deaths
at home
MFP All ages
Organisation
(see glossary)
Current
data
E&W, E, GOR, ONS 2006-08
area, SHA, LA,
PCO, CTY
E&W, E, GOR, ONS 2006-08
area, SHA, LA,
PCO, CTY
Trend
data
File-worksheet name
14D_194PC_08_V1
14D_194ISR_08_V1
Numerator:
Numerator data - Deaths at home from lung cancer, classified by underlying cause of death (ICD-10 C33-C34),
registered in the respective calendar year(s).
Source of numerator data - Office for National Statistics (ONS).
Comments on numerator data - Mortality data for years 1993-2006 were extracted by ONS in June 2007 with
organisational codes assigned using the postcode of usual residence and the November 2006 edition of the
National Statistics Postcode Directory (NSPD). Data for subsequent years were extracted in June of the following
year using the respective year’s November edition of the NSPD.
Information about the place of death is found on the mortality record in the communal establishment field. It
contains one of:
•
•
•
a 5 digit code identifying a communal establishment or institution (e.g. hospital, nursing home, residential
home);
an “H” code which indicates that the person is certified as having died at their home address and that this
is not a communal establishment or;
an “E” code which indicates that the person died elsewhere.
The communal establishments are themselves classified into 84 categories (e.g. general hospital, mental nursing
home, nursing home etc) and can be further distinguished by whether they are an NHS or Non-NHS
establishment.
It is currently ONS practice to include nursing homes with hospitals under a broader group - “Other hospitals and
communal establishments for the care of the sick” - and also to include residential homes under “Other communal
establishments”. This is because of concerns highlighted by the ONS regarding the accuracy of the recorded
status of some communal establishments, particularly nursing homes and residential homes.
It is therefore not possible to include nursing home or residential home deaths as a “home” death. For this
indicator, a “home” death is defined as one that has the ”H” code in the communal establishment field, i.e. where
the death has occurred at the home address and that address is not of a communal establishment.
Denominator:
Denominator data - All deaths from lung cancer, classified by underlying cause of death (ICD-10 C33-C34),
registered in the respective calendar year(s).
Source of denominator data - ONS.
Comments on denominator data - Includes deaths in all categories of communal establishment code, i.e. deaths in
all communal establishments, at home, and elsewhere.
From the 2003 Compendium onwards, data are based on the original causes of death rather than the final causes
used in earlier Compendia. See Annex 2 for more details.
287
Statistical methods:
The age-standardised deaths at home rate utilises the indirect method of standardisation. The direct method was
found not to be robust as it was affected by small numerator and denominator counts in specific age groups.
Indirect standardisation requires the computation of the ratio of an area’s observed number of events to its
expected number of events if it had experienced the standard age-specific rates. This age-standardised ratio can
be converted into a rate by multiplying it by the crude rate of the standard population.
The standard rates used are those of England for the respective calendar year(s). Male and female rates have
been standardised separately. The rate for persons is standardised for both age and sex.
This methodology is similar to that used for the Clinical Indicators and is described in detail in:
Annex 3: Explanations of statistical methods used in the Compendium (under the sections entitled “Indirectly
Standardised Rates For Clinical Indicators” and “Confidence Intervals Of Indirectly Standardised Rates For Clinical
Indicators”).
Interpretation of indicators:
Type of Indicator - This is a condition-specific cross-sectional comparative indicator reflecting events which act as
a proxy for outcome (quality of dying). In the absence of an absolute standard, comparative data are useful for
monitoring in relation to rates achieved in comparable areas.
Quality of indicator - Annex 12 describes the criteria that should be used to judge the quality of this indicator. The
application of the criteria is dependent on the context (e.g. describing a single organisation, comparing several
organisations) and the level (e.g. national / regional with large numbers of events, local with small numbers of
events) at which the data are to be used.
Confidence Intervals - 95%. Some of the values and factors influencing them may be chance occurrences, with
values fluctuating at random between organisations and from year to year. Numbers of deaths may be small at
individual organisational level. The results should therefore be interpreted with caution and with the aid of
confidence intervals. The 95% confidence interval provides a measure of the statistical precision of the rate for an
area or institution. It indicates a range which, with 95% probability, will contain the underlying value of the
indicator. If the confidence interval for an organisation’s rate is outside the range of the national confidence
intervals, the difference between the two rates is considered statistically significant. If the confidence intervals for
two rates overlap, in most cases the difference between the rates would not be considered statistically significant.
Effect of Case-Mix / severity - Severity of the cancer and need for hospital care have implications for those who
wish to die at home being able to do so. The data available do not allow adjustment for these factors.
Other Potential Confounding Factors - A number of factors outside the control of the NHS such as personal
choice, availability of hospices, and family/community support may contribute to the variation shown by the
indicator.
Relevant National initiatives:
1.
2.
3.
4.
Department of Health. End of life care strategy : Promoting high quality care for all adults at the end of life.
London: Department of Health , 2008.
http://www.dh.gov.uk/en/Publicationsandstatistics/Publications/PublicationsPolicyAndGuidance/DH_086277
Department of Health. The NHS cancer plan and the new NHS: Providing a patient-centred service. London:
Department of Health, 2004.
Department of Health. Pioneering Schemes Named Best of the Best. NHS Beacons – Part of a Concerted
Campaign to Improve Cancer Services. Department of Health, 1999. Press release: reference 1999/0375
Commission for Health Improvement. NHS Cancer Care in England and Wales. National Service Framework
Assessments No.1. London: Commission for Health Improvement, 2001.
Further reading:
1.
2.
3.
Higginson I.J, Thompson M. Children and young people who die from cancer: epidemiology and place of
death in England (1995-9). British Medical Journal 2003; 327: 478-479.
Grande GE, Todd CJ, Barclay SIG, Farquhar MC. Does hospital at home for palliative care facilitate death at
home? Randomised controlled trial. British Medical Journal 1999; 319: 1472-1475.
Higginson I.J, Jarman B, Astin P, Dolan S. Do social factors affect where patients die: an analysis of 10 years
of cancer deaths in England. Journal of Public Health Medicine 1999; 21(1): 23-28.
Updated: December 2009
288
Years of life lost due to mortality from lung cancer
Purpose:
Years of life lost (YLL) is a measure of premature mortality. Its primary purpose is to compare the relative
importance of different causes of premature death within a particular population and it can therefore be used by
health planners to define priorities for the prevention of such deaths. It can also be used to compare the premature
mortality experience of different populations for a particular cause of death. The concept of years of life lost is to
estimate the length of time a person would have lived had they not died prematurely. By inherently including the
age at which the death occurs, rather than just the fact of its occurrence, the calculation is an attempt to better
quantify the burden, or impact, on society from the specified cause of mortality.
Definition of indicator and its variants:
Years of life lost due to mortality from lung cancer (ICD-10 A00-Y99).
Statistic
Crude rate per 10,000
population and number of
years of life lost
Directly age-standardised rate
per 10,000 population and
number of deaths
Sex
Age group
MFP <75
MFP <75
Organisation
(see glossary)
Current
data
Trend
data
File-worksheet name
E&W, E, GOR,
ONS area, SHA,
LA, PCO, CTY
E&W, E, GOR,
ONS area, SHA,
LA, PCO, CTY
2006-08
14E_050CR_08_V1
2006-08
14E_050DR_08_V1
Numerator:
Numerator data – Years of life lost and deaths from lung cancer classified by underlying cause of death (ICD-10
A00-Y99), registered in the respective calendar year(s).
Source of numerator data – Office for National Statistics (ONS).
Comments on numerator data – The number of years of life lost is calculated by summing over ages 1 to 74 years
the number of deaths at each age multiplied by the number of years of life remaining up to age 75 years. Infant
deaths are omitted as they are mostly a result of causes specific to this age group and have different aetiologies to
deaths later in life.
The numerator presented alongside the sdirecgtly age-tandardised years of life lost rate is the number of deaths
rather than the number of years of life lost. This is because the standardisation calculation has been performed
using 5-year age bands. In each age band the number of deaths is weighted by the number of years of life
remaining from the mid-point of the age band up to age 75 years. See annex 3 for more details.
Mortality data for years 1993-2006 were extracted by ONS in June 2007 with organisational codes assigned using
the postcode of usual residence and the November 2006 edition of the National Statistics Postcode Directory
(NSPD). Data for subsequent years were extracted in June of the following year using the respective year’s
November edition of the NSPD.
In January 2001, the ONS implemented a change from ICD-9 to ICD-10 for coding causes of death in England &
Wales. As part of an exercise to investigate the effects of this change, the ONS also re-coded all deaths registered
in 1999. Deaths for years prior to 1999 and for year 2000 have not been re-coded.
For current analysis, therefore, all data are based on ICD-10.
From the 2003 Compendium onwards, data are based on the original causes of death rather than the final causes
used in earlier Compendia.
See Annex 2 for more details.
Denominator:
Denominator data - 2001 Census based mid-year population estimates for the respective calendar years.
Source of denominator data - ONS.
Comments on denominator data - Data are based on the latest revisions of ONS mid-year population estimates for
the respective years, current as at 1 October 2009.
289
Statistical methods:
Annex 2: Changes to Office for National Statistics mortality data
Annex 3: Explanations of statistical methods used in the Compendium
Annex 5: European Standard Population
Interpretation of indicators:
Quality of indicator - Annex 12 describes the criteria that should be used to judge the quality of this indicator. The
application of the criteria is dependent on the context (e.g. describing a single organisation, comparing several
organisations) and the level (e.g. national / regional with large numbers of events, local with small numbers of
events) at which the data are to be used.
Further reading:
1.
2.
3.
4.
5.
6.
7.
8.
9.
World Health Organization. WHO Tobacco Free Initiative. Available at: http://www.who.int/tobacco/en/
World Health Organization. WHO Framework Convention on Tobacco Control. Geneva: World Health
Organization, 2003. Available at http://www.who.int/tobacco/fctc/text/en/fctc_en.pdf
Department of Health. The NHS cancer plan and the new NHS: Providing a patient-centred service. London:
Department of Health, 2004.
NHS Executive. Manual of Cancer Services Standards. London: NHS Executive, 2000.
Department of Health. NHS Cancer Plan. London: Department of Health, 2000.
World Bank. Economics of Tobacco Control. Wasthington: World Bank, 1999. Available at:
http://www1.worldbank.org/tobacco/book/pdf/tobacco.pdf
Department of Health. Saving lives: Our Healthier Nation. London: The Stationery Office, 1999.
Department of Health. Smoking kills – a White Paper on tobacco. London: The Stationery Office, 1998.
Department of Health. Health of the Nation - A Strategy for Health in England. London: Her Majesty’s
Stationery Office, 1992.
Updated: December 2009
290
Incidence of oesophageal cancer
Purpose:
To reduce the incidence of oesophageal cancer.
Definition of indicator and its variants:
Registrations for oesophageal cancer (ICD-10 C15 equivalent to ICD-9 150).
Statistic
Indirectly age-standardised
registration ratio (SRR) and
number of registrations
Directly age-standardised
registration rate and number of
registrations
Sex
Age group
Organisation
(see glossary)
Current
data
MFP All ages
<75
E&W, E, GOR, ONS 2004-06
area, SHA, LA, PCO
All ages
MFP All ages
<75
E&W, E, GOR, ONS 2004-06
area, SHA, LA, PCO
Trend
data
37A_188SR00++_06_V1
37A_188SR0074_06_V1
1993-06
All ages
File-worksheet name
37A_188SRT00++_06_V1
37A_188DR00++_06_V1
37A_188DR0074_06_V1
1993-06 37A_188DRT00++_06_V1
Numerator:
Numerator data - Cancer registrations for oesophageal cancer (ICD-10 C15, ICD-9 150) in the respective calendar
years.
Source of numerator data - Regional Cancer Registries and Office for National Statistics (ONS).
Comments on numerator data - Registration data for years 1993-2005 were extracted by ONS in November 2008.
Data for 2006 are as registered by the end of September 2008. For all data organisational codes were assigned
using the postcode of usual residence and the August 2008 edition of the National Statistics Postcode Directory.
Results in the current Compendium may differ from those of previous issues because of changes in methodology
to extract data by area, and also because of data enhancements by ONS. Cancer registrations are also
continuously being updated retrospectively and ONS records may have been updated since previous analyses.
Denominator:
Denominator data - 2001 Census based mid-year population estimates for the respective calendar years.
Source of denominator data - ONS.
Comments on denominator data - Data are based on the latest revisions of ONS mid-year population estimates for
the respective years, current as at 29 September 2008.
Statistical methods:
Annex 3: Explanations of statistical methods used in the Compendium.
Interpretation of indicators:
Quality of indicator - Annex 12 describes the criteria that should be used to judge the quality of this indicator. The
application of the criteria is dependent on the context (e.g. describing a single organisation, comparing several
organisations) and the level (e.g. national / regional with large numbers of events, local with small numbers of
events) at which the data are to be used.
Further reading:
1.
2.
Department of Health. The NHS cancer plan and the new NHS: Providing a patient-centred service. London:
Department of Health, 2004.
Kuper H, Boffetta P, Adami H-O. Tobacco use and cancer causation: association by tumour type. J Intern Med
2002; 252(3): 206-224.
Updated: May 2009
291
Mortality from oesophageal cancer
Purpose:
To reduce deaths from oesophageal cancer.
Definition of indicator and its variants:
Mortality from oesophageal cancer (ICD-10 C15 equivalent to ICD-9 150).
Statistic
Number of deaths
Average age-specific death
rate per 100,000 resident
population
Indirectly age-standardised
mortality ratio (SMR) and
number of deaths
Directly age-standardised
mortality rate per 100,000 and
number of deaths
Sex
Age group
MFP 1+, 1-4, 5-14,
15-34, 35-64,
65-74, 75+
MFP 1+, 1-4, 5-14,
15-34, 35-64,
65-74, 75+
MFP All ages,
<75
All ages
MFP All ages,
<75
Organisation
(see glossary)
Current
data
E&W, E, GOR,
ONS area, SHA,
LA, PCO, CTY
E&W, E, GOR,
ONS area, SHA,
LA, PCO, CTY
E&W, E, GOR,
ONS area, SHA,
LA, PCO, CTY
2008
37B_189NO_08_V1
2006-08
37B_189CR_08_V1
2006-08
37B_189SM00++_08_V1
37B_189SM0074_08_V1
E&W, E, GOR,
ONS area, SHA,
LA, PCO, CTY
All ages
2006-08
Trend
data
File-worksheet name
1993-08 37B_189SMT00++_08_V1
37B_189DR00++_08_V1
37B_189DR0074_08_V1
1993-08 37B_189DRT00++_08_V1
Numerator:
Numerator data - Deaths from oesophageal cancer, classified by underlying cause of death (ICD-10 C15, ICD-9
150 adjusted), registered in the respective calendar year(s).
Source of numerator data - Office for National Statistics (ONS).
Comments on numerator data - Mortality data for years 1993-2006 were extracted by ONS in June 2007 with
organisational codes assigned using the postcode of usual residence and the November 2006 edition of the
National Statistics Postcode Directory (NSPD). Data for subsequent years were extracted in June of the following
year using the respective year’s November edition of the NSPD.
In January 2001, the ONS implemented a change from ICD-9 to ICD-10 for coding causes of death in England &
Wales. As part of an exercise to investigate the effects of this change, the ONS also re-coded all deaths registered
in 1999. Deaths for years prior to 1999 and for year 2000 have not been re-coded.
For current analysis, therefore, all data are based on ICD-10.
For trend analysis, the numbers of deaths observed in the years 1993-98 and 2000 must be adjusted to give
“expected” numbers of deaths which would have been coded to this cause in ICD-10. This is done by multiplying
the ICD-9 based death counts by the appropriate ICD-10/9 comparability ratio published by the ONS. Trend data
cannot include years prior to 1993, because the ONS introduced automated coding in 1993, and the comparability
ratios are only valid from this point onwards.
For this indicator the following ICD-10/9 comparability ratios were used:
Males
Females
All Ages: 1.01
All Ages: 1
Adjusted person counts are the sum of the adjusted male and female counts. Once adjusted, the counts are used
to calculate rates in the usual way.
From the 2003 Compendium onwards, data are based on the original causes of death rather than the final causes
used in earlier Compendia.
See Annex 2 for more details.
Denominator:
Denominator data - 2001 Census based mid-year population estimates for the respective calendar years.
292
Source of denominator data - ONS
Comments on denominator data - Data are based on the latest revisions of ONS mid-year population estimates for
the respective years, current as at 1 October 2009.
Statistical methods:
Annex 2: Changes to Office for National Statistics mortality data
Annex 3: Explanations of statistical methods used in the Compendium
Interpretation of indicators:
Quality of indicator - Annex 12 describes the criteria that should be used to judge the quality of this indicator. The
application of the criteria is dependent on the context (e.g. describing a single organisation, comparing several
organisations) and the level (e.g. national / regional with large numbers of events, local with small numbers of
events) at which the data are to be used.
Further reading:
1.
2.
3.
4.
5.
6.
7.
8.
Department of Health. The NHS cancer plan and the new NHS: Providing a patient-centred service. London:
Department of Health, 2004.
Brock A, Griffiths C. Trends in the mortality of young adults aged 15-44 in England and Wales, 1961-2001.
Office for National Statistics Health Statistics Quarterly, No. 19, 2003: 22-31. Available at:
http://www.statistics.gov.uk/downloads/theme_health/HSQ19.pdf
World Health Organization. WHO Framework on Tobacco Control. Geneva: World Health Organization, 2003.
Available at: http://www.who.int/tobacco/fctc/text/en/fctc_en.pdf
Department of Health. NHS Cancer Plan. London: Department of Health, 2000.
NHS Executive. Manual of Cancer Services Standards. London: NHS Executive, 2000.
Department of Health. Saving lives: Our Healthier Nation. London: The Stationery Office, 1999.
Department of Health. Smoking kills – a White Paper on tobacco. London: The Stationery Office, 1998.
Department of Health. The Health of the Nation: A Policy Assessed. London: The Stationery Office, 1998.
Updated: December 2009
293
Survival following diagnosis of oesophageal cancer
Purpose:
To provide comparative measures of the outcome of cancer treatment by area of residence, using geographical
variations in cancer survival. Cancer survival is a key operational measure of the success of cancer treatment
services. The principle of equity of access to optimal standards of National Health Service (NHS) cancer treatment
was explicitly endorsed in the Calman-Hine report of 1995, which noted: "All patients should have access to a
uniformly high quality of care in the community or hospital wherever they may live to ensure the maximum possible
1
cure rates and best quality of life" . A further policy document stated that from April 1999, patients with suspected
breast cancer "will be able to see a specialist within two weeks of their GP deciding they need to be seen urgently,
2
and requesting an appointment" . Similar commitments have come into force for other cancers since April 2000.
These policies are expected to lead to earlier diagnosis for all patients and more equitable access to treatment.
The NHS Cancer Plan extended these commitments to improve cancer survival in England to amongst the best in
3
Europe . Cancer survival rates are outcome measures that can form part of the baseline for monitoring the future
impact of these policies. Geographic differences in cancer survival are expected to decline over time if policy goals
are achieved.
Definition of indicator and its variants:
Relative survival rate at one and five years after diagnosis for patients diagnosed in England during 2001-03 and
followed up to the end of the year 2008. Cancer patients have higher mortality than the general population, but
they do not all die of cancer. The relative survival rate is the ratio of the survival rate actually observed among the
cancer patients and the survival rate that would have been expected if they had only had the same overall
mortality rates as the general population. Thus, if five-year survival is 60% among a group of cancer patients of
whom 90% would have been expected to survive that long, the relative survival is 67% (60/90). By convention,
relative survival is described as a rate, although strictly it is a ratio of two percentages.
Statistic
Number and one-year relative
survival rate (%)
Number and five-year relative
survival rate (%)
Sex
Age group
Organisation
(see glossary)
Current
data
Trend
data
File-worksheet name
MFP 15-99
E, GOR, SHA, CN
2001-03
37C_404PCP1_03_V1
MFP 15-99
E, GOR, SHA, CN
2001-03
37C_404PCP2_03_V1
Numerator:
Numerator data - Observed survival rate, derived from the distribution of survival times from the date of diagnosis
(of a primary, invasive, malignant neoplasm) to the earliest date among the date of death, the date of emigration,
and the cut-off date of follow-up (31 December 2008), for cancer patients who were diagnosed during 2001-03 and
resident in England at the time of diagnosis. Analyses published prior to the July 2009 Compendium release
include only first primary malignancies. From the July 2009 release onwards, higher order primary malignancies
are also retained. The geographical area of each patient is defined by residence at the time of diagnosis. Records
with faulty data, and those of patients diagnosed with in situ tumours, tumours uncertain as to whether benign or
malignant, metastatic, or uncertain whether primary or metastatic, are excluded from analysis.
Source of numerator data - National Cancer Intelligence Centre (NCIC), Office for National Statistics (ONS)
derived from NHS regional cancer registries; National Health Service Central Register.
Comments on numerator data Denominator:
Denominator data - The expected survival rate among the cancer patients, derived from life tables specific for the
calendar year of death, single year of age, sex, Government Office Region of residence and deprivation.
Source of denominator data - Office for National Statistics (ONS).
Statistical methods:
The cumulative probability of death at a given time since diagnosis, relative to the corresponding probability in the
general population, is estimated by comparing the death rates among the cancer patients in successive intervals
4
of time since diagnosis with the all-causes death rate in the general population for the same sex and age group .
This is derived from life tables for the Government Office Region in which the patient lives. Life tables were
created that were specific for calendar year of death, single year of age, sex, Government Office Region and
deprivation. Life tables were constructed for the years 1991, 2001 and 2005 using ONS mid-year population
estimates and the mean annual number of deaths in the three years centred on those index years. Life tables for
294
the intervening years were then created by linear interpolation. The life tables for 2005 were used for years 2006
to 2008 without interpolation.
The relative survival rates for the pooled three-year time period have been directly age-standardised to take into
account any variation in relative survival by age. The standard population used is the number of persons who were
diagnosed with the particular cancer under consideration in England and Wales during the period 1986-90. These
were broken down into three age (at diagnosis) groups: 15-69, 70-79, and 80-99 years.
Male, female, and person relative survival rates are age-standardised using the same person standard population
and may therefore be compared against each other. Rates for different cancers, however, are standardised using
different standard populations, and in some instances different age groupings, and should therefore not be
compared.
Annex 3 of the Compendium User Guide: Explanations of statistical methods used in the Compendium.
Interpretation of indicators:
Type of Indicator - The relative survival rate can be interpreted as an estimate of the proportion of cancer patients
who die of their disease, after adjustment for death from other causes. A relative survival rate of 100% for a given
period would imply that the cancer patients had had the same survival (or death) rates as the general population,
not that they had all survived. Similarly, if the relative survival rate remains constant at (say) ten or more years
after diagnosis, this implies that the ten-year survivors no longer have higher mortality than the general population.
Quality of indicator - Annex 12 of the Compendium User Guide describes the criteria that should be used to judge
the quality of this indicator. The application of the criteria is dependent on the context (e.g. describing a single
organisation, comparing several organisations) and the level (e.g. national / regional with large numbers of events,
local with small numbers of events) at which the data are to be used.
Potential value of indicator:
Cancer survival is a broad indicator - differences may be due to a range of factors, of which the quality of
treatment is only one. Differences in cancer survival between geographical areas should therefore be the origin of
further enquiry, not the basis for simplistic conclusions about the efficacy of cancer treatment. The geographical
area of residence at cancer diagnosis is a proxy for several aspects of health care, including the quality of primary
care, the speed of referral and the quality of treatment services. It may also be a proxy for other factors, not readily
measured, such as the degree of understanding of cancer symptoms and what to do about them among the local
population, variations in the extent of disease at diagnosis (stage) and in the histology and grade of tumours, and
artefacts in the data. If geographical survival differences can be attributed to differences in knowledge of cancer or
the extent of disease at diagnosis, public health responses could be organised. Differences in cancer survival
between geographical areas may also "turn out to be due to the persistence of outmoded practices, or other
remediable deficiencies in service provision or therapeutic regimes, and correcting these should lead to an
5.
improvement in overall standards of care"
Further reading:
A comprehensive monograph on cancer survival in England and Wales has been published6, covering 2.9 million
patients diagnosed with one of 47 adult cancers and 11 childhood cancers during 1971-90, and followed up to the
end of 1995. It includes comprehensive analyses by age, sex, and NHS Region, and by socio-economic status (in
five categories from affluent to deprived). Updated results for England and Wales have been published in 2004
and 2008 with a chapter for each of the 21 most common cancers. 7, 8 More limited analyses have also been
published for cancer patients diagnosed during 1991-93 and followed up to 1998, and diagnosed during 1993-95
and followed up to 2000. 9, 10 Five-year age-standardised relative survival rates for 21 major cancers based on
11
diagnoses in five year periods between 1998 and 2007 are available on the National Statistics website. An early
12
assessment of the impact of the NHS National Cancer Plan on relative survival has been published. An all13
cancer relative survival index for patients diagnosed 1991-2006 has been presented by PCT in England. Cancer
survival by Cancer Network has been presented for patients diagnosed with one of six cancers 1991-2006.13
1.
2.
3.
4.
5.
6.
Expert Advisory Group on Cancer. A policy framework for commissioning cancer services. London:
Department of Health, 1995.
NHS Executive. The new NHS. Modern. Dependable. London: Department of Health, 1997.
Department of Health. The NHS Cancer Plan: three-year progress report - maintaining the momentum.
London: Department of Health, 2003.
Estève J, Benhamou E, Croasdale M, Raymond L. Relative survival and the estimation of net survival:
elements for further discussion. Stat Med 1990; 9: 529-38.
Clinical Outcomes Working Group. Clinical outcome indicators, July 1996. Edinburgh: The Scottish Office,
1996.
Coleman M.P, Babb P, Damiecki P, Grosclaude P, Honjo S, Jones J et al. Cancer survival trends in England
and Wales 1971-1995: deprivation and NHS Region. Series SMPS No.61. London: The Stationery Office,
1999, 1-695.
295
7.
8.
9.
10.
11.
12.
13.
Coleman M.P, Rachet B, Woods L.M, Mitry E, Riga M, Cooper N et al. Trends and socioeconomic inequalities
in cancer survival in England and Wales up to 2001. British Journal of Cancer 2004; 90:1367-1373.
Mitry E, Rachet B, Quinn M.J, Cooper N, Coleman M.P. Survival from cancer of the oesophagus in England &
Wales up to 2001. British Journal of Cancer 2008; 99:S11-S13.
Coleman M.P, Babb P, Harris S, Quinn M.J, Sloggett A, De Stavola B.L. Cancer survival in England and
Wales, 1991-1998. Office for National Statistics Health Statistics Quarterly 2000; 6: 71-80.
Office for National Statistics. Cancer survival in the health authorities of England,1993-2000. Report. Office for
National Statistics Health Statistics Quarterly 2002;13: 95-103.
Office for National Statistics. Survival Rates in England and Wales, 1998-2001, 1999-2002, 1999-03; Survival
Rates in England 2000-04, 2001-06. National Statistics website. Available at:
http://www.statistics.gov.uk/StatBase/Product.asp?vlnk=14007&Pos=3&ColRank=1&Rank=422 , accessed 16
September 2010.
Rachet B, Maringe C, Nur U, Quaresma M, Shah A, Woods LM, et al. Population-based cancer survival
trends in England and Wales up to 2007: an assessment of the NHS cancer plan for England. Lancet Oncol
2009;10:351-69.
Office for National Statistics. Cancer survival by cancer network, patients diagnosed 1991-2006, followed up
to 2007. National Statistics website. Available at:
http://www.statistics.gov.uk/STATBASE/Product.asp?vlnk=15387. Accessed 15 September 2010.
Updated: October 2010
296
Deaths at home from oesophageal cancer
Purpose:
To improve palliative care and service planning for cancer patients in the terminal stages of life, allowing more of
them the choice of dying at home.
Definition of indicator and its variants:
The proportion of deaths from oesophageal cancer (ICD-10 C15) that occur at home.
Statistic
Sex
Age group
Percent of deaths at home
MFP All ages
Indirectly age-standardised
deaths at home rate per 100
deaths and number of deaths
at home
MFP All ages
Organisation
(see glossary)
Current
data
E&W, E, GOR, ONS 2006-08
area, SHA, LA,
PCO, CTY
E&W, E, GOR, ONS 2006-08
area, SHA, LA,
PCO, CTY
Trend
data
File-worksheet name
37D_199PC_08_V1
37D_199ISR_08_V1
Numerator:
Numerator data - Deaths at home from oesophageal cancer, classified by underlying cause of death (ICD-10 C15),
registered in the respective calendar year(s).
Source of numerator data - Office for National Statistics (ONS).
Comments on numerator data - Mortality data for years 1993-2006 were extracted by ONS in June 2007 with
organisational codes assigned using the postcode of usual residence and the November 2006 edition of the
National Statistics Postcode Directory (NSPD). Data for subsequent years were extracted in June of the following
year using the respective year’s November edition of the NSPD.
Information about the place of death is found on the mortality record in the communal establishment field. It
contains one of:
•
•
•
A 5 digit code identifying a communal establishment or institution (e.g. hospital, nursing home, residential
home);
An “H” code which indicates that the person is certified as having died at their home address and that this
is not a communal establishment or;
An “E” code which indicates that the person died elsewhere.
The communal establishments are themselves classified into 84 categories (e.g. general hospital, mental nursing
home, nursing home etc) and can be further distinguished by whether they are an NHS or Non-NHS
establishment.
It is currently ONS practice to include nursing homes with hospitals under a broader group - “Other hospitals and
communal establishments for the care of the sick” - and also to include residential homes under “Other communal
establishments”. This is because of concerns highlighted by ONS regarding the accuracy of the recorded status of
some communal establishments, particularly nursing homes and residential homes.
It is therefore not possible to include nursing home or residential home deaths as a “home” death. For this
indicator, a “home” death is defined as one that has the ”H” code in the communal establishment field, i.e. where
the death has occurred at the home address and that address is not of a communal establishment.
Denominator:
Denominator data - All deaths from oesophageal cancer, classified by underlying cause of death (ICD-10 C15),
registered in the respective calendar year(s).
Source of denominator data - ONS.
Comments on denominator data - Includes deaths in all categories of communal establishment code, i.e. deaths in
all communal establishments, at home, and elsewhere.
From the 2003 Compendium onwards, data are based on the original causes of death rather than the final causes
used in earlier Compendia. See Annex 2 for more details.
297
Statistical methods:
The age-standardised deaths at home rate utilises the indirect method of standardisation. The direct method was
found not to be robust as it was affected by small numerator and denominator counts in specific age groups.
Indirect standardisation requires the computation of the ratio of an area’s observed number of events to its
expected number of events if it had experienced the standard age-specific rates. This age-standardised ratio can
be converted into a rate by multiplying it by the crude rate of the standard population.
The standard rates used are those of England for the respective calendar year(s). Male and female rates have
been standardised separately. The rate for persons is standardised for both age and sex.
This methodology is similar to that used for the Clinical Indicators and is described in detail in:
Annex 3: Explanations of statistical methods used in the Compendium (under the sections entitled “Indirectly
Standardised Rates For Clinical Indicators” and “Confidence Intervals Of Indirectly Standardised Rates For Clinical
Indicators”).
Interpretation of indicators:
Type of Indicator - This is a condition-specific cross-sectional comparative indicator reflecting events which act as
a proxy for outcome (quality of dying). In the absence of an absolute standard, comparative data are useful for
monitoring in relation to rates achieved in comparable areas.
Quality of indicator - Annex 12 describes the criteria that should be used to judge the quality of this indicator. The
application of the criteria is dependent on the context (e.g. describing a single organisation, comparing several
organisations) and the level (e.g. national / regional with large numbers of events, local with small numbers of
events) at which the data are to be used.
Confidence Intervals - 95%. Some of the values and factors influencing them may be chance occurrences, with
values fluctuating at random between organisations and from year to year. Numbers of deaths may be small at
individual organisational level. The results should therefore be interpreted with caution and with the aid of
confidence intervals. The 95% confidence interval provides a measure of the statistical precision of the rate for an
area or institution. It indicates a range which, with 95% probability, will contain the underlying value of the
indicator. If the confidence interval for an organisation’s rate is outside the range of the national confidence
intervals, the difference between the two rates is considered statistically significant. If the confidence intervals for
two rates overlap, in most cases the difference between the rates would not be considered statistically significant.
Effect of Case-Mix / severity - Severity of the cancer and need for hospital care have implications for those who
wish to die at home being able to do so. The data available do not allow adjustment for these factors.
Other Potential Confounding Factors - A number of factors outside the control of the NHS such as personal
choice, availability of hospices, and family/community support may contribute to the variation shown by the
indicator.
Relevant National initiatives:
1.
2.
3.
4.
Department of Health. End of life care strategy : Promoting high quality care for all adults at the end of life.
London: Department of Health , 2008.
http://www.dh.gov.uk/en/Publicationsandstatistics/Publications/PublicationsPolicyAndGuidance/DH_086277
Department of Health. The NHS cancer plan and the new NHS: Providing a patient-centred service. London:
Department of Health, 2004.
Department of Health. Pioneering Schemes Named Best of the Best. NHS Beacons – Part of a Concerted
Campaign to Improve Cancer Services. Department of Health, 1999. Press release: reference 1999/0375
Commission for Health Improvement. NHS Cancer Care in England and Wales. National Service Framework
Assessments No.1. London: Commission for Health Improvement, 2001.
Further reading:
1.
2.
3.
Higginson I.J, Thompson M. Children and young people who die from cancer: epidemiology and place of
death in England (1995-9). British Medical Journal 2003; 327: 478-479.
Grande GE, Todd CJ, Barclay SIG, Farquhar MC. Does hospital at home for palliative care facilitate death at
home? Randomised controlled trial. British Medical Journal 1999; 319: 1472-1475.
Higginson I.J, Jarman B, Astin P, Dolan S. Do social factors affect where patients die: an analysis of 10 years
of cancer deaths in England. Journal of Public Health Medicine 1999; 21(1): 23-28.
Updated: December 2009
298
Years of life lost due to mortality from oesophageal cancer
Purpose:
Years of life lost (YLL) is a measure of premature mortality. Its primary purpose is to compare the relative
importance of different causes of premature death within a particular population and it can therefore be used by
health planners to define priorities for the prevention of such deaths. It can also be used to compare the premature
mortality experience of different populations for a particular cause of death. The concept of years of life lost is to
estimate the length of time a person would have lived had they not died prematurely. By inherently including the
age at which the death occurs, rather than just the fact of its occurrence, the calculation is an attempt to better
quantify the burden, or impact, on society from the specified cause of mortality.
Definition of indicator and its variants:
Years of life lost due to mortality from oesophageal cancer (ICD-10 C15).
Statistic
Crude rate per 10,000
population and number of
years of life lost
Directly age-standardised rate
per 10,000 population and
number of deaths
Sex
Age group
MFP <75
MFP <75
Organisation
(see glossary)
Current
data
Trend
data
File-worksheet name
E&W, E, GOR,
ONS area, SHA,
LA, PCO, CTY
E&W, E, GOR,
ONS area, SHA,
LA, PCO, CTY
2006-08
37E_052CR_08_V1
2006-08
37E_052DR_08_V1
Numerator:
Numerator data – Years of life lost and deaths from oesophageal cancer classified by underlying cause of death
(ICD-10 C15), registered in the respective calendar year(s).
Source of numerator data – Office for National Statistics (ONS).
Comments on numerator data – The number of years of life lost is calculated by summing over ages 1 to 74 years
the number of deaths at each age multiplied by the number of years of life remaining up to age 75 years. Infant
deaths are omitted as they are mostly a result of causes specific to this age group and have different aetiologies to
deaths later in life.
The numerator presented alongside the sdirecgtly age-tandardised years of life lost rate is the number of deaths
rather than the number of years of life lost. This is because the standardisation calculation has been performed
using 5-year age bands. In each age band the number of deaths is weighted by the number of years of life
remaining from the mid-point of the age band up to age 75 years. See annex 3 for more details.
Mortality data for years 1993-2006 were extracted by ONS in June 2007 with organisational codes assigned using
the postcode of usual residence and the November 2006 edition of the National Statistics Postcode Directory
(NSPD). Data for subsequent years were extracted in June of the following year using the respective year’s
November edition of the NSPD.
In January 2001, the ONS implemented a change from ICD-9 to ICD-10 for coding causes of death in England &
Wales. As part of an exercise to investigate the effects of this change, the ONS also re-coded all deaths registered
in 1999. Deaths for years prior to 1999 and for year 2000 have not been re-coded.
For current analysis, therefore, all data are based on ICD-10.
From the 2003 Compendium onwards, data are based on the original causes of death rather than the final causes
used in earlier Compendia.
See Annex 2 for more details.
Denominator:
Denominator data - 2001 Census based mid-year population estimates for the respective calendar years.
Source of denominator data - ONS.
Comments on denominator data - Data are based on the latest revisions of ONS mid-year population estimates for
the respective years, current as at 1 October 2009.
299
Statistical methods:
Annex 2: Changes to Office for National Statistics mortality data
Annex 3: Explanations of statistical methods used in the Compendium
Annex 5: European Standard Population
Interpretation of indicators:
Quality of indicator - Annex 12 describes the criteria that should be used to judge the quality of this indicator. The
application of the criteria is dependent on the context (e.g. describing a single organisation, comparing several
organisations) and the level (e.g. national / regional with large numbers of events, local with small numbers of
events) at which the data are to be used.
Further reading:
1.
2.
3.
4.
5.
6.
7.
8.
Department of Health. The NHS cancer plan and the new NHS: Providing a patient-centred service. London:
Department of Health, 2004.
Brock A, Griffiths C. Trends in the mortality of young adults aged 15-44 in England and Wales, 1961-2001.
Office for National Statistics Health Statistics Quarterly, No. 19, 2003: 22-31. Available at:
http://www.statistics.gov.uk/downloads/theme_health/HSQ19.pdf
World Health Organization. WHO Framework on Tobacco Control. Geneva: World Health Organization, 2003.
Available at: http://www.who.int/tobacco/fctc/text/en/fctc_en.pdf
Department of Health. NHS Cancer Plan. London: Department of Health, 2000.
NHS Executive. Manual of Cancer Services Standards. London: NHS Executive, 2000.
Department of Health. Saving lives: Our Healthier Nation. London: The Stationery Office, 1999.
Department of Health. Smoking kills – a White Paper on tobacco. London: The Stationery Office, 1998.
Department of Health. The Health of the Nation: A Policy Assessed. London: The Stationery Office, 1998.
Updated: December 2009
300
Incidence of prostate cancer
Purpose:
To reduce the incidence of prostate cancer.
Definition of indicator and its variants:
Registrations for prostate cancer (ICD-10 C61 equvalent to ICD-9 185).
Statistic
Sex
Indirectly age-standardised
registration ratio (SRR) and
number of registrations
M
Directly age-standardised
registration rate and number of
registrations
M
Age group
Organisation
(see glossary)
Current
data
All ages
<75
E&W, E, GOR, ONS 2004-06
area, SHA, LA, PCO
All ages
All ages
<75
E&W, E, GOR, ONS 2004-06
area, SHA, LA, PCO
Trend
data
18A_147SR00++_06_V1
18A_147SR0074_06_V1
1993-06
All ages
File-worksheet name
18A_147SRT00++_06_V1
18A_147DR00++_06_V1
18A_147DR0074_06_V1
1993-06 18A_147DRT00++_06_V1
Numerator:
Numerator data - Cancer registrations for prostate cancer (ICD-10 C61, ICD-9 185) in the respective calendar
years.
Source of numerator data - Regional Cancer Registries and Office for National Statistics (ONS).
Comments on numerator data - Registration data for years 1993-2005 were extracted by ONS in November 2008.
Data for 2006 are as registered by the end of September 2008. For all data organisational codes were assigned
using the postcode of usual residence and the August 2008 edition of the National Statistics Postcode Directory.
Results in the current Compendium may differ from those of previous issues because of changes in methodology
to extract data by area, and also because of data enhancements by ONS. Cancer registrations are also
continuously being updated retrospectively and ONS records may have been updated since previous analyses.
Denominator:
Denominator data - 2001 Census based mid-year population estimates for the respective calendar years.
Source of denominator data - ONS.
Comments on denominator data - Data are based on the latest revisions of ONS mid-year population estimates for
the respective years, current as at 29 September 2008.
Statistical methods:
Annex 3: Explanations of statistical methods used in the Compendium
Interpretation of indicators:
Quality of indicator - Annex 12 describes the criteria that should be used to judge the quality of this indicator. The
application of the criteria is dependent on the context (e.g. describing a single organisation, comparing several
organisations) and the level (e.g. national / regional with large numbers of events, local with small numbers of
events) at which the data are to be used.
Further reading:
1.
2.
Department of Health. The NHS cancer plan and the new NHS: Providing a patient-centred service. London:
Department of Health, 2004.
Watson E, Jenikins L, Bukach C, Austoker J. Prostate Cancer Risk Management Programme Information
Pack for Primary Care. NHS Cancer Screening Programmes, 2002.
Updated: May 2009
301
Mortality from prostate cancer
Purpose:
To reduce deaths from prostate cancer.
Definition of indicator and its variants:
Mortality from prostate cancer (ICD-10 C61 equivalent to ICD-9 185).
Statistic
Sex
Number of deaths
M
Average age-specific death
rate per 100,000 resident
population
Indirectly age-standardised
mortality ratio (SMR) and
number of deaths
M
Directly age-standardised
mortality rate per 100,000 and
number of deaths
M
M
Age group
1+, 1-4, 5-14,
15-34, 35-64,
65-74, 75+
1+, 1-4, 5-14,
15-34, 35-64,
65-74, 75+
All ages,
<75
All ages
All ages,
<75
Organisation
(see glossary)
Current
data
E&W, E, GOR,
ONS area, SHA,
LA, PCO, CTY
E&W, E, GOR,
ONS area, SHA,
LA, PCO, CTY
E&W, E, GOR,
ONS area, SHA,
LA, PCO, CTY
2008
18B_148NO_08_V1
2006-08
18B_148CR_08_V1
2006-08
18B_148SM00++_08_V1
18B_148SM0074_08_V1
E&W, E, GOR,
ONS area, SHA,
LA, PCO, CTY
2006-08
All ages
Trend
data
File-worksheet name
1993-08 18B_148SMT00++_08_V1
18B_148DR00++_08_V1
18B_148DR0074_08_V1
1993-08 18B_148DRT00++_08_V1
Numerator:
Numerator data - Deaths from prostate cancer, classified by underlying cause of death (ICD-10 C61, ICD-9 185
adjusted), registered in the respective calendar year(s).
Source of numerator data - Office for National Statistics (ONS).
Comments on numerator data - Mortality data for years 1993-2006 were extracted by ONS in June 2007 with
organisational codes assigned using the postcode of usual residence and the November 2006 edition of the
National Statistics Postcode Directory (NSPD). Data for subsequent years were extracted in June of the following
year using the respective year’s November edition of the NSPD.
In January 2001, the ONS implemented a change from ICD-9 to ICD-10 for coding causes of death in England &
Wales. As part of an exercise to investigate the effects of this change, the ONS also re-coded all deaths registered
in 1999. Deaths for years prior to 1999 and for year 2000 have not been re-coded.
For current analysis, therefore, all data are based on ICD-10.
For trend analysis, the numbers of deaths observed in the years 1993-98 and 2000 must be adjusted to give
“expected” numbers of deaths which would have been coded to this cause in ICD-10. This is done by multiplying
the ICD-9 based death counts by the appropriate ICD-10/9 comparability ratio published by the ONS. Trend data
cannot include years prior to 1993, because the ONS introduced automated coding in 1993, and the comparability
ratios are only valid from this point onwards.
For this indicator the following ICD-10/9 comparability ratios were used:
Males
0-74yrs: 1.008
75-84yrs: 1.031
85+yrs: 1.09
From the 2003 Compendium onwards, data are based on the original causes of death rather than the final causes
used in earlier Compendia.
See Annex 2 for more details.
Denominator:
Denominator data - 2001 Census based mid-year population estimates for the respective calendar years.
Source of denominator data - ONS.
302
Comments on denominator data - Data are based on the latest revisions of ONS mid-year population estimates for
the respective years, current as at 1 October 2009.
Statistical methods:
Annex 2: Changes to Office for National Statistics mortality data
Annex 3: Explanations of statistical methods used in the Compendium
Interpretation of indicators:
Quality of indicator - Annex 12 describes the criteria that should be used to judge the quality of this indicator. The
application of the criteria is dependent on the context (e.g. describing a single organisation, comparing several
organisations) and the level (e.g. national / regional with large numbers of events, local with small numbers of
events) at which the data are to be used.
Further reading:
1.
2.
3.
4.
5.
6.
7.
Department of Health. The NHS cancer plan and the new NHS: Providing a patient-centred service. London:
Department of Health, 2004.
World Health Organization. WHO Framework on Tobacco Control. Geneva: World Health Organization, 2003.
Available at http://www.who.int/tobacco/fctc/text/en/fctc_en.pdf
NHS Executive. Manual of Cancer Services Standards. London: NHS Executive, 2000.
Department of Health. NHS Cancer Plan. London: Department of Health, 2000.
Department of Health. Saving lives: Our Healthier Nation. London: The Stationery Office, 1999.
World Bank. Economics of Tobacco Control. Washington: World Bank, 1999. Available at:
http://www1.worldbank.org/tobacco/book/pdf/tobacco.pdf
Department of Health. Smoking kills – a White Paper on tobacco. London: The Stationery Office, 1998.
Updated: December 2009
303
Survival following diagnosis of prostate cancer
Purpose:
To provide comparative measures of the outcome of cancer treatment by area of residence, using geographical
variations in cancer survival. Cancer survival is a key operational measure of the success of cancer treatment
services. The principle of equity of access to optimal standards of National Health Service (NHS) cancer treatment
was explicitly endorsed in the Calman-Hine report of 1995, which noted: "All patients should have access to a
uniformly high quality of care in the community or hospital wherever they may live to ensure the maximum possible
1
cure rates and best quality of life" . A further policy document stated that from April 1999, patients with suspected
breast cancer "will be able to see a specialist within two weeks of their GP deciding they need to be seen urgently,
2
and requesting an appointment" . Similar commitments have come into force for other cancers since April 2000.
These policies are expected to lead to earlier diagnosis for all patients and more equitable access to treatment.
The NHS Cancer Plan extended these commitments to improve cancer survival in England to amongst the best in
3
Europe . Cancer survival rates are outcome measures that can form part of the baseline for monitoring the future
impact of these policies. Geographic differences in cancer survival are expected to decline over time if policy goals
are achieved.
Definition of indicator and its variants:
Relative survival rate at one and five years after diagnosis for patients diagnosed in England during 2001-03 and
followed up to the end of the year 2008. Cancer patients have higher mortality than the general population, but
they do not all die of cancer. The relative survival rate is the ratio of the survival rate actually observed among the
cancer patients and the survival rate that would have been expected if they had only had the same overall
mortality rates as the general population. Thus, if five-year survival is 60% among a group of cancer patients of
whom 90% would have been expected to survive that long, the relative survival is 67% (60/90). By convention,
relative survival is described as a rate, although strictly it is a ratio of two percentages.
Statistic
Number and one-year relative
survival rate (%)
Number and five-year relative
survival rate (%)
Sex
Age group
Organisation
(see glossary)
Current
data
Trend
data
File-worksheet name
M
15-99
E, GOR, SHA, CN
2001-03
18C_411PCP1_03_V1
M
15-99
E, GOR, SHA, CN
2001-03
18C_411PCP2_03_V1
Numerator:
Numerator data - Observed survival rate, derived from the distribution of survival times from the date of diagnosis
(of a primary, invasive, malignant neoplasm) to the earliest date among the date of death, the date of emigration,
and the cut-off date of follow-up (31 December 2008), for cancer patients who were diagnosed during 2001-03 and
resident in England at the time of diagnosis. Analyses published prior to the July 2009 Compendium release
include only first primary malignancies. From the July 2009 release onwards, higher order primary malignancies
are also retained. The geographical area of each patient is defined by residence at the time of diagnosis. Records
with faulty data, and those of patients diagnosed with in situ tumours, tumours uncertain as to whether benign or
malignant, metastatic, or uncertain whether primary or metastatic, are excluded from analysis.
Source of numerator data - National Cancer Intelligence Centre (NCIC), Office for National Statistics (ONS)
derived from NHS regional cancer registries; National Health Service Central Register.
Comments on numerator data Denominator:
Denominator data - The expected survival rate among the cancer patients, derived from life tables specific for the
calendar year of death, single year of age, sex, Government Office Region of residence and deprivation.
Source of denominator data - Office for National Statistics (ONS).
Statistical methods:
The cumulative probability of death at a given time since diagnosis, relative to the corresponding probability in the
general population, is estimated by comparing the death rates among the cancer patients in successive intervals
4
of time since diagnosis with the all-causes death rate in the general population for the same sex and age group .
This is derived from life tables for the Government Office Region in which the patient lives. Life tables were
created that were specific for calendar year of death, single year of age, sex, Government Office Region and
deprivation. Life tables were constructed for the years 1991, 2001 and 2005 using ONS mid-year population
estimates and the mean annual number of deaths in the three years centred on those index years. Life tables for
304
the intervening years were then created by linear interpolation. The life tables for 2005 were used for years 2006
to 2008 without interpolation.
The relative survival rates for the pooled three-year time period have been directly age-standardised to take into
account any variation in relative survival by age. The standard population used is the number of persons who were
diagnosed with the particular cancer under consideration in England and Wales during the period 1986-90. These
were broken down into three age (at diagnosis) groups: 15-69, 70-79, and 80-99 years.
Rates for different cancers are standardised using different standard populations, and in some instances different
age groupings, and should therefore not be compared.
Annex 3 of the Compendium User Guide: Explanations of statistical methods used in the Compendium.
Interpretation of indicators:
Type of Indicator - The relative survival rate can be interpreted as an estimate of the proportion of cancer patients
who die of their disease, after adjustment for death from other causes. A relative survival rate of 100% for a given
period would imply that the cancer patients had had the same survival (or death) rates as the general population,
not that they had all survived. Similarly, if the relative survival rate remains constant at (say) ten or more years
after diagnosis, this implies that the ten-year survivors no longer have higher mortality than the general population.
Quality of indicator - Annex 12 of the Compendium User Guide describes the criteria that should be used to judge
the quality of this indicator. The application of the criteria is dependent on the context (e.g. describing a single
organisation, comparing several organisations) and the level (e.g. national / regional with large numbers of events,
local with small numbers of events) at which the data are to be used.
Potential value of indicator:
Cancer survival is a broad indicator - differences may be due to a range of factors, of which the quality of
treatment is only one. Differences in cancer survival between geographical areas should therefore be the origin of
further enquiry, not the basis for simplistic conclusions about the efficacy of cancer treatment. The geographical
area of residence at cancer diagnosis is a proxy for several aspects of health care, including the quality of primary
care, the speed of referral and the quality of treatment services. It may also be a proxy for other factors, not readily
measured, such as the degree of understanding of cancer symptoms and what to do about them among the local
population, variations in the extent of disease at diagnosis (stage) and in the histology and grade of tumours, and
artefacts in the data. If geographical survival differences can be attributed to differences in knowledge of cancer or
the extent of disease at diagnosis, public health responses could be organised. Differences in cancer survival
between geographical areas may also "turn out to be due to the persistence of outmoded practices, or other
remediable deficiencies in service provision or therapeutic regimes, and correcting these should lead to an
5
improvement in overall standards of care" .
Further reading:
6
A comprehensive monograph on cancer survival in England and Wales has been published , covering 2.9 million
patients diagnosed with one of 47 adult cancers and 11 childhood cancers during 1971-90, and followed up to the
end of 1995. It includes comprehensive analyses by age, sex, and NHS Region, and by socio-economic status (in
five categories from affluent to deprived). Updated results for England and Wales have been published in 2004
and 2008 with a chapter for each of the 21 most common cancers. 7, 8 More limited analyses have also been
published for cancer patients diagnosed during 1991-93 and followed up to 1998, and diagnosed during 1993-95
and followed up to 2000. 9, 10 Five-year age-standardised relative survival rates for 21 major cancers based on
11
diagnoses in five year periods between 1998 and 2007 are available on the National Statistics website. An early
12
assessment of the impact of the NHS National Cancer Plan on relative survival has been published. An all13
cancer relative survival index for patients diagnosed 1991-2006 has been presented by PCT in England. Cancer
survival by Cancer Network has been presented for patients diagnosed with one of six cancers 1991-2006.13
1.
2.
3.
4.
5.
6.
7.
Expert Advisory Group on Cancer. A policy framework for commissioning cancer services. London:
Department of Health, 1995.
NHS Executive. The new NHS. Modern. Dependable. London: Department of Health, 1997.
Department of Health. The NHS Cancer Plan: three-year progress report - maintaining the momentum.
London: Department of Health, 2003.
Estève J, Benhamou E, Croasdale M, Raymond L. Relative survival and the estimation of net survival:
elements for further discussion. Stat Med 1990; 9: 529-38.
Clinical Outcomes Working Group. Clinical outcome indicators, July 1996. Edinburgh: The Scottish Office,
1996.
Coleman M.P, Babb P, Damiecki P, Grosclaude P, Honjo S, Jones J et al. Cancer survival trends in England
and Wales 1971-1995: deprivation and NHS Region. Series SMPS No.61. London: The Stationery Office,
1999, 1-695.
Coleman M.P, Rachet B, Woods L.M, Mitry E, Riga M, Cooper N et al. Trends and socioeconomic inequalities
in cancer survival in England and Wales up to 2001. British Journal of Cancer 2004; 90:1367-1373.
305
8.
9.
10.
11.
12.
13.
Rowan S, Rachet B, Alexe D.M, Cooper N, Coleman M.P. Survival from prostate cancer in England & Wales
up to 2001. British Journal of Cancer 2008; 99:S75-S77.
Coleman M.P, Babb P, Harris S, Quinn M.J, Sloggett A, De Stavola B.L. Cancer survival in England and
Wales, 1991-1998. Office for National Statistics Health Statistics Quarterly 2000; 6: 71-80.
Office for National Statistics. Cancer survival in the health authorities of England,1993-2000. Report. Office for
National Statistics Health Statistics Quarterly 2002;13: 95-103.
Office for National Statistics. Survival Rates in England and Wales, 1998-2001, 1999-2002, 1999-03; Survival
Rates in England 2000-04, 2001-06. National Statistics website. Available at:
http://www.statistics.gov.uk/StatBase/Product.asp?vlnk=14007&Pos=3&ColRank=1&Rank=422 , accessed 16
September 2010.
Rachet B, Maringe C, Nur U, Quaresma M, Shah A, Woods LM, et al. Population-based cancer survival trends
in England and Wales up to 2007: an assessment of the NHS cancer plan for England. Lancet Oncol
2009;10:351-69.
Office for National Statistics. Cancer survival by cancer network, patients diagnosed 1991-2006, followed up to
2007. National Statistics website. Available at:
http://www.statistics.gov.uk/STATBASE/Product.asp?vlnk=15387. Accessed 15 September 2010.
Updated: October 2010
306
Deaths at home from prostate cancer
Purpose:
To improve palliative care and service planning for cancer patients in the terminal stages of life, allowing more of
them the choice of dying at home.
Definition of indicator and its variants:
The proportion of deaths from prostate cancer (ICD-10 C61) that occur at home.
Statistic
Sex
Age group
Percent of deaths at home
M
All ages
Indirectly age-standardised
deaths at home rate per 100
deaths and number of deaths
at home
M
All ages
Organisation
(see glossary)
Current
data
E&W, E, GOR, ONS 2006-08
area, SHA, LA,
PCO, CTY
E&W, E, GOR, ONS 2006-08
area, SHA, LA,
PCO, CTY
Trend
data
File-worksheet name
18D_197PC_08_V1
18D_197ISR_08_V1
Numerator:
Numerator data - Deaths at home from prostate cancer, classified by underlying cause of death (ICD-10 C61),
registered in the respective calendar year(s).
Source of numerator data - Office for National Statistics (ONS).
Comments on numerator data - Mortality data for years 1993-2006 were extracted by ONS in June 2007 with
organisational codes assigned using the postcode of usual residence and the November 2006 edition of the
National Statistics Postcode Directory (NSPD). Data for subsequent years were extracted in June of the following
year using the respective year’s November edition of the NSPD.
Information about the place of death is found on the mortality record in the communal establishment field. It
contains one of:
•
•
•
a 5 digit code identifying a communal establishment or institution (e.g. hospital, nursing home, residential
home);
an “H” code which indicates that the person is certified as having died at their home address and that this
is not a communal establishment or;
an “E” code which indicates that the person died elsewhere.
The communal establishments are themselves classified into 84 categories (e.g. general hospital, mental nursing
home, nursing home etc) and can be further distinguished by whether they are an NHS or Non-NHS
establishment.
It is currently ONS practice to include nursing homes with hospitals under a broader group - “Other hospitals and
communal establishments for the care of the sick” - and also to include residential homes under “Other communal
establishments”. This is because of concerns highlighted by the ONS regarding the accuracy of the recorded
status of some communal establishments, particularly nursing homes and residential homes.
It is therefore not possible to include nursing home or residential home deaths as a “home” death. For this
indicator, a “home” death is defined as one that has the ”H” code in the communal establishment field, i.e. where
the death has occurred at the home address and that address is not a communal establishment.
Denominator:
Denominator data - All deaths from prostate cancer, classified by underlying cause of death (ICD-10 C61),
registered in the respective calendar year(s).
Source of denominator data - ONS.
Comments on denominator data - Includes deaths in all categories of communal establishment code, i.e. deaths in
all communal establishments, at home, and elsewhere.
From the 2003 Compendium onwards, data are based on the original causes of death rather than the final causes
used in earlier Compendia. See Annex 2 for more details.
307
Statistical methods:
The age-standardised deaths at home rate utilises the indirect method of standardisation. The direct method was
found not to be robust as it was affected by small numerator and denominator counts in specific age groups.
Indirect standardisation requires the computation of the ratio of an area’s observed number of events to its
expected number of events if it had experienced the standard age-specific rates. This age-standardised ratio can
be converted into a rate by multiplying it by the crude rate of the standard population.
The standard rates used are those of England for the respective calendar year(s). Male and female rates have
been standardised separately. The rate for persons is standardised for both age and sex.
This methodology is similar to that used for the Clinical Indicators and is described in detail in:
Annex 3: Explanations of statistical methods used in the Compendium (under the sections entitled “Indirectly
Standardised Rates For Clinical Indicators” and “Confidence Intervals Of Indirectly Standardised Rates For Clinical
Indicators”).
Interpretation of indicators:
Type of Indicator - This is a condition-specific cross-sectional comparative indicator reflecting events which act as
a proxy for outcome (quality of dying). In the absence of an absolute standard, comparative data are useful for
monitoring in relation to rates achieved in comparable areas.
Quality of indicator – Annex 12 describes the criteria that should be used to judge the quality of this indicator. The
application of the criteria is dependent on the context (e.g. describing a single organisation, comparing several
organisations) and the level (e.g. national / regional with large numbers of events, local with small numbers of
events) at which the data are to be used.
Confidence Intervals - 95%. Some of the values and factors influencing them may be chance occurrences, with
values fluctuating at random between organisations and from year to year. Numbers of deaths may be small at
individual organisational level. The results should therefore be interpreted with caution and with the aid of
confidence intervals. The 95% confidence interval provides a measure of the statistical precision of the rate for an
area or institution. It indicates a range which, with 95% probability, will contain the underlying value of the
indicator. If the confidence interval for an organisation’s rate is outside the range of the national confidence
intervals, the difference between the two rates is considered statistically significant. If the confidence intervals for
two rates overlap, in most cases the difference between the rates would not be considered statistically significant.
Effect of Case-Mix / severity - Severity of the cancer and need for hospital care have implications for those who
wish to die at home being able to do so. The data available do not allow adjustment for these factors.
Other Potential Confounding Factors - A number of factors outside the control of the NHS such as personal
choice, availability of hospices, and family/community support may contribute to the variation shown by the
indicator.
Relevant National initiatives:
1.
2.
3.
4.
Department of Health. End of life care strategy : Promoting high quality care for all adults at the end of life.
London: Department of Health , 2008.
http://www.dh.gov.uk/en/Publicationsandstatistics/Publications/PublicationsPolicyAndGuidance/DH_086277
Department of Health. The NHS cancer plan and the new NHS: Providing a patient-centred service. London:
Department of Health, 2004.
Department of Health. Pioneering Schemes Named Best of the Best. NHS Beacons – Part of a Concerted
Campaign to Improve Cancer Services. Department of Health, 1999. Press release: reference 1999/0375
Commission for Health Improvement. NHS Cancer Care in England and Wales. National Service Framework
Assessments No.1. London: Commission for Health Improvement, 2001.
Further reading:
1.
2.
3.
Higginson I.J, Thompson M. Children and young people who die from cancer: epidemiology and place of
death in England (1995-9). British Medical Journal 2003; 327: 478-479.
Grande GE, Todd CJ, Barclay SIG, Farquhar MC. Does hospital at home for palliative care facilitate death at
home? Randomised controlled trial. British Medical Journal 1999; 319: 1472-1475.
Higginson I.J, Jarman B, Astin P, Dolan S. Do social factors affect where patients die: an analysis of 10 years
of cancer deaths in England. Journal of Public Health Medicine 1999; 21(1): 23-28.
Updated: December 2009
308
Years of life lost due to mortality from prostate cancer
Purpose:
Years of life lost (YLL) is a measure of premature mortality. Its primary purpose is to compare the relative
importance of different causes of premature death within a particular population and it can therefore be used by
health planners to define priorities for the prevention of such deaths. It can also be used to compare the premature
mortality experience of different populations for a particular cause of death. The concept of years of life lost is to
estimate the length of time a person would have lived had they not died prematurely. By inherently including the
age at which the death occurs, rather than just the fact of its occurrence, the calculation is an attempt to better
quantify the burden, or impact, on society from the specified cause of mortality.
Definition of indicator and its variants:
Years of life lost due to mortality from prostate cancer (ICD-10 C61).
Statistic
Sex
Age group
Crude rate per 10,000
population and number of
years of life lost
Directly age-standardised rate
per 10,000 population and
number of deaths
M
<75
M
<75
Organisation
(see glossary)
Current
data
Trend
data
File-worksheet name
E&W, E, GOR,
ONS area, SHA,
LA, PCO, CTY
E&W, E, GOR,
ONS area, SHA,
LA, PCO, CTY
2006-08
18E_053CR_08_V1
2006-08
18E_053DR_08_V1
Numerator:
Numerator data – Years of life lost and deaths from prostate cancer classified by underlying cause of death (ICD10 C61), registered in the respective calendar year(s).
Source of numerator data – Office for National Statistics (ONS).
Comments on numerator data – The number of years of life lost is calculated by summing over ages 1 to 74 years
the number of deaths at each age multiplied by the number of years of life remaining up to age 75 years. Infant
deaths are omitted as they are mostly a result of causes specific to this age group and have different aetiologies to
deaths later in life.
The numerator presented alongside the sdirecgtly age-tandardised years of life lost rate is the number of deaths
rather than the number of years of life lost. This is because the standardisation calculation has been performed
using 5-year age bands. In each age band the number of deaths is weighted by the number of years of life
remaining from the mid-point of the age band up to age 75 years. See annex 3 for more details.
Mortality data for years 1993-2006 were extracted by ONS in June 2007 with organisational codes assigned using
the postcode of usual residence and the November 2006 edition of the National Statistics Postcode Directory
(NSPD). Data for subsequent years were extracted in June of the following year using the respective year’s
November edition of the NSPD.
In January 2001, the ONS implemented a change from ICD-9 to ICD-10 for coding causes of death in England &
Wales. As part of an exercise to investigate the effects of this change, the ONS also re-coded all deaths registered
in 1999. Deaths for years prior to 1999 and for year 2000 have not been re-coded.
For current analysis, therefore, all data are based on ICD-10.
From the 2003 Compendium onwards, data are based on the original causes of death rather than the final causes
used in earlier Compendia.
See Annex 2 for more details.
Denominator:
Denominator data - 2001 Census based mid-year population estimates for the respective calendar years.
Source of denominator data - ONS.
Comments on denominator data - Data are based on the latest revisions of ONS mid-year population estimates for
the respective years, current as at 1 October 2009.
309
Statistical methods:
Annex 2: Changes to Office for National Statistics mortality data
Annex 3: Explanations of statistical methods used in the Compendium
Annex 5: European Standard Population
Interpretation of indicators:
Quality of indicator - Annex 12 describes the criteria that should be used to judge the quality of this indicator. The
application of the criteria is dependent on the context (e.g. describing a single organisation, comparing several
organisations) and the level (e.g. national / regional with large numbers of events, local with small numbers of
events) at which the data are to be used.
Further reading:
1.
2.
3.
4.
5.
6.
7.
Department of Health. The NHS cancer plan and the new NHS: Providing a patient-centred service. London:
Department of Health, 2004.
World Health Organization. WHO Framework on Tobacco Control. Geneva: World Health Organization, 2003.
Available at http://www.who.int/tobacco/fctc/text/en/fctc_en.pdf
NHS Executive. Manual of Cancer Services Standards. London: NHS Executive, 2000.
Department of Health. NHS Cancer Plan. London: Department of Health, 2000.
Department of Health. Saving lives: Our Healthier Nation. London: The Stationery Office, 1999.
World Bank. Economics of Tobacco Control. Washington: World Bank, 1999. Available at:
http://www1.worldbank.org/tobacco/book/pdf/tobacco.pdf
Department of Health. Smoking kills – a White Paper on tobacco. London: The Stationery Office, 1998.
Updated: December 2009
310
Incidence of malignant melanoma
Purpose:
To reduce the incidence of malignant melanoma.
Definition of indicator and its variants:
Registrations for malignant melanoma (ICD-10 C43 equivalent to ICD-9 172).
Statistic
Indirectly age-standardised
registration ratio (SRR) and
number of registrations
Directly age-standardised
registration rate and number of
registrations
Sex
Age group
Organisation
(see glossary)
Current
data
MFP All ages
<75
E&W, E, GOR, ONS 2004-06
area, SHA, LA, PCO
All ages
MFP All ages
<75
E&W, E, GOR, ONS 2004-06
area, SHA, LA, PCO
All ages
Trend
data
File-worksheet name
15A_150SR00++_06_V1
15A_150SR0074_06_V1
1993-06 15A_150SRT00++_06_V1
15A_150DR00++_06_V1
15A_150DR0074_06_V1
1993-06 15A_150DRT00++_06_V1
Numerator:
Numerator data - Cancer registrations for malignant melanoma (ICD-10 C43, ICD-9 172) in the respective
calendar years.
Source of numerator data - Regional Cancer Registries and Office for National Statistics (ONS).
Comments on numerator data - Registration data for years 1993-2005 were extracted by ONS in November 2008.
Data for 2006 are as registered by the end of September 2008. For all data organisational codes were assigned
using the postcode of usual residence and the August 2008 edition of the National Statistics Postcode Directory.
Results in the current Compendium may differ from those of previous issues because of changes in methodology
to extract data by area, and also because of data enhancements by ONS. Cancer registrations are also
continuously being updated retrospectively and ONS records may have been updated since previous analyses.
The directly age-standardised registration rate for skin cancer for persons of all ages was a target indicator in the
Health of the Nation strategy (See “Further reading”).
Denominator:
Denominator data - 2001 Census based mid-year population estimates for the respective calendar years.
Source of denominator data - ONS.
Comments on denominator data - Data are based on the latest revisions of ONS mid-year population estimates for
the respective years, current as at 29 September 2008.
Statistical methods:
Annex 3: Explanations of statistical methods used in the Compendium
Annex 5: European Standard Population
Interpretation of indicators:
Quality of indicator – Annex 12 describes the criteria that should be used to judge the quality of this indicator. The
application of the criteria is dependent on the context (e.g. describing a single organisation, comparing several
organisations) and the level (e.g. national / regional with large numbers of events, local with small numbers of
events) at which the data are to be used.
Further reading:
1.
2.
Department of Health. The NHS cancer plan and the new NHS: Providing a patient-centred service. London:
Department of Health, 2004.
Department of Health. The Health of the Nation: A Strategy for Health in England. London: Her Majesty’s
Stationery Office, 1992.
Updated: May 2009
311
Incidence of skin cancers other than malignant melanoma
Purpose:
To reduce the incidence of skin cancers other than malignant melanoma.
Definition of indicator and its variants:
Registrations for skin cancers other than malignant melanoma (ICD-10 C44 equivalent to ICD-9 173).
Statistic
Indirectly age-standardised
registration ratio (SRR) and
number of registrations
Directly age-standardised
registration rate and number of
registrations
Sex
Age group
Organisation
(see glossary)
Current
data
MFP All ages
<75
E&W, E, GOR, ONS 2004-06
area, SHA, LA, PCO
All ages
MFP All ages
<75
E&W, E, GOR, ONS 2004-06
area, SHA, LA, PCO
All ages
Trend
data
File-worksheet name
15B_151SR00++_06_V1
15B_151SR0074_06_V1
1993-06 15B_151SRT00++_06_V1
15B_151DR00++_06_V1
15B_151DR0074_06_V1
1993-06 15B_151DRT00++_06_V1
Numerator:
Numerator data - Cancer registrations for skin cancers other than malignant melanoma (ICD-10 C44, ICD-9 173)
in the respective calendar years.
Source of numerator data - Regional Cancer Registries and Office for National Statistics (ONS).
Comments on numerator data - Registration data for years 1993-2005 were extracted by ONS in November 2008.
Data for 2006 are as registered by the end of September 2008. For all data organisational codes were assigned
using the postcode of usual residence and the August 2008 edition of the National Statistics Postcode Directory.
Results in the current Compendium may differ from those of previous issues because of changes in methodology
to extract data by area, and also because of data enhancements by ONS. Cancer registrations are also
continuously being updated retrospectively and ONS records may have been updated since previous analyses.
Skin cancers other than malignant melanoma (ICD-10 C44, ICD-9 173) are believed to be greatly under reported.
The registration of such cancers varies widely between the regional registries and depends on their ability to
access out-patient records and general practioners.
The directly age-standardised registration rate for skin cancer for persons of all ages was a target indicator in the
Health of the Nation strategy (See “Further reading”).
Denominator:
Denominator data - 2001 Census based mid-year population estimates for the respective calendar years.
Source of denominator data - ONS.
Comments on denominator data - Data are based on the latest revisions of ONS mid-year population estimates for
the respective years, current as at 29 September 2008.
Statistical methods:
Annex 3: Explanations of statistical methods used in the Compendium
Annex 5: European Standard Population
Interpretation of indicators:
Quality of indicator - Annex 12 describes the criteria that should be used to judge the quality of this indicator. The
application of the criteria is dependent on the context (e.g. describing a single organisation, comparing several
organisations) and the level (e.g. national / regional with large numbers of events, local with small numbers of
events) at which the data are to be used.
Further reading:
1.
Department of Health. The NHS cancer plan and the new NHS: Providing a patient-centred service. London:
Department of Health, 2004.
312
2.
Department of Health. The Health of the Nation: A Strategy for Health in England. London: Her Majesty’s
Stationery Office, 1992.
Updated: September 2009
313
Incidence of all skin cancers
Purpose:
To reduce the incidence of skin cancer.
Definition of indicator and its variants:
Registrations for all skin cancers (ICD-10 C43-C44 equivalent to ICD-9 172-173).
Statistic
Indirectly age-standardised
registration ratio (SRR) and
number of registrations
Directly age-standardised
registration rate and number of
registrations
Sex
Age group
Organisation
(see glossary)
Current
data
MFP All ages
<75
E&W, E, GOR, ONS 2004-06
area, SHA, LA, PCO
All ages
MFP All ages
<75
E&W, E, GOR, ONS 2004-06
area, SHA, LA, PCO
All ages
Trend
data
File-worksheet name
15C_176SR00++_06_V1
15C_176SR0074_06_V1
1993-06 15C_176SRT00++_06_V1
15C_176DR00++_06_V1
15C_176DR0074_06_V1
1993-06 15C_176DRT00++_06_V1
Numerator:
Numerator data - Cancer registrations for all skin cancers (ICD-10 C43-C44, ICD-9 172-173) in the respective
calendar years.
Source of numerator data - Regional Cancer Registries and Office for National Statistics (ONS).
Comments on numerator data - Registration data for years 1993-2005 were extracted by ONS in November 2008.
Data for 2006 are as registered by the end of September 2008. For all data organisational codes were assigned
using the postcode of usual residence and the August 2008 edition of the National Statistics Postcode Directory.
Results in the current Compendium may differ from those of previous issues because of changes in methodology
to extract data by area, and also because of data enhancements by ONS. Cancer registrations are also
continuously being updated retrospectively and ONS records may have been updated since previous analyses.
Skin cancers other than malignant melanoma (ICD-10 C44, ICD-9 173) are believed to be greatly under reported.
The registration of such cancers varies widely between the regional registries and depends on their ability to
access out-patient records and general practioners.
The directly age-standardised registration rate for skin cancer for persons of all ages was a target indicator in the
Health of the Nation strategy (See “Further reading”).
Denominator:
Denominator data - 2001 Census based mid-year population estimates for the respective calendar years.
Source of denominator data - ONS.
Comments on denominator data - Data are based on the latest revisions of ONS mid-year population estimates for
the respective years, current as at 29 September 2008.
Statistical methods:
Annex 3: Explanations of statistical methods used in the Compendium
Annex 5: European Standard Population
Interpretation of indicators:
Quality of indicator - Annex 12 describes the criteria that should be used to judge the quality of this indicator. The
application of the criteria is dependent on the context (e.g. describing a single organisation, comparing several
organisations) and the level (e.g. national / regional with large numbers of events, local with small numbers of
events) at which the data are to be used.
Further reading:
1.
Department of Health. Health of the Nation - A Strategy for Health in England. London: Her Majesty’s
Stationery Office, 1992.
314
Updated: September 2009
315
Mortality from malignant melanoma
Purpose:
To reduce deaths from malignant melanoma.
Definition of indicator and its variants:
Mortality from malignant melanoma (ICD-10 C43 equivalent to ICD-9 172).
Statistic
Number of deaths
Average age-specific death
rate per 100,000 resident
population
Indirectly age-standardised
mortality ratio (SMR) and
number of deaths
Directly age-standardised
mortality rate per 100,000 and
number of deaths
Sex
Age group
MFP 1+, 1-4, 5-14,
15-34, 35-64,
65-74, 75+
MFP 1+, 1-4, 5-14,
15-34, 35-64,
65-74, 75+
MFP All ages,
<75
All ages
MFP All ages,
<75
Organisation
(see glossary)
Current
data
E&W, E, GOR,
ONS area, SHA,
LA, PCO, CTY
E&W, E, GOR,
ONS area, SHA,
LA, PCO, CTY
E&W, E, GOR,
ONS area, SHA,
LA, PCO, CTY
2008
15D_152NO_08_V1
2006-08
15D_152CR_08_V1
2006-08
15D_152SM00++_08_V1
15D_152SM0074_08_V1
E&W, E, GOR,
ONS area, SHA,
LA, PCO, CTY
All ages
2006-08
Trend
data
File-worksheet name
1993-08 15D_152SMT00++_08_V1
15D_152DR00++_08_V1
15D_152DR0074_08_V1
1993-08 15D_152DRT00++_08_V1
Numerator:
Numerator data - Deaths from malignant melanoma, classified by underlying cause of death (ICD-10 C43, ICD-9
172 adjusted), registered in the respective calendar year(s).
Source of numerator data - Office for National Statistics (ONS).
Comments on numerator data - Mortality data for years 1993-2006 were extracted by ONS in June 2007 with
organisational codes assigned using the postcode of usual residence and the November 2006 edition of the
National Statistics Postcode Directory (NSPD). Data for subsequent years were extracted in June of the following
year using the respective year’s November edition of the NSPD.
In January 2001, the ONS implemented a change from ICD-9 to ICD-10 for coding causes of death in England &
Wales. As part of an exercise to investigate the effects of this change, the ONS also re-coded all deaths registered
in 1999. Deaths for years prior to 1999 and for year 2000 have not been re-coded.
For current analysis, therefore, all data are based on ICD-10.
For trend analysis, the numbers of deaths observed in the years 1993-98 and 2000 must be adjusted to give
“expected” numbers of deaths which would have been coded to this cause in ICD-10. This is done by multiplying
the ICD-9 based death counts by the appropriate ICD-10/9 comparability ratio published by the ONS. Trend data
cannot include years prior to 1993, because the ONS introduced automated coding in 1993, and the comparability
ratios are only valid from this point onwards.
For this indicator the following ICD-10/9 comparability ratios were used:
Males
Females
All Ages: 0.966
All Ages: 0.955
Adjusted person counts are the sum of the adjusted male and female counts. Once adjusted, the counts are used
to calculate rates in the usual way.
From the 2003 Compendium onwards, data are based on the original causes of death rather than the final causes
used in earlier Compendia.
See Annex 2 for more details.
Denominator:
Denominator data - 2001 Census based mid-year population estimates for the respective calendar years.
316
Source of denominator data - ONS.
Comments on denominator data - Data are based on the latest revisions of ONS mid-year population estimates for
the respective years, current as at 1 October 2009.
Statistical methods:
Annex 2: Changes to Office for National Statistics mortality data
Annex 3: Explanations of statistical methods used in the Compendium
Interpretation of indicators:
Quality of indicator - Annex 12 describes the criteria that should be used to judge the quality of this indicator. The
application of the criteria is dependent on the context (e.g. describing a single organisation, comparing several
organisations) and the level (e.g. national / regional with large numbers of events, local with small numbers of
events) at which the data are to be used.
Further reading:
1.
2.
3.
4.
5.
6.
7.
8.
Department of Health. The NHS cancer plan and the new NHS: Providing a patient-centred service. London:
Department of Health, 2004.
Brock A, Griffiths C. Trends in the mortality of young adults aged 15-44 in England and Wales, 1961-2001.
Office for National Statistics Health Statistics Quarterly, No. 19, 2003: 22-31. Available at:
http://www.statistics.gov.uk/downloads/theme_health/HSQ19.pdf
World Health Organization. WHO Framework on Tobacco Control. Geneva: World Health Organization, 2003.
Available at: http://www.who.int/tobacco/fctc/text/en/fctc_en.pdf
NHS Executive. Manual of Cancer Services Standards. London: NHS Executive, 2000.
Department of Health. NHS Cancer Plan. London: Department of Health, 2000.
Department of Health. Saving lives: Our Healthier Nation. London: The Stationery Office, 1999.
World Bank. Economics of Tobacco Control. Washington: World Bank, 1999. Available at:
http://www1.worldbank.org/tobacco/book/pdf/tobacco.pdf
Department of Health. Smoking kills – a White Paper on tobacco. London: The Stationery Office, 1998.
Updated: December 2009
317
Mortality from skin cancers other than malignant melanoma
Purpose:
To reduce deaths from skin cancers other than malignant melanoma.
Definition of indicator and its variants:
Mortality from skin cancers other than malignant melanoma (ICD-10 C44 equivalent to ICD-9 173).
Statistic
Number of deaths
Average age-specific death
rate per 100,000 resident
population
Indirectly age-standardised
mortality ratio (SMR) and
number of deaths
Directly age-standardised
mortality rate per 100,000 and
number of deaths
Sex
Age group
MFP 1+, 1-4, 5-14,
15-34, 35-64,
65-74, 75+
MFP 1+, 1-4, 5-14,
15-34, 35-64,
65-74, 75+
MFP All ages,
<75
All ages
MFP All ages,
<75
Organisation
(see glossary)
Current
data
E&W, E, GOR,
ONS area, SHA,
LA, PCO, CTY
E&W, E, GOR,
ONS area, SHA,
LA, PCO, CTY
E&W, E, GOR,
ONS area, SHA,
LA, PCO, CTY
2008
15E_153NO_08_V1
2006-08
15E_153CR_08_V1
2006-08
15E_153SM00++_08_V1
15E_153SM0074_08_V1
E&W, E, GOR,
ONS area, SHA,
LA, PCO, CTY
All ages
2006-08
Trend
data
File-worksheet name
1993-08 15E_153SMT00++_08_V1
15E_153DR00++_08_V1
15E_153DR0074_08_V1
1993-08 15E_153DRT00++_08_V1
Numerator:
Numerator data - Deaths from skin cancers other than malignant melanoma, classified by underlying cause of
death (ICD-10 C44, ICD-9 173 adjusted), registered in the respective calendar year(s).
Source of numerator data - Office for National Statistics (ONS)
Comments on numerator data - Mortality data for years 1993-2006 were extracted by ONS in June 2007 with
organisational codes assigned using the postcode of usual residence and the November 2006 edition of the
National Statistics Postcode Directory (NSPD). Data for subsequent years were extracted in June of the following
year using the respective year’s November edition of the NSPD.
In January 2001, the ONS implemented a change from ICD-9 to ICD-10 for coding causes of death in England &
Wales. As part of an exercise to investigate the effects of this change, the ONS also re-coded all deaths registered
in 1999. Deaths for years prior to 1999 and for year 2000 have not been re-coded.
For current analysis, therefore, all data are based on ICD-10.
For trend analysis, the numbers of deaths observed in the years 1993-98 and 2000 must be adjusted to give
“expected” numbers of deaths which would have been coded to this cause in ICD-10. This is done by multiplying
the ICD-9 based death counts by the appropriate ICD-10/9 comparability ratio published by the ONS. Trend data
cannot include years prior to 1993, because the ONS introduced automated coding in 1993, and the comparability
ratios are only valid from this point onwards.
For this indicator the following ICD-10/9 comparability ratios were used:
Males
Females
All Ages: 1
All Ages: 1.14
Adjusted person counts are the sum of the adjusted male and female counts. Once adjusted, the counts are used
to calculate rates in the usual way.
From the 2003 Compendium onwards, data are based on the original causes of death rather than the final causes
used in earlier Compendia.
See Annex 2 for more details.
Denominator:
Denominator data - 2001 Census based mid-year population estimates for the respective calendar years.
318
Source of denominator data - ONS.
Comments on denominator data - Data are based on the latest revisions of ONS mid-year population estimates for
the respective years, current as at 1 October 2009.
Statistical methods:
Annex 2: Changes to Office for National Statistics mortality data
Annex 3: Explanations of statistical methods used in the Compendium
Interpretation of indicators:
Quality of indicator - Annex 12 describes the criteria that should be used to judge the quality of this indicator. The
application of the criteria is dependent on the context (e.g. describing a single organisation, comparing several
organisations) and the level (e.g. national / regional with large numbers of events, local with small numbers of
events) at which the data are to be used.
Further reading:
1.
2.
3.
4.
5.
6.
7.
8.
Department of Health. The NHS cancer plan and the new NHS: Providing a patient-centred service. London:
Department of Health, 2004.
NHS Executive. Manual of Cancer Services Standards. London: NHS Executive, 2000.
Department of Health. NHS Cancer Plan. London: Department of Health, 2000.
Department of Health. Saving lives: Our Healthier Nation. London: The Stationery Office, 1999.
World Bank. Economics of Tobacco Control. Washington: World Bank, 1999.
http://www1.worldbank.org/tobacco/book/pdf/tobacco.pdf
Department of Health. Smoking kills – a White Paper on tobacco. London: The Stationery Office, 1998.
Brock A, Griffiths C. Trends in the mortality of young adults aged 15-44 in England and Wales, 1961-2001.
Office for National Statistics Health Statistics Quarterly, No. 19, 2003: 22-31. Available at:
http://www.statistics.gov.uk/downloads/theme_health/HSQ19.pdf
World Health Organization. WHO Framework on Tobacco Control. Geneva: World Health Organization, 2005.
Updated: December 2009
319
Years of life lost due to mortality from malignant melanoma
Purpose:
Years of life lost (YLL) is a measure of premature mortality. Its primary purpose is to compare the relative
importance of different causes of premature death within a particular population and it can therefore be used by
health planners to define priorities for the prevention of such deaths. It can also be used to compare the premature
mortality experience of different populations for a particular cause of death. The concept of years of life lost is to
estimate the length of time a person would have lived had they not died prematurely. By inherently including the
age at which the death occurs, rather than just the fact of its occurrence, the calculation is an attempt to better
quantify the burden, or impact, on society from the specified cause of mortality.
Definition of indicator and its variants:
Years of life lost due to mortality from malignant melanoma (ICD-10 A00-Y9 C43).
Statistic
Crude rate per 10,000
population and number of
years of life lost
Directly age-standardised rate
per 10,000 population and
number of deaths
Sex
Age group
MFP <75
MFP <75
Organisation
(see glossary)
Current
data
Trend
data
File-worksheet name
E&W, E, GOR,
ONS area, SHA,
LA, PCO, CTY
E&W, E, GOR,
ONS area, SHA,
LA, PCO, CTY
2006-08
15F_056CR_08_V1
2006-08
15F_056DR_08_V1
Numerator:
Numerator data – Years of life lost and deaths from malignant melanoma classified by underlying cause of death
(ICD-10 C43), registered in the respective calendar year(s).
Source of numerator data – Office for National Statistics (ONS).
Comments on numerator data – The number of years of life lost is calculated by summing over ages 1 to 74 years
the number of deaths at each age multiplied by the number of years of life remaining up to age 75 years. Infant
deaths are omitted as they are mostly a result of causes specific to this age group and have different aetiologies to
deaths later in life.
The numerator presented alongside the sdirecgtly age-tandardised years of life lost rate is the number of deaths
rather than the number of years of life lost. This is because the standardisation calculation has been performed
using 5-year age bands. In each age band the number of deaths is weighted by the number of years of life
remaining from the mid-point of the age band up to age 75 years. See annex 3 for more details.
Mortality data for years 1993-2006 were extracted by ONS in June 2007 with organisational codes assigned using
the postcode of usual residence and the November 2006 edition of the National Statistics Postcode Directory
(NSPD). Data for subsequent years were extracted in June of the following year using the respective year’s
November edition of the NSPD.
In January 2001, the ONS implemented a change from ICD-9 to ICD-10 for coding causes of death in England &
Wales. As part of an exercise to investigate the effects of this change, the ONS also re-coded all deaths registered
in 1999. Deaths for years prior to 1999 and for year 2000 have not been re-coded.
For current analysis, therefore, all data are based on ICD-10.
From the 2003 Compendium onwards, data are based on the original causes of death rather than the final causes
used in earlier Compendia.
See Annex 2 for more details.
Denominator:
Denominator data - 2001 Census based mid-year population estimates for the respective calendar years.
Source of denominator data - ONS.
Comments on denominator data - Data are based on the latest revisions of ONS mid-year population estimates for
the respective years, current as at 1 October 2009.
320
Statistical methods:
Annex 2: Changes to Office for National Statistics mortality data
Annex 3: Explanations of statistical methods used in the Compendium
Annex 5: European Standard Population
Interpretation of indicators:
Quality of indicator - Annex 12 describes the criteria that should be used to judge the quality of this indicator. The
application of the criteria is dependent on the context (e.g. describing a single organisation, comparing several
organisations) and the level (e.g. national / regional with large numbers of events, local with small numbers of
events) at which the data are to be used.
Further reading:
1.
2.
3.
4.
5.
6.
7.
8.
Department of Health. The NHS cancer plan and the new NHS: Providing a patient-centred service. London:
Department of Health, 2004.
Brock A, Griffiths C. Trends in the mortality of young adults aged 15-44 in England and Wales, 1961-2001.
Office for National Statistics Health Statistics Quarterly, No. 19, 2003: 22-31. Available at:
http://www.statistics.gov.uk/downloads/theme_health/HSQ19.pdf
World Health Organization. WHO Framework on Tobacco Control. Geneva: World Health Organization, 2003.
Available at: http://www.who.int/tobacco/fctc/text/en/fctc_en.pdf
NHS Executive. Manual of Cancer Services Standards. London: NHS Executive, 2000.
Department of Health. NHS Cancer Plan. London: Department of Health, 2000.
Department of Health. Saving lives: Our Healthier Nation. London: The Stationery Office, 1999.
World Bank. Economics of Tobacco Control. Washington: World Bank, 1999. Available at:
http://www1.worldbank.org/tobacco/book/pdf/tobacco.pdf
Department of Health. Smoking kills – a White Paper on tobacco. London: The Stationery Office, 1998.
Updated: December 2009
321
Years of life lost due to mortality from skin cancers other than malignant melanoma
Purpose:
Years of life lost (YLL) is a measure of premature mortality. Its primary purpose is to compare the relative
importance of different causes of premature death within a particular population and it can therefore be used by
health planners to define priorities for the prevention of such deaths. It can also be used to compare the premature
mortality experience of different populations for a particular cause of death. The concept of years of life lost is to
estimate the length of time a person would have lived had they not died prematurely. By inherently including the
age at which the death occurs, rather than just the fact of its occurrence, the calculation is an attempt to better
quantify the burden, or impact, on society from the specified cause of mortality.
Definition of indicator and its variants:
Years of life lost due to mortality from skin cancers other than malignant melanoma (ICD-10 C44).
Statistic
Crude rate per 10,000
population and number of
years of life lost
Directly age-standardised rate
per 10,000 population and
number of deaths
Sex
Age group
MFP <75
MFP <75
Organisation
(see glossary)
Current
data
Trend
data
File-worksheet name
E&W, E, GOR,
ONS area, SHA,
LA, PCO, CTY
E&W, E, GOR,
ONS area, SHA,
LA, PCO, CTY
2006-08
15G_058CR_08_V1
2006-08
15G_058DR_08_V1
Numerator:
Numerator data – Years of life lost and deaths from skin cancers other than malignant melanoma classified by
underlying cause of death (ICD-10 C44), registered in the respective calendar year(s).
Source of numerator data – Office for National Statistics (ONS).
Comments on numerator data – The number of years of life lost is calculated by summing over ages 1 to 74 years
the number of deaths at each age multiplied by the number of years of life remaining up to age 75 years. Infant
deaths are omitted as they are mostly a result of causes specific to this age group and have different aetiologies to
deaths later in life.
The numerator presented alongside the sdirecgtly age-tandardised years of life lost rate is the number of deaths
rather than the number of years of life lost. This is because the standardisation calculation has been performed
using 5-year age bands. In each age band the number of deaths is weighted by the number of years of life
remaining from the mid-point of the age band up to age 75 years. See annex 3 for more details.
Mortality data for years 1993-2006 were extracted by ONS in June 2007 with organisational codes assigned using
the postcode of usual residence and the November 2006 edition of the National Statistics Postcode Directory
(NSPD). Data for subsequent years were extracted in June of the following year using the respective year’s
November edition of the NSPD.
In January 2001, the ONS implemented a change from ICD-9 to ICD-10 for coding causes of death in England &
Wales. As part of an exercise to investigate the effects of this change, the ONS also re-coded all deaths registered
in 1999. Deaths for years prior to 1999 and for year 2000 have not been re-coded.
For current analysis, therefore, all data are based on ICD-10.
From the 2003 Compendium onwards, data are based on the original causes of death rather than the final causes
used in earlier Compendia.
See Annex 2 for more details.
Denominator:
Denominator data - 2001 Census based mid-year population estimates for the respective calendar years.
Source of denominator data - ONS.
Comments on denominator data - Data are based on the latest revisions of ONS mid-year population estimates for
the respective years, current as at 1 October 2009.
322
Statistical methods:
Annex 2: Changes to Office for National Statistics mortality data
Annex 3: Explanations of statistical methods used in the Compendium
Annex 5: European Standard Population
Interpretation of indicators:
Quality of indicator - Annex 12 describes the criteria that should be used to judge the quality of this indicator. The
application of the criteria is dependent on the context (e.g. describing a single organisation, comparing several
organisations) and the level (e.g. national / regional with large numbers of events, local with small numbers of
events) at which the data are to be used.
Further reading:
1.
2.
3.
4.
5.
6.
7.
8.
Department of Health. The NHS cancer plan and the new NHS: Providing a patient-centred service. London:
Department of Health, 2004.
NHS Executive. Manual of Cancer Services Standards. London: NHS Executive, 2000.
Department of Health. NHS Cancer Plan. London: Department of Health, 2000.
Department of Health. Saving lives: Our Healthier Nation. London: The Stationery Office, 1999.
World Bank. Economics of Tobacco Control. Washington: World Bank, 1999.
http://www1.worldbank.org/tobacco/book/pdf/tobacco.pdf
Department of Health. Smoking kills – a White Paper on tobacco. London: The Stationery Office, 1998.
Brock A, Griffiths C. Trends in the mortality of young adults aged 15-44 in England and Wales, 1961-2001.
Office for National Statistics Health Statistics Quarterly, No. 19, 2003: 22-31. Available at:
http://www.statistics.gov.uk/downloads/theme_health/HSQ19.pdf
World Health Organization. WHO Framework on Tobacco Control. Geneva: World Health Organization, 2005.
Updated: December 2009
323
Incidence of stomach cancer
Purpose:
To reduce the incidence of stomach cancer.
Definition of indicator and its variants:
Registrations for stomach cancer (ICD-10 C16 equivalent to ICD-9 151).
Statistic
Indirectly age-standardised
registration ratio (SRR) and
number of registrations
Directly age-standardised
registration rate and number of
registrations
Sex
Age group
Organisation
(see glossary)
Current
data
MFP All ages
<75
E&W, E, GOR, ONS 2004-06
area, SHA, LA, PCO
All ages
MFP All ages
< 75
E&W, E, GOR, ONS 2004-06
area, SHA, LA, PCO
All ages
E&W, E, GOR, ONS
area, SHA, LA, PCO
Trend
data
File-worksheet name
12A_154SR00++_06_V1
12A_154SR0074_06_V1
1993-06 12A_154SRT00++_06_V1
12A_154DR00++_06_V1
12A_154DR0074_06_V1
1993-06 12A_154DRT00++_06_V1
Numerator:
Numerator data - Cancer registrations for stomach cancer (ICD-10 C16, ICD-9 151) in the respective calendar
years.
Source of numerator data - Regional Cancer Registries and Office for National Statistics (ONS).
Comments on numerator data - Registration data for years 1993-2005 were extracted by ONS in November 2008.
Data for 2006 are as registered by the end of September 2008. For all data organisational codes were assigned
using the postcode of usual residence and the August 2008 edition of the National Statistics Postcode Directory.
Results in the current Compendium may differ from those of previous issues because of changes in methodology
to extract data by area, and also because of data enhancements by ONS. Cancer registrations are also
continuously being updated retrospectively and ONS records may have been updated since previous analyses.
Denominator:
Denominator data - 2001 Census based mid-year population estimates for the respective calendar years.
Source of denominator data - ONS.
Comments on denominator data - Data are based on the latest revisions of ONS mid-year population estimates for
the respective years, current as at 29 September 2008.
Statistical methods:
Annex 3: Explanations of statistical methods used in the Compendium.
Interpretation of indicators:
Quality of indicator - Annex 12 describes the criteria that should be used to judge the quality of this indicator. The
application of the criteria is dependent on the context (e.g. describing a single organisation, comparing several
organisations) and the level (e.g. national / regional with large numbers of events, local with small numbers of
events) at which the data are to be used.
Further reading:
1.
2.
Kuper H, Boffetta P, Adami H.O. Tobacco use and cancer causation: association by tumour type. J Intern Med
2002; 252(3): 206-224.
Department of Health. Improving Outcomes in Upper Gastro-intestinal Cancers - The Manual. London:
Department of Health, 2001.
Updated: May 2009
324
Mortality from stomach cancer
Purpose:
To reduce deaths from stomach cancer.
Definition of indicator and its variants:
Mortality from stomach cancer (ICD-10 C16 equivalent to ICD-9 151).
Statistic
Number of deaths
Average age-specific death
rate per 100,000 resident
population
Indirectly age-standardised
mortality ratio (SMR) and
number of deaths
Directly age-standardised
mortality rate per 100,000 and
number of deaths
Sex
Age group
MFP 1+, 1-4, 5-14,
15-34, 35-64,
65-74, 75+
MFP 1+, 1-4, 5-14,
15-34, 35-64,
65-74, 75+
MFP All ages,
<75
All ages
MFP All ages,
<75
Organisation
(see glossary)
Current
data
E&W, E, GOR,
ONS area, SHA,
LA, PCO, CTY
E&W, E, GOR,
ONS area, SHA,
LA, PCO, CTY
E&W, E, GOR,
ONS area, SHA,
LA, PCO, CTY
2008
12B_155NO_08_V1
2006-08
12B_155CR_08_V1
2006-08
12B_155SM00++_08_V1
12B_155SM0074_08_V1
E&W, E, GOR,
ONS area, SHA,
LA, PCO, CTY
All ages
2006-08
Trend
data
File-worksheet name
1993-08 12B_155SMT00++_08_V1
12B_155DR00++_08_V1
12B_155DR0074_08_V1
1993-08 12B_155DRT00++_08_V1
Numerator:
Numerator data - Deaths from stomach cancer, classified by underlying cause of death (ICD-10 C16, ICD-9 151
adjusted), registered in the respective calendar year(s).
Source of numerator data - Office for National Statistics (ONS).
Comments on numerator data - Mortality data for years 1993-2006 were extracted by ONS in June 2007 with
organisational codes assigned using the postcode of usual residence and the November 2006 edition of the
National Statistics Postcode Directory (NSPD). Data for subsequent years were extracted in June of the following
year using the respective year’s November edition of the NSPD.
In January 2001, the ONS implemented a change from ICD-9 to ICD-10 for coding causes of death in England &
Wales. As part of an exercise to investigate the effects of this change, the ONS also re-coded all deaths registered
in 1999. Deaths for years prior to 1999 and for year 2000 have not been re-coded.
For current analysis, therefore, all data are based on ICD-10.
For trend analysis, the numbers of deaths observed in the years 1993-98 and 2000 must be adjusted to give
“expected” numbers of deaths which would have been coded to this cause in ICD-10. This is done by multiplying
the ICD-9 based death counts by the appropriate ICD-10/9 comparability ratio published by the ONS. Trend data
cannot include years prior to 1993, because the ONS introduced automated coding in 1993, and the comparability
ratios are only valid from this point onwards.
For this indicator the following ICD-10/9 comparability ratios were used:
Males
Females
All Ages: 1.019
All Ages: 1
Adjusted person counts are the sum of the adjusted male and female counts. Once adjusted, the counts are used
to calculate rates in the usual way.
From the 2003 Compendium onwards, data are based on the original causes of death rather than the final causes
used in earlier Compendia.
See Annex 2 for more details.
Denominator:
Denominator data - 2001 Census based mid-year population estimates for the respective calendar years.
325
Source of denominator data - ONS.
Comments on denominator data - Data are based on the latest revisions of ONS mid-year population estimates for
the respective years, current as at 1 October 2009.
Statistical methods:
Annex 2: Changes to Office for National Statistics mortality data
Annex 3: Explanations of statistical methods used in the Compendium
Interpretation of indicators:
Quality of indicator - Annex 12 describes the criteria that should be used to judge the quality of this indicator. The
application of the criteria is dependent on the context (e.g. describing a single organisation, comparing several
organisations) and the level (e.g. national / regional with large numbers of events, local with small numbers of
events) at which the data are to be used.
Further reading:
1.
Department of Health. The NHS cancer plan and the new NHS: Providing a patient-centred service. London:
Department of Health, 2004.
2. Department of Health. Improving Outcomes in Upper Gastro-intestinal Cancers - The manual. London:
Department of Health, 2001.
3. World Health Organization. WHO Framework on Tobacco Control. Geneva: World Health Organization, 2003.
Available at http://www.who.int/tobacco/fctc/text/en/fctc_en.pdf
4. Department of Health. Improving Outcomes in Upper Gastro-intestinal Cancers - The research evidence.
London: Department of Health, 2001.
5. Brock A, Griffiths C. Trends in the mortality of young adults aged 15-44 in England and Wales, 1961-2001.
Office for National Statistics Health Statistics Quarterly, No. 19, 2003: 22-31. Available at:
http://www.statistics.gov.uk/downloads/theme_health/HSQ19.pdf
6. NHS Executive. Manual of Cancer Services Standards. London: NHS Executive, 2000.
7. Department of Health. NHS Cancer Plan. London: Department of Health, 2000.
8. Department of Health. Saving lives: Our Healthier Nation. London: The Stationery Office, 1999.
9. Department of Health. Smoking kills – a White Paper on tobacco. London: The Stationery Office, 1998.
10. World Bank. Economics of Tobacco Control. Washington: World Bank, 1999.
Updated: December 2009
326
Survival following diagnosis of stomach cancer
Purpose:
To provide comparative measures of the outcome of cancer treatment by area of residence, using geographical
variations in cancer survival. Cancer survival is a key operational measure of the success of cancer treatment
services. The principle of equity of access to optimal standards of National Health Service (NHS) cancer treatment
was explicitly endorsed in the Calman-Hine report of 1995, which noted: "All patients should have access to a
uniformly high quality of care in the community or hospital wherever they may live to ensure the maximum possible
1
cure rates and best quality of life" . A further policy document stated that from April 1999, patients with suspected
breast cancer "will be able to see a specialist within two weeks of their GP deciding they need to be seen urgently,
2
and requesting an appointment" . Similar commitments have come into force for other cancers since April 2000.
These policies are expected to lead to earlier diagnosis for all patients and more equitable access to treatment.
The NHS Cancer Plan extended these commitments to improve cancer survival in England to amongst the best in
3
Europe . Cancer survival rates are outcome measures that can form part of the baseline for monitoring the future
impact of these policies. Geographic differences in cancer survival are expected to decline over time if policy goals
are achieved.
Definition of indicator and its variants:
Relative survival rate at one and five years after diagnosis for patients diagnosed in England during 2001-03 and
followed up to the end of the year 2008. Cancer patients have higher mortality than the general population, but
they do not all die of cancer. The relative survival rate is the ratio of the survival rate actually observed among the
cancer patients and the survival rate that would have been expected if they had only had the same overall
mortality rates as the general population. Thus, if five-year survival is 60% among a group of cancer patients of
whom 90% would have been expected to survive that long, the relative survival is 67% (60/90). By convention,
relative survival is described as a rate, although strictly it is a ratio of two percentages.
Statistic
Number and one-year relative
survival rate (%)
Number and five-year relative
survival rate (%)
Sex
Age group
Organisation
(see glossary)
Current
data
Trend
data
File-worksheet name
MFP 15-99
E, GOR, SHA, CN
2001-03
12C_405PCP1_03_V1
MFP 15-99
E, GOR, SHA, CN
2001-03
12C_405PCP2_03_V1
Numerator:
Numerator data - Observed survival rate, derived from the distribution of survival times from the date of diagnosis
(of a primary, invasive, malignant neoplasm) to the earliest date among the date of death, the date of emigration,
and the cut-off date of follow-up (31 December 2008), for cancer patients who were diagnosed during 2001-03 and
resident in England at the time of diagnosis. Analyses published prior to the July 2009 Compendium release
include only first primary malignancies. From the July 2009 release onwards, higher order primary malignancies
are also retained. The geographical area of each patient is defined by residence at the time of diagnosis. Records
with faulty data, and those of patients diagnosed with in situ tumours, tumours uncertain as to whether benign or
malignant, metastatic, or uncertain whether primary or metastatic, are excluded from analysis.
Source of numerator data - National Cancer Intelligence Centre (NCIC), Office for National Statistics (ONS)
derived from NHS regional cancer registries; National Health Service Central Register.
Comments on numerator data Denominator:
Denominator data - The expected survival rate among the cancer patients, derived from life tables specific for the
calendar year of death, single year of age, sex, Government Office Region of residence and deprivation.
Source of denominator data - Office for National Statistics (ONS).
Statistical methods:
The cumulative probability of death at a given time since diagnosis, relative to the corresponding probability in the
general population, is estimated by comparing the death rates among the cancer patients in successive intervals
4
of time since diagnosis with the all-causes death rate in the general population for the same sex and age group .
This is derived from life tables for the Government Office Region in which the patient lives. Life tables were
created that were specific for calendar year of death, single year of age, sex, Government Office Region and
deprivation. Life tables were constructed for the years 1991, 2001 and 2005 using ONS mid-year population
estimates and the mean annual number of deaths in the three years centred on those index years. Life tables for
327
the intervening years were then created by linear interpolation. The life tables for 2005 were used for years 2006
to 2008 without interpolation.
The relative survival rates for the pooled three-year time period have been directly age-standardised to take into
account any variation in relative survival by age. The standard population used is the number of persons who were
diagnosed with the particular cancer under consideration in England and Wales during the period 1986-90. These
were broken down into three age (at diagnosis) groups: 15-69, 70-79, and 80-99 years.
Male, female, and person relative survival rates are age-standardised using the same person standard population
and may therefore be compared against each other. Rates for different cancers, however, are standardised using
different standard populations, and in some instances different age groupings, and should therefore not be
compared.
Annex 3 of the Compendium User Guide: Explanations of statistical methods used in the Compendium.
Interpretation of indicators:
Type of Indicator - The relative survival rate can be interpreted as an estimate of the proportion of cancer patients
who die of their disease, after adjustment for death from other causes. A relative survival rate of 100% for a given
period would imply that the cancer patients had had the same survival (or death) rates as the general population,
not that they had all survived. Similarly, if the relative survival rate remains constant at (say) ten or more years
after diagnosis, this implies that the ten-year survivors no longer have higher mortality than the general population.
Quality of indicator - Annex 12 of the Compendium User Guide describes the criteria that should be used to judge
the quality of this indicator. The application of the criteria is dependent on the context (e.g. describing a single
organisation, comparing several organisations) and the level (e.g. national / regional with large numbers of events,
local with small numbers of events) at which the data are to be used.
Potential value of indicator:
Cancer survival is a broad indicator - differences may be due to a range of factors, of which the quality of
treatment is only one. Differences in cancer survival between geographical areas should therefore be the origin of
further enquiry, not the basis for simplistic conclusions about the efficacy of cancer treatment. The geographical
area of residence at cancer diagnosis is a proxy for several aspects of health care, including the quality of primary
care, the speed of referral and the quality of treatment services. It may also be a proxy for other factors, not readily
measured, such as the degree of understanding of cancer symptoms and what to do about them among the local
population, variations in the extent of disease at diagnosis (stage) and in the histology and grade of tumours, and
artefacts in the data. If geographical survival differences can be attributed to differences in knowledge of cancer or
the extent of disease at diagnosis, public health responses could be organised. Differences in cancer survival
between geographical areas may also "turn out to be due to the persistence of outmoded practices, or other
remediable deficiencies in service provision or therapeutic regimes, and correcting these should lead to an
5
improvement in overall standards of care" .
Further reading:
A comprehensive monograph on cancer survival in England and Wales has been published6, covering 2.9 million
patients diagnosed with one of 47 adult cancers and 11 childhood cancers during 1971-90, and followed up to the
end of 1995. It includes comprehensive analyses by age, sex, and NHS Region, and by socio-economic status (in
five categories from affluent to deprived). Updated results for England and Wales have been published in 2004
and 2008 with a chapter for each of the 21 most common cancers. 7, 8 More limited analyses have also been
published for cancer patients diagnosed during 1991-93 and followed up to 1998, and diagnosed during 1993-95
and followed up to 2000. 9, 10 Five-year age-standardised relative survival rates for 21 major cancers based on
11
diagnoses in five year periods between 1998 and 2007 are available on the National Statistics website. An early
12
assessment of the impact of the NHS National Cancer Plan on relative survival has been published. An all13
cancer relative survival index for patients diagnosed 1991-2006 has been presented by PCT in England. Cancer
survival by Cancer Network has been presented for patients diagnosed with one of six cancers 1991-2006.13
1.
2.
3.
4.
5.
6.
Expert Advisory Group on Cancer. A policy framework for commissioning cancer services. London:
Department of Health, 1995.
NHS Executive. The new NHS. Modern. Dependable. London: Department of Health, 1997.
Department of Health. The NHS Cancer Plan: three-year progress report - maintaining the momentum.
London: Department of Health, 2003.
Estève J, Benhamou E, Croasdale M, Raymond L. Relative survival and the estimation of net survival:
elements for further discussion. Stat Med 1990; 9: 529-38.
Clinical Outcomes Working Group. Clinical outcome indicators, July 1996. Edinburgh: The Scottish Office,
1996.
Coleman M.P, Babb P, Damiecki P, Grosclaude P, Honjo S, Jones J et al. Cancer survival trends in England
and Wales 1971-1995: deprivation and NHS Region. Series SMPS No.61. London: The Stationery Office,
1999, 1-695.
328
7.
8.
9.
10.
11.
12.
13.
Coleman M.P, Rachet B, Woods L.M, Mitry E, Riga M, Cooper N et al. Trends and socioeconomic inequalities
in cancer survival in England and Wales up to 2001. British Journal of Cancer 2004; 90:1367-1373.
Mitry E, Rachet B, Quinn M.J, Cooper N, Coleman M.P. Survival from cancer of the stomach in England &
Wales up to 2001. British Journal of Cancer 2008; 99:S16-S18.
Coleman M.P, Babb P, Harris S, Quinn M.J, Sloggett A, De Stavola B.L. Cancer survival in England and
Wales, 1991-1998. Office for National Statistics Health Statistics Quarterly 2000; 6: 71-80.
Office for National Statistics. Cancer survival in the health authorities of England,1993-2000. Report. Office for
National Statistics Health Statistics Quarterly 2002;13: 95-103.
Office for National Statistics. Survival Rates in England and Wales, 1998-2001, 1999-2002, 1999-03; Survival
Rates in England 2000-04, 2001-06. National Statistics website. Available at:
http://www.statistics.gov.uk/StatBase/Product.asp?vlnk=14007&Pos=3&ColRank=1&Rank=422 , accessed 16
September 2010.
Rachet B, Maringe C, Nur U, Quaresma M, Shah A, Woods LM, et al. Population-based cancer survival trends
in England and Wales up to 2007: an assessment of the NHS cancer plan for England. Lancet Oncol
2009;10:351-69.
Office for National Statistics. Cancer survival by cancer network, patients diagnosed 1991-2006, followed up to
2007. National Statistics website. Available at:
http://www.statistics.gov.uk/STATBASE/Product.asp?vlnk=15387. Accessed 15 September 2010.
Updated: October 2010
329
Deaths at home from stomach cancer
Purpose:
To improve palliative care and service planning for cancer patients in the terminal stages of life, allowing more of
them the choice of dying at home.
Definition of indicator and its variants:
The proportion of deaths from stomach cancer (ICD-10 C16) that occur at home.
Statistic
Sex
Age group
Percent of deaths at home
MFP All ages
Indirectly age-standardised
deaths at home rate per 100
deaths and number of deaths
at home
MFP All ages
Organisation
(see glossary)
Current
data
E&W, E, GOR, ONS 2006-08
area, SHA, LA,
PCO, CTY
E&W, E, GOR, ONS 2006-08
area, SHA, LA,
PCO, CTY
Trend
data
File-worksheet name
12D_192PC_08_V1
12D_192ISR_08_V1
Numerator:
Numerator data - Deaths at home from stomach cancer, classified by underlying cause of death (ICD-10 C16),
registered in the respective calendar year(s).
Source of numerator data - Office for National Statistics (ONS).
Comments on numerator data - Mortality data for years 1993-2006 were extracted by ONS in June 2007 with
organisational codes assigned using the postcode of usual residence and the November 2006 edition of the
National Statistics Postcode Directory (NSPD). Data for subsequent years were extracted in June of the following
year using the respective year’s November edition of the NSPD.
Information about the place of death is found on the mortality record in the communal establishment field. It
contains one of:
•
•
•
a 5 digit code identifying a communal establishment or institution (e.g. hospital, nursing home, residential
home);
an “H” code which indicates that the person is certified as having died at their home address and that this
is not a communal establishment or;
an “E” code which indicates that the person died elsewhere.
The communal establishments are themselves classified into 84 categories (e.g. general hospital, mental nursing
home, nursing home etc) and can be further distinguished by whether they are an NHS or Non-NHS
establishment.
It is currently ONS practice to include nursing homes with hospitals under a broader group - “Other hospitals and
communal establishments for the care of the sick” - and also to include residential homes under “Other communal
establishments”. This is because of concerns highlighted by the ONS regarding the accuracy of the recorded
status of some communal establishments, particularly nursing homes and residential homes.
It is therefore not possible to include nursing home or residential home deaths as a “home” death. For this
indicator, a “home” death is defined as one that has the ”H” code in the communal establishment field, i.e. where
the death has occurred at the home address and that address is not of a communal establishment.
Denominator:
Denominator data - All deaths from stomach cancer, classified by underlying cause of death (ICD-10 C16),
registered in the respective calendar year(s).
Source of denominator data - ONS.
Comments on denominator data - Includes deaths in all categories of communal establishment code, i.e. deaths in
all communal establishments, at home, and elsewhere.
From the 2003 Compendium onwards, data are based on the original causes of death rather than the final causes
used in earlier Compendia. See Annex 2 for more details.
330
Statistical methods:
The age-standardised deaths at home rate utilises the indirect method of standardisation. The direct method was
found not to be robust as it was affected by small numerator and denominator counts in specific age groups.
Indirect standardisation requires the computation of the ratio of an area’s observed number of events to its
expected number of events if it had experienced the standard age-specific rates. This age-standardised ratio can
be converted into a rate by multiplying it by the crude rate of the standard population.
The standard rates used are those of England for the respective calendar year(s). Male and female rates have
been standardised separately. The rate for persons is standardised for both age and sex.
This methodology is similar to that used for the Clinical Indicators and is described in detail in:
Annex 3: Explanations of statistical methods used in the Compendium (under the sections entitled “Indirectly
Standardised Rates For Clinical Indicators” and “Confidence Intervals Of Indirectly Standardised Rates For Clinical
Indicators”).
Interpretation of indicators:
Type of Indicator - This is a condition-specific cross-sectional comparative indicator reflecting events which act as
a proxy for outcome (quality of dying). In the absence of an absolute standard, comparative data are useful for
monitoring in relation to rates achieved in comparable areas.
Quality of indicator – Annex 12 describes the criteria that should be used to judge the quality of this indicator. The
application of the criteria is dependent on the context (e.g. describing a single organisation, comparing several
organisations) and the level (e.g. national / regional with large numbers of events, local with small numbers of
events) at which the data are to be used.
Confidence Intervals - 95%. Some of the values and factors influencing them may be chance occurrences, with
values fluctuating at random between organisations and from year to year. Numbers of deaths may be small at
individual organisational level. The results should therefore be interpreted with caution and with the aid of
confidence intervals. The 95% confidence interval provides a measure of the statistical precision of the rate for an
area or institution. It indicates a range which, with 95% probability, will contain the underlying value of the
indicator. If the confidence interval for an organisation’s rate is outside the range of the national confidence
intervals, the difference between the two rates is considered statistically significant. If the confidence intervals for
two rates overlap, in most cases the difference between the rates would not be considered statistically significant.
Effect of Case-Mix / severity - Severity of the cancer and need for hospital care have implications for those who
wish to die at home being able to do so. The data available do not allow adjustment for these factors.
Other Potential Confounding Factors - A number of factors outside the control of the NHS such as personal
choice, availability of hospices, and family/community support may contribute to the variation shown by the
indicator.
Relevant National initiatives:
1.
2.
3.
4.
Department of Health. End of life care strategy : Promoting high quality care for all adults at the end of life.
London: Department of Health , 2008.
http://www.dh.gov.uk/en/Publicationsandstatistics/Publications/PublicationsPolicyAndGuidance/DH_086277
Department of Health. The NHS cancer plan and the new NHS: Providing a patient-centred service. London:
Department of Health, 2004.
Department of Health. Pioneering Schemes Named Best of the Best. NHS Beacons – Part of a Concerted
Campaign to Improve Cancer Services. Department of Health, 1999. Press release: reference 1999/0375
Commission for Health Improvement. NHS Cancer Care in England and Wales. National Service Framework
Assessments No.1. London: Commission for Health Improvement, 2001.
Further reading:
1.
2.
3.
Higginson I.J, Thompson M. Children and young people who die from cancer: epidemiology and place of
death in England (1995-9). British Medical Journal 2003; 327: 478-479.
Grande GE, Todd CJ, Barclay SIG, Farquhar MC. Does hospital at home for palliative care facilitate death at
home? Randomised controlled trial. British Medical Journal 1999; 319: 1472-1475.
Higginson I.J, Jarman B, Astin P, Dolan S. Do social factors affect where patients die: an analysis of 10 years
of cancer deaths in England. Journal of Public Health Medicine 1999; 21(1): 23-28.
Updated: December 2009
331
Years of life lost due to mortality from stomach cancer
Purpose:
Years of life lost (YLL) is a measure of premature mortality. Its primary purpose is to compare the relative
importance of different causes of premature death within a particular population and it can therefore be used by
health planners to define priorities for the prevention of such deaths. It can also be used to compare the premature
mortality experience of different populations for a particular cause of death. The concept of years of life lost is to
estimate the length of time a person would have lived had they not died prematurely. By inherently including the
age at which the death occurs, rather than just the fact of its occurrence, the calculation is an attempt to better
quantify the burden, or impact, on society from the specified cause of mortality.
Definition of indicator and its variants:
Years of life lost due to mortality from stomach cancer (ICD-10 C16).
Statistic
Crude rate per 10,000
population and number of
years of life lost
Directly age-standardised rate
per 10,000 population and
number of deaths
Sex
Age group
MFP <75
MFP <75
Organisation
(see glossary)
Current
data
Trend
data
File-worksheet name
E&W, E, GOR,
ONS area, SHA,
LA, PCO, CTY
E&W, E, GOR,
ONS area, SHA,
LA, PCO, CTY
2006-08
12E_062CR_08_V1
2006-08
12E_062DR_08_V1
Numerator:
Numerator data – Years of life lost and deaths from stomach cancer classified by underlying cause of death (ICD10 C16), registered in the respective calendar year(s).
Source of numerator data – Office for National Statistics (ONS).
Comments on numerator data – The number of years of life lost is calculated by summing over ages 1 to 74 years
the number of deaths at each age multiplied by the number of years of life remaining up to age 75 years. Infant
deaths are omitted as they are mostly a result of causes specific to this age group and have different aetiologies to
deaths later in life.
The numerator presented alongside the sdirecgtly age-tandardised years of life lost rate is the number of deaths
rather than the number of years of life lost. This is because the standardisation calculation has been performed
using 5-year age bands. In each age band the number of deaths is weighted by the number of years of life
remaining from the mid-point of the age band up to age 75 years. See annex 3 for more details.
Mortality data for years 1993-2006 were extracted by ONS in June 2007 with organisational codes assigned using
the postcode of usual residence and the November 2006 edition of the National Statistics Postcode Directory
(NSPD). Data for subsequent years were extracted in June of the following year using the respective year’s
November edition of the NSPD.
In January 2001, the ONS implemented a change from ICD-9 to ICD-10 for coding causes of death in England &
Wales. As part of an exercise to investigate the effects of this change, the ONS also re-coded all deaths registered
in 1999. Deaths for years prior to 1999 and for year 2000 have not been re-coded.
For current analysis, therefore, all data are based on ICD-10.
From the 2003 Compendium onwards, data are based on the original causes of death rather than the final causes
used in earlier Compendia.
See Annex 2 for more details.
Denominator:
Denominator data - 2001 Census based mid-year population estimates for the respective calendar years.
Source of denominator data - ONS.
Comments on denominator data - Data are based on the latest revisions of ONS mid-year population estimates for
the respective years, current as at 1 October 2009.
332
Statistical methods:
Annex 2: Changes to Office for National Statistics mortality data
Annex 3: Explanations of statistical methods used in the Compendium
Annex 5: European Standard Population
Interpretation of indicators:
Quality of indicator - Annex 12 describes the criteria that should be used to judge the quality of this indicator. The
application of the criteria is dependent on the context (e.g. describing a single organisation, comparing several
organisations) and the level (e.g. national / regional with large numbers of events, local with small numbers of
events) at which the data are to be used.
Further reading:
1.
Department of Health. The NHS cancer plan and the new NHS: Providing a patient-centred service. London:
Department of Health, 2004.
2. Department of Health. Improving Outcomes in Upper Gastro-intestinal Cancers - The manual. London:
Department of Health, 2001.
3. World Health Organization. WHO Framework on Tobacco Control. Geneva: World Health Organization, 2003.
Available at http://www.who.int/tobacco/fctc/text/en/fctc_en.pdf
4. Department of Health. Improving Outcomes in Upper Gastro-intestinal Cancers - The research evidence.
London: Department of Health, 2001.
5. Brock A, Griffiths C. Trends in the mortality of young adults aged 15-44 in England and Wales, 1961-2001.
Office for National Statistics Health Statistics Quarterly, No. 19, 2003: 22-31. Available at:
http://www.statistics.gov.uk/downloads/theme_health/HSQ19.pdf
6. NHS Executive. Manual of Cancer Services Standards. London: NHS Executive, 2000.
7. Department of Health. NHS Cancer Plan. London: Department of Health, 2000.
8. Department of Health. Saving lives: Our Healthier Nation. London: The Stationery Office, 1999.
9. Department of Health. Smoking kills – a White Paper on tobacco. London: The Stationery Office, 1998.
10. World Bank. Economics of Tobacco Control. Washington: World Bank, 1999.
Updated: December 2009
333
Mortality from all circulatory diseases
Purpose:
To reduce deaths from circulatory diseases. The directly age-standardised mortality rate from all circulatory
diseases for persons aged under 75 is a target indicator in the Saving Lives: Our Healthier Nation strategy (See
“Further reading”). The target is a 40% reduction by the year 2010 from the baseline rate in 1995-97.
Definition of indicator and its variants:
Mortality from all circulatory diseases (ICD-10 I00-I99 equivalent to ICD-9 390-459).
Statistic
Number of deaths
Average age-specific death
rate per 100,000 resident
population
Indirectly age-standardised
mortality ratio (SMR) and
number of deaths
Directly age-standardised
mortality rate per 100,000 and
number of deaths
Sex
Age group
MFP 1+, 1-4, 5-14,
15-34, 35-64,
65-74, 75+
MFP 1+, 1-4, 5-14,
15-34, 35-64,
65-74, 75+
MFP All ages,
<65,
<75,
65-74
All ages,
<65,
<75,
65-74
MFP All ages,
<65,
<75*,
65-74
Organisation
(see glossary)
Current
data
E&W, E, GOR,
ONS area, SHA,
LA, PCO, CTY
E&W, E, GOR,
ONS area, SHA,
LA, PCO, CTY
E&W, E, GOR,
ONS area, SHA,
LA, PCO, CTY
2008
06A_076NO_08_V1
2006-08
06A_076CR_08_V1
2006-08
06A_076SM00++_08_V1
06A_076SM0064_08_V1
06A_076SM0074_08_V1
06A_076SM6574_08_V1
E&W, E, GOR,
ONS area, SHA,
LA, PCO, CTY
<75#
2006-08
1995-97#
All ages,
<65,
<75,
65-74
Trend
data
File-worksheet name
1993-08 06A_076SMT00++_08_V1
06A_076SMT0064_08_V1
06A_076SMT0074_08_V1
06A_076SMT6574_08_V1
06A_076DR00++_08_V1
06A_076DR0064_08_V1
06A_076DR0074_08_V1
06A_076DR6574_08_V1
06A_076DR0074_97_V4
1993-08 06A_076DRT00++_08_V1
06A_076DRT0064_08_V1
06A_076DRT0074_08_V1
06A_076DRT6574_08_V1
#Our Healthier Nation baseline
* Additional local authority based aggregates are included for Neighbourhood Renewal Fund and Working
Neighbourhood Fund target monitoring.
Numerator:
Numerator data - Deaths from all circulatory diseases, classified by underlying cause of death (ICD-10 I00-I99,
ICD-9 390-459 adjusted), registered in the respective calendar year(s).
Source of numerator data - Office for National Statistics (ONS).
Comments on numerator data - Mortality data for years 1993-2006 were extracted by ONS in June 2007 with
organisational codes assigned using the postcode of usual residence and the November 2006 edition of the
National Statistics Postcode Directory (NSPD). Data for subsequent years were extracted in June of the following
year using the respective year’s November edition of the NSPD.
In January 2001, the ONS implemented a change from ICD-9 to ICD-10 for coding causes of death in England &
Wales. As part of an exercise to investigate the effects of this change, the ONS also re-coded all deaths registered
in 1999. Deaths for years prior to 1999 and for year 2000 have not been re-coded.
For current analysis, therefore, all data are based on ICD-10.
For trend analysis, the numbers of deaths observed in the years 1993-98 and 2000 must be adjusted to give
“expected” numbers of deaths which would have been coded to this cause in ICD-10. This is done by multiplying
the ICD-9 based death counts by the appropriate ICD-10/9 comparability ratio published by the ONS. Trend data
cannot include years prior to 1993, because the ONS introduced automated coding in 1993, and the comparability
ratios are only valid from this point onwards.
334
For this indicator the following ICD-10/9 comparability ratios were used:
Males
Females
0-74yrs: 1.012
0-74yrs: 1.015
75-84yrs: 1.039
75-84yrs: 1.042
85+yrs: 1.069
85+yrs: 1.057
Adjusted person counts are the sum of the adjusted male and female counts. Once adjusted, the counts are used
to calculate rates in the usual way.
From the 2003 Compendium onwards, data are based on the original causes of death rather than the final causes
used in earlier Compendia.
See Annex 2 for more details.
Denominator:
Denominator data - 2001 Census based mid-year population estimates for the respective calendar years.
Source of denominator data - ONS.
Comments on denominator data - Data are based on the latest revisions of ONS mid-year population estimates for
the respective years, current as at 1 October 2009.
Statistical methods:
Annex 2: Changes to Office for National Statistics mortality data
Annex 3: Explanations of statistical methods used in the Compendium
Annex 5: European Standard Population
Annex 6: Goals of Our Healthier Nation
Interpretation of indicators:
Quality of indicator – Annex 12 describes the criteria that should be used to judge the quality of this indicator. The
application of the criteria is dependent on the context (e.g. describing a single organisation, comparing several
organisations) and the level (e.g. national / regional with large numbers of events, local with small numbers of
events) at which the data are to be used.
Further reading:
1.
2.
3.
4.
5.
6.
7.
8.
9.
10.
11.
12.
13.
14.
Royal College of Physicians. Acute Myocardial Infarction : A Core Data Set for monitoring standards of care.
London: Royal College of Physicians, 1999. Available at: http://www.rcplondon.ac.uk/pubs/books/ami/
NHS Information Authority. Acute Myocardial Infarction Dataset Project. London: NHS Information Authority,
2002.
Birkhead J, Goldacre M, Mason A, Wilkinson E, Amess M, Cleary R (eds). Health Outcome Indicators:
Myocardial Infarction. Report of a working group to the Department of Health. Oxford: National Centre for
Health Outcomes Development, 1999. Available at: http://nchod.uhce.ox.ac.uk/myocardial.pdf
Department of Health. Chronic Disease Management and self-care. London: Department of Health, 2002
NHS Information Authority. Coronary Heart Disease Dataset Project. NHS Information Authority website:
http://www.nhsia.nhs.uk/phsmi/datasets/pages/chd.asp
Department of Health. Coronary Heart Disease Information Strategy. London: Department of Health, 2001
NHS Modernisation Agency. Coronary Heart Disease. NHS Modernisation Agency website:
http://www.modern.nhs.uk/scripts/default.asp?site_id=23
Department of Health. Delivering Better Heart Services : Progress Report 2003. London: Department of
Health, 2003.
World Health Organization. MONICA Monograph and Multimedia Sourcebook. Geneva: World Health
Organization, 2003.
Commission for Health Improvement, Audit Commission. National Service Framework for Coronary Heart
Disease Review. London: Commission for Health Improvement, 2003.
Department of Health. National Service Framework for Coronary Heart Disease. London: Department of
Health, 2000.
Department of Health. National Service Framework for Coronary Heart Disease. Delivering better heart
services Progress report: 2003. London: Department of Health, 2003.
Myocardial Infarction National Audit Project Team. How Hospitals Manage Heart Attacks. London: Royal
College of Physicians, 2003. Available at:
http://www.rcplondon.ac.uk/pubs/books/minap/HowHospitalsManageHeartAttacksJune2003.pdf
Department of Health. Saving Lives: Our Healthier Nation. London: The Stationery Office, 1999.
Updated: December 2009
335
Years of life lost due to mortality from all circulatory diseases
Purpose:
Years of life lost (YLL) is a measure of premature mortality. Its primary purpose is to compare the relative
importance of different causes of premature death within a particular population and it can therefore be used by
health planners to define priorities for the prevention of such deaths. It can also be used to compare the premature
mortality experience of different populations for a particular cause of death. The concept of years of life lost is to
estimate the length of time a person would have lived had they not died prematurely. By inherently including the
age at which the death occurs, rather than just the fact of its occurrence, the calculation is an attempt to better
quantify the burden, or impact, on society from the specified cause of mortality.
Definition of indicator and its variants:
Years of life lost due to mortality from all circulatory diseases (ICD-10 I00-I99).
Statistic
Crude rate per 10,000
population and number of
years of life lost
Directly age-standardised rate
per 10,000 population and
number of deaths
Sex
Age group
MFP <75
MFP <75
Organisation
(see glossary)
Current
data
Trend
data
File-worksheet name
E&W, E, GOR,
ONS area, SHA,
LA, PCO, CTY
E&W, E, GOR,
ONS area, SHA,
LA, PCO, CTY
2006-08
06B_107CR_08_V1
2006-08
06B_107DR_08_V1
Numerator:
Numerator data – Years of life lost and deaths from all circulatory diseases classified by underlying cause of death
(ICD-10 I00-I99), registered in the respective calendar year(s).
Source of numerator data – Office for National Statistics (ONS).
Comments on numerator data – The number of years of life lost is calculated by summing over ages 1 to 74 years
the number of deaths at each age multiplied by the number of years of life remaining up to age 75 years. Infant
deaths are omitted as they are mostly a result of causes specific to this age group and have different aetiologies to
deaths later in life.
The numerator presented alongside the sdirecgtly age-tandardised years of life lost rate is the number of deaths
rather than the number of years of life lost. This is because the standardisation calculation has been performed
using 5-year age bands. In each age band the number of deaths is weighted by the number of years of life
remaining from the mid-point of the age band up to age 75 years. See annex 3 for more details.
Mortality data for years 1993-2006 were extracted by ONS in June 2007 with organisational codes assigned using
the postcode of usual residence and the November 2006 edition of the National Statistics Postcode Directory
(NSPD). Data for subsequent years were extracted in June of the following year using the respective year’s
November edition of the NSPD.
In January 2001, the ONS implemented a change from ICD-9 to ICD-10 for coding causes of death in England &
Wales. As part of an exercise to investigate the effects of this change, the ONS also re-coded all deaths registered
in 1999. Deaths for years prior to 1999 and for year 2000 have not been re-coded.
For current analysis, therefore, all data are based on ICD-10.
From the 2003 Compendium onwards, data are based on the original causes of death rather than the final causes
used in earlier Compendia.
See Annex 2 for more details.
Denominator:
Denominator data - 2001 Census based mid-year population estimates for the respective calendar years.
Source of denominator data - ONS.
Comments on denominator data - Data are based on the latest revisions of ONS mid-year population estimates for
the respective years, current as at 1 October 2009.
336
Statistical methods:
Annex 2: Changes to Office for National Statistics mortality data
Annex 3: Explanations of statistical methods used in the Compendium
Annex 5: European Standard Population
Interpretation of indicators:
Quality of indicator - Annex 12 describes the criteria that should be used to judge the quality of this indicator. The
application of the criteria is dependent on the context (e.g. describing a single organisation, comparing several
organisations) and the level (e.g. national / regional with large numbers of events, local with small numbers of
events) at which the data are to be used.
Further reading:
1.
2.
3.
4.
5.
6.
7.
8.
9.
10.
11.
12.
13.
14.
Royal College of Physicians. Acute Myocardial Infarction : A Core Data Set for monitoring standards of care.
London: Royal College of Physicians, 1999. Available at: http://www.rcplondon.ac.uk/pubs/books/ami/
NHS Information Authority. Acute Myocardial Infarction Dataset Project. London: NHS Information Authority,
2002.
Birkhead J, Goldacre M, Mason A, Wilkinson E, Amess M, Cleary R (eds). Health Outcome Indicators:
Myocardial Infarction. Report of a working group to the Department of Health. Oxford: National Centre for
Health Outcomes Development, 1999. Available at: http://nchod.uhce.ox.ac.uk/myocardial.pdf
Department of Health. Chronic Disease Management and self-care. London: Department of Health, 2002
NHS Information Authority. Coronary Heart Disease Dataset Project. NHS Information Authority website:
http://www.nhsia.nhs.uk/phsmi/datasets/pages/chd.asp
Department of Health. Coronary Heart Disease Information Strategy. London: Department of Health, 2001
NHS Modernisation Agency. Coronary Heart Disease. NHS Modernisation Agency website:
http://www.modern.nhs.uk/scripts/default.asp?site_id=23
Department of Health. Delivering Better Heart Services : Progress Report 2003. London: Department of
Health, 2003.
World Health Organization. MONICA Monograph and Multimedia Sourcebook. Geneva: World Health
Organization, 2003.
Commission for Health Improvement, Audit Commission. National Service Framework for Coronary Heart
Disease Review. London: Commission for Health Improvement, 2003.
Department of Health. National Service Framework for Coronary Heart Disease. London: Department of
Health, 2000.
Department of Health. National Service Framework for Coronary Heart Disease. Delivering better heart
services Progress report: 2003. London: Department of Health, 2003.
Myocardial Infarction National Audit Project Team. How Hospitals Manage Heart Attacks. London: Royal
College of Physicians, 2003. Available at:
http://www.rcplondon.ac.uk/pubs/books/minap/HowHospitalsManageHeartAttacksJune2003.pdf
Department of Health. Saving Lives: Our Healthier Nation. London: The Stationery Office, 1999.
Updated: December 2009
337
Mortality from chronic rheumatic heart disease
Purpose:
To reduce deaths from chronic rheumatic heart disease.
Definition of indicator and its variants:
Mortality from chronic rheumatic heart disease (ICD-10 I05).
Statistic
Indirectly age-standardised
mortality ratio (SMR) and
number of deaths
Directly age-standardised
mortality rate per 100,000 and
number of deaths
Sex
Age group
MFP All ages,
<75,
5-44
MFP All ages,
<75,
5-44
Organisation
(see glossary)
Current
data
E&W, E, GOR,
ONS area, SHA,
LA, PCO, CTY
E&W, E, GOR,
ONS area, SHA,
LA, PCO, CTY
2006-08
2006-08
Trend
data
File-worksheet name
07A_135SM00++_08_V1
07A_135SM0074_08_V1
07A_135SM0544_08_V1
07A_135DR00++_08_V1
07A_135DR0074_08_V1
07A_135DR0544_08_V1
Numerator:
Numerator data - Deaths from chronic rheumatic heart disease, classified by underlying cause of death (ICD-10
I05-I09), registered in the respective calendar year(s).
Source of numerator data - Office for National Statistics (ONS).
Comments on numerator data - Mortality data for years 1993-2006 were extracted by ONS in June 2007 with
organisational codes assigned using the postcode of usual residence and the November 2006 edition of the
National Statistics Postcode Directory (NSPD). Data for subsequent years were extracted in June of the following
year using the respective year’s November edition of the NSPD.
In January 2001, the ONS implemented a change from ICD-9 to ICD-10 for coding causes of death in England &
Wales. As part of an exercise to investigate the effects of this change, the ONS also re-coded all deaths registered
in 1999. Deaths for years prior to 1999 and for year 2000 have not been re-coded.
For current analysis, therefore, all data are based on ICD-10.
From the 2003 Compendium onwards, data are based on the original causes of death rather than the final causes
used in earlier Compendia.
See Annex 2 for more details.
Denominator:
Denominator data - 2001 Census based mid-year population estimates for the respective calendar years.
Source of denominator data - ONS.
Comments on denominator data - Data are based on the latest revisions of ONS mid-year population estimates for
the respective years, current as at 1 October 2009.
Statistical methods:
Annex 2: Changes to Office for National Statistics mortality data
Annex 3: Explanations of statistical methods used in the Compendium
Annex 5: European Standard Population
Interpretation of indicators:
Quality of indicator – Annex 12 describes the criteria that should be used to judge the quality of this indicator. The
application of the criteria is dependent on the context (e.g. describing a single organisation, comparing several
organisations) and the level (e.g. national / regional with large numbers of events, local with small numbers of
events) at which the data are to be used.
Further reading:
1.
Department of Health. Chronic Disease Management and self-care. London: Department of Health, 2002.
338
2.
NHS Information Authority. Coronary Heart Disease Dataset Project. NHS Information Authority website:
http://www.nhsia.nhs.uk/phsmi/datasets/pages/chd.asp
3. Department of Health. Coronary Heart Disease Information Strategy. London: Department of Health, 2001.
4. NHS Modernisation Agency. Coronary Heart Disease. NHS Modernisation Agency website:
http://www.modern.nhs.uk/scripts/default.asp?site_id=23
5. Department of Health. Delivering Better Heart Services: Progress Report 2003. London: Department of
Health, 2003.
6. World Health Organization. MONICA Monograph and Multimedia Sourcebook. Geneva: World Health
Organization, 2003.
7. Department of Health. National Service Framework for Coronary Heart Disease. London: Department of
Health, 2000.
8. Department of Health. National Service Framework for Coronary Heart Disease. Delivering better heart
services Progress report: 2003. London: Department of Health.
9. Commission for Health Improvement, Audit Commission. National Service Framework for Coronary Heart
Disease Review. London: Commission for Health Improvement, 2003.
10. Department of Health. Saving Lives: Our Healthier Nation. London: The Stationery Office, 1999.
11. Department of Health. Strategic Reviews of Research and Development Coronary Heart Disease. London:
Department of Health, 2002.
Updated: December 2009
339
Mortality from coronary heart disease
Purpose:
To reduce deaths from coronary heart disease.
Definition of indicator and its variants:
Mortality from coronary heart disease (ICD-10 I20-I25 equivalent to ICD-9 410-414).
Statistic
Number of deaths
Average age-specific death
rate per 100,000 resident
population
Indirectly age-standardised
mortality ratio (SMR) and
number of deaths
Directly age-standardised
mortality rate per 100,000 and
number of deaths
Sex
Age group
MFP 1+, 1-4, 5-14,
15-34, 35-64,
65-74, 75+
MFP 1+, 1-4, 5-14,
15-34, 35-64,
65-74, 75+
MFP All ages,
<65,
<75,
65-74
All ages,
<65,
<75,
65-74
MFP All ages,
<65,
<75,
65-74
Organisation
(see glossary)
Current
data
E&W, E, GOR,
ONS area, SHA,
LA, PCO, CTY
E&W, E, GOR,
ONS area, SHA,
LA, PCO, CTY
E&W, E, GOR,
ONS area, SHA,
LA, PCO, CTY
2008
09A_054NO_08_V1
2006-08
09A_054CR_08_V1
2006-08
09A_054SM00++_08_V1
09A_054SM0064_08_V1
09A_054SM0074_08_V1
09A_054SM6574_08_V1
E&W, E, GOR,
ONS area, SHA,
LA, PCO, CTY
All ages,
<65,
<75,
65-74
2006-08
Trend
data
File-worksheet name
1993-08 09A_054SMT00++_08_V1
09A_054SMT0064_08_V1
09A_054SMT0074_08_V1
09A_054SMT6574_08_V1
09A_054DR00++_08_V1
09A_054DR0064_08_V1
09A_054DR0074_08_V1
09A_054DR6574_08_V1
1993-08 09A_054DRT00++_08_V1
09A_054DRT0064_08_V1
09A_054DRT0074_08_V1
09A_054DRT6574_08_V1
Numerator:
Numerator data - Deaths from coronary heart disease, classified by underlying cause of death (ICD-10 I20-I25,
ICD-9 410-414 adjusted), registered in the respective calendar year(s).
Source of numerator data - Office for National Statistics (ONS).
Comments on numerator data - Mortality data for years 1993-2006 were extracted by ONS in June 2007 with
organisational codes assigned using the postcode of usual residence and the November 2006 edition of the
National Statistics Postcode Directory (NSPD). Data for subsequent years were extracted in June of the following
year using the respective year’s November edition of the NSPD.
The directly age-standardised mortality rates from coronary heart disease for persons aged under 65 and 65-74
were target indicators in the Health of the Nation strategy (See “Further reading”).
In January 2001, ONS implemented a change from ICD-9 to ICD-10 for coding causes of death in England &
Wales. As part of an exercise to investigate the effects of this change, ONS also re-coded all deaths registered in
1999. Deaths for years prior to 1999 and for year 2000 have not been re-coded.
For current analysis, therefore, all data are based on ICD-10.
For trend analysis, the numbers of deaths observed in the years 1993-98 and 2000 must be adjusted to give
“expected” numbers of deaths which would have been coded to this cause in ICD-10. This is done by multiplying
the ICD-9 based death counts by the appropriate ICD-10/9 comparability ratio published by ONS. Trend data
cannot include years prior to 1993, because ONS introduced automated coding in 1993, and the comparability
ratios are only valid from this point onwards.
For this indicator the following ICD-10/9 comparability ratios were used:
Males
All Ages: 1.005
340
Females
All Ages: 1.007
Adjusted person counts are the sum of the adjusted male and female counts. Once adjusted, the counts are used
to calculate rates in the usual way.
From the 2003 Compendium onwards, data are based on the original causes of death rather than the final causes
used in earlier Compendia.
See Annex 2 for more details.
Denominator:
Denominator data - 2001 Census based mid-year population estimates for the respective calendar years.
Source of denominator data - ONS.
Comments on denominator data - Data are based on the latest revisions of ONS mid-year population estimates for
the respective years, current as at 1 October 2009.
Statistical methods:
Annex 2: Changes to Office for National Statistics mortality data
Annex 3: Explanations of statistical methods used in the Compendium
Annex 5: European Standard Population
Annex 6: Goals of Our Healthier Nation
Interpretation of indicators:
Quality of indicator – Annex 12 describes the criteria that should be used to judge the quality of this indicator. The
application of the criteria is dependent on the context (e.g. describing a single organisation, comparing several
organisations) and the level (e.g. national / regional with large numbers of events, local with small numbers of
events) at which the data are to be used.
Further reading:
1.
2.
3.
4.
5.
6.
7.
8.
9.
10.
11.
12.
13.
14.
NHS Information Authority. Coronary Heart Disease Dataset Project. NHS Information Authority, 2004.
Available at: http://www.nhsia.nhs.uk/phsmi/datasets/pages/chd.asp
NHS Modernisation Agency. Coronary Heart Disease. NHS Modernisation Agency website:
http://www.modern.nhs.uk/scripts/default.asp?site_id=23
Department of Health. The National Service Framework for Coronary Heart Disease: winning the war on heart
disease. London: Department of Health, 2004.
Commission for Health Improvement, Audit Commission. National Service Framework for Coronary Heart
Disease Review. London: Commission for Health Improvement, 2003.
Department of Health. Delivering Better Heart Services : Progress Report 2003. Department of Health, 2003.
Department of Health. National Service Framework for Coronary Heart Disease. Delivering better heart
services Progress report: 2003. London: Department of Health, 2003.
Sowerby Centre for Health Informatics. Health Informatics Programme for Coronary Heart Disease .
World Health Organization. MONICA Monograph and Multimedia Sourcebook. Geneva: World Health
Organization, 2003.
Department of Health. Chronic Disease Management and self-care. London: Department of Health, 2002.
Department of Health. Strategic Reviews of Research and Development Coronary Heart Disease. London:
Department of Health, 2002.
Department of Health. Coronary Heart Disease Information Strategy. London: Department of Health, 2001.
Department of Health. National Service Framework for Coronary Heart Disease. London: Department of
Health, 2000. Available at: http://www.doh.gov.uk/nsf/coronary.htm
Department of Health. Saving Lives: Our Healthier Nation. London: The Stationery Office, 1999.
Department of Health. Health of the Nation - A Strategy for Health in England. London: Her Majesty’s
Stationery Office, 1992.
Updated: December 2009
341
Mortality from acute myocardial infarction
Purpose:
To reduce deaths from acute myocardial infarction.
Definition of indicator and its variants:
Mortality from acute myocardial infarction (ICD-10 I21-I22).
Statistic
Sex
Age group
Organisation
(see glossary)
Current
data
Indirectly age-standardised
mortality ratio (SMR) and
number of deaths
MFP All ages,
<75,
35-64
E&W, E, GOR,
ONS area, SHA,
LA, PCO, CTY
2006-08
Directly age-standardised
mortality rate per 100,000 and
number of deaths
All ages
MFP All ages,
<75,
35-64
E&W, E, GOR,
ONS area, SHA,
LA, PCO, CTY
2006-08
All ages
Trend
data
File-worksheet name
09B_055SM00++_08_V1
09B_055SM0074_08_V1
09B_055SM3564_08_V1
1993-08 09B_055SMT00++_08_V1
09B_055DR00++_08_V1
09B_055DR0074_08_V1
09B_055DR3564_08_V1
1993-08 09B_055DRT00++_08_V1
Numerator:
Numerator data - Deaths from acute myocardial infarction, classified by underlying cause of death (ICD-10 I21I22), registered in the respective calendar year(s).
Source of numerator data - Office for National Statistics (ONS).
Comments on numerator data - Mortality data for years 1993-2006 were extracted by ONS in June 2007 with
organisational codes assigned using the postcode of usual residence and the November 2006 edition of the
National Statistics Postcode Directory (NSPD). Data for subsequent years were extracted in June of the following
year using the respective year’s November edition of the NSPD.
In January 2001, the ONS implemented a change from ICD-9 to ICD-10 for coding causes of death in England &
Wales. As part of an exercise to investigate the effects of this change, the ONS also re-coded all deaths registered
in 1999. Deaths for years prior to 1999 and for year 2000 have not been re-coded.
For current analysis, therefore, all data are based on ICD-10.
For trend analysis, the numbers of deaths observed in the years 1993-98 and 2000 must be adjusted to give
“expected” numbers of deaths which would have been coded to this cause in ICD-10. This is done by multiplying
the ICD-9 based death counts by the appropriate ICD-10/9 comparability ratio published by the ONS. Trend data
cannot include years prior to 1993, because the ONS introduced automated coding in 1993, and the comparability
ratios are only valid from this point onwards.
For this indicator the following ICD-10/9 comparability ratios were used:
Males
Females
0-74yrs: 0.944
0-74yrs: 0.946
75-84yrs: 0.941
75-84yrs: 0.939
85+yrs: 0.907
85+yrs: 0.894
Adjusted person counts are the sum of the adjusted male and female counts. Once adjusted, the counts are used
to calculate rates in the usual way.
From the 2003 Compendium onwards, data are based on the original causes of death rather than the final causes
used in earlier Compendia.
See Annex 2 for more details.
Denominator:
Denominator data - 2001 Census based mid-year population estimates for the respective calendar years.
Source of denominator data - ONS.
342
Comments on denominator data - Data are based on the latest revisions of ONS mid-year population estimates for
the respective years, current as at 1 October 2009.
Statistical methods:
Annex 2: Changes to Office for National Statistics mortality data
Annex 3: Explanations of statistical methods used in the Compendium
Interpretation of indicators:
Quality of indicator – Annex 12 describes the criteria that should be used to judge the quality of this indicator. The
application of the criteria is dependent on the context (e.g. describing a single organisation, comparing several
organisations) and the level (e.g. national / regional with large numbers of events, local with small numbers of
events) at which the data are to be used.
Further reading:
1.
2.
3.
4.
5.
6.
7.
8.
9.
10.
11.
12.
13.
Royal College of Physicians. Acute Myocardial Infarction: A Core Data Set for monitoring standards of care.
London: Royal College of Physicians, 1999. Available at: http://www.rcplondon.ac.uk/pubs/books/ami/
NHS Information Authority. Acute Myocardial Infarction Dataset Project. London: NHS Information Authority,
2002.
Birkhead J, Goldacre M, Mason A, Wilkinson E, Amess M, Cleary R (eds). Health Outcome Indicators:
Myocardial Infarction. Report of a working group to the Department of Health. Oxford: National Centre for
Health Outcomes Development, 1999. Available at: http:// nchod.uhce.ox.ac.uk/myocardial.pdf
NHS Information Authority. Coronary Heart Disease Dataset Project. London: NHS Information Authority,
2004. Available at: http://www.nhsia.nhs.uk/phsmi/datasets/pages/chd.asp
Department of Health. Coronary Heart Disease Information Strategy. London: Department of Health, 2001.
NHS Modernisation Agency. Coronary Heart Disease. London: NHS Modernisation Agency website:
http://www.modern.nhs.uk/scripts/default.asp?site_id=23
Department of Health. Health Improvement And Prevention. London: Department of Health, 2002.
World Health Organization. MONICA Monograph and Multimedia Sourcebook. Geneva: World Health
Organization, 2003.
Commission for Health Improvement, Audit Commission. National Service Framework for Coronary Heart
Disease Review. London: Commission for Health Improvement, 2003.
Department of Health. National Service Framework for Coronary Heart Disease. London: Department of
Health, 2000.
Department of Health. National Service Framework for Coronary Heart Disease. Delivering better heart
services Progress report: 2003. London: Department of Health, 2003.
Myocardial Infarction National Audit Project Team, Royal College of Physicians. How Hospitals Manage Heart
Attacks. London: Royal College of Physicians, 2003. Available at:
http://www.rcplondon.ac.uk/pubs/books/minap/HowHospitalsManageHeartAttacksJune2003.pdf
Department of Health. Saving Lives: Our Healthier Nation. London: The Stationery Office, 1999.
Updated: December 2009
343
Mortality from ischaemic heart disease other than acute myocardial infarction
Purpose:
To reduce deaths from coronary heart disease.
Definition of indicator and its variants:
Mortality from ischaemic heart disease other than acute myocardial infarction (ICD-10 I20, I23-I25).
Statistic
Indirectly age-standardised
mortality ratio (SMR) and
number of deaths
Directly age-standardised
mortality rate per 100,000 and
number of deaths
Sex
Age group
MFP All ages,
35-64
MFP All ages,
35-64
Organisation
(see glossary)
Current
data
Trend
data
File-worksheet name
E&W, E, GOR,
ONS area, SHA,
LA, PCO, CTY
E&W, E, GOR,
ONS area, SHA,
LA, PCO, CTY
2006-08
09C_178SM00++_08_V1
09C_178SM3564_08_V1
2006-08
09C_178DR00++_08_V1
09C_178DR3564_08_V1
Numerator:
Numerator data - Deaths from ischaemic heart disease (IHD) other than acute myocardial infarction, classified by
underlying cause of death (ICD-10 I20, I23-I25), registered in the respective calendar years.
Source of numerator data - Office for National Statistics (ONS).
Comments on numerator data - Mortality data for years 1993-2006 were extracted by ONS in June 2007 with
organisational codes assigned using the postcode of usual residence and the November 2006 edition of the
National Statistics Postcode Directory (NSPD). Data for subsequent years were extracted in June of the following
year using the respective year’s November edition of the NSPD.
In January 2001, the ONS implemented a change from ICD-9 to ICD-10 for coding causes of death in England &
Wales. As part of an exercise to investigate the effects of this change, the ONS also re-coded all deaths registered
in 1999. Deaths for years prior to 1999 and for year 2000 have not been re-coded.
For current analysis, therefore, all data are based on ICD-10.
The indicator is redefined using the new ICD-10 definition. There is no direct equivalence between the ICD-9 and
ICD-10 definitions for this indicator. The change in coding scheme has resulted in deaths from IHD moving
between codes, resulting in a decrease in the number of deaths assigned to Acute Myocardial Infarction (AMI).
This is because in ICD-9, acute ischaemic heart disease or ischaemic heart disease with a stated duration of less
than four weeks were coded to AMI (410). In ICD-10 these deaths are coded to Acute Ischaemic Heart Disease
(I24.9), which is a new code. This accounted for about 260 deaths in 1999. A further 3,600 deaths coded to 410 in
ICD-9 have been coded to Chronic Ischaemic Heart Disease (I25) in ICD-10. These are deaths which had AMI or
other acute ischaemic heart disease on the death certificate, but with a stated duration of more than four weeks.
From the 2003 Compendium onwards, data are based on the original causes of death rather than the final causes
used in earlier Compendia.
See Annex 2 for more details.
Denominator:
Denominator data - 2001 Census based mid-year population estimates for the respective calendar years.
Source of denominator data - ONS.
Comments on denominator data - Data are based on the latest revisions of ONS mid-year population estimates for
the respective years, current as at 1 October 2009.
Statistical methods:
Annex 2: Changes to Office for National Statistics mortality data
Annex 3: Explanations of statistical methods used in the Compendium
344
Interpretation of indicators:
Quality of indicator – Annex 12 describes the criteria that should be used to judge the quality of this indicator. The
application of the criteria is dependent on the context (e.g. describing a single organisation, comparing several
organisations) and the level (e.g. national / regional with large numbers of events, local with small numbers of
events) at which the data are to be used.
Further reading:
1.
2.
Department of Health. Chronic Disease Management and Self-care. London: Department of Health, 2002.
NHS Information Authority. Coronary Heart Disease Dataset Project. London: NHS Information Authority,
2002. Available at: http://www.nhsia.nhs.uk/phsmi/datasets/pages/chd.asp
3. Department of Health. Coronary Heart Disease Information Strategy. London: Department of Health, 2001.
4. NHS Modernisation Agency. Coronary Heart Disease. NHS Modernisation Agency website:
http://www.modern.nhs.uk/scripts/default.asp?site_id=23
5. Department of Health. Delivering Better Heart Services : Progress Report 2003. London: Department of
Health, 2003.
6. World Health Organization. MONICA Monograph and Multimedia Sourcebook. Geneva: World Health
Organization, 2003.
7. Commission for Health Improvement, Audit Commission. National Service Framework for Coronary Heart
Disease Review. London: Commission for Health Improvement, 2003.
8. Department of Health. National Service Framework for Coronary Heart Disease. London: Department of
Health, 2000.
9. Department of Health. National Service Framework for Coronary Heart Disease. Delivering better heart
services Progress report: 2003. London: Department of Health, 2003.
10. Department of Health. Saving Lives: Our Healthier Nation. London: The Stationery Office, 1999.
Updated: December 2009
345
Deaths within 30 days of emergency admission to hospital: myocardial infarction
Purpose:
Some people with myocardial infarction die before they can be admitted to hospital. There are variations in death
rates among those who survive long enough to be admitted. Some of these deaths may be potentially preventable
through faster ambulance response time and effective early treatments e.g. thrombolysis. The National Health
Service (NHS) may be helped to prevent some of these deaths by seeing comparative figures and learning
lessons from follow-up investigations.
Definition of indicator and its variants:
Deaths in hospital and after discharge between 0 and 29 days (inclusive) of an emergency admission to hospital
with myocardial infarction.
Statistic
Sex
Age
group
Organisation
(see glossary)
Indirectly age,
sex and 3 digit
primary
diagnosisstandardised
rate per
100,000
(standardised to
2004/05)
P
F
M
All
Ages
E; GOR; ONS area
(boundaries as at
November 2006);
SHA (boundaries as
at July 2006);
County; LA
(boundaries as at
April 2009); PCO
(boundaries as at
October 2006);
deprivation group
(5, 7 bands);Trust
Cluster; Trust.
Period
Current
data
FY
2008/09
Trend
data
FY
1999/00,
FY
2000/01,
FY
2001/02,
FY
2002/03,
FY
2003/04,
FY
2004/05,
FY
2005/06,
FY
2006/07,
FY
2007/08
File_worksheet Name
09E_212ISR3AP_09_V1
09E_212ISR3AF_09_V1
09E_212ISR3AM_09_V1
Numerator:
Numerator data - The number of denominator continuous inpatient (CIP) spells following emergency admission for
patients aged 35 to 74 years inclusive with a primary diagnosis on admission of myocardial infarction (ICD 10
codes I21-I22), where the patient dies in hospital or after discharge between 0-29 days (inclusive) of admission in
the respective financial year.
Deaths that occur outside hospital following discharge but between 0-29 days of admission are included. This was
achieved through linkage of Hospital Episode Statistics (HES) data with deaths data from the Office for National
Statistics (ONS). Records of all deaths which occurred in England during the period of analysis for each indicator
plus 30 days after were obtained from ONS. Linkage was undertaken using the most recent CIP denominator spell
for each person discharged alive.
The date of admission, and the date and method of discharge from the last episode in the CIP spell (or HES/ONS
linked data), are used to determine the interval between admission and death.
The numerator is the number of denominator CIP spells with the following fields and values:
The last episode in the CIP spell (or HES/ONS linked*) has:
DISMETH* = 4 (discharge method);
AND DISDATE* minus ADMIDATE (first episode) = 0-29 days inclusive (discharge date and
admission date).
Fields used from the first episode in a spell where there is a valid patient postcode allowing the derivation of
the following organisation of residence codes include:
SPELLRESPCTC, SPELLRESLADSTC, SPELLRESSTHAC. Other organisational levels (E, GOR,
ONS Areas, Counties) are aggregates of the SPELLRESLADSTC field.
Fields used from the first episode in a spell include:
346
PROCODETC (provider code, unmapped). Provider clusters are aggregates of the PROCODETC
field.
Counts are by:
age / sex / 3digit primary diagnosis / organisation of residence in CIP spell (values for England are
aggregates of these)
where:
age bands are 35-39, … , 70-74;
sex is 1, 2 (male and female).
Source of numerator data - Hospital Episode Statistics (HES) for CIP spells intersecting the respective financial
year, plus those up to 30 days in the next financial year, England, The NHS Information Centre for health and
social care; and the Office for national Statistics.
Comments on numerator data - Individual finished consultant episodes are linked to other episodes where all are
part of one continuous spell of care for a patient (see CIP spell construction sections in Annex 4 (Methods section
of the Clinical and Health Outcomes Knowledge Base www.nchod.nhs.uk ) for details). Admission and death can
occur in separate episodes and even in separate hospitals after transfer. A spell may contain HES data from
another year only when one of its episodes spans years. For example, a spell which finished during April may
contain admission information from an episode which started during the previous March.
The indicator includes deaths occurring after transfer to another Trust. For residence based aggregations, deaths
are counted to the first valid organisation coded in the spell; for provider based aggregations, (Provider Trusts and
Clusters) deaths are counted to the first valid organisation coded in the spell.
There is variation in the completeness of hospital records and quality of coding (see Data Quality sections in
Annex 4 (Methods section of the Clinical and Health Outcomes Knowledge Base www.nchod.nhs.uk ) for details).
Denominator:
Denominator data - The number of finished continuous inpatient spells following an emergency admission for
patients of all ages with a primary diagnosis on admission of myocardial infarction (ICD 10 codes I21-I22):
•
•
I21.- Acute myocardial infarction;
I22.- Subsequent myocardial infarction.
The following fields and values are used for the denominator:
The first episode in the CIPS has:
DIAG_01 in the valid list for this indicator (primary diagnosis);
AND EPIORDER = 1 (episode order);
AND EPITYPE = 1 (episode type);
AND ADMIMETH = 21, 22, 23, 24 or 28 (admission method);
AND EPISTART is valid and >= 01/04/YYYY and <= 31/03/YYYY+1 (episode start date);
AND CLASSPAT = 1 (patient classification);
AND STARTAGE 35-74 (age at start of episode);
AND SEX = 1 or 2 (sex);
AND EPISTAT = 3 (episode status);
AND ADMISORC is not 51, 52 or 53 (admission source);
AND DOB not 01/01/1900 or 01/01/1901 (date of birth).
The last episode in the CIPS (or HES/ONS linked*) has:
DISMETH* = 1-4 (discharge method);
AND DISDATE* is valid (discharge date).
Fields used from the first episode in a spell where there is a valid patient postcode allowing the derivation of
the following organisation of residence codes include:
SPELLRESPCTC, SPELLRESLADSTC, SPELLRESSTHAC. Other organisational levels (E, GOR,
ONS Areas, Counties) are aggregates of the SPELLRESLADSTC field.
Fields used from the first episode in a spell include:
PROCODETC (provider code, unmapped). Provider clusters are aggregates of the PROCODETC
field.
Counts are by:
age / sex / 3 digit primary diagnosis / organisation of residence in CIP spell (values for England are
aggregates of these)
where:
347
age bands are 35-39, … , 70-74;
sex is 1, 2 (male and female).
Source of denominator data - Hospital Episode Statistics (HES) for CIP spells intersecting the respective financial
year, England, The NHS Information Centre for health and social care.
Comments on denominator data – The age range was selected for consistency with indicators recommended in
the Coronary Heart Disease National Service framework. There have been changes over the past few years in the
way in which myocardial infarction is diagnosed and hence there may be variations between organisations and
years in case selection. A decision was made to use the primary diagnosis field, following tests to check where
myocardial infarction is usually coded in an episode and in a CIP spell. Myocardial infarction coded elsewhere
could refer to admission for other reasons or infarction occurring in hospital.
There is variation in the completeness of hospital records and quality of coding (see Data Quality sections in
Annex 4 (Methods section of the Clinical and Health Outcomes Knowledge Base www.nchod.nhs.uk ) for details).
There may also be variation between hospitals in the way that they code diagnoses to the fourteen diagnosis fields
in each episode, particularly primary diagnosis. For instance, they may code in the order in which the diagnoses
were made, or according to their perceived importance or complexity. This may affect whether a particular spell is
selected for inclusion in this indicator.
Statistical Methods:
The indicator is indirectly standardised by age, sex and 3 digit primary diagnosis. The person-based rate is
standardised by age, sex and 3 digit primary diagnosis using England age, sex and primary diagnosis rates as
standards. The gender-specific rates are standardised by age and 3 digit primary diagnosis using person-based
standards, in order to highlight differences across gender. Indirect standardisation involves the calculation of the
ratio of an organisation’s observed number of events and the number of events that would be expected if it had
experienced the same event rates as those of patients in England, given the mix of age, sex and diagnosis (first or
subsequent myocardial infarction) of its patients. This standardised ratio is then converted into a rate by
multiplying it by the overall event rate of patients in England.
The percentage change in rates from a previous year, plus the statistical significance of this change, have also
been calculated. For all indicators a positive percentage represents improvement and a negative percentage
represents deterioration.
Annex 3 ‘Explanation of statistical methods’ (Methods section of the Clinical and Health Outcomes Knowledge
Base www.nchod.nhs.uk ) describes the methods used for indirect standardisation, calculation of improvement,
estimation of confidence intervals, and banding of significance of improvement.
Interpretation of indicator:
Type of indicator - This is a condition-specific, cross-sectional annual comparative indicator of outcome. In the
absence of an absolute standard, comparative data are useful for monitoring in relation to rates achieved in
comparable organisations.
Quality of Indicator - Annex 12 (Methods section of the Clinical and Health Outcomes Knowledge Base
www.nchod.nhs.uk ) describes the criteria that should be used to judge the quality of this indicator. The application
of the criteria is dependent on the context (e.g. describing a single organisation, comparing several organisations)
and the level (e.g. national / regional with large numbers of events, local with small numbers of events) at which
the data are to be used.
Confidence Intervals - Some of the values and factors influencing the indicator may be chance occurrences, with
values fluctuating at random between organisations and from year to year. Numbers of admissions may be small
at Primary Care Organisation, Local Authority and provider Trust level. The results should therefore be interpreted
with caution and with the aid of confidence intervals. The 95% confidence interval provides a measure of the
statistical precision of the rate for an area or institution. It indicates a range which, with 95% confidence, will
contain the underlying value of the indicator. If the confidence interval for an area’s rate does not contain the
overall national rate, the difference between the two rates is considered statistically significant. If the confidence
interval overlaps the national rate, in most cases the difference between the rates would not be considered
statistically significant. 95% and 99.8% confidence intervals have been calculated.
Effect of case-mix/severity - A number of factors outside the control of hospitals, such as the socio-economic mix
of local populations and events prior to hospitalisation (particularly death before admission), may contribute to the
variation shown by the indicators. Differences in case-mix, severity of the myocardial infarction, comorbidities and
other potential risk factors also contribute to the variation. The data available do not allow adjustment for any of
these factors. This may pose less of a constraint at geographical organisation level than at hospital level. We
have tried to deal with this constraint by presenting the data in clusters that are similar with respect to institution or
organisation type. Gender-specific data standardised to person rates and analyses at England level by the Index
of Multiple Deprivation are presented.
348
Other potential confounding factors - The patterns of providing care may vary between NHS hospital trusts in
terms of: extent of prevention and treatment in primary care settings; referral policies and practices; and hospital
admission policies and practices. Variation between hospitals in average length of stay may also lead to variation
between hospitals in the proportion of deaths occurring in hospital as opposed to in the community after discharge
from hospital.
Potential value of indicator:
To stimulate discussion and encourage local investigation, and to lead to improvement in data quality and quality
of care.
Potential for follow-up action leading to change:
Studies to assess potentially avoidable factors related to high observed death rates locally are recommended.
Relevant national initiatives:
This indicator is among those recommended by a Working Group on Outcome Indicators for myocardial infarction,
set up to advise the Department of Health on new indicators. The indicator was part of the NHS Performance
Indicators published by the Department of Health in 1999 and 2000. The Coronary Heart Disease National Service
Framework covers national standards for the prevention and treatment of coronary heart disease.
Further reading:
1.
2.
Commission on Professional and Hospital Activities. Hospital Wide Quality Indicators. Ann Arbor, 1991.
Carroll JG. Monitoring with Indicators: Evaluating the Quality of Patient Care. Maryland: Aspen Publications,
1992.
3. CRAG Clinical Outcomes Working Group. Clinical Outcome Indicators. Edinburgh: The Scottish Office,
1994.
4. Birkhead J, Goldacre M, Mason A, Wilkinson E, Amess M, Cleary R (eds). Health Outcome Indicators:
Myocardial Infarction. Report of a working group to the Department of Health. Oxford: National Centre for
Health Outcomes Development, 1999 (www.nchod.nhs.uk ).
5. Department of Health. Coronary Heart Disease: National service framework – modern standards and
service models. London: Department of Health, 2000.
6. Department of Health. NHS Performance Indicators: February 2002. London: Department of Health, 2002.
Department of Health. Coronary Heart Disease National service framework: Leading the way – Progress report
2005. London: Department of Health, 2005.
Updated: November 2010
349
Deaths within 30 days of a hospital procedure: coronary artery bypass graft
Purpose:
The national confidential enquiries into deaths after surgery (NCEPOD) have, over many years, consistently
shown that some deaths are associated with shortcomings in health care. The National Health Service (NHS) may
be helped to prevent such potentially avoidable deaths by seeing comparative figures and learning lessons from
the confidential enquiries, and from the experience of hospitals with low death rates.
Definition of indicator:
Deaths occurring in hospital and after discharge between 0 and 29 days (inclusive) of a first Coronary Artery
Bypass Graft (CABG).
Statistic
Sex
Age
group
Organisation
(see glossary)
Indirectly age,
sex and
method of
admissionstandardised
rate per
100,000
(standardised
to 2003/04,
2004/05,
2005/06
pooled)
P
F
M
All
Ages
E; GOR; ONS
area (boundaries
as at November
2006); SHA
(boundaries as at
July 2006);
County; LA
(boundaries as at
April 2009); PCO
(boundaries as at
October 2006);
deprivation group
(5, 7 bands);Trust
Cluster; Trust.
Indirectly age,
sex and
method of
admissionstandardised
rate per
100,000
(standardised
to 2004/05)
P
F
M
All
Ages
E
Period
Current
data
FY 2006/07,
FY 2007/08,
FY 2008/09
pooled
FY 2008/09
File_worksheet Name
Trend data
FYs
1999/00,
2000/01,
2001/02
pooled;
FYs
2000/01,
2001/02,
2002/03
pooled;
FYs
2001/02,
2002/03,
2003/04
pooled;
FYs
2002/03,
2003/04,
2004/05
pooled;
FYs
2003/04,
2004/05,
2005/06
pooled;
FYs
2004/05,
2005/06,
2006/07
pooled ;
FY 2005/06,
FY 2006/07,
FY 2007/08
pooled
FY 1999/00,
FY 2000/01,
FY 2001/02,
FY 2002/03
FY 2003/04
FY 2004/05,
FY 2005/06,
FY 2006/07,
FY 2007/08
09F_211ISR1CPP1_09_V1
09F_211ISR1CFP1_09_V1
09F_211ISR1CMP1_09_V1
09F_211ISR1CPP2_09_V1
09F_211ISR1CFP2_09_V1
09F_211ISR1CMP2_09_V1
Numerator:
Numerator data - The number of denominator continuous inpatient (CIP) spells i.e. spells with a first Coronary
Artery Bypass Graft procedure (OPCS 4 codes K40-K46) except after a Percutaneous Transluminal Coronary
Angioplasty (PTCA) (OPCS 4 codes K49-K50 other than K50.2 and K50.3) and / or alongside a heart valve
350
procedure (OPCS 4 codes K25-K38), where the patient dies in hospital or after discharge between 0-29 days
(inclusive) of the first eligible procedure in the spell in the respective financial year(s).
Deaths that occur outside hospital following discharge but between 0-29 days of the procedure are included. This
was achieved through linkage of Hospital Episode Statistics (HES) data with deaths data from the Office for
National Statistics (ONS). Records of all deaths which occurred in England during the period of analysis for each
indicator plus 30 days after were obtained from the ONS. Linkage was undertaken using the most recent CIP
denominator spell for each person discharged alive.
The date of the first valid procedure, and the date and method of discharge from the last episode in the CIP spell
(or HES/ONS linked data), are used to determine the interval between procedure and death.
Where the operation date is missing, invalid, or after the end of the spell, it is assumed that the procedure took
place one day after the start of the episode containing the procedure. If the episode start date is not valid then it is
assumed the procedure took place one day after the admission date of the spell. If this is still not valid, then the
date is left blank. The exception to this is where the episode starts and ends on the same day, in which case the
procedure is assumed to take place on the day the episode started.
The numerator is the number of denominator CIP spells with the following fields and values:
The last episode in CIP spell (or HES/ONS linked*) has:
DISMETH* = 4 (discharge method);
AND DISDATE* minus procedure date = 0-29 days inclusive (discharge date and date of valid
procedure).
Fields used from the first episode in a spell where there is a valid patient postcode allowing the derivation of
the following organisation of residence codes include:
SPELLRESPCTC, SPELLRESLADSTC, SPELLRESSTHAC. Other organisational levels (E, GOR,
ONS Areas, Counties) are aggregates of the SPELLRESLADSTC field.
Fields used from the episode in a spell where the first valid procedure took place include:
PROCODETC (provider code, unmapped). Provider clusters are aggregates of the PROCODETC
field.
Counts are by:
age / sex / admission method / organisation of residence in CIP spell (values for England are
aggregates of these)
where:
age bands are <1, 1-4, 5-9, … , 80-84, 85+;
sex is 1, 2 (male and female); and
admission method is elective or non-elective.
Source of numerator data - Hospital Episode Statistics (HES) for CIP spells intersecting the respective financial
year, plus those up to 30 days in the next financial year, England, The NHS Information Centre for health and
social care; and the Office for National Statistics.
Comments on numerator data - Individual finished consultant episodes are linked to other episodes where all are
part of one continuous spell of care for a patient (see CIP spell construction sections in Annex 4 (Methods section
of Clinical and Health Outcomes Knowledge Base www.nchod.nhs.uk ) for details). The selected procedure and
death can occur in separate episodes and even in separate hospitals after transfer. A spell may contain HES data
from another year only when one of its episodes spans years. For example, a spell which finished during April may
contain admission information from an episode which started during the previous March.
The numerator relates to death following the first eligible procedure found in a CIP spell in any episode (the first
procedure can appear in any of the operation fields in an episode).
The indicator includes deaths occurring after transfer to another Trust. For residence based aggregations, deaths
are counted to the first valid organisation coded in the spell; for provider based aggregations, (Provider Trusts and
Clusters) deaths are counted to the organisation that performed the procedure.
There is variation in the completeness of hospital records and quality of coding (see Data Quality sections in
Annex 4 (Methods section of Clinical and Health Outcomes Knowledge Base www.nchod.nhs.uk ) for details).
There may be variation between Trusts in the way that they code operations to the operation fields in each
episode. For instance, Trusts may code procedures chronologically, or according to the degree of complexity of
the procedure. There may also be variation in the proportion of cases where the operation date is not coded.
351
Denominator:
Denominator data - The number of continuous inpatient spells where there was at least one Coronary Artery
Bypass Graft (CABG) procedure (OPCS 4 codes K40-K46) in any operation field in the spell, except where the
CABG occurred after a Percutaneous Transluminal Coronary Angioplasty (PTCA) procedure (OPCS 4 codes K49K50 other than K50.2 and K50.3) and/or alongside a heart valve procedure (OPCS 4 codes K25-K38). A spell may
include more than one operative procedure:
•
•
•
•
•
•
•
K40.K41.K42.K43.K44.K45.K46.-
Saphenous vein graft replacement of coronary artery
Other autograft replacement of coronary artery
Allograft replacement of coronary artery
Prosthetic replacement of coronary artery
Other replacement of coronary artery
Connection of thoracic artery to coronary artery
Other bypass of coronary artery
Day cases are excluded. A CIP spell may include more than one operative procedure.
The following fields and values are used for the denominator.
The first episode in the CIP spell has:
EPIORDER = 1 (episode order);
AND EPITYPE = 1 or 2 (episode type);
AND EPISTART is valid (episode start date);
AND CLASSPAT = 1 or 5 (patient classification);
AND STARTAGE is either 0-120 or 7001-7007 (age at start of episode);
AND SEX = 1 or 2 (sex);
AND EPISTAT = 3 (episode status);
AND DOB not 01/01/1900 or 01/01/1901 (date of birth).
AND the first episode in the provider spell where the procedure took place has:
ADMIMETH is valid (admission method).
AND the last episode in the CIP spell (or HES/ONS linked*) has:
DISMETH* = 1-4 (discharge method);
AND DISDATE* is valid (discharge date).
AND the episode in the CIP spell where the valid procedure was found has:
CI1C_NEWDATE is valid and between 01/04/YYYY and 31/03/YYYY+1 (date of procedure is
within the year);
AND CI1C_NEWOPER = K40-K46 (first procedure is a CABG i.e. not after a PTCA).
AND no heart valve procedures are coded anywhere in the spell (OPERTN_01-12 = K23-K38 (all procedure
fields)).
Where the operation date is missing, similar logic to that described in the section on numerator data has
been used to provide a proxy date.
Fields used from the first episode in a spell where there is a valid patient postcode allowing the derivation of
the following organisation of residence codes include:
SPELLRESPCTC, SPELLRESLADSTC, SPELLRESSTHAC. Other organisational levels (E, GOR,
ONS Areas, Counties) are aggregates of the SPELLRESLADSTC field.
Fields used from the episode in a spell where the first valid procedure took place include:
PROCODETC (provider code, unmapped). Provider clusters are aggregates of the PROCODETC
field.
Counts are by:
age / sex / admission method / organisation of residence in CIP spell (values for England are
aggregates of these)
where:
age bands are <1, 1-4, 5-9, … , 80-84, 85+;
sex is 1, 2 (male and female); and
admission method is elective, non-elective.
Source of denominator data - Hospital Episode Statistics (HES) for CIP spells intersecting the respective financial
year, England, The NHS Information Centre for health and social care.
352
Comments on denominator data - There is variation in the completeness of hospital records and quality of coding
(see Data Quality sections in Annex 4 (Methods section of Clinical and Health Outcomes Knowledge Base
www.nchod.nhs.uk) for details). Denominator CIP spells are selected if there is at least one mention of an eligible
procedure. As there may be more than one eligible procedure in a spell, each such spell is only counted once.
There may be variation between Trusts in the way that they code operations to the operation fields in each
episode. For instance, Trusts may code procedures chronologically, or according to the degree of complexity of
the procedure. This may affect which procedure is selected for calculation of interval to death.
Day cases are excluded because CABGs are unlikely to occur in day cases.
Statistical Methods:
The indicator is indirectly standardised by age, sex, and method of admission. The person-based rate is
standardised by age, sex, and method of admission using England age, sex, and method of admission rates as
standards. The gender-specific rates are standardised by age and method of admission using person-based
standards, in order to highlight differences across gender. Indirect standardisation involves the calculation of the
ratio of an organisation’s observed number of events and the number of events that would be expected if it had
experienced the same event rates as those of patients in England, given the mix of age, sex, and method of
admission of its patients. This standardised ratio is then converted into a rate by multiplying it by the overall event
rate of patients in England.
The percentage change in rates from a previous year (or previous set of pooled years), plus the statistical
significance of this change, have also been calculated. For all indicators a positive percentage represents
improvement and a negative percentage represents deterioration.
Annex 3 ‘Explanation of statistical methods’ (Methods section of the Clinical and Health Outcomes Knowledge
Base www.nchod.nhs.uk ) describes the methods used for indirect standardisation, calculation of improvement,
estimation of confidence intervals, and banding of significance of improvement.
Interpretation of indicator:
Type of indicator - This is a procedure-specific, cross-sectional annual comparative indicator of outcome. In the
absence of an absolute standard, comparative data are useful for monitoring in relation to rates achieved in
comparable organisations.
Quality of Indicator - Annex 12 (Methods section of the Clinical and Health Outcomes Knowledge Base
www.nchod.nhs.uk ) describes the criteria that should be used to judge the quality of this indicator. The application
of the criteria is dependent on the context (e.g. describing a single organisation, comparing several organisations)
and the level (e.g. national / regional with large numbers of events, local with small numbers of events) at which
the data are to be used.
Confidence Intervals - Some of the values and factors influencing the indicator may be chance occurrences, with
values fluctuating at random between organisations and from year to year. Numbers of admissions may be small
at Primary Care Organisation, Local Authority and provider Trust level. The results should therefore be interpreted
with caution and with the aid of confidence intervals. The 95% confidence interval provides a measure of the
statistical precision of the rate for an area or institution. It indicates a range which, with 95% confidence, will
contain the underlying value of the indicator. If the confidence interval for an area’s rate does not contain the
overall national rate, the difference between the two rates is considered statistically significant. If the confidence
interval overlaps the national rate, in most cases the difference between the rates would not be considered
statistically significant. 95% and 99.8% confidence intervals have been calculated.
Effect of case-mix/severity - A number of factors outside the control of hospitals, such as the socio-economic mix
of local populations and events prior to hospitalisation, may contribute to the variation shown by the indicators.
Differences in case-mix, comorbidities and other potential risk factors also contribute to the variation. Current data
do not allow assignment of severity of illness and seriousness of operations across continuous inpatient spells, nor
do they allow adjustment for these factors. This may pose less of a constraint at geographical organisation level
than at hospital level. We have tried to deal with this constraint by presenting the data in clusters that are similar
with respect to institution or organisation type. Gender-specific data standardised to person rates as well as
analyses at England level by the Index of Multiple Deprivation are presented.
Other potential confounding factors - The patterns of providing care may vary between organisations in terms of:
extent of treatment in primary care settings; referral policies and practices; and hospital admission policies and
practices. Variation between hospitals in average length of stay may also lead to variation between hospitals in the
proportion of deaths occurring in hospital as opposed to in the community after discharge from hospital.
Potential value of indicator:
To stimulate discussion and encourage local investigation, and to lead to improvement in data quality and quality
of care.
353
Potential for follow-up action leading to change:
Studies to assess the extent to which deaths were linked to the previous surgery and truly represented potentially
avoidable adverse events are recommended.
Relevant national initiatives:
The National Confidential Enquiry into Perioperative Deaths examines factors associated with perioperative
deaths. This indicator has been used by the Department of Health in the NHS Performance Indicators, and by the
Commission for Health Improvement and the Healthcare Commission in NHS Performance Ratings, between
1999 and 2005. It has also been used for international comparisons.
Further reading:
1.
2.
3.
Commission on Professional and Hospital Activities. Hospital Wide Quality Indicators. Ann Arbor, 1991.
Callum KG, Carr NJ, Gray AJC, Hargraves CMK, Hoile RW, Ingram GS, Martin IC, Sherry KM. Functioning
as a Team? – The 2002 Report of the National Confidential Enquiry into Perioperative Deaths. London:
NCEPOD, 2002.
Department of Health. NHS Performance Indicators: February 2002. London: Department of Health, 2002.
Healthcare Commission. 2005 performance ratings: July 2005 website
http://ratings2005.healthcarecommission.org.uk/. London: Healthcare Commission, 2005.
Updated: November 2010
354
Prevalence: coronary heart disease
Purpose:
To ascertain the prevalence of coronary heart disease (CHD) from General Practice records and help ensure high
standards of primary health care and treatment delivered to NHS patients.
CHD is the single most common cause of premature death in the UK. The research evidence relating to the
management of CHD is well established and if implemented can reduce the risk of premature death from CHD and
improve the quality of life for patients.
Definition of indicator and its variants:
Proportion of all patients with CHD in a GP registered population.
The register includes all patients who have had coronary revascularisation procedures such as coronary artery
bypass grafting (CABG), those with past history of myocardial infarction (heart attack) or other CHD diagnoses,
even if they do not have a current active diagnosis of CHD.
Statistic
Sex
Age
group
Organisation
(see glossary)
Number and percent of
patients
P
All Ages
E, GOR, SHA,
PCO
Period
Current
data
FY 2008/09
File_worksheet Name
Trend data
09H_600PC_09_V1
Numerator:
Numerator data - Patients registered with GP practices with a coded diagnosis of CHD.
Source of numerator data - Quality and Outcomes Framework (QOF).
Comments on numerator data - The data for this primary care indicator are derived from the Quality Management
Analysis System (QMAS) and supplied by the Prescribing Support Unit at The NHS Information Centre for health
and social care. The QOF is part of the General Medical Services (GMS) contract, with a focus on prevalence and
management of common chronic diseases at general practice level. It is aimed at measuring the achievement of
general practices against a set of evidence based negotiated standards and encouraging good practice.
The data to support the clinical quality indicators (i.e. clinical achievement data) are extracted from individual GP
practice clinical systems and sent automatically to QMAS once a month. Practices can make additional
submissions of clinical data at any time.
Denominator:
Denominator data - All patients registered with GP practices (total practice list size).
Source of denominator data - See “Numerator data”.
Comments on denominator data - The practice list sizes are supplied to QMAS from the National Health
Applications and Infrastructure Services (NHAIS).
Statistical methods:
The data are presented as raw (unadjusted) figures as recorded by the practices. Ideally, comparisons between
PCOs should take into account differences between their populations in terms of age, gender and case-mix.
However, this is not possible at present as the supplied data are not broken down by these characteristics.
Interpretation of indicators:
Quality of indicator - Users of data derived from QMAS should recognise that QMAS was established as a
mechanism to support the calculation of practice QOF payments and not as a person based epidemiological tool.
It is not a comprehensive source of data on quality of care in general practice, but it is potentially a rich and
valuable source of such information, providing that the limitations of the data are acknowledged.
From 2009 onwards, National Prevalence Day has been moved to 31st March (previously 14th February) so that
prevalence is calculated on the same basis as disease registers for indicator denominators.
There have been some significant revisions to the QOF, compared to previous years. Therefore direct
comparisons cannot be made except for the indicators that have not been subject to definitional changes.
355
Further reading:
1.
The NHS Information Centre for health and social care. National Quality and Outcomes Framework
Achievement Data 2008/09, September 2009. Available at: http://www.ic.nhs.uk/webfiles/QOF/200809/QOF%20Achievement%20and%20Prevalence%20Bulletin%202008-09.pdf
2. NHS Employers and General Practitioners Committee BMA. Quality and Outcomes Framework guidance for
GMS contract 2008/09, April 2008. Available at:
http://www.nhsemployers.org/SiteCollectionDocuments/QUALITY_OUT_COMPLETE_CD_110209.pdf
3. The NHS Information Centre for health and social care. National Quality and Outcomes Framework Statistics
for England 2007/08. Available at:
http://www.ic.nhs.uk/webfiles/QOF/2007-08/QOF%20200708%20Statistical%20Bulletin.pdf
4. The Information Centre for health and social care, Prescribing Support Unit. National Quality and Outcomes
Framework Statistics for England 2006/07. Available at:
http://www.ic.nhs.uk/webfiles/QOF/2006-07/QOF%202006-07%20Statistical%20Bulletin.pdf
5. The Information Centre for health and social care, Prescribing Support Unit. National Quality and Outcomes
Framework or England 2005/06. Available at:
http://www.ic.nhs.uk/webfiles/publications/qof/NationalQualityOutcomesFramework280906_PDF.pdf
6. The Health and Social Care Information Centre, National Quality and Outcomes Framework Statistics for
England 2004/05. Available at:
http://www.ic.nhs.uk/webfiles/publications/qof0405/QOF0405_Statistical_Bulletin.pdf
7. Ashworth M, Armstrong D. The relationship between general practice characteristics and quality of care: a
national survey of quality indicators used in the UK Quality and Outcomes Framework, 2004-5, BMC Family
Practice, London: Ashworth and Armstrong, 2006 7:68. Available at:
http://www.biomedcentral.com/1471-2296/7/68
8. Department of Health, Investing in General Practice. The New General Medical Services Contract. Available
at: http://www.dh.gov.uk/assetRoot/04/07/86/58/04078658.pdf
9. Eastern Region Public Health Observatory, The limitations of Quality and Outcomes Framework (QOF) data.
Briefing No. 3, 2005. Available at:
http://www.erpho.org.uk/Download/Public/12597/1/Briefing%2003%20The%20limitations%20of%20QOF%20d
ata.pdf
10. Strong M, Maheswaran R, Radford J. Socioeconomic deprivation, coronary heart disease prevalence and
quality of care: a practice-level analysis in Rotherham using data from the new UK general practitioner Quality
and Outcomes Framework. Journal of Public Health, Oxford University Press, 2006, 28:1, 39-42. Available at:
http://www.ingentaconnect.com/content/oup/jph/2006/00000028/00000001/art00039
11. Low A, Low A. The QOF equity window: an illusion or a different view? Journal of Public Health, 2006 28(3):
293-294. Available at http://jpubhealth.oxfordjournals.org/cgi/content/full/28/3/293
Updated: October 2010
356
Exercise testing / specialist referral for patients with newly diagnosed angina
Purpose:
To help reduce the level of risk to health for NHS patients with angina and ensure high standards of primary health
care and treatment delivered to them.
As an additional assessment, patients with newly diagnosed angina should be referred for exercise-testing or
myocardial perfusion scanning. The aim of further investigation is to provide diagnostic and prognostic information
and to identify patients who may benefit from further intervention.
An alternative to referral for exercise testing is referral to a specialist for evaluation. Referrral would normally be to
a cardiologist, general physician or GP with a special interest.
Definition of indicator and its variants:
Proportion of patients with newly diagnosed angina who are referred for exercise testing and/or specialist
assessment.
Statistic
Sex
Age
group
Organisation
(see glossary)
Number and percent of
patients
P
All Ages
E, GOR, SHA,
PCO
Period
Current
data
FY 2008/09
File_worksheet Name
Trend data
09I_601PC_09_V1
Numerator:
Numerator data - Patients with newly diagnosed angina (after 1st April 2003) who are referred for exercise testing
and/or specialist assessment three months before and up to12 months after a diagnosis is recorded.
Source of numerator data - Quality and Outcomes Framework (QOF).
Comments on numerator data - The data for this primary care indicator are derived from the Quality Management
Analysis System (QMAS) and supplied by the Prescribing Support Unit at The NHS Information Centre for health
and social care. The QOF is part of the General Medical Services (GMS) contract, with a focus on prevalence and
management of common chronic diseases at general practice level. It is aimed at measuring the achievement of
general practices against a set of evidence based negotiated standards and encouraging good practice.
The data to support the clinical quality indicators (i.e. clinical achievement data) are extracted from individual GP
practice clinical systems and sent automatically to QMAS once a month. Practices can make additional
submissions of clinical data at any time.
The ‘reference date’ is the specified date of patient records held by the general practice modelled for the end of the
st
QOF year (midnight 31 March). It is the same for the data from all practices and may differ from the date of data
submission.
Denominator:
Denominator data - Patients on the CHD register excluding those who have been exception reported. Patients
may be exception reported for the following reasons:
•
angina diagnosis not recorded;
st
•
angina diagnosis recorded before 1 April 2003;
•
registered in the three months before the reference date;
•
CHD exception reported in the 15 months before the reference date;
•
exception for exercise test reported in the 12 months after diagnosis of angina;
•
angina diagnosis recorded in the three months before the reference date.
For more details regarding the description of the selection criteria and dataset rules of the relevant indicator set
see the following documentation available at: http://www.wmrlmc.co.uk/gms2/informationtechnology.htm
Source of denominator data - See “Numerator data”.
Comments on denominator data - The denominator is a count of patients for whom the clinical indicator should be
met. However, the selection rules do not provide the same opportunity for all patients included in the denominator
to take advantage of the full period (maximum number of months after the diagnosis) allowed by good practice for
the test, measurement or treatment to be undertaken (e.g. if good practice for angina patients allows for a
particular test to be conducted up to 12 months after diagnosis then patients diagnosed between four and 11
357
months before the reference date do not have the full period of 12 months for the test). Additionally, patients can
be removed from the denominator through the application of exception reporting.
Statistical methods:
The data are presented as raw (unadjusted) figures as recorded by the practices. Ideally, comparisons between
PCOs should take into account differences between their populations in terms of age, gender and case-mix.
However, this is not possible at present as the supplied data are not broken down by these characteristics.
Interpretation of indicators:
Quality of indicator - Users of data derived from QMAS should recognise that QMAS was established as a
mechanism to support the calculation of practice QOF payments and not as a person based epidemiological tool.
It is not a comprehensive source of data on quality of care in general practice, but it is potentially a rich and
valuable source of such information, providing that the limitations of the data are acknowledged.
There have been some significant revisions to the QOF, compared to previous years. Therefore direct
comparisons cannot be made except for the indicators that have not been subject to definitional changes.
Further reading:
1.
2.
3.
4.
5.
6.
7.
8.
9.
The NHS Information Centre for health and social care. National Quality and Outcomes Framework
Achievement Data 2008/09, September 2009. Available at: http://www.ic.nhs.uk/webfiles/QOF/200809/QOF%20Achievement%20and%20Prevalence%20Bulletin%202008-09.pdf
NHS Employers and General Practitioners Committee BMA. Quality and Outcomes Framework guidance for
GMS contract 2008/09, April 2008. Available at:
http://www.nhsemployers.org/SiteCollectionDocuments/QUALITY_OUT_COMPLETE_CD_110209.pdf
The NHS Information Centre for health and social care. National Quality and Outcomes Framework Statistics
for England 2007/08. Available at:
http://www.ic.nhs.uk/webfiles/QOF/2007-08/QOF%20200708%20Statistical%20Bulletin.pdf
The Information Centre for health and social care, Prescribing Support Unit. National Quality and Outcomes
Framework Statistics for England 2006/07. Available at:
http://www.ic.nhs.uk/webfiles/QOF/2006-07/QOF%202006-07%20Statistical%20Bulletin.pdf
The Information Centre for health and social care, Prescribing Support Unit. National Quality and Outcomes
Framework or England 2005/06. Available at:
http://www.ic.nhs.uk/webfiles/publications/qof/NationalQualityOutcomesFramework280906_PDF.pdf
The Health and Social Care Information Centre, National Quality and Outcomes Framework Statistics for
England 2004/05. Available at:
http://www.ic.nhs.uk/webfiles/publications/qof0405/QOF0405_Statistical_Bulletin.pdf
Ashworth M, Armstrong D. The relationship between general practice characteristics and quality of care: a
national survey of quality indicators used in the UK Quality and Outcomes Framework, 2004-5, BMC Family
Practice, London: Ashworth and Armstrong, 2006 7:68. Available at:
http://www.biomedcentral.com/1471-2296/7/68
Department of Health, Investing in General Practice. The New General Medical Services Contract. Available
at: http://www.dh.gov.uk/assetRoot/04/07/86/58/04078658.pdf
Eastern Region Public Health Observatory, The limitations of Quality and Outcomes Framework (QOF) data.
Briefing No. 3, 2005. Available at:
http://www.erpho.org.uk/Download/Public/12597/1/Briefing%2003%20The%20limitations%20of%20QOF%20d
ata.pdf
Updated: October 2010
358
Blood pressure in patients with coronary heart disease
Purpose:
To help reduce the level of risk to health for NHS patients with coronary heart disease (CHD) and ensure high
standards of primary health care and treatment delivered to them.
Epidemiological data indicate that continued hypertension following the onset of CHD increases the risk of an
adverse cardiac event and that the reduction of blood pressure (BP) reduces risk. The British Hypertension
Society Guidelines propose an optimal BP reading of 140/85 or less (and a pragmatic audit standard of 150/90 or
less) for patients with CHD.
Definition of indicator and its variants:
Proportion of patients with CHD, for whom the last blood pressure reading (measured in the previous 15 months)
is 150/90 or less.
Statistic
Sex
Age
group
Organisation
(see glossary)
Number and percent of
patients
P
All Ages
E, GOR, SHA,
PCO
Period
Current
data
FY 2008/09
File_worksheet Name
Trend data
09K_603PC_09_V1
Numerator:
Numerator data - Patients on the CHD register, for whom a BP reading measured in the 15 months before the
reference date is 150/90 or less.
Source of numerator data - Quality and Outcomes Framework (QOF).
Comments on numerator data - The data for this primary care indicator are derived from the Quality Management
Analysis System (QMAS) and supplied by the Prescribing Support Unit at The NHS Information Centre for health
and social care. The QOF is part of the General Medical Services (GMS) contract, with a focus on prevalence and
management of common chronic diseases at general practice level. It is aimed at measuring the achievement of
general practices against a set of evidence based negotiated standards and encouraging good practice.
The data to support the clinical quality indicators (i.e. clinical achievement data) are extracted from individual GP
practice clinical systems and sent automatically to QMAS once a month. Practices can make additional
submissions of clinical data at any time.
The ‘reference date’ is the specified date of patient records held by the general practice modelled for the end of
st
the QOF year (midnight 31 March). It is the same for the data from all practices and may differ from the date of
data submission.
Denominator:
Denominator data - Patients on the CHD register excluding those who have been exception reported. Patients
may be exception reported for the following reasons:
•
BP recording exception reported in the 15 months before the reference date;
•
registered in the nine months before the reference date;
•
CHD exception reported in the 15 months before the reference date;
•
ischaemic heart disease diagnosis recorded in the nine months before the reference date;
•
maximal BP therapy recorded in the 15 months before the reference date.
For more details regarding the description of the selection criteria and dataset rules of the relevant indicator set
see the following documentation available at: http://www.wmrlmc.co.uk/gms2/informationtechnology.htm
Source of denominator data - See “Numerator data”.
Comments on denominator data - The denominator is a count of patients for whom the clinical indicator should be
met. However, the selection rules do not provide the same opportunity for all patients included in the denominator
to take advantage of the full period (maximum number of months after the diagnosis) allowed by good practice for
the test, measurement or treatment to be undertaken (e.g. if good practice for angina patients allows for a
particular test to be conducted up to 12 months after diagnosis then patients diagnosed between four and 11
months before the reference date do not have the full period of 12 months for the test). Additionally, patients can
be removed from the denominator through the application of exception reporting.
359
Statistical methods:
The data are presented as raw (unadjusted) figures as recorded by the practices. Ideally, comparisons between
PCOs should take into account differences between their populations in terms of age, gender and case-mix.
However, this is not possible at present as the supplied data are not broken down by these characteristics.
Interpretation of indicators:
Quality of indicator - Users of data derived from QMAS should recognise that QMAS was established as a
mechanism to support the calculation of practice QOF payments and not as a person based epidemiological tool.
It is not a comprehensive source of data on quality of care in general practice, but it is potentially a rich and
valuable source of such information, providing that the limitations of the data are acknowledged.
There have been some significant revisions to the QOF, compared to previous years. Therefore direct
comparisons cannot be made except for the indicators that have not been subject to definitional changes.
Further reading:
1.
2.
3.
4.
5.
6.
7.
8.
9.
The NHS Information Centre for health and social care. National Quality and Outcomes Framework
Achievement Data 2008/09, September 2009. Available at: http://www.ic.nhs.uk/webfiles/QOF/200809/QOF%20Achievement%20and%20Prevalence%20Bulletin%202008-09.pdf
NHS Employers and General Practitioners Committee BMA. Quality and Outcomes Framework guidance for
GMS contract 2008/09, April 2008. Available at:
http://www.nhsemployers.org/SiteCollectionDocuments/QUALITY_OUT_COMPLETE_CD_110209.pdf
The NHS Information Centre for health and social care. National Quality and Outcomes Framework Statistics
for England 2007/08. Available at:
http://www.ic.nhs.uk/webfiles/QOF/2007-08/QOF%20200708%20Statistical%20Bulletin.pdf
The Information Centre for health and social care, Prescribing Support Unit. National Quality and Outcomes
Framework Statistics for England 2006/07. Available at:
http://www.ic.nhs.uk/webfiles/QOF/2006-07/QOF%202006-07%20Statistical%20Bulletin.pdf
The Information Centre for health and social care, Prescribing Support Unit. National Quality and Outcomes
Framework or England 2005/06. Available at:
http://www.ic.nhs.uk/webfiles/publications/qof/NationalQualityOutcomesFramework280906_PDF.pdf
The Health and Social Care Information Centre, National Quality and Outcomes Framework Statistics for
England 2004/05. Available at:
http://www.ic.nhs.uk/webfiles/publications/qof0405/QOF0405_Statistical_Bulletin.pdf
Ashworth M, Armstrong D. The relationship between general practice characteristics and quality of care: a
national survey of quality indicators used in the UK Quality and Outcomes Framework, 2004-5, BMC Family
Practice, London: Ashworth and Armstrong, 2006 7:68. Av