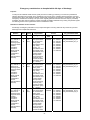
1
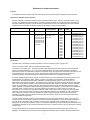
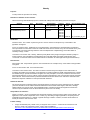
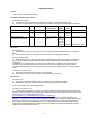
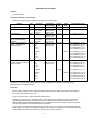
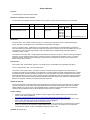
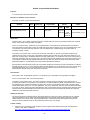
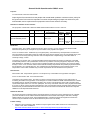
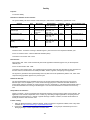
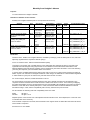
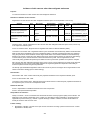
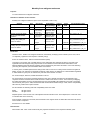
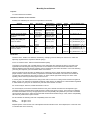
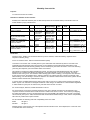
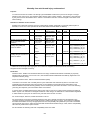
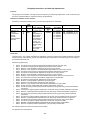
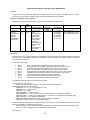
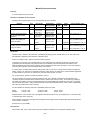
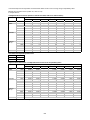
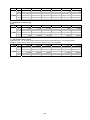
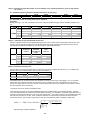
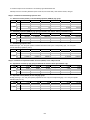
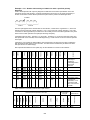
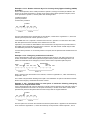
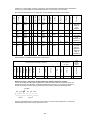
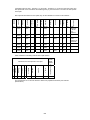
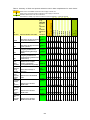
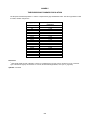
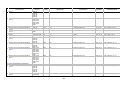
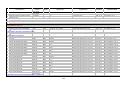
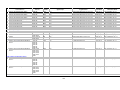
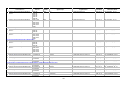
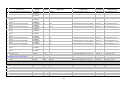
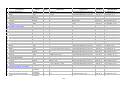
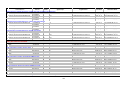
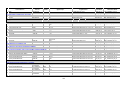
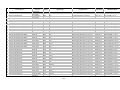
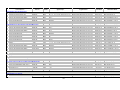
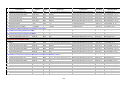
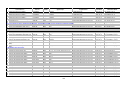
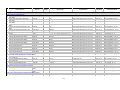
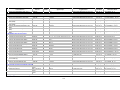
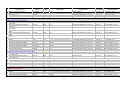
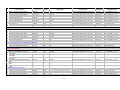
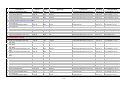
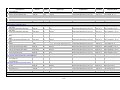
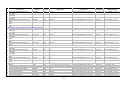
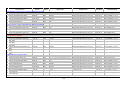
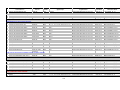
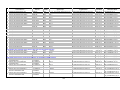
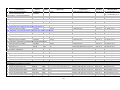
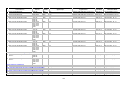
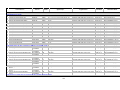
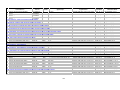
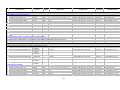
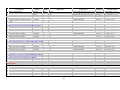
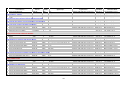
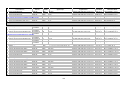
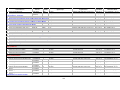
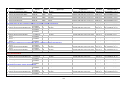
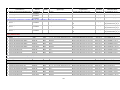
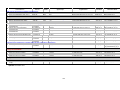
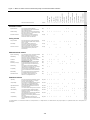
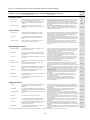
Mortality from oesophageal cancer
Purpose:
To reduce deaths from oesophageal cancer.
Definition of indicator and its variants:
Mortality from oesophageal cancer (ICD-10 C15 equivalent to ICD-9 150).
Statistic
Number of deaths
Average age-specific death
rate per 100,000 resident
population
Indirectly age-standardised
mortality ratio (SMR) and
number of deaths
Directly age-standardised
mortality rate per 100,000 and
number of deaths
Sex
Age group
MFP 1+, 1-4, 5-14,
15-34, 35-64,
65-74, 75+
MFP 1+, 1-4, 5-14,
15-34, 35-64,
65-74, 75+
MFP All ages,
<75
All ages
MFP All ages,
<75
Organisation
(see glossary)
Current
data
E&W, E, GOR,
ONS area, SHA,
LA, PCO, CTY
E&W, E, GOR,
ONS area, SHA,
LA, PCO, CTY
E&W, E, GOR,
ONS area, SHA,
LA, PCO, CTY
2008
37B_189NO_08_V1
2006-08
37B_189CR_08_V1
2006-08
37B_189SM00++_08_V1
37B_189SM0074_08_V1
E&W, E, GOR,
ONS area, SHA,
LA, PCO, CTY
All ages
2006-08
Trend
data
File-worksheet name
1993-08 37B_189SMT00++_08_V1
37B_189DR00++_08_V1
37B_189DR0074_08_V1
1993-08 37B_189DRT00++_08_V1
Numerator:
Numerator data - Deaths from oesophageal cancer, classified by underlying cause of death (ICD-10 C15, ICD-9
150 adjusted), registered in the respective calendar year(s).
Source of numerator data - Office for National Statistics (ONS).
Comments on numerator data - Mortality data for years 1993-2006 were extracted by ONS in June 2007 with
organisational codes assigned using the postcode of usual residence and the November 2006 edition of the
National Statistics Postcode Directory (NSPD). Data for subsequent years were extracted in June of the following
year using the respective year’s November edition of the NSPD.
In January 2001, the ONS implemented a change from ICD-9 to ICD-10 for coding causes of death in England &
Wales. As part of an exercise to investigate the effects of this change, the ONS also re-coded all deaths registered
in 1999. Deaths for years prior to 1999 and for year 2000 have not been re-coded.
For current analysis, therefore, all data are based on ICD-10.
For trend analysis, the numbers of deaths observed in the years 1993-98 and 2000 must be adjusted to give
“expected” numbers of deaths which would have been coded to this cause in ICD-10. This is done by multiplying
the ICD-9 based death counts by the appropriate ICD-10/9 comparability ratio published by the ONS. Trend data
cannot include years prior to 1993, because the ONS introduced automated coding in 1993, and the comparability
ratios are only valid from this point onwards.
For this indicator the following ICD-10/9 comparability ratios were used:
Males
Females
All Ages: 1.01
All Ages: 1
Adjusted person counts are the sum of the adjusted male and female counts. Once adjusted, the counts are used
to calculate rates in the usual way.
From the 2003 Compendium onwards, data are based on the original causes of death rather than the final causes
used in earlier Compendia.
See Annex 2 for more details.
Denominator:
Denominator data - 2001 Census based mid-year population estimates for the respective calendar years.
292