1
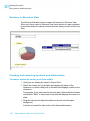
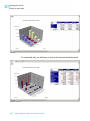
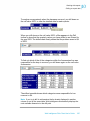
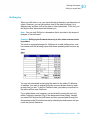
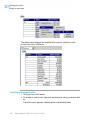
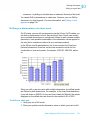
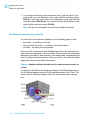
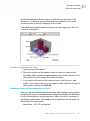
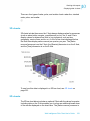
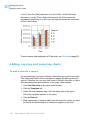
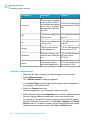
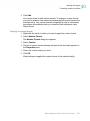
10
Working with reports
Displaying data in charts
on the Y-Axis, the [Year] dimension is on the X-Axis, and the [Quarter]
dimension is on the Z-Axis. Notice that because the Z-Axis cannot be
represented graphically on a 2D chart, the legend provides the information
for the Z-Axis values.
To see the same data displayed in a 3D bar chart, see 3D charts on page 251.
Adding, copying and removing charts
To add a chart to a report
It is recommended you work in Structure View when you insert a new chart.
This is because Results View is designed to display the data contained in
reports. Therefore, you can only view charts in Results View after you have
allocated dimensions and measures to the empty chart template.
1. Click View Structure on the report panel toolbar.
2. Click the Templates tab.
3. Select the chart template drag it onto an empty area of the report.
The empty template appears on the report.
4. Click the Data tab.
5. Drag a dimension or measure object onto the chart axis, where you want
the results for that dimension or measure to appear on the chart.
252
Web Intelligence Rich Client User's Guide