1
10
Working with reports
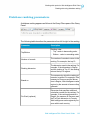
Displaying data in tables
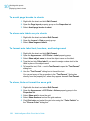
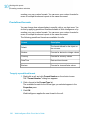
To apply a different template to a table by using drag and drop
1. Select the report tab that contains the table you want to modify.
2. Click the Templates tab.
If the Templates tab is hidden, click the Show/Hide Manager button on
the Report toolbar. The Templates appear.
3. Drag a template from the Template tab onto a table. You must drop the
template directly on the existing report block.
Web Intelligence applies the new template to the table values.
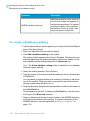
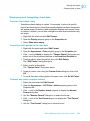
To apply a different template to a table with Turn To
1. To select the table you want to reformat, click the top edge of the table.
A gray border appears around the table.
2. Right-click the report block.
3. On the shortcut menu, click Turn To.
The "Turn To" dialog box appears.
4. On the Tables tab or on one of the Chart tabs, select the table or chart
template you want to apply to the table.
5. Click OK.
If you turned a table to a chart, the unicode font is not retained in the chart
if the font for the text on the table was unicode, and if unicode is not defined
as your default font for charts. You need to format the chart with the unicode
font, if this font is available on your computer. If this is not the case, you need
to contact your administrator to configure the Web Intelligence server and
your computer appropriately.
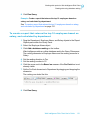
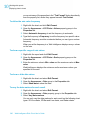
To add rows or columns to tables using drag and drop
•
236
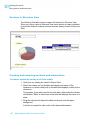
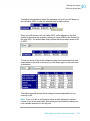
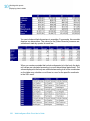
Drag the object you want to add to the table from the Data tab, and drop
the object where you want to add it:
• To add the object into a new column to the left of an existing column,
drag the object onto the left edge of a column header.
• To add the object into a new column to the right of an existing column
, drag the object onto the right edge of a column header.
Web Intelligence Rich Client User's Guide