1
Simulink® Report Generator™
User's Guide
R2015b
How to Contact MathWorks
Latest news:
www.mathworks.com
Sales and services:
www.mathworks.com/sales_and_services
User community:
www.mathworks.com/matlabcentral
Technical support:
www.mathworks.com/support/contact_us
Phone:
508-647-7000
The MathWorks, Inc.
3 Apple Hill Drive
Natick, MA 01760-2098
Simulink® Report Generator™ User's Guide
© COPYRIGHT 1999–2015 by The MathWorks, Inc.
The software described in this document is furnished under a license agreement. The software may be used
or copied only under the terms of the license agreement. No part of this manual may be photocopied or
reproduced in any form without prior written consent from The MathWorks, Inc.
FEDERAL ACQUISITION: This provision applies to all acquisitions of the Program and Documentation
by, for, or through the federal government of the United States. By accepting delivery of the Program
or Documentation, the government hereby agrees that this software or documentation qualifies as
commercial computer software or commercial computer software documentation as such terms are used
or defined in FAR 12.212, DFARS Part 227.72, and DFARS 252.227-7014. Accordingly, the terms and
conditions of this Agreement and only those rights specified in this Agreement, shall pertain to and
govern the use, modification, reproduction, release, performance, display, and disclosure of the Program
and Documentation by the federal government (or other entity acquiring for or through the federal
government) and shall supersede any conflicting contractual terms or conditions. If this License fails
to meet the government's needs or is inconsistent in any respect with federal procurement law, the
government agrees to return the Program and Documentation, unused, to The MathWorks, Inc.
Trademarks
MATLAB and Simulink are registered trademarks of The MathWorks, Inc. See
www.mathworks.com/trademarks for a list of additional trademarks. Other product or brand
names may be trademarks or registered trademarks of their respective holders.
Patents
MathWorks products are protected by one or more U.S. patents. Please see
www.mathworks.com/patents for more information.
Revision History
January 1999
December 2000
June 2004
August 2004
October 2004
December 2004
April 2005
September 2005
March 2006
September 2006
March 2007
September 2007
First printing
Second printing
Third printing
Online only
Online only
Online only
Online only
Online only
Online only
Online only
Fourth printing
Fifth printing
March 2008
October 2008
October 2008
March 2009
September 2009
March 2010
September 2010
April 2011
September 2011
March 2012
September 2012
March 2013
September 2013
March 2014
October 2014
March 2015
September 2015
Online only
Online only
Online only
Online only
Online only
Online only
Online only
Online only
Online only
Online only
Online only
Online only
Online only
Online only
Online only
Online only
Online only
New (Release 11)
Revised (Release 12)
Revised for Version 2.02 (Release 14)
Revised for Version 2.1
Revised for Version 2.1.1 (Release 14SP1)
Revised for Version 2.2 (Release 14SP1+)
Revised for Version 2.2.1 (Release 14SP2+)
Revised for Version 2.3.1 (Release 14SP3)
Revised for Version 3.0 (Release 2006a)
Revised for Version 3.1 (Release 2006b)
Revised for Version 3.2 (Release 2007a)
Revised for Version 3.2.1 (Release 2007b)
This publication was previously for MATLAB®
and Simulink®. It is now for Simulink® only.
Revised for Version 3.3 (Release 2008a)
Revised for Version 3.4 (Release 2008b)
Revised for Version 3.5 (Release 2008b+)
Revised for Version 3.6 (Release 2009a)
Revised for Version 3.7 (Release 2009b)
Revised for Version 3.8 (Release 2010a)
Revised for Version 3.9 (Release 2010b)
Revised for Version 3.10 (Release 2011a)
Revised for Version 3.11 (Release 2011b)
Revised for Version 3.12 (Release 2012a)
Revised for Version 3.13 (Release 2012b)
Revised for Version 3.14 (Release 2013a)
Revised for Version 3.15 (Release 2013b)
Revised for Version 3.16 (Release 2014a)
Revised for Version 4.0 (Release 2014b)
Revised for Version 4.1 (Release 2015a)
Revised for Version 4.2 (Release 2015b)
Contents
1
Getting Started
Simulink Report Generator Product Description . . . . . . . . .
Key Features . . . . . . . . . . . . . . . . . . . . . . . . . . . . . . . . . . . . .
1-2
1-2
System Design Documentation and Results Reporting . . . . .
Types of Reports . . . . . . . . . . . . . . . . . . . . . . . . . . . . . . . . . .
System Design Documentation . . . . . . . . . . . . . . . . . . . . . . .
Results Reporting . . . . . . . . . . . . . . . . . . . . . . . . . . . . . . . . .
1-3
1-3
1-3
1-4
Interactive Model Exploration . . . . . . . . . . . . . . . . . . . . . . . . .
Simulink Report Generator Tools . . . . . . . . . . . . . . . . . . . . .
Simulink Model Exploration Tools . . . . . . . . . . . . . . . . . . . .
1-6
1-6
1-7
Report Creation Workflow . . . . . . . . . . . . . . . . . . . . . . . . . . . .
Approaches for Creating Reports . . . . . . . . . . . . . . . . . . . . . .
Interactive Report Creation . . . . . . . . . . . . . . . . . . . . . . . . . .
1-9
1-9
1-9
Report Components . . . . . . . . . . . . . . . . . . . . . . . . . . . . . . . . .
About Report Components . . . . . . . . . . . . . . . . . . . . . . . . . .
Report Structure Components . . . . . . . . . . . . . . . . . . . . . . .
System-Based Components . . . . . . . . . . . . . . . . . . . . . . . . .
User-Supplied Information Components . . . . . . . . . . . . . . .
Dynamic Reporting Components . . . . . . . . . . . . . . . . . . . . .
Format Control at the Component Level . . . . . . . . . . . . . . .
1-11
1-11
1-12
1-12
1-14
1-14
1-15
Working with the Report Explorer . . . . . . . . . . . . . . . . . . . .
About the Report Explorer . . . . . . . . . . . . . . . . . . . . . . . . .
1-16
1-16
How Simulink Report Generator and Simulink Software
Interact . . . . . . . . . . . . . . . . . . . . . . . . . . . . . . . . . . . . . . . . .
1-19
Supported Report Formats . . . . . . . . . . . . . . . . . . . . . . . . . . .
1-20
v
Add Content to PowerPoint Presentations
Programmatically . . . . . . . . . . . . . . . . . . . . . . . . . . . . . . . .
2
3
vi
Contents
1-21
Generate System Design Description Reports
System Design Description . . . . . . . . . . . . . . . . . . . . . . . . . . . .
Predefined Standard Reports . . . . . . . . . . . . . . . . . . . . . . . .
What Is the System Design Description? . . . . . . . . . . . . . . . .
What You Can Do with the Report . . . . . . . . . . . . . . . . . . . .
Report Contents . . . . . . . . . . . . . . . . . . . . . . . . . . . . . . . . . .
2-2
2-2
2-2
2-3
2-3
Generate a System Design Description . . . . . . . . . . . . . . . . .
Open the System Design Description Dialog Box . . . . . . . . . .
Choose System Design Description Options . . . . . . . . . . . . . .
2-6
2-6
2-6
Customize the System Design Description . . . . . . . . . . . . . .
Using the Report Explorer to Customize the Report . . . . . .
Building a Dialog Box for a Custom Report Setup File . . . . .
2-10
2-10
2-11
Creating Simulink Reports
Create a Simulink Report Generator Report . . . . . . . . . . . . .
3-2
Specify Report Options in the Setup File . . . . . . . . . . . . . . . .
3-3
Add Report Content with Components . . . . . . . . . . . . . . . . . .
Report Components . . . . . . . . . . . . . . . . . . . . . . . . . . . . . . . .
Add MATLAB Code . . . . . . . . . . . . . . . . . . . . . . . . . . . . . . . .
Add a Title Page . . . . . . . . . . . . . . . . . . . . . . . . . . . . . . . . .
Open the Simulink Model . . . . . . . . . . . . . . . . . . . . . . . . . .
Add Logical Then and Logical Else Components . . . . . . . . .
Error If Model Cannot Be Opened . . . . . . . . . . . . . . . . . . . .
Create the Body of the Report . . . . . . . . . . . . . . . . . . . . . . .
Process with a Model Loop Component . . . . . . . . . . . . . . . .
Add a Paragraph for Each Model . . . . . . . . . . . . . . . . . . . .
3-5
3-5
3-7
3-12
3-14
3-16
3-18
3-21
3-22
3-24
Insert a Snapshot of the Model . . . . . . . . . . . . . . . . . . . . . .
Add a Loop for Processing the Model . . . . . . . . . . . . . . . . .
Block Parameter Value from a MATLAB Expression . . . . . .
Create a Section for Each Iteration . . . . . . . . . . . . . . . . . . .
Insert the Block Value . . . . . . . . . . . . . . . . . . . . . . . . . . . .
Set a Parameter Value . . . . . . . . . . . . . . . . . . . . . . . . . . . .
Check Value Using a Logical If Component . . . . . . . . . . . . .
Simulate the Model Using a Model Simulation Component .
Create a Post-Test Analysis Section . . . . . . . . . . . . . . . . . .
4
3-25
3-26
3-28
3-29
3-31
3-32
3-34
3-37
3-43
Error Handling for MATLAB Code . . . . . . . . . . . . . . . . . . . .
3-51
Generate the Report . . . . . . . . . . . . . . . . . . . . . . . . . . . . . . . .
3-52
Generate a Report
Generate a Report . . . . . . . . . . . . . . . . . . . . . . . . . . . . . . . . . . .
Run a Report . . . . . . . . . . . . . . . . . . . . . . . . . . . . . . . . . . . .
Report Output Options . . . . . . . . . . . . . . . . . . . . . . . . . . . . .
4-2
4-2
4-2
Select Report Generation Options . . . . . . . . . . . . . . . . . . . . .
Report Options Dialog Box . . . . . . . . . . . . . . . . . . . . . . . . . .
Report Output Format . . . . . . . . . . . . . . . . . . . . . . . . . . . . .
PDF Stylesheets . . . . . . . . . . . . . . . . . . . . . . . . . . . . . . . . . .
Web Stylesheets . . . . . . . . . . . . . . . . . . . . . . . . . . . . . . . . . .
RTF (DSSSL Print) and Word Stylesheets . . . . . . . . . . . . . .
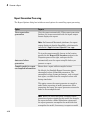
Report Generation Processing . . . . . . . . . . . . . . . . . . . . . . .
Location of Report Output File . . . . . . . . . . . . . . . . . . . . . .
Report Description . . . . . . . . . . . . . . . . . . . . . . . . . . . . . . .
4-4
4-4
4-5
4-8
4-8
4-9
4-10
4-11
4-12
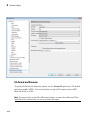
Report Generation Preferences . . . . . . . . . . . . . . . . . . . . . . .
Report Generator Preferences Pane . . . . . . . . . . . . . . . . . . .
File Format and Extension . . . . . . . . . . . . . . . . . . . . . . . . .
Image Formats . . . . . . . . . . . . . . . . . . . . . . . . . . . . . . . . . .
Report Viewing . . . . . . . . . . . . . . . . . . . . . . . . . . . . . . . . . .
Reset to Defaults . . . . . . . . . . . . . . . . . . . . . . . . . . . . . . . . .
4-13
4-13
4-14
4-15
4-15
4-16
Change Report Locale . . . . . . . . . . . . . . . . . . . . . . . . . . . . . . .
4-17
vii
5
viii
Contents
Convert XML Documents to Different File Formats . . . . . .
Why Convert XML Documents? . . . . . . . . . . . . . . . . . . . . . .
Convert XML Documents Using the Report Explorer . . . . . .
Convert XML Documents Using the Command Line . . . . . .
Edit XML Source Files . . . . . . . . . . . . . . . . . . . . . . . . . . . .
4-18
4-18
4-18
4-20
4-20
Create a Report Log File . . . . . . . . . . . . . . . . . . . . . . . . . . . .
4-21
Generate MATLAB Code from Report Setup File . . . . . . . .
4-22
Troubleshooting Report Generation Issues . . . . . . . . . . . . .
Memory Usage . . . . . . . . . . . . . . . . . . . . . . . . . . . . . . . . . .
HTML Report Display on UNIX Systems . . . . . . . . . . . . . .
4-25
4-25
4-25
Export Simulink Models to Web Views
Web Views . . . . . . . . . . . . . . . . . . . . . . . . . . . . . . . . . . . . . . . . . .
What Is a Web View? . . . . . . . . . . . . . . . . . . . . . . . . . . . . . .
System Requirements . . . . . . . . . . . . . . . . . . . . . . . . . . . . . .
Web View Files . . . . . . . . . . . . . . . . . . . . . . . . . . . . . . . . . . .
5-2
5-2
5-2
5-2
Export Models to Web View Files . . . . . . . . . . . . . . . . . . . . . .
Open the Web View Dialog Box . . . . . . . . . . . . . . . . . . . . . .
Export a Model to a Web View . . . . . . . . . . . . . . . . . . . . . . .
5-4
5-4
5-4
Display and Navigate a Web View . . . . . . . . . . . . . . . . . . . . . .
Display a Web View When You Export It . . . . . . . . . . . . . . .
Open a Web View File in a Web Browser . . . . . . . . . . . . . . .
View Contents of a System . . . . . . . . . . . . . . . . . . . . . . . . . .
View Block Parameters and Signal Properties . . . . . . . . . . . .
Access Optional Web View Information . . . . . . . . . . . . . . . . .
5-6
5-6
5-6
5-7
5-8
5-9
Search a Web View . . . . . . . . . . . . . . . . . . . . . . . . . . . . . . . . .
Perform a Search . . . . . . . . . . . . . . . . . . . . . . . . . . . . . . . .
Sort Search Results . . . . . . . . . . . . . . . . . . . . . . . . . . . . . . .
Navigate Between Search Results and Model Elements . . . .
5-10
5-10
5-12
5-12
Create and Use a Web View . . . . . . . . . . . . . . . . . . . . . . . . . .
About This Tutorial . . . . . . . . . . . . . . . . . . . . . . . . . . . . . . .
5-13
5-13
Export Specific Systems . . . . . . . . . . . . . . . . . . . . . . . . . . .
Navigate the Web View . . . . . . . . . . . . . . . . . . . . . . . . . . . .
Display Parameters and Properties of Blocks and Signals . .
Open the Web View . . . . . . . . . . . . . . . . . . . . . . . . . . . . . .
6
5-13
5-15
5-16
5-18
Optional Web Views . . . . . . . . . . . . . . . . . . . . . . . . . . . . . . . .
5-20
Capture and View Optional Web View Information . . . . . .
Capture Optional Web View Information for a Model . . . . .
View Optional Web View Information . . . . . . . . . . . . . . . . .
5-21
5-21
5-21
Add Content with Components
Components . . . . . . . . . . . . . . . . . . . . . . . . . . . . . . . . . . . . . . . .
Component Formatting . . . . . . . . . . . . . . . . . . . . . . . . . . . . .
6-2
6-3
Report Structure Components . . . . . . . . . . . . . . . . . . . . . . . . .
6-4
Table Formatting Components . . . . . . . . . . . . . . . . . . . . . . . .
6-5
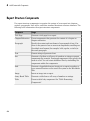
Property Table Components . . . . . . . . . . . . . . . . . . . . . . . . . .
About Property Table Components . . . . . . . . . . . . . . . . . . . .
Open the Example Report Template . . . . . . . . . . . . . . . . . . .
Examine the Property Table Output . . . . . . . . . . . . . . . . . . .
Select Object Types . . . . . . . . . . . . . . . . . . . . . . . . . . . . . . . .
Display Property Name/Property Value Pairs . . . . . . . . . . . .
Edit Table Titles . . . . . . . . . . . . . . . . . . . . . . . . . . . . . . . . .
Enter Text into Table Cells . . . . . . . . . . . . . . . . . . . . . . . . .
Add, Replace, and Delete Properties in Tables . . . . . . . . . .
Format Table Columns, Rows, and Cells . . . . . . . . . . . . . . .
Zoom and Scroll . . . . . . . . . . . . . . . . . . . . . . . . . . . . . . . . .
Select a Table . . . . . . . . . . . . . . . . . . . . . . . . . . . . . . . . . . .
6-6
6-6
6-8
6-8
6-9
6-9
6-12
6-12
6-13
6-14
6-16
6-16
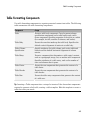
Summary Table Components . . . . . . . . . . . . . . . . . . . . . . . . .
About Summary Table Components . . . . . . . . . . . . . . . . . .
Open the Example Report Template . . . . . . . . . . . . . . . . . .
Select Object Types . . . . . . . . . . . . . . . . . . . . . . . . . . . . . . .
Add and Remove Properties . . . . . . . . . . . . . . . . . . . . . . . .
Set Relative Column Widths . . . . . . . . . . . . . . . . . . . . . . . .
6-17
6-17
6-18
6-19
6-19
6-20
ix
7
x
Contents
Set Object Row Options . . . . . . . . . . . . . . . . . . . . . . . . . . . .
6-20
Logical and Looping Components . . . . . . . . . . . . . . . . . . . . .
6-21
Filter with Loop Context Functions . . . . . . . . . . . . . . . . . . .
Create and Save the Setup File . . . . . . . . . . . . . . . . . . . . . .
Add Components . . . . . . . . . . . . . . . . . . . . . . . . . . . . . . . . .
Run the Report . . . . . . . . . . . . . . . . . . . . . . . . . . . . . . . . . .
6-22
6-22
6-22
6-23
Loop Context Functions . . . . . . . . . . . . . . . . . . . . . . . . . . . . .
For Simulink Modeling Elements . . . . . . . . . . . . . . . . . . . .
For Stateflow Modeling Elements . . . . . . . . . . . . . . . . . . . .
6-24
6-24
6-24
Edit Figure Loop Components . . . . . . . . . . . . . . . . . . . . . . . .
Figure Loop in a Report . . . . . . . . . . . . . . . . . . . . . . . . . . .
Figure Properties . . . . . . . . . . . . . . . . . . . . . . . . . . . . . . . .
Loop on the Current Figure . . . . . . . . . . . . . . . . . . . . . . . .
Loop on Visible Figures . . . . . . . . . . . . . . . . . . . . . . . . . . . .
Loop on Figures with Tags . . . . . . . . . . . . . . . . . . . . . . . . .
Modify Loop Section Options . . . . . . . . . . . . . . . . . . . . . . . .
6-25
6-25
6-26
6-27
6-27
6-27
6-27
Compare Simulink Model XML Files
About Simulink Model XML Comparison . . . . . . . . . . . . . . . .
Creating XML Comparison Reports . . . . . . . . . . . . . . . . . . . .
Using XML Comparison Reports . . . . . . . . . . . . . . . . . . . . . .
7-2
7-2
7-2
Select Simulink Models for XML Comparison . . . . . . . . . . . .
Select Files from the Simulink Editor . . . . . . . . . . . . . . . . . .
Select Files from the Current Folder Browser . . . . . . . . . . . .
Select Files from a Simulink Project . . . . . . . . . . . . . . . . . . .
Select Files from the Comparison Tool . . . . . . . . . . . . . . . . .
Select Files from the Command Line . . . . . . . . . . . . . . . . . .
Choose a Comparison Type . . . . . . . . . . . . . . . . . . . . . . . . . .
Examples of XML Comparison . . . . . . . . . . . . . . . . . . . . . . .
7-5
7-5
7-5
7-6
7-6
7-6
7-7
7-7
Compare Simulink Model XML Files . . . . . . . . . . . . . . . . . . .
Navigate the Simulink XML Comparison Report . . . . . . . . . .
Step Through Changes . . . . . . . . . . . . . . . . . . . . . . . . . . . .
7-8
7-8
7-10
Explore Changes in the Original Models . . . . . . . . . . . . . . .
Merge Differences . . . . . . . . . . . . . . . . . . . . . . . . . . . . . . . .
Open Child Comparison Reports for Selected Nodes . . . . . .
Understand the Report Hierarchy and Matching . . . . . . . . .
Filter Out Differences . . . . . . . . . . . . . . . . . . . . . . . . . . . . .
Change Color Preferences . . . . . . . . . . . . . . . . . . . . . . . . . .
Save Comparison Results . . . . . . . . . . . . . . . . . . . . . . . . . .
7-11
7-11
7-12
7-13
7-13
7-15
7-15
Display Items in Original Models . . . . . . . . . . . . . . . . . . . . .
Highlighting in Models . . . . . . . . . . . . . . . . . . . . . . . . . . . .
Control Highlighting in Models . . . . . . . . . . . . . . . . . . . . . .
View Changes in Model Configuration Parameters . . . . . . .
7-17
7-17
7-19
7-20
Merge Simulink Models from the Comparison Report . . . .
Merge Models . . . . . . . . . . . . . . . . . . . . . . . . . . . . . . . . . . .
Merge MATLAB Function Block Code . . . . . . . . . . . . . . . . .
7-21
7-21
7-23
Export, Print, and Save XML Comparison Results . . . . . . .
Save Printable HTML Report . . . . . . . . . . . . . . . . . . . . . . .
Export Results to the Workspace . . . . . . . . . . . . . . . . . . . .
Save Comparison Log Files in a Zip File . . . . . . . . . . . . . . .
7-24
7-24
7-24
7-25
Comparing XML Files from Models with Identical Names .
7-27
Work with Referenced Models and Library Links . . . . . . . .
7-28
Compare XML from Models Managed with Subversion . . .
Work with Subversion . . . . . . . . . . . . . . . . . . . . . . . . . . . . .
Configure TortoiseSVN . . . . . . . . . . . . . . . . . . . . . . . . . . . .
Test TortoiseSVN Setup . . . . . . . . . . . . . . . . . . . . . . . . . . .
7-30
7-30
7-31
7-32
Compare Templates . . . . . . . . . . . . . . . . . . . . . . . . . . . . . . . . .
Compare Project Templates . . . . . . . . . . . . . . . . . . . . . . . . .
Compare Model Templates . . . . . . . . . . . . . . . . . . . . . . . . .
7-34
7-34
7-35
xi
8
9
10
xii
Contents
Components — Alphabetical List
Functions – Alphabetical List
Template-Based Report Formatting
Report Conversion Templates . . . . . . . . . . . . . . . . . . . . . . . .
Templates for Report Conversion . . . . . . . . . . . . . . . . . . . .
Custom Templates . . . . . . . . . . . . . . . . . . . . . . . . . . . . . . . .
Custom Component Styles . . . . . . . . . . . . . . . . . . . . . . . . .
Benefits of Using Templates . . . . . . . . . . . . . . . . . . . . . . . .
10-2
10-2
10-2
10-2
10-2
Generate a Report Using a Template . . . . . . . . . . . . . . . . . .
Generate SDD Report Using a Template . . . . . . . . . . . . . . .
10-4
10-4
Conversion Template Contents . . . . . . . . . . . . . . . . . . . . . . .
Default Styles . . . . . . . . . . . . . . . . . . . . . . . . . . . . . . . . . . .
Part Templates . . . . . . . . . . . . . . . . . . . . . . . . . . . . . . . . . .
Header and Footers in Word Conversion Templates . . . . .
10-5
10-5
10-9
10-10
Copy a Conversion Template . . . . . . . . . . . . . . . . . . . . . . . .
Copy a Conversion Template . . . . . . . . . . . . . . . . . . . . . . .
10-12
10-12
Open a Conversion Template . . . . . . . . . . . . . . . . . . . . . . . .
10-14
Set Conversion Template Properties . . . . . . . . . . . . . . . . . .
10-15
Move a Conversion Template . . . . . . . . . . . . . . . . . . . . . . . .
10-16
Delete a Conversion Template . . . . . . . . . . . . . . . . . . . . . . .
10-17
Customize Microsoft Word Report Styles . . . . . . . . . . . . . .
Customize Default Microsoft Word Component Styles . . . .
10-18
10-18
11
Create Styles in a Microsoft Word Template . . . . . . . . . . .
10-18
Customize Microsoft Word Part Templates . . . . . . . . . . . .
Custom Word Part Templates . . . . . . . . . . . . . . . . . . . . . .
Display the Developer Ribbon in Word . . . . . . . . . . . . . . .
Customize a Word Conversion Part Template . . . . . . . . . .
Set Default Text Style for a Hole . . . . . . . . . . . . . . . . . . .
Distinguish Inline and Block Holes . . . . . . . . . . . . . . . . . .
Avoid Changing Block Holes to Inline Holes . . . . . . . . . . .
Delete a Hole . . . . . . . . . . . . . . . . . . . . . . . . . . . . . . . . . .
Add an Inline Hole . . . . . . . . . . . . . . . . . . . . . . . . . . . . . .
Add a Block Hole . . . . . . . . . . . . . . . . . . . . . . . . . . . . . . .
10-21
10-21
10-22
10-22
10-23
10-25
10-26
10-26
10-28
10-29
Customize a Microsoft Word Title Page Template . . . . . . .
Create a Custom Template . . . . . . . . . . . . . . . . . . . . . . . .
Change the Color of a Report Title . . . . . . . . . . . . . . . . . .
Assign the Template to a Report . . . . . . . . . . . . . . . . . . . .
Customize Title Page Content and Layout . . . . . . . . . . . . .
10-30
10-30
10-31
10-33
10-34
Create a Custom HTML Template . . . . . . . . . . . . . . . . . . . .
Copy an HTML Template . . . . . . . . . . . . . . . . . . . . . . . . .
Select an HTML Editor . . . . . . . . . . . . . . . . . . . . . . . . . . .
Edit HTML Styles in a Template . . . . . . . . . . . . . . . . . . .
10-36
10-36
10-37
10-37
Create a Report Program
Create a Report Program . . . . . . . . . . . . . . . . . . . . . . . . . . . .
11-3
Document Object Model . . . . . . . . . . . . . . . . . . . . . . . . . . . . .
DOM Object Help and Documentation . . . . . . . . . . . . . . . .
11-4
11-4
Construct a DOM Object . . . . . . . . . . . . . . . . . . . . . . . . . . . . .
11-6
Import the DOM API Package . . . . . . . . . . . . . . . . . . . . . . . .
11-7
Get and Set DOM Object Properties . . . . . . . . . . . . . . . . . . .
11-8
Create a Document Object to Hold Content . . . . . . . . . . . . .
11-9
xiii
Add Content to a Report . . . . . . . . . . . . . . . . . . . . . . . . . . . .
11-11
Clone a DOM Object . . . . . . . . . . . . . . . . . . . . . . . . . . . . . . .
11-13
Add Content as a Group . . . . . . . . . . . . . . . . . . . . . . . . . . . .
11-14
Stream a Report . . . . . . . . . . . . . . . . . . . . . . . . . . . . . . . . . . .
11-16
Report Packages . . . . . . . . . . . . . . . . . . . . . . . . . . . . . . . . . .
11-17
Close a Report . . . . . . . . . . . . . . . . . . . . . . . . . . . . . . . . . . . .
11-18
Display a Report . . . . . . . . . . . . . . . . . . . . . . . . . . . . . . . . . .
11-19
Report Formatting Approaches . . . . . . . . . . . . . . . . . . . . . .
11-20
Use Style Sheets . . . . . . . . . . . . . . . . . . . . . . . . . . . . . . . . . . .
11-21
Use Format Objects . . . . . . . . . . . . . . . . . . . . . . . . . . . . . . . .
11-23
Use Format Properties . . . . . . . . . . . . . . . . . . . . . . . . . . . . .
11-24
Format Inheritance . . . . . . . . . . . . . . . . . . . . . . . . . . . . . . . .
11-25
Create Object Containers . . . . . . . . . . . . . . . . . . . . . . . . . . .
11-26
Form-Based Reporting . . . . . . . . . . . . . . . . . . . . . . . . . . . . .
11-28
Fill the Blanks in a Report Form . . . . . . . . . . . . . . . . . . . .
Navigate Holes in the Form . . . . . . . . . . . . . . . . . . . . . . .
11-29
11-29
Use Subforms in a Report . . . . . . . . . . . . . . . . . . . . . . . . . . .
11-31
Create Document Part Template Libraries . . . . . . . . . . . .
11-33
Create a Document Part Template Library in a Microsoft Word
Template File . . . . . . . . . . . . . . . . . . . . . . . . . . . . . . . .
11-33
Create a Document Part Template Library in an HTML
Template File . . . . . . . . . . . . . . . . . . . . . . . . . . . . . . . .
11-35
xiv
Contents
Object-Oriented Report Creation . . . . . . . . . . . . . . . . . . . .
11-38
Simplify Filling in Forms . . . . . . . . . . . . . . . . . . . . . . . . . . .
11-39
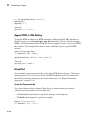
Create and Format Text . . . . . . . . . . . . . . . . . . . . . . . . . . . .
Create Text . . . . . . . . . . . . . . . . . . . . . . . . . . . . . . . . . . . .
Create Special Characters . . . . . . . . . . . . . . . . . . . . . . . . .
Append HTML or XML Markup . . . . . . . . . . . . . . . . . . . .
Format Text . . . . . . . . . . . . . . . . . . . . . . . . . . . . . . . . . . .
11-41
11-41
11-41
11-42
11-42
Create and Format Paragraphs . . . . . . . . . . . . . . . . . . . . . .
Create a Paragraph . . . . . . . . . . . . . . . . . . . . . . . . . . . . . .
Create a Heading . . . . . . . . . . . . . . . . . . . . . . . . . . . . . . .
Format a Paragraph . . . . . . . . . . . . . . . . . . . . . . . . . . . . .
11-46
11-46
11-46
11-47
Create and Format Lists . . . . . . . . . . . . . . . . . . . . . . . . . . . .
Create an Unordered List . . . . . . . . . . . . . . . . . . . . . . . . .
Create an Ordered List . . . . . . . . . . . . . . . . . . . . . . . . . . .
Create a Multilevel List . . . . . . . . . . . . . . . . . . . . . . . . . .
Format Lists . . . . . . . . . . . . . . . . . . . . . . . . . . . . . . . . . . .
11-52
11-52
11-53
11-55
11-56
Create and Format Tables . . . . . . . . . . . . . . . . . . . . . . . . . .
Two Types of Tables . . . . . . . . . . . . . . . . . . . . . . . . . . . . .
Create a Table from a Two-Dimensional Array . . . . . . . . .
Create a Table Using the Table entry Function . . . . . . . . .
Create a Table from Scratch . . . . . . . . . . . . . . . . . . . . . . .
Format a Table . . . . . . . . . . . . . . . . . . . . . . . . . . . . . . . . .
Create a Formal Table . . . . . . . . . . . . . . . . . . . . . . . . . . .
Format a Formal Table . . . . . . . . . . . . . . . . . . . . . . . . . . .
Create and Format Table Rows . . . . . . . . . . . . . . . . . . . . .
Format Table Columns . . . . . . . . . . . . . . . . . . . . . . . . . . .
Create and Format Table Entries . . . . . . . . . . . . . . . . . . .
11-58
11-58
11-59
11-59
11-60
11-61
11-66
11-66
11-67
11-68
11-69
Create Links . . . . . . . . . . . . . . . . . . . . . . . . . . . . . . . . . . . . . .
Links . . . . . . . . . . . . . . . . . . . . . . . . . . . . . . . . . . . . . . . . .
Create a Link Target . . . . . . . . . . . . . . . . . . . . . . . . . . . .
Create an External Link . . . . . . . . . . . . . . . . . . . . . . . . . .
Create an Internal Link . . . . . . . . . . . . . . . . . . . . . . . . . .
Add Text or Images to Links . . . . . . . . . . . . . . . . . . . . . . .
11-72
11-72
11-72
11-73
11-73
11-73
Create and Format Images . . . . . . . . . . . . . . . . . . . . . . . . . .
Create an Image . . . . . . . . . . . . . . . . . . . . . . . . . . . . . . . .
Resize an Image . . . . . . . . . . . . . . . . . . . . . . . . . . . . . . . .
Image Storage . . . . . . . . . . . . . . . . . . . . . . . . . . . . . . . . . .
Links from an Image . . . . . . . . . . . . . . . . . . . . . . . . . . . . .
11-75
11-75
11-76
11-76
11-76
xv
xvi
Contents
Create a Table of Contents . . . . . . . . . . . . . . . . . . . . . . . . . .
Create a Microsoft Word Table of Contents . . . . . . . . . . . .
Create an HTML Table of Contents . . . . . . . . . . . . . . . . .
Set Outline Levels of Section Heads . . . . . . . . . . . . . . . . .
11-77
11-77
11-79
11-81
Create Image Maps . . . . . . . . . . . . . . . . . . . . . . . . . . . . . . . .
11-84
Automatically Number Document Content . . . . . . . . . . . .
Automatically Number Content Programmatically . . . . . .
Automatically Number Content Using Part Templates . . .
11-86
11-86
11-88
Appending HTML to DOM Reports . . . . . . . . . . . . . . . . . . .
Why Append HTML to a DOM Report? . . . . . . . . . . . . . . .
Workflow for Appending HTML . . . . . . . . . . . . . . . . . . . .
11-90
11-90
11-90
Append HTML Content to DOM Reports . . . . . . . . . . . . . .
Use an addHTML Method . . . . . . . . . . . . . . . . . . . . . . . . .
Append an HTML Object . . . . . . . . . . . . . . . . . . . . . . . . .
Address Errors . . . . . . . . . . . . . . . . . . . . . . . . . . . . . . . . .
11-92
11-92
11-93
11-93
Append HTML File Contents to DOM Reports . . . . . . . . . .
Use an addHTMLFile Method . . . . . . . . . . . . . . . . . . . . . .
Append an HTMLFile Object . . . . . . . . . . . . . . . . . . . . . . .
Address Errors . . . . . . . . . . . . . . . . . . . . . . . . . . . . . . . . .
11-94
11-94
11-94
11-95
Use an HTML Cleanup Program . . . . . . . . . . . . . . . . . . . . .
Use HTML Tidy to Fix HTML Code . . . . . . . . . . . . . . . . .
11-96
11-96
HTML Code Requirements for DOM Reports . . . . . . . . . .
XML-Parsable HTML Code . . . . . . . . . . . . . . . . . . . . . . .
Supported HTML Elements and Attributes . . . . . . . . . . .
Supported HTML CSS Style Attributes for All Elements .
Support for HTML Character Entities . . . . . . . . . . . . . . .
DOCTYPE Declaration . . . . . . . . . . . . . . . . . . . . . . . . . .
11-100
11-100
11-100
11-102
11-103
11-104
Display Report Generation Messages . . . . . . . . . . . . . . . .
Report Generation Messages . . . . . . . . . . . . . . . . . . . . . .
Display DOM Default Messages . . . . . . . . . . . . . . . . . . .
Create and Display a Progress Message . . . . . . . . . . . . .
11-106
11-106
11-106
11-108
Compile a Report Program . . . . . . . . . . . . . . . . . . . . . . . . .
11-110
Create a Microsoft Word Template . . . . . . . . . . . . . . . . . .
11-111
12
Add Holes in a Microsoft Word Template . . . . . . . . . . . . .
Display the Developer Ribbon in Word . . . . . . . . . . . . . .
Inline and Block Holes . . . . . . . . . . . . . . . . . . . . . . . . . .
Create an Inline Hole . . . . . . . . . . . . . . . . . . . . . . . . . . .
Create a Block-Level Hole . . . . . . . . . . . . . . . . . . . . . . . .
Set Default Text Style for a Hole . . . . . . . . . . . . . . . . . .
11-112
11-112
11-112
11-112
11-113
11-114
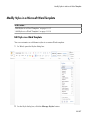
Modify Styles in a Microsoft Word Template . . . . . . . . . .
Edit Styles in a Word Template . . . . . . . . . . . . . . . . . . .
Add Styles to a Word Template . . . . . . . . . . . . . . . . . . . .
11-117
11-117
11-118
Create an HTML Template . . . . . . . . . . . . . . . . . . . . . . . . .
Edit a Zipped HTML Template . . . . . . . . . . . . . . . . . . . .
11-122
11-122
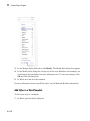
Add Holes in an HTML Template . . . . . . . . . . . . . . . . . . .
Inline and Block Holes . . . . . . . . . . . . . . . . . . . . . . . . . .
Create an Inline Hole . . . . . . . . . . . . . . . . . . . . . . . . . . .
Create a Block Hole . . . . . . . . . . . . . . . . . . . . . . . . . . . .
11-124
11-124
11-124
11-125
Modify Styles in an HTML Template . . . . . . . . . . . . . . . . .
11-127
Create Microsoft Word Page Layout Sections . . . . . . . . .
Define Page Layouts in a Template . . . . . . . . . . . . . . . . .
Navigate Template-Defined Sections . . . . . . . . . . . . . . . .
Create Sections Programmatically . . . . . . . . . . . . . . . . . .
11-128
11-128
11-128
11-129
Create Page Footers and Headers . . . . . . . . . . . . . . . . . . .
Create Page Headers and Footers in a Template . . . . . . .
Create Page Headers and Footers Programmatically . . . .
11-131
11-131
11-133
Programmatic PowerPoint Presentation Creation
Create a Presentation Program . . . . . . . . . . . . . . . . . . . . . . .
PPT API Programs . . . . . . . . . . . . . . . . . . . . . . . . . . . . . . .
Two Ways to Use the PPT API . . . . . . . . . . . . . . . . . . . . . .
PPT API Applications and PowerPoint Templates . . . . . . . .
Template Elements . . . . . . . . . . . . . . . . . . . . . . . . . . . . . . .
12-2
12-3
12-4
12-5
12-5
xvii
Create PPT Objects . . . . . . . . . . . . . . . . . . . . . . . . . . . . . . . . .
PPT Objects . . . . . . . . . . . . . . . . . . . . . . . . . . . . . . . . . . . .
Use a PPT Constructor . . . . . . . . . . . . . . . . . . . . . . . . . . . .
PPT Objects Created Without Constructors . . . . . . . . . . . . .
xviii
Contents
12-8
12-8
12-8
12-9
Import the PPT API Package . . . . . . . . . . . . . . . . . . . . . . . .
12-11
Get and Set PPT Object Properties . . . . . . . . . . . . . . . . . . .
12-12
Create a Presentation Object to Hold Content . . . . . . . . .
12-14
Generate a Presentation . . . . . . . . . . . . . . . . . . . . . . . . . . . .
12-15
Display Presentation Generation Messages . . . . . . . . . . . .
Presentation Generation Messages . . . . . . . . . . . . . . . . . .
Display PPT Default Messages . . . . . . . . . . . . . . . . . . . . .
Create and Display a Progress Message . . . . . . . . . . . . . .
12-16
12-16
12-16
12-18
Presentation Formatting Approaches . . . . . . . . . . . . . . . . .
Template Formatting . . . . . . . . . . . . . . . . . . . . . . . . . . . .
Format Objects . . . . . . . . . . . . . . . . . . . . . . . . . . . . . . . . .
Format Properties . . . . . . . . . . . . . . . . . . . . . . . . . . . . . . .
Interactive Formatting of Slide Content . . . . . . . . . . . . . .
12-20
12-21
12-21
12-22
12-22
Presentation Format Inheritance . . . . . . . . . . . . . . . . . . . .
12-24
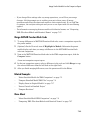
Set Up a PowerPoint Template . . . . . . . . . . . . . . . . . . . . . .
Use Existing Presentations as Templates . . . . . . . . . . . . .
Customize a Copy of the Default Template . . . . . . . . . . . .
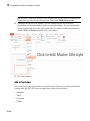
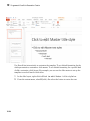
Global Presentation Formatting Using a Slide Master . . . .
Add a Slide Master . . . . . . . . . . . . . . . . . . . . . . . . . . . . . .
Format a Slide Layout . . . . . . . . . . . . . . . . . . . . . . . . . . .
Add a Slide Layout . . . . . . . . . . . . . . . . . . . . . . . . . . . . . .
Add a Placeholder . . . . . . . . . . . . . . . . . . . . . . . . . . . . . . .
Change the Style for a Table . . . . . . . . . . . . . . . . . . . . . . .
12-26
12-26
12-26
12-27
12-28
12-30
12-31
12-32
12-35
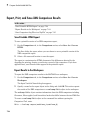
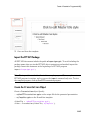
Access PowerPoint Template Elements . . . . . . . . . . . . . . .
PPT API Applications and PowerPoint Templates . . . . . . . .
Template Elements . . . . . . . . . . . . . . . . . . . . . . . . . . . . . . .
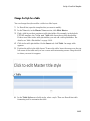
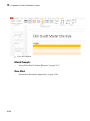
Get Slide Master Names . . . . . . . . . . . . . . . . . . . . . . . . . .
Get Slide Layout Names . . . . . . . . . . . . . . . . . . . . . . . . . .
Get Placeholder and Content Object Names . . . . . . . . . . .
Get Table Style Names . . . . . . . . . . . . . . . . . . . . . . . . . . .
12-37
12-5
12-5
12-39
12-40
12-41
12-42
Define a Style Using Format Objects . . . . . . . . . . . . . . . . .
12-45
Use Format Properties . . . . . . . . . . . . . . . . . . . . . . . . . . . . .
Dot Notation . . . . . . . . . . . . . . . . . . . . . . . . . . . . . . . . . . .
Get the Properties of an Object . . . . . . . . . . . . . . . . . . . . .
Set the Properties of an Object . . . . . . . . . . . . . . . . . . . . .
12-47
12-47
12-47
12-48
Update Presentation Content Programmatically . . . . . . .
Generate the Existing Presentation . . . . . . . . . . . . . . . . . .
Updates to the Presentation . . . . . . . . . . . . . . . . . . . . . . .
Set Up the Existing Presentation . . . . . . . . . . . . . . . . . . .
Import the PPT API Package . . . . . . . . . . . . . . . . . . . . . .
Create the Presentation Object . . . . . . . . . . . . . . . . . . .
Replace a Picture . . . . . . . . . . . . . . . . . . . . . . . . . . . . . . .
Replace Text with Links . . . . . . . . . . . . . . . . . . . . . . . . . .
Replace a Table . . . . . . . . . . . . . . . . . . . . . . . . . . . . . . . . .
Insert a New Slide . . . . . . . . . . . . . . . . . . . . . . . . . . . . . .
Generate and Open the Presentation . . . . . . . . . . . . . . . .
Code for myUpdatedPresentation . . . . . . . . . . . . . . . . .
12-50
12-50
12-52
12-54
12-55
12-55
12-55
12-56
12-56
12-57
12-57
12-58
Create a Presentation Programmatically . . . . . . . . . . . . . .
Set Up a Template . . . . . . . . . . . . . . . . . . . . . . . . . . . . . .
Import the PPT API Package . . . . . . . . . . . . . . . . . . . . . .
Create the Presentation Object . . . . . . . . . . . . . . . . . . .
Add a Presentation Title Slide . . . . . . . . . . . . . . . . . . . . .
Add a Slide with a Picture . . . . . . . . . . . . . . . . . . . . . . . .
Add a Slide with Text . . . . . . . . . . . . . . . . . . . . . . . . . . . .
Add a Slide with a Table . . . . . . . . . . . . . . . . . . . . . . . . . .
Generate and Open the Presentation . . . . . . . . . . . . . . . .
Code for myNewPPTPresentation . . . . . . . . . . . . . . . . . .
12-61
12-63
12-65
12-65
12-66
12-67
12-67
12-68
12-69
12-70
Add Slides . . . . . . . . . . . . . . . . . . . . . . . . . . . . . . . . . . . . . . . .
Specify the Order of a Slide . . . . . . . . . . . . . . . . . . . . . . .
Specify the Slide Master . . . . . . . . . . . . . . . . . . . . . . . . . .
12-73
12-73
12-75
Add and Replace Presentation Content . . . . . . . . . . . . . . .
Set Up the Template . . . . . . . . . . . . . . . . . . . . . . . . . . . . .
Replace Content . . . . . . . . . . . . . . . . . . . . . . . . . . . . . . . .
Add and Replace Text . . . . . . . . . . . . . . . . . . . . . . . . . . . .
Add or Replace a Table . . . . . . . . . . . . . . . . . . . . . . . . . . .
Add or Replace a Picture . . . . . . . . . . . . . . . . . . . . . . . . . .
12-76
12-76
12-77
12-77
12-80
12-81
xix
xx
Contents
Create and Format Text . . . . . . . . . . . . . . . . . . . . . . . . . . . .
Create Text . . . . . . . . . . . . . . . . . . . . . . . . . . . . . . . . . . . .
Create a Subscript or Superscript . . . . . . . . . . . . . . . . . . .
Format Text . . . . . . . . . . . . . . . . . . . . . . . . . . . . . . . . . . .
12-83
12-83
12-83
12-84
Create and Format Paragraphs . . . . . . . . . . . . . . . . . . . . . .
Create a Paragraph . . . . . . . . . . . . . . . . . . . . . . . . . . . . . .
Format Paragraph Content . . . . . . . . . . . . . . . . . . . . . . . .
12-86
12-86
12-86
Create and Format Tables . . . . . . . . . . . . . . . . . . . . . . . . . .
Create a Table . . . . . . . . . . . . . . . . . . . . . . . . . . . . . . . . . .
Format a Table . . . . . . . . . . . . . . . . . . . . . . . . . . . . . . . . .
12-89
12-89
12-89
Create and Format Pictures . . . . . . . . . . . . . . . . . . . . . . . . .
Create a Picture . . . . . . . . . . . . . . . . . . . . . . . . . . . . . . . .
Format a Picture . . . . . . . . . . . . . . . . . . . . . . . . . . . . . . . .
12-94
12-94
12-95
Create and Format Links . . . . . . . . . . . . . . . . . . . . . . . . . . .
Create an External Link . . . . . . . . . . . . . . . . . . . . . . . . . .
Format an External Link . . . . . . . . . . . . . . . . . . . . . . . . .
12-96
12-96
12-96
1
Getting Started
• “Simulink Report Generator Product Description” on page 1-2
• “System Design Documentation and Results Reporting” on page 1-3
• “Interactive Model Exploration” on page 1-6
• “Report Creation Workflow” on page 1-9
• “Report Components” on page 1-11
• “Working with the Report Explorer” on page 1-16
• “How Simulink Report Generator and Simulink Software Interact” on page 1-19
• “Supported Report Formats” on page 1-20
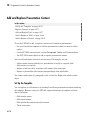
• “Add Content to PowerPoint Presentations Programmatically” on page 1-21
1
Getting Started
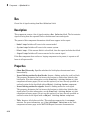
Simulink Report Generator Product Description
Design and generate reports from models and simulations
Simulink Report Generator lets you design and generate richly formatted Microsoft®
Word, HTML, and PDF reports from Simulink models and simulations. The report
generator lets you automatically create artifacts for Model-Based Design, such as system
design descriptions and generated code, requirements traceability, and testing reports.
You can publish these artifacts in an interactive web format that colleagues can use
without opening the model. You can compare Simulink models, review comparison
results in an interactive XML report, and merge model differences.
Simulink Report Generator produces artifacts for DO-178, ISO 26262, IEC 61508, and
related industry standards.
Key Features
• Automatic capture of simulation results and model specifications
• Report formatting based on Word and HTML report templates
• Interactive reports for viewing models, generated code, and analysis results in web
browsers
• Report designer for creating custom Word, HTML, PDF, RTF, and XML reports
• Artifacts for DO-178, IEC 61508, and ISO 26262, including system design, model and
code verification, and requirements documentation
• API for forms-based Word and HTML report generation
• Model differencing and merging with XML comparison tool
1-2
System Design Documentation and Results Reporting
System Design Documentation and Results Reporting
In this section...
“Types of Reports” on page 1-3
“System Design Documentation” on page 1-3
“Results Reporting” on page 1-4
Types of Reports
Two common user goals for reports are:
• System design documentation — Capture information about the design decisions,
structure, implementation, and operational details of a system.
• Results reporting — Present results of running a system.
You use a very similar workflow for creating and generating both kinds of reports.
However, some components are particularly useful for one or the other kind of report.
System Design Documentation
System documentation has many uses, including:
• Capturing design decisions
• Recording implementation details
• Communicating the system design and interfaces among groups
You can view information about a system without creating a report. For more
information, see “Interactive Model Exploration” on page 1-6.
When you create a Simulink Report Generator report to provide system design
documentation, the report captures information about the system design directly from
the model. Each time that you generate the report, you see up-to-date documentation for
the design.
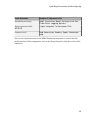
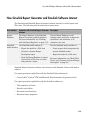
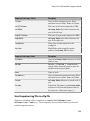
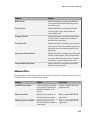
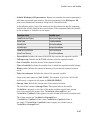
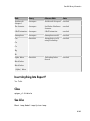
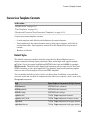
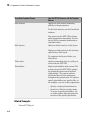
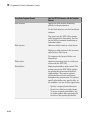
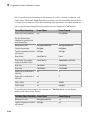
The following table includes some examples of components that are useful for system
design documentation reports.
1-3
1
Getting Started
System Information
Examples of Components to Use
Requirements
Requirements Summary Table (for requirements
specified with Simulink Verification and Validation™)
System layout
System Hierarchy, System Snapshot
Model configuration
Model Configuration Set, Model Advisor
Report
Block parameter settings
Simulink Dialog Snapshot, Block Loop
Properties
Simulink Property Table, Simulink Summary
Table
Variables
Variable Table, Simulink Workspace Variable
System documentation included Documentation, Simulink Name
in a model
Results Reporting
Results reporting has many uses, including:
• Model regression testing
• Verifying and validating designs
• Exploring design alternatives
• Optimizing designs
Simulink provides several tools for examining the results of a simulation. Simulation
data includes signal, time, output, state, and data store logging data. You can set up
your model to export simulation data to the MATLAB® workspace during simulation
for later retrieval, analysis, and postprocessing. You can use several approaches to
explore the simulation data. For details, see “Export Simulation Data” in the Simulink
documentation.
You can report on results without creating a report. For more information, see
“Interactive Model Exploration” on page 1-6.
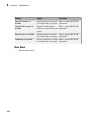
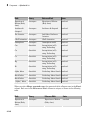
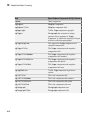
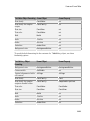
The following table includes some examples of components that are useful results
reports.
1-4
Results Information
Examples of Components to Use
Signal values
Scope Snapshot, Block Loop
System Design Documentation and Results Reporting
Results Information
Examples of Components to Use
Simulation processing
Model Simulation, Model Configuration Set,
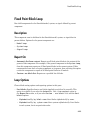
Fixed-Point Logging Options
Figures generated with
MATLAB
Figure Snapshot, To Workspace Plot
Generated code
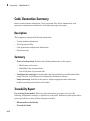
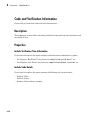
Code Generation Summary, Import Generated
Code
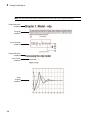
You can use components such as the Model Simulation component to control how the
model simulates. Other components, such as the Scope Snapshot, show the results of the
simulation.
1-5
1
Getting Started
Interactive Model Exploration
In this section...
“Simulink Report Generator Tools” on page 1-6
“Simulink Model Exploration Tools” on page 1-7
Simulink Report Generator Tools
The Simulink Report Generator provides tools that you can use to obtain information
about models, without creating report setup files:
• Predefined standard reports
• Web View
• XML Comparison report
Predefined Standard Reports
From the Simulink Editor, you can access two predefined, standard Simulink Report
Generator reports:
• System Design Description
• Design Requirements (requires Simulink Verification and Validation)
The System Design Description report provides summary or detailed information about
a system design represented by a model. You can choose report options with the report
dialog box, or you can create a customized version using the Report Explorer. For details,
see “Generate a System Design Description” on page 2-6.
You can use the System Design Description report setup file as a starting point for
creating a setup file for your own report.
You can also generate an HTML model report for Stateflow® charts.
You must have the Simulink Verification and Validation product installed to use the
Design Requirements report. The Design Requirements report includes information
about all the requirements associated with the model and its objects. For details, see
“Customize Requirements Traceability Report for Model” in the Simulink Verification
and Validation documentation.
1-6
Interactive Model Exploration
Web View
A Web view is an interactive rendition of a model that you can view in a Web browser.
You can use Web views to navigate hierarchically to specific subsystems and see
properties of blocks and signals.
Web views are useful for presenting models to audiences and for sharing models with
colleagues who do not have MathWorks® products installed.
For details, see “Export Models to Web View Files” on page 5-4.
XML Comparison Report
You can use Simulink Report Generator software to compare XML text renditions of
different versions of a Simulink model and to compare the XML renditions to explore
differences between versions of the model. You can also compare the XML text renditions
of two different models.
For details, see “Model Comparison”.
Simulink Model Exploration Tools
You can generate a model report, which is an HTML document that describes the
structure and content of a model. The model report includes block diagrams of the model
and its subsystems and the settings of its block parameters. To generate the report, from
the Simulink Editor, select File > Print Details. For more information, see “Generate a
Model Report”.
To interactively focus on specific elements of a model (for example, blocks, signals, and
properties) without navigating through the model diagram or chart, using the Model
Explorer. To open the Model Explorer, in the Simulink Editor, select View > Model
Explorer. For details, see “Model Explorer Overview”.
To generate a report that lists the suboptimal conditions or settings in a model, with
suggestions for better model configuration settings where appropriate, use the Model
Advisor. To open the Model Advisor, in the Simulink Editor, select Analysis > Model
Advisor. For details, see “Consulting the Model Advisor”
To navigate a model hierarchically, open systems in a model, and determine the blocks
contained in a model, you can use the Simulink Model Browser. To open the Model
1-7
1
Getting Started
Browser, select View > Model Browser Options > Model Browser. For details, see
“Model Browser”.
Simulink provides several tools for examining the results of a simulation. Simulation
data includes signal, time, output, state, and data store logging data. You can set up
your model to export simulation data to the MATLAB workspace during simulation
for later retrieval, analysis, and postprocessing. You can use several approaches to
explore the simulation data. For example, you can use the Simulation Data Inspector to
generate a report with plots of simulation data. For details, see “Save Runtime Data from
Simulation” in the Simulink documentation.
1-8
Report Creation Workflow
Report Creation Workflow
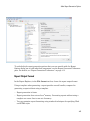
Approaches for Creating Reports
You can create and generate reports :
• Interactively, using the Report Explorer
• Programmatically, using the DOM (Document Object Model) API
You can use the Report Explorer graphical interface to create reports without having to
write code.
Using the programmatic approach, you can integrate report generation into analysis and
testing applications. For more information, see “Programmatic Report Creation”.
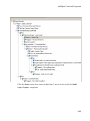
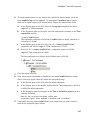
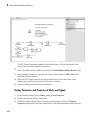
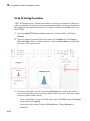
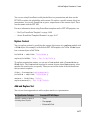
Interactive Report Creation
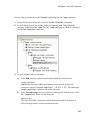
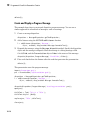
1
Open the Report Explorer. In the menu bar on the Simulink model window, click
Tools > Report Generator.
2
Create a new report setup file.
For information about report setup files, see “Report Setup”.
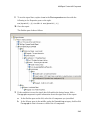
3
Add existing Simulink or Stateflow components to the report setup file, or create
your own custom components.
For information on using components, see “Working with Components”.
“Working with Components”
4
Choose a Microsoft Word, HTML, or PDF template or a Report Explorer stylesheet to
apply styles the report setup file.
For information about generating a report using a template, see “Generate a Report
Using a Template”. For information about Report Explorer style sheets, see “Layout
Stylesheets”.
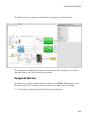
5
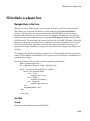
Generate the report.
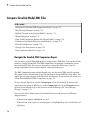
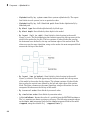
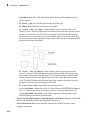
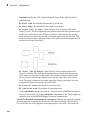
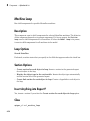
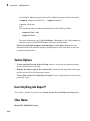
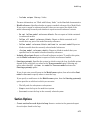
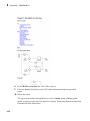
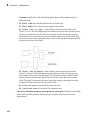
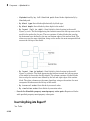
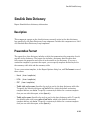
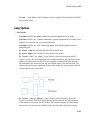
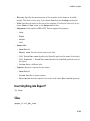
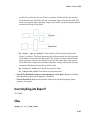
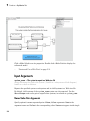
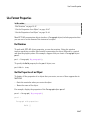
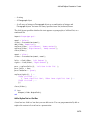
The following figure illustrates a typical Simulink Report Generator workflow.
1-9
1
Getting Started
Report Generator
Export
Simulink
Web View
Create
Simulink
model
1-10
Open
Report
Explorer
(GUI)
Create
setup
file
Add
components
Apply
stylesheet
Generate
report
Report Components
Report Components
In this section...
“About Report Components” on page 1-11
“Report Structure Components” on page 1-12
“System-Based Components” on page 1-12
“User-Supplied Information Components” on page 1-14
“Dynamic Reporting Components” on page 1-14
“Format Control at the Component Level” on page 1-15
About Report Components
Components are modules that you include in a report setup file to insert elements, such
as tables, lists, and figures, into a report. You also can use components to control report
generation processing.
Many components have parent-child relationships with other components. For example,
a child components of a Paragraph component include components such as Text, Image,
and Insert Variable.
Use a combination of the following types of components in your report setup file.
Component Type
Description
“Report Structure Components” on page
1-12
Include a title page, sections, and other
components to organize the content of a
report.
“System-Based Components” on page
1-12
Include components that automatically
obtain information directly from a model to
include in a report.
“User-Supplied Information Components”
on page 1-14
Include text and graphics that you supply,
independent of a model.
“Dynamic Reporting Components” on page
1-14
Set up dynamic control for when to include
components and what information to report
on for a component, based on data from
1-11
1
Getting Started
Component Type
Description
a model or on other conditions that you
specify.
Use the Report Explorer to add components to a report and to specify component
properties.
Report Structure Components
To add a title page, use a Title Page component. You can include an abstract and legal
notice information. For an example, see “Add a Title Page” on page 3-12.
To organize a report into sections, use Chapter/Subsection components. For an
example, see “Create a Section for Each Iteration” on page 3-29.
System-Based Components
The Simulink Report Generator includes many components that obtain information
directly from a model and include that information in a report. Using system-based
components allows your report to reflect the current state of a model. You can generate
the report whenever you want to capture the latest version of a model, without changing
the report setup file.
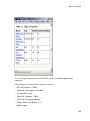
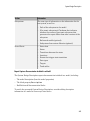
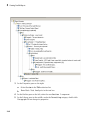
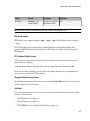
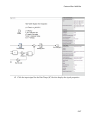
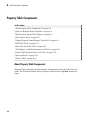
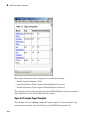
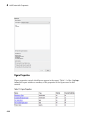
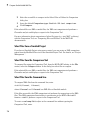
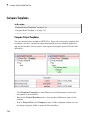
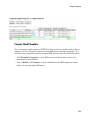
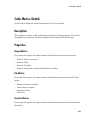
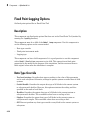
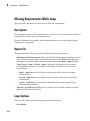
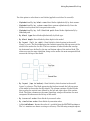
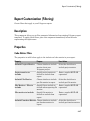
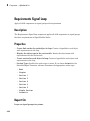
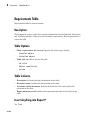
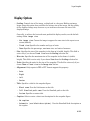
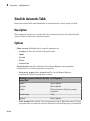
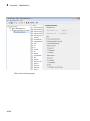
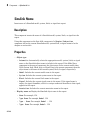
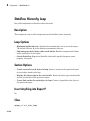
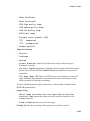
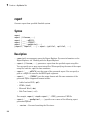
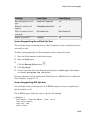
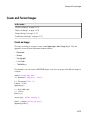
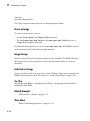
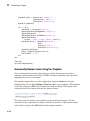
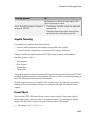
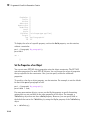
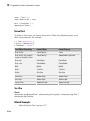
Property table components display property name/property value pairs for objects in
tables. Summary table components insert tables that include specified properties for
objects into generated reports. The tables contain one object per row, with each object
property appearing in a column, as shown in the following summary table.
1-12
Report Components
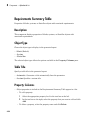
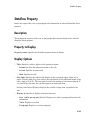
To use descriptive information from DocBlock blocks, use the Documentation
component.
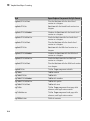
A few examples of system-based components include:
• MATLAB Property Table
• Simulink Workspace Variable
• System Hierarchy
• Simulink Summary Table
• Simulink Dialog Snapshot
• Block Execution Order List
• Model Loop
1-13
1
Getting Started
• Model Configuration Set
• Scope Snapshot
For examples of using system-based components, see:
• “Property Table Components” on page 6-6
• “Summary Table Components” on page 6-17
• “Create the Body of the Report” on page 3-21
The Simulink Report Generator also includes system-based components that contain
model elements from the following Simulink products:
• Stateflow
• Fixed-Point Designer™
• Simulink Coder™
• Simulink Verification and Validation
User-Supplied Information Components
In addition to using system-based components to extract data from a system and insert
that information into a report, you can also add content that you, or others, supply. For
example, to include text, use the Paragraph and Text components.
To insert a graphic from a file, use an Image component. To insert ASCII text, use an
Import File component.
To include notes about the report source files, use a Comment component.
For an example, see “Add Introductory Text to the First Chapter”.
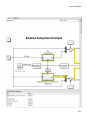
Dynamic Reporting Components
Dynamic reporting components execute conditionally, enabling you to decide when a
child component executes or how many times a child component executes. To control the
report generation flow, use logical and flow components such as Logical If, Logical
Then, While Loop, or For Loop.
A looping component runs its child components a specified number of times. There are
several looping components, including logical loops, Handle Graphics® loops, and model
1-14
Report Components
and chart loops. For model and chart loops, you can control aspects such as the order in
which the report sorts blocks.
For examples, see:
• “Logical and Looping Components” on page 6-21
• “Add Logical Then and Logical Else Components” on page 3-16
• “Create the Body of the Report” on page 3-21
• “Filter with Loop Context Functions” on page 6-22
Format Control at the Component Level
The output format and stylesheet that you select for a report determines most aspects
of the generated report formatting. For details, see “Report Output Format” on page
4-5.
In addition to stylesheets that control the format and layout of the report, for some
components you can set properties to specify formatting details for that specific instance
of a component. For example, for the Simulink Property Table, you can specify
whether to display table borders or specify the alignment of text in table cells.
1-15
1
Getting Started
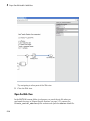
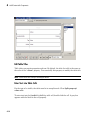
Working with the Report Explorer
About the Report Explorer
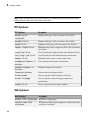
The Report Explorer is the MATLAB Report Generator and Simulink Report Generator
graphical interface. It allows you to:
• Create and modify report setup files.
• Apply stylesheets to format the generated report.
• Specify the report file format.
• Generate reports.
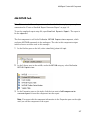
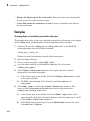
To open the Report Explorer, enter report in the MATLAB Command Window.
1-16
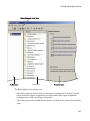
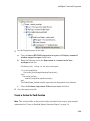
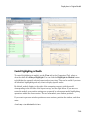
Working with the Report Explorer
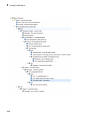
Library pane
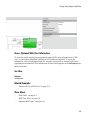
The Report Explorer has three panes:
• The Outline pane on the left shows the hierarchy of components in currently opened
report setup files. Report components can reside within other report components,
creating parent, child, and sibling relationships.
• The Library pane in the middle lists the objects available in the context of the Outline
pane.
1-17
1
Getting Started
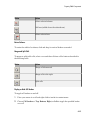
Outline Pane Context
Library Pane Contents
No report setup file is open.
Reports
Report setup file is open.
Components
Stylesheet is open.
Stylesheet attributes
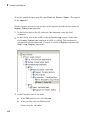
• The Properties pane contents depend on the Outline pane context. If no report setup
file is open, on the right displays tasks the Report Explorer can perform. If a report
setup file is open, the Properties pane displays the properties for the item that is
currently selected in the Library pane.
Outline Pane Context
Properties Pane Contents
No report setup file is open.
Tasks that the Report Explorer can
perform
Report setup file is open.
Properties for the item that is currently
selected
After you create a report setup file,
the Properties pane initially displays
properties for the report setup file as a
whole.
Tip If the Report Explorer window opens with only two panes, one of the panes is hidden.
You can move the vertical boundaries between the panes to reveal any hidden pane, or to
make visible panes wider or narrower.
1-18
How Simulink Report Generator and Simulink Software Interact
How Simulink Report Generator and Simulink Software Interact
The Simulink and Simulink Report Generator software interact to create reports and
Web views. The following table describes these interactions.
User Interface
Interaction with Simulink Report Generator Description
software
Report
Explorer
The Report Explorer is the Simulink
Report Generator graphical interface.
For more information, see “Working
with the Report Explorer” on page 1-16.
Simulink
Use Simulink model window to:
model window
• Export the model to a Web view
• Generate a System Design
Description report
• Start the Report Explorer to export
the model to a Web view or create
and generate a report
Use the Report Explorer to edit
existing report setup files, components,
stylesheets, and attributes, or to
customize your own.
Use the Simulink model window to:
• Create reports that incorporate the
current Simulink model
• Export the model to a Web view
For more information, see “Model Web
Views” and “Generate a System Design
Description” on page 2-6.
Simulink Report Generator software also interacts with Simulink Coder and Stateflow
software.
Use report generation capabilities with the Simulink Coder software to:
• Create Adobe® Acrobat® PDF and Microsoft Word documents for generated code.
Use report generation capabilities with the Stateflow software to:
• Take snapshots of charts.
• Describe truth tables.
• Document chart hierarchy.
• Document object properties.
1-19
1
Getting Started
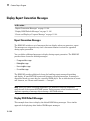
Supported Report Formats
When the report generation process first creates a report, it generates a DocBook XML
source file. You can customize this XML as needed. For more information, see the
OASIS™ DocBook TC Web page at http://www.oasis-open.org/committees/
docbook and http://www.docbook.org/tdg/en/html/docbook.html.
Next, the report generation process converts the XML source to one of these userspecified report formats:
• Adobe Acrobat PDF
Note: PDF reports only support bitmap (.bmp), jpeg (.jpg), and Scalable Vector
Graphics (.svg) images. The SVG format is only supported for Simulink models and
Stateflow charts. For example, MATLAB figures do not display in SVG when you
select the SVG format for PDF reports.
• Hypertext Markup Language (HTML)
• Microsoft Word (.doc)
• Rich Text Format (RTF)
Note: RTF reports use placeholders (field codes) for dynamically generated content,
such as page numbers or images.
On Windows® platforms, to display that content, press Ctrl-A, and then press F9.
On Linux® and Mac platforms, use the field code update interface for the program
that you are using to view the RTF document.
1-20
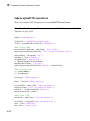
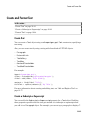
Add Content to PowerPoint Presentations Programmatically
Add Content to PowerPoint Presentations Programmatically
You can use the PPT (PowerPoint®) API to add generated content to an existing
PowerPoint presentation or to create a complete PowerPoint presentation
programmatically. Your presentation can capture dynamic information from a
MATLAB® program without you making manual updates to the presentation. You can
use templates, slide masters, and styles to format your presentation.
For more information, see “Programmatic PowerPoint Presentation Creation”.
1-21
2
Generate System Design Description
Reports
• “System Design Description” on page 2-2
• “Generate a System Design Description” on page 2-6
• “Customize the System Design Description” on page 2-10
2
Generate System Design Description Reports
System Design Description
In this section...
“Predefined Standard Reports” on page 2-2
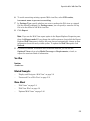
“What Is the System Design Description?” on page 2-2
“What You Can Do with the Report” on page 2-3
“Report Contents” on page 2-3
Predefined Standard Reports
From the Simulink Editor, you can access two predefined, standard Simulink Report
Generator reports called:
• System Design Description
• System Requirements Traceability
The System Design Description report provides summary or detailed information about
a system design represented by a model. You can choose report options using the report
dialog, or you can create a customized version using the Report Explorer. For details, see
“Generate a System Design Description” on page 2-6.
You can use the System Design Description report setup file as a starting point for
creating a setup file for your own report.
You can also generate an HTML model report for Stateflow charts. For details, see
“Generate a Model Report”.
The System Requirements Traceability report requires that you have the Simulink
Verification and Validation product installed. The System Requirements Traceability
report includes information about all the requirements associated with the model and its
objects. For details, see “Customize Requirements Traceability Report for Model” in the
Simulink Verification and Validation documentation.
What Is the System Design Description?
The System Design Description is a prebuilt Simulink Report Generator report that
describes the system design represented by a Simulink model.
2-2
System Design Description
By default, the Simulink Report Generator generates the report for the model from which
you invoke the System Design Description report option.
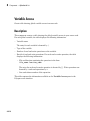
What You Can Do with the Report
You can use the System Design Description to
• Review a system design without having the model open
• Generate summary and detailed descriptions of the design
• Assess compliance with design requirements
• Archive the system design in a format independent of the modeling environment
• Build a customized version of the report, using the Report Explorer
Note: To view step-by-step tutorials for creating and generating a report, see the
Introduction to System Design Description Reports example.
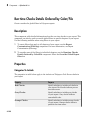
Report Contents
You can specify what kinds of information to include in the report, in terms of:
• What elements of a model to include in the report (for example, whether to include
subsystems from custom libraries)
• Whether to generate a summary version or a detailed version of the System Design
Description report.
For details, see “Generate a System Design Description” on page 2-6.
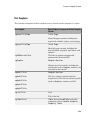
Summary Version
Section
Information
Report Overview
Model version
Root System
• Block diagram representing the algorithms that
compute root system outputs
• Description (if available from model)
• Interface: name, data type, and other properties of the
system input and output signals
2-3
2
Generate System Design Description Reports
Section
Information
• Subsystems: the path and a block diagram for each
subsystem
• State charts
• Requirements (optional)
Subsystems
• Path
• Block diagram
System Design Variables
• Design variables
• Functions in design variable expressions
Detailed Version
The detailed version of the report includes all the information that is in the summary
form of the report, as well as more information about the system components. The atomic
subsystem information is more detailed than virtual subsystem information.
Section
Information
Report Overview
Model version
Root system
• Block diagram representing the algorithms that
compute root system outputs
• Description (if available from model)
• Interface: name, data type, and other properties of the
root system input and output signals
• Block parameters
• Includes detailed information about MATLAB
Function blocks
• Block execution order for root system and atomic
subsystems
• Look-up tables
• Simulink workspace variables
• Model configuration sets
• State charts
• Requirements (optional)
2-4
System Design Description
Section
Information
Subsystems
The same type of information as the information for the
root system, as well as:
• Path of the subsystem in the model
• (For atomic subsystems) Checksum that indicates
whether the version of an atomic subsystem that
generates the report differs from other versions of the
subsystem
• Referenced models (optional)
• Subsystems from custom libraries (optional)
State Charts
• State chart
• States
• Transitions between the states
• Junctions
• Events that trigger state transitions
• Data types
• Targets
• Truth tables
Report Captures Documentation Included in a Model
The System Design Description reports documentation included in a model, including:
• The model description (from the model properties)
• The block property Description
• DocBlock model documentation blocks
To enrich the generated System Design Description, consider adding descriptive
information in a model in these ways listed above.
2-5
2
Generate System Design Description Reports
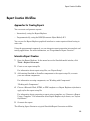
Generate a System Design Description
In this section...
“Open the System Design Description Dialog Box” on page 2-6
“Choose System Design Description Options” on page 2-6
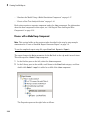
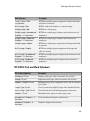
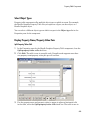
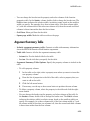
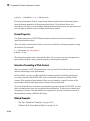
Open the System Design Description Dialog Box
To open the System Design Description dialog box:
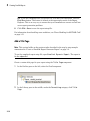
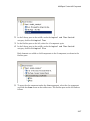
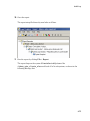
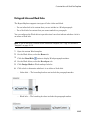
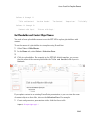
1
Open the model or subsystem for which you want to generate a report.
Note: The System Design Description fails for models that simulate with an error.
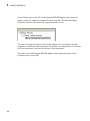
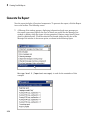
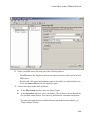
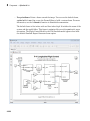
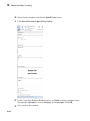
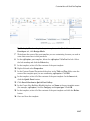
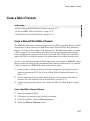
2
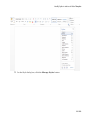
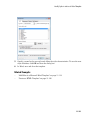
From the Simulink Editor File menu, select Reports > System Design
Description. The System Design Description dialog box opens
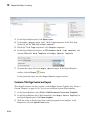
3
Specify layout and content options for the report. For details, see “Choose System
Design Description Options” on page 2-6.
4
Click the Generate
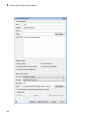
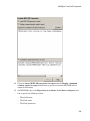
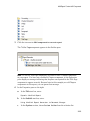
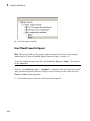
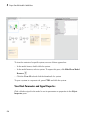
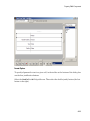
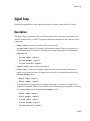
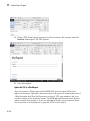
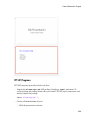
Choose System Design Description Options
You can specify options for layout and content, for the following items:
• Title page contents
• Report content
• Report file format and storage location
Tip For faster report generation, set File format to use a template. Select one of these
formats:
• PDF (from template), which is the default
• Word (from template)
2-6
Generate a System Design Description
• HTML (from template)
2-7
2
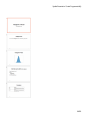
2-8
Generate System Design Description Reports
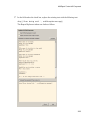
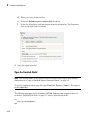
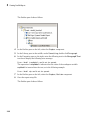
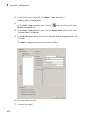
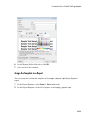
Generate a System Design Description
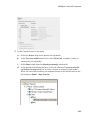
In the dialog box, to display detailed information about each option, right-click on the
option prompt and select the What's This context-sensitive help.
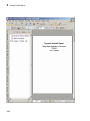
To create a customized version of the report, click the Customize Content button. The
customize option creates a copy of the report setup file and opens the copy in the Report
Explorer. See “Customize the System Design Description” on page 2-10.
2-9
2
Generate System Design Description Reports
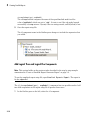
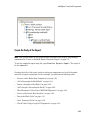
Customize the System Design Description
In this section...
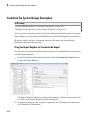
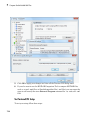
“Using the Report Explorer to Customize the Report” on page 2-10
“Building a Dialog Box for a Custom Report Setup File” on page 2-11
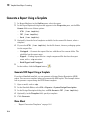
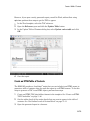
You can create customized versions of the System Design Description report by using the
Report Explorer and, optionally the MATLAB tools for building graphical user interfaces.
By default, when you open a customized version of the report, the System Design
Description dialog box does not open.
Using the Report Explorer to Customize the Report
To customize the System Design Description setup file in the Simulink Report Generator
using the Report Explorer:
1
In the System Design Description dialog box, click the Customize Content button
to open the Report Explorer.
The Report Explorer reflects any changes (for example, a different report name) that
you made in the System Design Description dialog box.
2
2-10
In the Report Explorer, add or modify components. See “Working with Components”
and “Information Components”.
Customize the System Design Description
• Do not remove the sdd_custom_data structure, which is defined as:
sdd_custom_data = struct('model',bdroot,'rootSystem',gcs);
You can modify the model argument, which is the model for which you generated
the report and the rootSystem argument, which is the system level in the model
at which, and below which, you want to use to generate the report.
• Do not remove or modify functions that begin with StdRpt, such as
%StdRpt.getChecksum
3
Optionally modify a style sheet (see “Layout Stylesheets”).
4
Save the customized report with a name other than SDD_custom.rpt.
Building a Dialog Box for a Custom Report Setup File
To provide options for your custom report, you can create a dialog box, like the System
Design Description dialog box. The dialog box that you create for your custom report
can allow others to adapt the report to meet their needs, without their having to use the
Report Explorer.
2-11
3
Creating Simulink Reports
• “Create a Simulink Report Generator Report” on page 3-2
• “Specify Report Options in the Setup File” on page 3-3
• “Add Report Content with Components” on page 3-5
• “Error Handling for MATLAB Code” on page 3-51
• “Generate the Report” on page 3-52
3
Creating Simulink Reports
Create a Simulink Report Generator Report
This example shows how to use the Report Explorer to design a report setup file and
generate a report that does the following:
• Opens a Simulink model for the van der Pol equation, called the vdp model.
• Sets the Gain parameter for the Mu block to five different values.
• Simulates the model each time the Gain parameter is set.
• Collects the results. Results that fall within a specified range appear in a table in the
generated report.
You do not need to know MATLAB or Simulink software to create and run this example
report. However, knowledge of these products might be helpful for understanding the
MATLAB code and model simulation that executes.
To create this report, you perform these main tasks:
• “Specify Report Options in the Setup File” on page 3-3
• “Add Report Content with Components” on page 3-5
This example includes separate sections for different kinds of report creation and
generation task. Each section builds on the previous sections. However, if you want to see
the report setup components for a later section without doing the previous sections, in
MATLAB you can view the completed report setup file by opening Dynamic Simulink
Report. The report is for the vdp model.
Note: For another set of step-by-step examples for creating and generating a report, see
the Introduction to System Design Description Reports example.
3-2
Specify Report Options in the Setup File
Specify Report Options in the Setup File
To create and configure the report setup file:
1
Start a Simulink software session.
2
Open the Report Explorer. From the MATLAB Toolstrip, in the Apps tab, in the
Database Connectivity and Reporting section, click Report Generator.
3
Select File > New to create a report setup file.
4
Save the report setup file.
In the Properties pane:
a
Specify where to save the report setup file. To save it in the current working
folder, select Present Working Directory from the Directory selection list.
b
Specify the report format. In the File format selection list, select Acrobat
(PDF).
c
Enter a description for the report. In the Report description text box, replace
the existing contents with the following text.
Tip Copy and paste this code from the HTML documentation into the Report
Explorer.
Simulink Dynamic Report
This report opens up a model, sets a block parameter
several times, simulates the model, and collects the
results. Results that fall within a specified range are
displayed in a table after the test is complete.
The report is configured to test the vdp model only.
By selecting the Eval String component immediately
below the Report component, you can modify
* model
* block
* parameter
* tested values
5
Click File > Save As to save the report setup file as simulink_tutorial.rpt.
3-3
3
Creating Simulink Reports
The Outline pane on the left displays the new file name.
To create the content for the report, see “Add Report Content with Components” on page
3-5.
3-4
Add Report Content with Components
Add Report Content with Components
In this section...
“Report Components” on page 3-5
“Add MATLAB Code” on page 3-7
“Add a Title Page” on page 3-12
“Open the Simulink Model” on page 3-14
“Add Logical Then and Logical Else Components” on page 3-16
“Error If Model Cannot Be Opened” on page 3-18
“Create the Body of the Report” on page 3-21
“Process with a Model Loop Component” on page 3-22
“Add a Paragraph for Each Model” on page 3-24
“Insert a Snapshot of the Model” on page 3-25
“Add a Loop for Processing the Model” on page 3-26
“Block Parameter Value from a MATLAB Expression” on page 3-28
“Create a Section for Each Iteration” on page 3-29
“Insert the Block Value” on page 3-31
“Set a Parameter Value” on page 3-32
“Check Value Using a Logical If Component” on page 3-34
“Simulate the Model Using a Model Simulation Component” on page 3-37
“Create a Post-Test Analysis Section” on page 3-43
Report Components
Report components specify what information to include in the report. Components are
self-contained, modular MATLAB objects that control the report-generation process
and insert elements, such as tables, lists, and figures, into a report setup file. Use
components to customize the appearance and output of reports.
For more information, see “Report Components” on page 1-11.
The following figure shows a sample page from the report you create in this example, and
which components you use to produce this output.
3-5
3
Creating Simulink Reports
Note: Do not deactivate report components that you add to the report setup file.
Chapter/Subsection
component
Paragraph
component
System Snapshot
component
Chapter/Subsection
component
Insert Variable
component
Scope
Snapshot
component
3-6
Add Report Content with Components
Add MATLAB Code
Note: This section builds on the previous tasks described in the step-by-step example
summarized in “Create a Simulink Report Generator Report” on page 3-2.
To see the completed report setup file, open Simulink Dynamic Report. The report is
for the vdp model.
The first component to add is the Evaluate MATLAB Expression component, which
evaluates MATLAB commands in the workspace. The code in this component assigns
initial values to variables used in this example.
1
In the Outline pane on the left, select simulink_tutorial.rpt.
2
In the Library pane in the middle, under the MATLAB category, select Evaluate
MATLAB Expression.
3
In the Properties pane on the right, click the icon next to Add component to
current report to insert the component into the report.
Note: You cannot edit the component information in the Properties pane on the right
until you add the component to the report.
3-7
3
Creating Simulink Reports
In the Outline pane on the left, the Evaluate MATLAB Expression component
appears under the simulink_tutorial report setup file. The Simulink Report
Generator software abbreviates the component name to Eval.
The icon in the upper-left corner of the Eval component's icon indicates that this
component cannot have child components. By default, any components you add while
the Eval component is selected are siblings of this component.
The options for the Evaluate MATLAB Expression component appear in the
Properties pane on the right.
3-8
Add Report Content with Components
4
Clear the Insert MATLAB expression in report and the Display command
window output in report check boxes so you do not include MATLAB code or
output in this report.
5
Add MATLAB code to the Expression to evaluate in the base workspace text
box to specify the following values:
• The model name
• The block name
• The block parameter
3-9
3
Creating Simulink Reports
• Parameter values
• Other initial values required for processing the vdp model
Replace the existing text with the following MATLAB code.
%The name of the model
%that will be changed
expModel='vdp';
%The name of the block in the model
%that will be changed
expBlock='vdp/Mu';
%The name of the block parameter
%that will be changed
expParam='Gain';
%The values that will be set
%during experimentation
expValue=[-1 0 .5 1 2];
%expValue can be either a vector
%or a cell array
testMin=2.1;
testMax=3;
%---- do not change code below line --try
open_system(expModel);
end
expOkValues=cell(0,2);
Note: When you change a field in the Properties pane on the right, the field
background changes color (the default is a cream color), indicating that there are
unapplied changes to that field. As soon as you perform operations on another
component, the Simulink Report Generator software applies the changes, and the
background color becomes white again.
6
3-10
Select the Evaluate this expression if there is an error check box.
Add Report Content with Components
7
In the field under the check box, replace the existing text with the following text:
disp(['Error during eval: ', evalException.message])
The Report Explorer window now looks as follows.
3-11
3
Creating Simulink Reports
Tip To run the commands that you specified in your MATLAB expression, click the
Eval Now button. This button is located at the upper-right corner of the Report
Explorer. This is an easy way to ensure that your commands are correct and will not
cause report generation problems.
8
Click File > Save to save the report setup file.
For information about handling error conditions, see “Error Handling for MATLAB Code”
on page 3-51.
Add a Title Page
Note: This section builds on the previous tasks described in the step-by-step example
summarized in “Create a Simulink Report Generator Report” on page 3-2.
To see the completed report setup file, open Simulink Dynamic Report. The report is
for the vdp model.
Create a custom title page for your report using the Title Page component.
3-12
1
In the Outline pane on the left, select the Eval component.
2
In the Library pane in the middle, under the Formatting category, click Title
Page.
Add Report Content with Components
3
Click the icon next to Add component to current report.
The Title Page component appears in the Outline pane.
Note: To use the Title Page component, you need to have a Chapter component
in your report . You have not yet added a Chapter component, so the Properties
pane displays a message indicating that chapters are required for the Title Page
component to appear correctly. Because later in this example you add Chapter
components to this report, you can ignore that message.
4
In the Properties pane on the right:
a
In the Title text box, enter:
Dynamic Simulink Report
b
In the Subtitle text box, enter:
Using Simulink Report Generator to Document Changes
c
In the Options section, choose Custom Author from the selection list.
3-13
3
Creating Simulink Reports
d
Enter your name in the text box.
e
Select the Include report creation date check box.
f
Select the default date and time format from the selection list. The Properties
pane on the right looks as follows.
Save the report setup file.
5
Open the Simulink Model
Note: This section builds on the previous tasks described in the step-by-step example
summarized in “Create a Simulink Report Generator Report” on page 3-2.
To see the completed report setup file, open Simulink Dynamic Report. The report is
for the vdp model.
The following statement in the Evaluate MATLAB Expression component that you
created in “Add MATLAB Code” on page 3-7 tries to open the vdp model:
try
open_system(expModel);
end
3-14
Add Report Content with Components
Tip Select the Eval component in the Outline pane on the left to look at this code again.
To see if the vdp model was successfully opened, test the result of the open_system
command using a Logical If component.
1
In the Outline pane on the left, select the Title Page component.
2
In the Library pane in the middle, under the Logical and Flow Control
category, select Logical If. This component checks to see if a given condition is
true or false; in this case, if the model opened successfully.
3
In the Properties pane on the right, click the icon next to Add component to
current report. The Logical If component appears as if in the Outline pane.
These components are child components of the report and siblings of one another.
Components can have parent, child, and sibling relationships.
This component can have child components. “Add Logical Then and Logical Else
Components” on page 3-16 explains how to add two child components to the if
component.
4
In the Properties pane on the right, in the Test expression text box, replace the
default text, true, with the following text:
3-15
3
Creating Simulink Reports
strcmp(bdroot(gcs),expModel)
The strcmp function compares the name of the open Simulink model and the
value of expModel, which was set to 'vdp'. It tests to see if the vdp model opened
successfully. strcmp returns 1 (true) if the two strings match, and 0 (false) if not.
5
Save the report setup file.
The if component name in the Outline pane changes to include the expression that
you added.
Add Logical Then and Logical Else Components
Note: This section builds on the previous tasks described in the step-by-step example
summarized in “Create a Simulink Report Generator Report” on page 3-2.
To see the completed report setup file, open Simulink Dynamic Report. The report is
for the vdp model.
The if strcmp(bdroot(gcs), expModel)) component has two possible results. Add
two child components to the report setup file to process these cases.
1
3-16
In the Outline pane on the left, select the if component.
Add Report Content with Components
2
In the Library pane in the middle, under the Logical and Flow Control
category, double-click Logical Then.
3
In the Outline pane on the left, select the if component again.
4
In the Library pane in the middle, under the Logical and Flow Control
category, double-click Logical Else.
Both elements are added as child components to the if component, as shown in the
Outline pane.
5
To move the else component under the then component, select the else component
and click the down arrow on the toolbar once. The Outline pane on the left looks as
follows.
3-17
3
Creating Simulink Reports
6
Save the report setup file.
Error If Model Cannot Be Opened
Note: This section builds on the previous tasks described in the step-by-step example
summarized in “Create a Simulink Report Generator Report” on page 3-2.
To see the completed report setup file, open Simulink Dynamic Report. The report is
for the vdp model.
If the if strcmp(bdroot(gcs), expModel)) component fails (the vdp model cannot
open), the else component executes. Display an error message in the report using the
Chapter/Subsection component.
1
3-18
In the Outline pane on the left, select the else component.
Add Report Content with Components
2
In the Library pane in the middle, under the Formatting category, double-click
Chapter/Subsection to add it as a child of the else component. This component
displays an error message if an error occurs when opening the vdp model.
Note: When you add a component to a report, it is added by default as a child
component unless the selected component cannot have child components.
3
In the Properties pane on the right, choose Custom from the Title selection list, and
then enter the following text in the text box:
Load Model Failed.
Save the report file.
3-19
3
Creating Simulink Reports
The Outline pane looks as follows.
4
In the Outline pane on the left, select the Chapter component.
5
In the Library pane in the middle, under Formatting, double-click Paragraph.
6
In the Properties pane on the right, enter the following text in the Paragraph Text
text box to display the following error message:
Error: Model %<expModel> could not be opened.
The expression %<expModel> indicates that the value of the workspace variable
expModel is inserted into the text, as in the following example.
Error: Model vdp could not be opened.
7
In the Outline pane on the left, select the Chapter/Section component.
8
Save the report setup file.
The Outline pane looks as follows.
3-20
Add Report Content with Components
Create the Body of the Report
Note: This section builds on the previous tasks described in the step-by-step example
summarized in “Create a Simulink Report Generator Report” on page 3-2.
To see the completed report setup file, open Simulink Dynamic Report. The report is
for the vdp model.
Creating the body of the report involves setting up components and code for dynamic
execution of report components. In this example, you perform the following tasks:
• “Process with a Model Loop Component” on page 3-22
• “Add a Paragraph for Each Model” on page 3-24
• “Insert a Snapshot of the Model” on page 3-25
• “Add a Loop for Processing the Model” on page 3-26
• “Block Parameter Value from a MATLAB Expression” on page 3-28
• “Create a Section for Each Iteration” on page 3-29
• “Insert the Block Value” on page 3-31
• “Set a Parameter Value” on page 3-32
• “Check Value Using a Logical If Component” on page 3-34
3-21
3
Creating Simulink Reports
• “Simulate the Model Using a Model Simulation Component” on page 3-37
• “Create a Post-Test Analysis Section” on page 3-43
Each action requires a separate component under the then component. For information
about the then component in this report, see “Add Logical Then and Logical Else
Components” on page 3-16.
Process with a Model Loop Component
Note: This section builds on the previous tasks described in the step-by-step example
summarized in “Create a Simulink Report Generator Report” on page 3-2.
To see the completed report setup file, open Simulink Dynamic Report.
The report changes the Gain parameter for the Mu block in the vdp model several times.
This task requires a Model Loop component.
1
In the Outline pane on the left, select the then component.
2
In the Library pane in the middle, scroll down to the Simulink category, and then
double-click Model Loop. It is added as a child of the then component.
The Properties pane on the right looks as follows.
3-22
Add Report Content with Components
3
In the Properties pane on the right:
a
Select the Active check box to process the vdp model.
b
In the Traverse model selection list, select Selected system(s) only to
traverse only the vdp model.
c
Select Model root from the Starting system(s) selection list.
d
At the bottom of the Properties pane on the left, select the Create section for
each object in loop check box to create a chapter or section for each model.
When you select this check box, the component name in the Outline pane on the
left changes to Model Loop Chapter.
3-23
3
Creating Simulink Reports
4
e
Select the Display the object type in the section title check box to include
the object type (in this example, model) in the title name.
f
Clear the Create link anchor for each object in loop check box.
Save the report setup file.
Add a Paragraph for Each Model
Note: This section builds on the previous tasks described in the step-by-step example
summarized in “Create a Simulink Report Generator Report” on page 3-2.
To see the completed report setup file, open Simulink Dynamic Report. The report is
for the vdp model.
In each Model Loop Chapter, add an explanation using the Paragraph component.
3-24
1
In the Outline pane on the left, select the Model Loop Chapter component.
2
In the Library pane in the middle, scroll up to the Formatting category, and then
double-click Paragraph. The Paragraph component is added as a child of the
Model Loop Chapter component.
3
In the Properties pane on the right, in the Paragraph Text text box, enter the
following text:
Add Report Content with Components
This report demonstrates Simulink Report Generator's ability
to experiment with Simulink systems and auto-document
the results. In this report, you load the model %<expModel>
and simulate it %<length> times. This report modifies the
%<expBlock> block's "%<expParam>" value, setting it to the
values %<expValue>. Each iteration of the test includes
a set of scope snapsnots in the report.
When this report is generated, the variable names preceded by percent signs (%)
and enclosed in brackets (<>) are replaced with the values of those variables in the
MATLAB workspace.
4
Save the report setup file.
Insert a Snapshot of the Model
Note: This section builds on the previous tasks described in the step-by-step example
summarized in “Create a Simulink Report Generator Report” on page 3-2.
To see the completed report setup file, open Simulink Dynamic Report. The report is
for the vdp model.
Inside each Model Loop Chapter component, include a snapshot of the current model
using the System Snapshot component.
1
In the Outline pane on the left, select the Model Loop Chapter component.
2
In the Library pane in the middle, scroll down to the Simulink category, and then
double-click the System Snapshot component.
This component inserts an image of the current model into your report. The
Properties pane on the right looks as follows.
3-25
3
Creating Simulink Reports
3
In the Properties pane on the right:
a
Select Zoom from the Scaling selection list.
b
Enter 70 as the % value.
4
In the Outline pane on the left, select the System Snapshot component.
5
Click the down arrow on the toolbar once to move it under the Paragraph
component.
6
Save the report setup file.
Add a Loop for Processing the Model
Note: This section builds on the previous tasks described in the step-by-step example
summarized in “Create a Simulink Report Generator Report” on page 3-2.
To see the completed report setup file, open Simulink Dynamic Report. The report is
for the vdp model.
3-26
Add Report Content with Components
Create a loop to process the model %length times using the For Loop component.
1
In the Outline pane on the left, select the System Snapshot component.
2
In the Library pane in the middle, under the Logical and Flow Control
category, double-click For Loop. The For Loop component is added as a sibling of
the System Snapshot component.
3
In the Properties pane on the right:
a
In the End text box, replace the existing text with the following text:
length(expValue)
expValue is the array of Gain parameter values assigned in the Eval
component with the command expValue=[-1 0 0.5 1 2];. The expression
length(expValue) evaluates to 5 in this example.
b
In the Variable name text box, replace the existing text with the name of the
for loop variable. Enter the following text:
expIteration
The name of the For component in the Outline pane on the left changes to
reflect the loop variable and the termination value.
3-27
3
Creating Simulink Reports
4
Save the report setup file.
Block Parameter Value from a MATLAB Expression
Note: This section builds on the previous tasks described in the step-by-step example
summarized in “Create a Simulink Report Generator Report” on page 3-2.
To see the completed report setup file, open Simulink Dynamic Report. The report is
for the vdp model.
For each iteration, get a value from the expValue array to use as the Gain parameter
value. This task requires an Evaluate MATLAB Expression component.
3-28
1
In the Outline pane on the left, select the for component.
2
In the Library pane in the middle, under the MATLAB category, double-click
Evaluate MATLAB Expression. In the Outline pane, the component name is
shortened to Eval.
Add Report Content with Components
3
On the Properties pane on the right:
a
Clear the Insert MATLAB expression in report and Display command
window output in report check boxes.
b
Enter the following text in the Expression to evaluate in the base
workspace text box:
%Evaluate this string in the base workspace
if iscell(expValue)
Iteration_Value=expValue{expIteration};
else
Iteration_Value=...
num2str(expValue(expIteration));
end
The Iteration_Value variable represents the designated array element.
c
4
Clear the Evaluate expression if there is an error check box.
Save the report setup file.
Create a Section for Each Iteration
Note: This section builds on the previous tasks described in the step-by-step example
summarized in “Create a Simulink Report Generator Report” on page 3-2.
3-29
3
Creating Simulink Reports
To see the completed report setup file, open Simulink Dynamic Report. The report is
for the vdp model.
Create a separate section for each iteration of the loop that includes the data using the
Chapter/Subsection component.
1
In the Outline pane on the left, under the for component, select the Eval
component.
2
In the Library pane in the middle, under the Formatting category, double-click
the Chapter/Subsection component to add it as a sibling. This component is
automatically added as Section 1 because it is inside a Chapter component (the
Model Loop Chapter component).
3
In the Properties pane on the right:
a
In the Title selection list, select Custom.
b
In the text box, enter the following title:
Processing the vdp model
3-30
Add Report Content with Components
This indicates that the section title comes from the first child component. Do not
change any other properties.
4
Save the report setup file.
Insert the Block Value
Note: This section builds on the previous tasks described in the step-by-step example
summarized in “Create a Simulink Report Generator Report” on page 3-2.
To see the completed report setup file, open Simulink Dynamic Report. The report is
for the vdp model.
Insert the Gain value that is used for each simulation.
1
In the Outline pane on the left, select the Section 1 component.
2
In the Library pane in the middle, under the MATLAB category, double-click Insert
Variable.
3
In the Properties pane on the right:
a
In the Variable name text box, enter Iteration_Value.
b
In the Display as selection list, select Paragraph.
The Properties pane on the right looks as follows.
3-31
3
Creating Simulink Reports
4
Save the report setup file.
Set a Parameter Value
Note: This section builds on the previous tasks described in the step-by-step example
summarized in “Create a Simulink Report Generator Report” on page 3-2.
To see the completed report setup file, open Simulink Dynamic Report. The report is
for the vdp model.
For each iteration, set the Gain parameter to the value that you extracted from the
expValue array.
3-32
1
In the Outline pane on the left, select the Variable component.
2
In the Library pane in the middle, under the MATLAB category, double-click
Evaluate MATLAB Expression. This component is added as a sibling of the
Variable component.
Add Report Content with Components
3
In the Properties pane on the right, clear the Insert MATLAB expression in
report and Display command window output in report check boxes.
4
In the Expression to evaluate in the base workspace text box, replace the
existing text with the following text.
set_param(expBlock,expParam,Iteration_Value);
okSetValue=(1);
The set_param command sets the value of the Gain parameter for the Mu block in
the vdp model to the value of Iteration_Value.
5
Make sure you select Evaluate expression if there is an error. Enter the
following text into the text box:
okSetValue=logical(0);
If the set_param command works, okSetValue is set to 1. If an error occurs,
okSetValue is set to 0. The next component then reports the error and terminates
processing.
6
Save the report setup file.
The Outline pane on the left looks as follows.
3-33
3
Creating Simulink Reports
Check Value Using a Logical If Component
Note: This section builds on the previous tasks described in the step-by-step example
summarized in “Create a Simulink Report Generator Report” on page 3-2.
To see the completed report setup file, open Simulink Dynamic Report. The report is
for the vdp model.
Check the value of okSetValue using a Logical If component. If the value is 0, the
simulation cannot proceed because the Gain parameter could not be set.
3-34
1
In the Outline pane on the left, select the Eval component for the set_param
command.
2
In the Library pane in the middle, under the Logical and Flow Control
category, double-click Logical If. The component is added as a sibling of Eval.
Add Report Content with Components
3
In the Properties pane on the right, in the Test expression text box, replace true
with okSetValue.
okSetValue can be 1 (true) or 0 (false), so insert two components — Logical Then
and Logical Else — to process those conditions:
1
In the Outline pane on the left, select the if(okSetValue) component.
2
To insert Logical Then and Logical Else in the correct order:
a
In the Library pane in the middle, double-click the Logical Else component.
b
Select the if(okSetValue) component again.
c
Double-click the Logical Then component. The Outline pane on the left looks
as follows.
3-35
3
Creating Simulink Reports
3
In the Outline pane on the right, select the else component.
4
In the Library pane in the middle, double-click Paragraph.
If okSetValue = 0, the Gain parameter value is not set and the report displays an
error.
5
In the Properties pane on the right:
a
Choose Custom title from the Title Options selection list.
b
Enter Error in the text box next to the selection list.
c
Enter the following text into the Paragraph Text text box:
Could not set %<expBlock> "%<expParam>" to value
%<Iteration_Value>.
6
3-36
Save the report.
Add Report Content with Components
Simulate the Model Using a Model Simulation Component
Note: This section builds on the previous tasks described in the step-by-step example
summarized in “Create a Simulink Report Generator Report” on page 3-2.
To see the completed report setup file, open Simulink Dynamic Report. The report is
for the vdp model.
Now that the model is open and the Gain parameter is set, use the Model Simulation
component to simulate the vdp model.
1
In the Outline pane on the left, select the then component under the if
(okSetValue) component.
2
In the Library pane, under the Simulink category, double-click Model
Simulation. In the Outline pane on the left, this component is renamed Simulate
model.
3-37
3
Creating Simulink Reports
3
In the Properties pane on the right:
a
Clear the Use model's workspace I/O variable names check box.
b
In the Time text box, enter dynamicT.
c
In the States text box, enter dynamicX.
d
In the Output text box, enter dynamicY.
The Properties pane on the right looks as follows.
3-38
Add Report Content with Components
4
In the Outline pane on the left, select the Simulate model component.
5
In the Library pane in the middle:
a
Scroll down to the Simulink Blocks category.
b
Double-click Scope Snapshot to add it as a sibling of the Simulink Model
component.
3-39
3
Creating Simulink Reports
This component captures the scope for each iteration.
6
3-40
In the Properties pane on the right:
a
In the Paper orientation selection list, select Portrait.
b
For the Image size, enter [5 4].
c
In the Scaling selection list, select Zoom.
d
Enter 75 for the % value.
7
Save the report setup file.
8
To test to see if the signal data falls within a specified range, add another Logical
If component:
a
In the Outline pane on the left, select the Scope Snapshot component.
b
In the Library pane in the middle, scroll up to the Logical and Flow
Control category.
c
Double-click the Logical If component.
Add Report Content with Components
9
To test the signal data, replace true in the Test expression text box with the
following in the Properties pane on the right:
max(dynamicX(:,2))>testMin & max(dynamicX(:,2))
10 Save the report.
The Outline pane looks as follows:
11 If this condition is true, the signal data falls within the desired range. Add a
Paragraph component to print information about the signal data in the report.
a
In the Outline pane on the left, select the if component you just added.
b
In the Library pane in the middle, under the Formatting category, double-click
Paragraph so that it becomes a child of the if component.
3-41
3
Creating Simulink Reports
c
In the Properties pane on the right:
i
From the Title Options selection list, select Custom title.
ii
Type Success in the text box.
iii
Enter the following text in the Paragraph text text box.
The conditioned signal has a maximum value
of %<max(dynamicX(:,2))>, which lies in the
desired range of greater than %<testMin> and
less than %<testMax>.
12 To save the success values to insert into a table at the end of the iterations, use an
Evaluate MATLAB Expression component.
a
In the Outline pane on the left, select the Paragraph component.
b
In the Library pane in the middle, under the MATLAB category, double-click
Evaluate MATLAB Expression.
An unintended result occurs: the new component is a child of the Paragraph
component.
c
To make the new component a sibling of the Paragraph component, in the
Outline pane on the left, select the Eval component, and then Click the left
arrow on the toolbar. The Eval component becomes a sibling of the Paragraph
component.
13 In the Properties pane on the right, for the Eval component:
3-42
Add Report Content with Components
a
Clear the Insert MATLAB expression in report and Display command
window output in report check boxes.
b
In the Expression to evaluate in the base workspace text box, enter the
following to save the desired signal values in the expOkValues array:
expOkValues=[expOkValues;...
{Iteration_Value,max(dynamicX(:,2))}];
c
Make sure you select Evaluate this expression if there is an error. Insert
the following text in the text box:
disp(['Error during eval: ', evalException.message])
14 Save the report setup file.
Create a Post-Test Analysis Section
Note: This section builds on the previous tasks described in the step-by-step example
summarized in “Create a Simulink Report Generator Report” on page 3-2.
To see the completed report setup file, open Simulink Dynamic Report. The report is
for the vdp model.
Now that you have collected all the desired values, create the post-test analysis section
by creating a table and inserting it into your report at the end of this chapter.
1
In the Outline pane on the left, select the Model Loop Chapter component.
3-43
3
Creating Simulink Reports
2
In the Library pane in the middle, under the Formatting category, double-click
Chapter/Subsection.
The new section appears at the beginning of the chapter.
3-44
Add Report Content with Components
Click the down arrow three times so Section 1 moves to the end of the Model
Loop Chapter component.
3-45
3
Creating Simulink Reports
3
3-46
In the Properties pane on the right:
a
Select Custom in the Title selection list.
b
Enter Post-Test Analysis in the text box.
4
In the Outline pane on the left, select the new Section 1 component.
5
In the Library pane in the middle, under the Formatting category, double-click
Paragraph. Do not change its properties.
Add Report Content with Components
6
To check whether there are any signal values within the desired range, check the
array expOkValues with a Logical If component. If expOkValues is empty,
there are no signal values in the desired range. Report the result of this check.
a
In the Outline pane on the left, select the Paragraph component and add a
Logical If child component.
b
In the Properties pane on the right, enter the expression to evaluate in the Test
expression text box:
~isempty(expOkValues)
This expression evaluates to 0 (false) if expOkValues is empty; otherwise, it
evaluates to 1 (true).
c
In the Outline pane on the left, select the if(~isempty(expOkValue))
component and add the Logical Else component as a child.
d
Select the if(~isempty(expOkValue)) component again and add the
Logical Then component as a child.
The two components are siblings in the Outline pane on the left.
7
Save the report setup file.
8
Now, insert report components to handle the case where expOkValues is empty;
that is, where no signal values fall within the designated range.
a
In the Outline pane on the left, select the else component.
b
In the Library pane in the middle, double-click the Text component to add it as
a child of the else component.
c
In the Properties pane on the right, in the Text to include in report text box,
enter the following:
None of the selected iteration values had
a maximum signal value between %<testMin> and %<testMax>.
9
Now handle the case where expOkValues is not empty and you want to insert a
table of the acceptable signal values.
3-47
3
Creating Simulink Reports
a
In the Outline pane on the left, select the then component.
b
Add a Text component as a child to the then component.
c
In the Properties pane on the right, in the Text to include in report text box,
enter the following text.
%<size(expOkValues, 1)> values for %<expBlock> were
found that resulted in a maximum signal value greater
than %<testMin> but less than %<testMax>. The following
table shows those values and their resulting signal maximum.
d
In the Outline pane on the left, select the Text component under the then
component of the if(~isempty(expOkValues) component.
10 To create an array for use when formatting the table, use the Evaluate MATLAB
Expression component.
a
In the Library pane in the middle, double-click Evaluate MATLAB
Expression.
b
In the Properties pane on the right:
i
Clear the Insert MATLAB expression in report and Display command
window output in report check boxes.
ii
The next component of the report uses the strings Mu Value and Signal
Maximum as table header values. Add the strings to the front of the
expOkValues cell array by entering the following text into the Expression
to evaluate in the base workspace text box:
expOkValues=[{'Mu Value','Signal Maximum'} expOkValues];
iii
Make sure you select the Evaluate this expression if there is an error
check box. Enter the following text into the text box:
disp(['Error during eval: ', evalExpression.message])
11 In the Outline pane on the left, select the Eval component.
12 In the Library pane in the middle, under the Formatting category, double-click the
Table component so it becomes a sibling of the Text and Eval components.
3-48
Add Report Content with Components
13 In the Properties pane on the right:
a
In the Workspace variable name text box, enter expOkValues. The Simulink
Report Generator software uses the contents of expOkValues to construct the
table.
b
In the Table title text box, enter Valid Iteration Values.
14 Save the report setup file.
The Outline pane on the left looks as follows.
3-49
3
Creating Simulink Reports
3-50
Error Handling for MATLAB Code
Error Handling for MATLAB Code
You can add MATLAB code to a report, by using the Evaluate MATLAB Expression
component (also called the Eval component). See “Add MATLAB Code” on page 3-7 for
details.
The Evaluate MATLAB Expression component dialog box includes an Evaluate this
expression if there is an error check box. The dialog box includes default error
handling code that you can use, or you can create your own error handling code.
If you do not change the default error handling code, then when you generate the report,
and there is an error in the MATLAB code that you added:
• If you clear Evaluate this expression if there is an error check box, then the
complete report is generated, without displaying an error message at the MATLAB
command line.
• If you select Evaluate this expression if there is an error check box, then the
complete report is generated and an error message appears at the MATLAB command
line.
To stop report generation when an error occurs in the MATLAB code that you added,
change the second and third lines of the following default error handling code, as
described below:
warningMessageLevel = 2;
displayWarningMessage = true;
failGenerationWithException = false;
failGenerationWithoutException = false;
To stop report generation and display an exception, change the default code to:
displayWarningMessage = false;
failGenerationWithException = true;
To stop report generation without displaying an exception, change the default code to:
displayWarningMessage = false;
failGenerationWithoutException = true;
If you want to completely replace the default error handling code, use the
evalException.message variable in your code to return information for the exception.
3-51
3
Creating Simulink Reports
Generate the Report
Now the report includes all required components. To generate the report, click the Report
icon on the toolbar. The following occurs:
1
A Message List window appears, displaying informational and error messages as
the report is processed. Specify the level of detail you would like the Message List
window to display while the report is being generated. Options range from 0 (least
detail) to 6(most detail). Click the selection list located under the title bar of the
Message List window to choose an option, as shown in the following figure.
Message level 3 (Important messages) is used for the remainder of this
example.
3-52
Generate the Report
2
The vdp model appears. You can see each time it is simulated.
3
The scope window appears. The scope graph changes each time the parameter value
changes.
4
Each component of the report is highlighted as it executes, in the Outline pane on
the left in the Report Explorer window.
When the report is complete, Adobe Acrobat Reader opens your report in PDF format.
3-53
3
Creating Simulink Reports
3-54
4
Generate a Report
• “Generate a Report” on page 4-2
• “Select Report Generation Options” on page 4-4
• “Report Generation Preferences” on page 4-13
• “Change Report Locale” on page 4-17
• “Convert XML Documents to Different File Formats” on page 4-18
• “Create a Report Log File” on page 4-21
• “Generate MATLAB Code from Report Setup File” on page 4-22
• “Troubleshooting Report Generation Issues” on page 4-25
4
Generate a Report
Generate a Report
In this section...
“Run a Report” on page 4-2
“Report Output Options” on page 4-2
Run a Report
You can generate a Simulink Report Generator report using one of these methods:
• In the Report Explorer Outline pane, select a report and do one of the following
actions:
•
In the Report Explorer toolbar, click the Report button
.
• Press CTL+R.
• Select File > Report.
• From the MATLAB command line, use the report command. For example, to print
the system1_description report in PDF format, use:
report system1_description -fpdf
Report Output Options
Before you generate a report, you can set options to control aspects of report generation
processing such as:
• Output file format (PDF, HTML, or Microsoft Word)
• Stylesheet for the selected output file format, to control the layout of the report (for
example, whether to display a title page, font, and section numbering)
• Output file location
• Whether to view the generated report automatically
For details, see:
• “Report Output Format” on page 4-5
• “Location of Report Output File” on page 4-11
4-2
Generate a Report
• “Create a Report Log File” on page 4-21
• “Report Description” on page 4-12
• “Change Report Locale” on page 4-17
4-3
4
Generate a Report
Select Report Generation Options
In this section...
“Report Options Dialog Box” on page 4-4
“Report Output Format” on page 4-5
“PDF Stylesheets” on page 4-8
“Web Stylesheets” on page 4-8
“RTF (DSSSL Print) and Word Stylesheets” on page 4-9
“Report Generation Processing” on page 4-10
“Location of Report Output File” on page 4-11
“Report Description” on page 4-12
Report Options Dialog Box
To specify report generation options for a specific report, in the Report Explorer, use the
Report Options dialog box.
The Report Options dialog box in the Properties (right hand) pane of the Report Explorer.
4-4
Select Report Generation Options
To set defaults for report generation options that you can override with the Report
Options dialog box or with individual components, use the Report Generator Preferences
pane. For details, see “Report Generation Preferences” on page 4-13.
Report Output Format
In the Report Explorer, in the File format text box, choose the report output format.
Using a template when generating a report provides several benefits, compared to
generating a report without using a template.
• Report generation is faster.
• Report generation does not use Java® memory. Generating reports without using a
template can cause Java to run out of memory.
• You can customize report formatting using standard techniques for specifying Word
and HTML styles.
4-5
4
Generate a Report
File Format Using Report Templates
To use a template for report generation, select one of these options:
• PDF (from template)
• HTML (from template)
• Word (from template)
If you use a template, then from the list of templates, you can specify a template other
than the default template. Each output format that does not use a template has a default
stylesheet associated with it. Specify the stylesheet in the text box next to the File
format text box.
For more information about using templates for report generation, see “Generate a
Report Using a Template”.
File Format Using Report Explorer Stylesheets
If you do not use a template, then you can specify in the Stylesheet field, you can specify
a stylesheet.
Viewer
Format
Description
Stylesheets
Adobe Acrobat
Reader
Adobe Acrobat
(PDF)
Produce a PDF that PDF (see “PDF
you can view using Stylesheets”)
Adobe Acrobat
Reader software.
See “PDF: Image
Formats” on page
4-7.
Word processor
Word Document
(RTF) or Rich
Text Format
Produce output
Print (see “RTF (DSSSL
that is compatible
Print) and Word
with most wordStylesheets”)
processing
packages, including
Microsoft Word
software
See “RTF: Display
of Hidden Content”
on page 4-7.
4-6
Select Report Generation Options
Viewer
Format
Description
Stylesheets
DocBook
DocBook (no
transform)
Produce a report in
DocBook format
N/A
Tip To create and use customized styles, see “Create a New Stylesheet”.
PDF: Image Formats
PDF reports only support bitmap (.bmp), .jpeg (.jpg), and Scalable Vector Graphics
(.svg).
The SVG format is only supported for Simulink models and Stateflow charts. For
example, MATLAB figures do not display in SVG when you select the SVG format for
PDF reports.
RTF: Display of Hidden Content
RTF reports use placeholders (field codes) for dynamically generated content, such as
page numbers or images.
On Windows platforms, to display that content, press Ctrl-A, and then press F9.
On Linux and Mac platforms, use the field code update interface for the program that
you are using to view the RTF document.
Change the Default Output Format
In the Report Generator Preferences pane, use the Format ID preference to specify the
default output format for reports.
Stylesheets
For each output format, you can choose from several stylesheets for each report output
format. For details, see:
• “PDF Stylesheets” on page 4-8
• “Web Stylesheets” on page 4-8
• “RTF (DSSSL Print) and Word Stylesheets” on page 4-9
4-7
4
Generate a Report
Note: Some Web and Print stylesheets include an automatically generated list of titles,
which includes table titles and figures with titles.
PDF Stylesheets
PDF Stylesheet
Description
Default print
stylesheet
Displays title page, table of contents, list of titles
Standard Print
Displays title page, table of contents, list of titles
Simple Print
Suppresses title page, table of contents, list of titles
Compact Simple Print
Minimizes page count, suppresses title, table of contents,
list of titles
Large Type Print
Uses 12-point font (slightly larger than Standard Print)
Very Large Type Print
Uses 24-point font and landscape paper orientation
Compact Print
Minimizes white space to reduce page count
Unnumbered Chapters &
Sections
Uses unnumbered chapters and sections
Numbered Chapters &
Sections
Numbers chapters and sections
Paginated Sections
Prints sections with page breaks
Custom Header
Lets you specify custom headers and footers
Custom Titlepage
Lets you specify custom title page content and
presentation
Verbose Print
Lets you specify advanced print options
Web Stylesheets
4-8
Web Stylesheet
Description
Default HTML stylesheet
HTML on a single page
Simulink book HTML
stylesheet
HTML on multiple pages; suppresses chapter headings
and table of contents
Select Report Generation Options
Web Stylesheet
Description
Truth Table HTML
stylesheet
HTML on multiple pages; suppresses chapter headings
and table of contents
Multi-page Web
HTML, with each chapter on a separate page
Single-page Web
HTML on a single page
Single-page Unnumbered
Chapters & Sections
HTML on a single page; chapters and sections are not
numbered
Single-page Numbered
Chapters & Sections
HTML on a single page; chapters and sections are
numbered
Single-page Simple
HTML on a single page; suppresses title page and table
of contents
Multi-page Simple
HTML on multiple pages; suppresses title page and
table of contents
Multi-page Unnumbered
Chapters & Sections
HTML on multiple pages; chapters and sections are not
numbered
Multi-page Numbered
Chapters & Sections
HTML on multiple pages; chapters and sections are
numbered
RTF (DSSSL Print) and Word Stylesheets
RTF or Word Stylesheet
Description
Standard Print
Displays title page, table of contents, list of titles
Simple Print
Suppresses title page, table of contents, list of titles
Compact Simple Print
Minimizes page count, suppresses title, table of contents,
list of titles
Large Type Print
Uses 12-point font (slightly larger than Standard Print)
Very Large Type Print
Uses 24-point font and landscape paper orientation
Compact Print
Minimizes white space to reduce page count
Unnumbered Chapters &
Sections
Uses unnumbered chapters and sections
Numbered Chapters &
Sections
Numbers chapters and sections
4-9
4
Generate a Report
Report Generation Processing
The Report Options dialog box includes several options for controlling report processing.
Option
Purpose
View report after
generation
View the report automatically. When report generation
finishes, the viewer associated with the report output
format displays the report.
Note: On Linux and Macintosh platforms, the report
output displays in Apache OpenOffice, which must be
installed in /Applications/OpenOffice.app.
To view the report manually, browse to the location
specified in the Report File Location section in the
Properties pane on the right, and open the file.
Auto save before
generation
Automatically save the report setup file before you
generate a report.
Compile model to report
on compiled information
Ensure that a report reflects compiled values.
By default, the Simulink Report Generator reports
uncompiled values of Simulink parameters. The
uncompiled values of some parameters, such as signal
data types, can differ from the compiled values used
during simulation.
This option causes the report generator to compile a
model before reporting on model parameters. After
generating the report, the report generator returns the
model to its uncompiled state.
Note: When you select this option, whenever report
generation requires simulating the model (for example,
the report includes a Model Simulation component),
the report generator uncompiles the model and then
recompiles the model, if necessary, to report on model
4-10
Select Report Generation Options
Option
Purpose
contents. If a report requires multiple compilations, the
processing can be quite time-consuming.
To minimize compilations, consider using separate
reports to report on the contents of a model and on the
results of simulating that model.
Evaluate this string after
generation
Specify MATLAB code for processing to occur after the
report is generated. For example, you could specify to
close a model.
Location of Report Output File
Choose a folder to store the report file. You must have write privileges for that folder.
Folder
In the Report Explorer, in the Report Options dialog box, use the Directory field to
specify the name of the folder in which to store the generated report file. Specify a folder
to which you have write privileges.
The following table summarizes the report file location options.
Folder
Option
The same folder as the report Same as setup file
setup file
The current working folder
Present working directory
Temporary folder
Temporary directory
Another folder
Custom.
Use the Browse button (...) to select from a list of
directories.
You can use %<VariableName> notation to specify a folder in the Custom text box. For
more information, see “%<VariableName> Notation” on the Text component reference
page.
4-11
4
Generate a Report
Report File Name
In the Report Explorer, in the Report Options dialog box, use the Filename field to
specify a file name for the report file. Select one of the following options.
File Name
Option
The same file name as the report
setup file
Same as setup file (default)
A file name different from the report Custom.
setup file name
Enter the name of the report.
You can use %<VariableName> notation to specify a file name in the Custom text
box. For more information, see “%<VariableName> Notation” on the Text component
reference page.
Increment to Prevent Overwriting
To maintain the previous version of the setup file when you save updates to the setup
file, select If report already exists, increment to prevent overwriting.
Image Output File Location
Images are placed in a folder with the same name as the report file. For example,
testreport.html images are placed in a folder named testreport_files.
Report Description
To record notes and comments about your report setup, use the Report Description
field. This text that you enter appears in the Properties pane when you select a report
setup file in the Outline pane.
4-12
Report Generation Preferences
Report Generation Preferences
In this section...
“Report Generator Preferences Pane” on page 4-13
“File Format and Extension” on page 4-14
“Image Formats” on page 4-15
“Report Viewing” on page 4-15
“Reset to Defaults” on page 4-16
Report Generator Preferences Pane
To set defaults for report generation options, use the Report Generator Preferences pane.
You can override these preferences with the Report Options dialog box or with individual
components.
To specify report generation options for a specific report, in the Report Explorer, use the
Report Options dialog box. For details, see “Select Report Generation Options” on page
4-4.
To open the Report Generator Preferences pane, use one of these approaches:
• In the Report Explorer, select File > Preferences.
• From the MATLAB Toolstrip, in the Home tab, in the Environment section, select
Preferences > Report Generator.
4-13
4
Generate a Report
File Format and Extension
To specify the default file format for reports, use the Format ID preference. The default
preference is web (HTML). You can select from a range of file formats, such as PDF,
Microsoft Word, or LaTex.
Note: For reports that use the Word Document format, you must have Microsoft Word
installed on the machine that you use to generate the report.
4-14
Report Generation Preferences
The Extension preference reflects the standard file extension for the file format
specified with the Format ID preference. You can change the extension.
Image Formats
To set the default image formats associated with the output format for a report, use the
following preferences.
Preference
Purpose
Simulink Images
Specify the format for Simulink images to include in the
report.
Stateflow Images
Specify the format for Stateflow charts to include in the
report.
HG Images
Specify the format for Handle Graphics images to
include in the report.
Note: The default preferences for image formats should work in most viewing
environments. However, some image formats do not display in some viewing
environments.
Several components, such as the Figure Snapshot component, include an option
for specifying the image format. The component setting overrides the image format
preference.
Report Viewing
To control how you view a generated report, you can set the following preferences.
Preference
Purpose
View command
Specify the MATLAB command you want to use to view
the report.
Each file format has an associated default view
command preference. You can modify the view command
(for example, to support the use of a system browser).
4-15
4
Generate a Report
Preference
Purpose
Visible in Report
Explorer
Deselect this check box to make the current output
format unavailable in the Report Explorer. For example,
if your specified report format is Word document and
you deselect this check box, then the Microsoft Word
document format is no longer available for reports
created using the Report Explorer.
Animate Report Explorer Select this check box if you want components in the
when generating reports Outline pane to be animated as the report generates.
This box is selected by default.
To speed up the report generation processing, consider
clearing this preference.
Reset to Defaults
To reset all of the preferences in the Output Format Options section of the Report
Generator Preferences pane, click Reset to Defaults.
The Reset to Defaults button does not change the Animate Report Explorer when
generating reports preference.
4-16
Change Report Locale
Change Report Locale
Versions 2.0 and later of the MATLAB Report Generator and Simulink Report Generator
software use the locale (system language settings) through the Oracle® Java interface;
therefore, they should use the language specified on your system.
Alternatively, you can change the language directly in Java from the MATLAB command
line. The following example sets the language to Italian:
java.util.Locale.setDefault(java.util.Locale.ITALY)
Alternatively, you can set the preferred language directly in your .rpt file:
1
Right-click the Report component and select Send to Workspace.
This displays the properties of the report, which are stored in the variable ans.
Access the report's Language property from the command line through this variable.
By default, Language is auto, which indicates that the system's default language is
in use.
2
Override the default value of Language by setting this property to your desired
language; for example, en for English or it for Italian.
4-17
4
Generate a Report
Convert XML Documents to Different File Formats
In this section...
“Why Convert XML Documents?” on page 4-18
“Convert XML Documents Using the Report Explorer” on page 4-18
“Convert XML Documents Using the Command Line” on page 4-20
“Edit XML Source Files” on page 4-20
Why Convert XML Documents?
You can generate a report in a different output file format without regenerating it by
using either the Report Explorer File Converter or the rptconvert command. These
utilities convert DocBook XML source files created by the report-generation process into
formatted documents such as HTML, RTF, or PDF.
Note: The report-generation process can only convert XML source files created by the
latest version of the software.
Convert XML Documents Using the Report Explorer
To open the Convert Properties pane:
1
In the Report Explorer, select Tools > Convert source file.
The Convert Source File Properties pane appears. All XML files in your current
folder appear in the Options pane in the middle.
4-18
Convert XML Documents to Different File Formats
2
Select your XML source file using one of the following options:
• Click Browse in the Properties pane on the right to browse to the location of your
XML source.
• Double-click a file name in the Options pane in the middle to automatically enter
it into the Source file field in the Properties pane.
3
Select your output format and stylesheet:
a
In the File format text box, select an output format.
b
In the Stylesheet text box, select a stylesheet. The stylesheet choice depends on
the specified output format. You can use a predefined or customized stylesheet.
For more information about available formats and predefined stylesheets, see
“Report Output Format”.
4-19
4
Generate a Report
For more information about customizing stylesheets, see “Create a New
Stylesheet”.
4
Use the View Report when done converting check box to indicate whether you
want to view the report after it has conversion.
5
To begin the conversion, click Convert file.
Convert XML Documents Using the Command Line
To convert files using the command line, use the rptconvertfunction.
Edit XML Source Files
Before you send a source file to the converter, edit it as text in the Report Explorer:
4-20
1
In the Outline pane on the left, open the File Converter.
2
Right-click MATLAB Report Generator and select Convert source file.
3
In the Options pane in the middle, select the source file to edit.
4
In the Properties pane on the right, click Edit as text.
5
Use the MATLAB Editor to edit and save the text.
Create a Report Log File
Create a Report Log File
A log file describes the report setup file report-generation settings and components. A log
file can be used for many purposes, including:
• As a debugger
• As a reference to a report setup file
• To share information about a report setup file through email
A log file includes the following information:
• Report setup file outline
• Components and their attributes
• Generation status messages currently displayed in the Generation Status tab
To generate a log file, click File > Log File. An HTML version of the log file with the
name <report_template_file_name_log>.html is saved in the same folder as the
report setup file.
4-21
4
Generate a Report
Generate MATLAB Code from Report Setup File
You can generate MATLAB code versions of report setup files in the form of a MATLAB
file (*.m). A MATLAB file of a report setup file is useful for various purposes, including
generating reports and modifying report setup files programmatically.
To generate a MATLAB file, load a report setup file into the Report Explorer and click
File > Generate MATLAB File. After the MATLAB file generates, it opens in the
MATLAB Editor. The filename for the generated file is the file name of the report setup
file , preceded by “build.”
Generate Reports from MATLAB Files
This example generates a MATLAB file from the figloop_tutorial.rpt report setup
file, which is part of the MATLAB Report Generator software. The example then uses the
report function to generate a report from the MATLAB file. For more information about
this function, see the report reference page.
1
Start the Report Explorer by entering report in the MATLAB Command Window.
2
In the Options pane in the middle, double-click figloop_tutorial.rpt to open its
report setup file.
3
In the Outline pane on the left, click Report - figloop_tutorial.rpt to select
it.
4
In the Report Explorer menu bar, click File > Generate MATLAB File.
The MATLAB Report Generator software generates MATLAB code for
the figloop_tutorial.rpt report setup file. It saves this code in the
buildfigloop_tutorial.m file in the folder you specify. Part of this file appears
in the following figure.
4-22
Generate MATLAB Code from Report Setup File
5
To generate the figloop_tutorial report from this MATLAB file, run the
following command in the MATLAB Command Window:
report(buildfigloop_tutorial);
The MATLAB Report Generator software runs and displays the report.
4-23
4
Generate a Report
4-24
Troubleshooting Report Generation Issues
Troubleshooting Report Generation Issues
In this section...
“Memory Usage” on page 4-25
“HTML Report Display on UNIX Systems” on page 4-25
Memory Usage
By default, the MATLAB software sets a limit of 100 MB on the amount of memory the
Oracle Java Virtual Machine (JVM™) software can allocate. The memory that the report
generation process uses to build a document must fit within this limit. If you are having
trouble processing large reports, it might be helpful to increase the amount of memory
that MATLAB Report Generator and Simulink Report Generator software can allocate.
See the following sections for more information.
Run the MATLAB Software Without a Desktop
One way to increase the amount of JVM memory available to the MATLAB Report
Generator and Simulink Report Generator software is to run the MATLAB software with
-nodesktop mode enabled.
Increase the MATLAB JVM Memory Allocation Limit
To increase the amount of JVM memory available by increasing the MATLAB JVM
memory allocation limit, from the MATLAB Toolstrip, in the Home tab, in the
Environment section, select Preferences. Use the General > Java Heap Memory
dialog box.
HTML Report Display on UNIX Systems
HTML reports may not automatically display on some UNIX® platforms. To work around
this issue, configure the MATLAB Report Generator software to launch an external
browser:
1
In the Report Explorer, click File > Preferences.
2
Enter the following text in the View command field:
web(rptgen.file2urn('%file name'), '-browser')
Where file name is the name of your report setup file.
4-25
5
Export Simulink Models to Web Views
• “Web Views” on page 5-2
• “Export Models to Web View Files” on page 5-4
• “Display and Navigate a Web View” on page 5-6
• “Search a Web View” on page 5-10
• “Create and Use a Web View” on page 5-13
• “Optional Web Views” on page 5-20
• “Capture and View Optional Web View Information” on page 5-21
5
Export Simulink Models to Web Views
Web Views
What Is a Web View?
A Web view is an interactive rendition of a model that you can view in a Web browser.
You can use Web views to navigate hierarchically to specific subsystems and see
properties of blocks and signals. Web views provide a simple way to interactively explore
a model. For example, you can view block parameter values without opening a block
parameter dialog box.
Use Web views to share models with people who do not have Simulink installed.
You can save Web views of a model over time, creating snapshots of the model as it
changes during the development process.
System Requirements
Although you use Simulink Report Generator software to create Web views. you can
display a Web view in a browser, even if you do not have Simulink Report Generator
installed.
By default, when you export a Web view, that Web view automatically displays in your
default Web browser. Web views require a Web browser that supports SVG natively.
Web View Files
By default, exporting a Web view creates a zip file that includes the Web view HTML file,
as well as files that support Web view display. Supporting files include files include .svg
and .png files. Zip file packaging compresses the files and consolidates the Web view and
supporting files into one zip file.
You can choose to export the Web view files as the Web view HTML file and the
supporting files, in a folder, without being zipped. You can open the Web view HTML file
directly, without having to open a non-zipped file. You can also choose to export the Web
view files as both a zip file and as non-zipped files.
The default name of the zip file or folder that contains the non-zipped Web view files is
the name of the model that contains the systems to export. You can specify a different file
or folder name.
5-2
Web Views
The default location for storing Web view files is the MATLAB current folder. You can
choose a different folder.
If you send Web view files to someone else, consider whether you need to explain how to
access the Web view file.
Related Examples
•
“Export Models to Web View Files” on page 5-4
•
“Display and Navigate a Web View” on page 5-6
•
“Create and Use a Web View” on page 5-13
More About
•
“Optional Web Views” on page 5-20
5-3
5
Export Simulink Models to Web Views
Export Models to Web View Files
In this section...
“Open the Web View Dialog Box” on page 5-4
“Export a Model to a Web View” on page 5-4
Open the Web View Dialog Box
To export a Web view, use the Web View dialog box. The way you access the dialog box
differs, depending on whether you are using the Simulink Editor or the Report Explorer.
You can also open the dialog box from the command line.
Interface
What You Do
Simulink Editor
Select File > Export Model to > Web.
Report Explorer
Select Tools > Export Simulink to Web.
Command line
Use the slwebview function without arguments.
Export a Model to a Web View
1
Open the model to export.
2
In the Simulink Editor, select File > Export Model to > Web.
3
In Systems to Export, select the levels of the model to export, in relationship to the
system currently displayed or chart currently selected in the Simulink Editor.
4
For the systems in the levels that you are exporting, in Include Options, select
any kinds of systems you want the Web viewer user to be able to navigate below the
Subsystem or Model block, to the underlying blocks or models.
If you select more than one kind of system, the criteria for exporting information
for interacting with the contents of the systems are applied downward through the
model hierarchy. For example, if you left Referenced Models unchecked when
you exported the model, regardless of how you set the Library Links option, in the
Web view you cannot interact with a library link block that is inside of a referenced
model.
5
5-4
In the Systems to Exclude list of the systems you have selected to export, select
any systems that you do not want to export. To select multiple systems, press the
Ctrl key and select systems.
Export Models to Web View Files
6
To avoid overwriting existing exported Web view files, select If file exists,
increment name to prevent overwriting.
7
In Package Type, specify whether you want to package the Web view as a zipped
file (the default packaging). In Package name, you can specify a name for the zip
file or for the folder for the Web view files.
8
Click Export.
Note: If you use the Web View export option in the Report Explorer Properties pane,
then click Export model. If you change the visible system or chart while the Report
Explorer Web View pane is visible, the pane does not automatically change to show
information about the newly visible system. To update the Web View pane, click
Refresh.
9
If you have Simulink Verification and Validation installed, you can use the
Optional Views tab to select Model Coverage or Requirements, or both, to
export the associated kind of information.
See Also
Functions
slwebview
Related Examples
•
“Display and Navigate a Web View” on page 5-6
•
“Create and Use a Web View” on page 5-13
More About
•
“Web Views” on page 5-2
•
“Web View Files” on page 5-2
•
“Optional Web Views” on page 5-20
5-5
5
Export Simulink Models to Web Views
Display and Navigate a Web View
In this section...
“Display a Web View When You Export It” on page 5-6
“Open a Web View File in a Web Browser” on page 5-6
“View Contents of a System” on page 5-7
“View Block Parameters and Signal Properties” on page 5-8
“Access Optional Web View Information” on page 5-9
Display a Web View When You Export It
When you export a Web view using the Web View dialog box or from the Report Explorer
Web View pane, the Web view appears in your system Web browser.
Open a Web View File in a Web Browser
To open a Web view file to display in a Web browser, from the folder that contains the
Web view files, select the HTML file.
5-6
Display and Navigate a Web View
Open the webview.html file to display the Web view. For details about file packaging
and location, see “Web View Files” on page 5-2.
To use a Google® Chrome Browser, you need to do some setup.
Open a Web View in a Google Chrome Browser on a Windows Platform
1
If you do not already have a shortcut set up for Google Chrome, click the Windows
Start button and search for Chrome.
2
Right-click and drag the Google Chrome icon to an open area on your desktop.
3
Right-click the icon and select Create shortcut.
4
Right-click the shortcut and select Properties.
5
In the Target edit box, append the following text: --allow-file-access-fromfiles. Be sure to use two hyphens at the beginning. Click OK.
6
Close all open Google Chrome browsers.
7
Use the shortcut to open a Google Chrome browser.
8
Open the Web view file.
Open a Web View in a Google Chrome Browser on a Macintosh Platform
1
Run Terminal. You can find it using Spotlight, in Applications/Utilities.
2
Enter the following text:
open/Applications Google\Chrome.app --allow-file-access-from-files
Open a Web View in a Google Chrome Browser on a Linux Platform
1
Run terminal.
2
Enter the following text:
./chromium-browser --allow-file-access-from-files
View Contents of a System
To see a thumbnail of the contents of all of systems in the Web view, click the View All
tab.
5-7
5
Export Simulink Models to Web Views
To view the contents of a specific system, use one of these approaches:
• In the model viewer, double-click the system.
• In the model browser, select a system. To expose this pane, click Hide/Show Model
Browser
.
• Click the View All tab and click the thumbnail of a system.
To open a system in a separate tab, press CTRL and click the system.
View Block Parameters and Signal Properties
Click a block or signal in the model to see its parameters or properties in the Object
Inspector pane.
5-8
Display and Navigate a Web View
Access Optional Web View Information
To view the model coverage or requirements optional Web view information in a Web
view, you must have Simulink Verification and Validation installed. To access the
information, click a highlighted block (for example, blocks with an orange border have
requirements information). The information for that block appears in the Informer pane
below the model.
See Also
Functions
slwebview
Related Examples
•
“Create and Use a Web View” on page 5-13
More About
•
“Web Views” on page 5-2
•
“Web View Files” on page 5-2
•
“Optional Web Views” on page 5-20
5-9
5
Export Simulink Models to Web Views
Search a Web View
In this section...
“Perform a Search” on page 5-10
“Sort Search Results” on page 5-12
“Navigate Between Search Results and Model Elements” on page 5-12
Perform a Search
1
2
In a Web View, at the top of the displayed tab, click the search button
.
In the search box, enter the search term.
Search strings are case-insensitive. The search treats the string as a partial string.
3
To specify search criteria, click the search criteria button and select the types of
model element you want to search in.
4
Press Enter.
The elements of the model that the search returns appear highlighted. The search results
include the name and parent for each returned element.
5-10
Search a Web View
5-11
5
Export Simulink Models to Web Views
Sort Search Results
You can sort the search results in alphabetical order. In the search results table, click the
Name or Parent column.
Navigate Between Search Results and Model Elements
To see the corresponding search result for a highlighted model element, click the
element.
To highlight the model element for a search result, click the search result.
The Object Inspector pane to the right of the model updates to reflect the selected
model element or search result.
5-12
Create and Use a Web View
Create and Use a Web View
In this section...
“About This Tutorial” on page 5-13
“Export Specific Systems” on page 5-13
“Navigate the Web View” on page 5-15
“Display Parameters and Properties of Blocks and Signals” on page 5-16
“Open the Web View” on page 5-18
About This Tutorial
This tutorial takes you through the steps to export a Simulink model to a Web view.
You create a Web view from the Simulink model window using the
sldemo_auto_climatecontrol model, which is provided with the Simulink software.
This model simulates the working of an automatic climate control system in a car.
Export Specific Systems
When you create the Web view, you can specify export options.
1
At the MATLAB command prompt, enter sldemo_auto_climatecontrol to open
the Simulink model.
2
In the Simulink Editor, select File > Export Model to > Web.
5-13
5
Export Simulink Models to Web Views
3
In the Include Options, select Masked Subsystems. This enables users of the
Web view to interact with masked blocks.
4
In Systems to Exclude, select Temperature Control Chart.
5
Use the Folder edit box to specify climate_control_webview as the name for the
zip file for the exported Web view files.
6
Select the If file exists, increment name to prevent overwriting check box.
Selecting this option prevents overwriting the Web view files if you export multiple
Web views from the same model.
7
Click Export.
Exporting the selected systems to a Web view creates several support files, as well as an
HTML file for displaying the systems. In this example, you change the defaults for the
naming of the files.
5-14
Create and Use a Web View
The Web view files are exported, and the Web view appears in a Web browser.
The Temperature Control Chart appears in the top level of the model, but you cannot
open that chart in the Web view to see its contents.
Navigate the Web View
By default, if you export a whole model to a Web view, the Model Viewer pane shows
the whole model. You can display specific systems in the Web view. For example:
1
In the model viewer, double-click the AC Control subsystem.
5-15
5
Export Simulink Models to Web Views
The AC Control subsystem appears in the model viewer. The tab label reflects the
name of the currently displayed subsystem.
2
Open the model browser (hidden by default). Click Hide/Show Model Browser
3
Open another system, in a separate tab. In the model browser, CTRL+click select
the Heater Control system.
4
Drag the AC Control system to the top of model viewer. Place the cursor in the
display area, hold down the mouse scroll wheel, and drag.
5
Zoom the display with the mouse scroll wheel.
.
Display Parameters and Properties of Blocks and Signals
5-16
1
In the model browser, select sldemo_auto_climatecontrol.
2
Double-click the AC Control subsystem.
3
Click the Temp/enthalpy block to view the block parameter values. The Object
Inspector pane groups the block parameters by the block parameter dialog box tabs.
Create and Use a Web View
4
Click the input signal for the Exit Temp (AC) block to display the signal properties.
5-17
5
Export Simulink Models to Web Views
Try navigating to other parts of the Web view.
5
Close the Web view.
Open the Web View
In the MATLAB current folder (or wherever you saved the zip file when you
performed the steps in “Export Specific Systems” on page 5-13), extract the
climate_control_webview zip file contents and open the webview.html file.
5-18
Create and Use a Web View
Related Examples
•
“Export Models to Web View Files” on page 5-4
•
“Display and Navigate a Web View” on page 5-6
More About
•
“Web Views” on page 5-2
5-19
5
Export Simulink Models to Web Views
Optional Web Views
Optional Web views provide information about a model in addition to the standard Web
view information about blocks and signals in a model.
The Simulink Report Generator includes the following optional Web views that you can
capture and view if you have Simulink Verification and Validation installed:
• Requirements
• Model coverage
These optional views display requirements or model coverage information associated
with the current Web view.
To include model coverage information in a Web view, set up a coverage report for the
model and simulate the model before selecting the model coverage optional view option.
Related Examples
•
“Capture and View Optional Web View Information” on page 5-21
•
“Export Models to Web View Files” on page 5-4
More About
•
5-20
“Optional Web Views” on page 5-20
Capture and View Optional Web View Information
Capture and View Optional Web View Information
In this section...
“Capture Optional Web View Information for a Model” on page 5-21
“View Optional Web View Information” on page 5-21
Capture Optional Web View Information for a Model
When you create a Web view, you can include optional Web view information.
To add the model coverage or requirements optional view information to a Web view for a
model, you must have Simulink Verification and Validation installed.
1
In the Web View dialog box, open the Optional Views tab.
2
Select each optional view (for example, Model Coverage or Requirements) that
you want to capture the associated information for.
Tip The Optional Views tab appears only if you can access an optional Web view.
Alternatively, in the Simulink Editor, click Analysis > Requirements Traceability >
Generate Web View.
View Optional Web View Information
To view the model coverage or requirements optional Web view information in a Web
view, you must have Simulink Verification and Validation installed.
In a Web view, click a highlighted block (for example, blocks with an orange border have
requirements information). The information for that block appears in the Informer pane
below the model.
Related Examples
•
“Export Models to Web View Files” on page 5-4
More About
•
“Optional Web Views” on page 5-20
5-21
6
Add Content with Components
• “Components” on page 6-2
• “Report Structure Components” on page 6-4
• “Table Formatting Components” on page 6-5
• “Property Table Components” on page 6-6
• “Summary Table Components” on page 6-17
• “Logical and Looping Components” on page 6-21
• “Filter with Loop Context Functions” on page 6-22
• “Loop Context Functions” on page 6-24
• “Edit Figure Loop Components” on page 6-25
6
Add Content with Components
Components
Components are MATLAB objects that specify the content of a report. Add components
to specify the types of content that commonly occur in reports. The MATLAB Report
Generator provides a set of components for specifying the types of content that commonly
occur in MATLAB-based reports. The Simulink Report Generator provides additional
components to facilitate generation of reports from Simulink models. You can also create
custom components to handle content specific to your application.
Using the Report Explorer, you can interactively combine components to create a report
setup that specifies the content of a particular report or type of report. For general
information about working with components, see:
• “Insert Components”
• “Set Component Properties”
Use a combination of the following types of components in your report setup file, based on
your goals for the report.
Type of Component
Description
“Report Structure Components” on page
6-4
Include a title page, chapters, sections,
paragraphs, lists, tables, and other
standard document structure elements.
“Table Formatting Components” on page
6-5
Organize generated content into tables.
“Property Table Components” on page
6-6
Display tables with property name/
property value pairs for objects.
“Summary Table Components” on page
6-17
Display tables with specified properties for
objects.
“Logical and Looping Components” on page Run child components a specified number
6-21
of times. There are several looping
components, including logical loops and
Handle Graphics loops.
6-2
Components
Component Formatting
When you generate a report, in the Report Options dialog box, in the File format field
you specify the type of report output you want. For example, you can generate a report in
PDF, HTML, or Microsoft Word format.
For each format, you can choose to apply styles from either of these style definition
sources:
• An HTML or Word report conversion template
• A Model Explorer stylesheet for HTML, Word, or PDF.
The output format and the associated template or stylesheet that you select for a report
determines most aspects of the formatting of the generated report. For example, a report
template or stylesheet typically uses different font sizes for chapter titles and section
titles. For details, see “Report Output Format”.
Several components include properties that you can set to specify formatting details for
that specific instance of a component. For example, for the MATLAB Property Table,
you can specify formatting such as whether to display table borders or the alignment of
text in table cells.
6-3
6
Add Content with Components
Report Structure Components
Use report structure components to organize the content of your report into chapters,
sections, paragraphs, lists, tables, and other standard document structure elements. The
following table summarizes the report structure components.
6-4
Component
Usage
Title Page
Generate a title page for a report.
Chapter/Subsection
Parent components that generate the content of a chapter or
chapter subsection.
Paragraph
Specify the content and text format of a paragraph of text. Can
serve as the parent of one or more text components, enabling use
of multiple text formats (for example, bold, regular, or italic) in
the same paragraph.
Text
Format strings of generated text.
List
Generate a list from a cell array of numbers or strings or parent
components (for example, Paragraph components) that specify the
items in a list. You can create multilevel lists by embedding list
components within list components.
Link
Generate a hyperlink from one location in a report to another or
to an external location on the user’s file system or the Worldwide
Web.
Image
Insert an image into a report.
Array-Based Table
Generate a table from a cell array of numbers or strings.
Table
Parent a table body component. See “Table Formatting
Components”.
Table Formatting Components
Table Formatting Components
Use table formatting components to organize generated content into tables. The following
table summarizes the table formatting components.
Component
Usage
Table
Parent a table body component. Can also parent column
specification components and a table header and a table
footer component. Specifies properties of the table as a whole
(for example, its title, number of columns, and border).
Table Body
Parent the rows that make up the table body. Specifies the
default vertical alignment of entries in a table body.
Table Column
Specification
Specify attributes of a table column, such as its width and
borders and the default horizontal alignment of column
entries.
Table Entry
Parent a component that determines a table entry’s content,
such as a paragraph, image, list, or another table component.
Specifies attributes of a table entry, such as the number of
rows and columns that it spans.
Table Footer
Parent the row components that generate the content of a
table footer.
Table Header
Parent the row components that generate the content of a
table header.
Table Row
Parent the table entry components that generate the content
of a table row.
Tip Inserting a Table component into a setup also inserts all the descendant components
required to generate a 2x2 table, creating a table template. Edit this template to create a
table that suits your needs.
6-5
6
Add Content with Components
Property Table Components
In this section...
“About Property Table Components” on page 6-6
“Open the Example Report Template” on page 6-8
“Examine the Property Table Output” on page 6-8
“Select Object Types” on page 6-9
“Display Property Name/Property Value Pairs” on page 6-9
“Edit Table Titles” on page 6-12
“Enter Text into Table Cells” on page 6-12
“Add, Replace, and Delete Properties in Tables” on page 6-13
“Format Table Columns, Rows, and Cells” on page 6-14
“Zoom and Scroll” on page 6-16
“Select a Table” on page 6-16
About Property Table Components
Property Table components display property name/property value pairs for objects in
tables. The following example shows a property table from the figloop-tutorial
report.
6-6
Property Table Components
Many types of property table components are available, including:
• MATLAB Property Table
• Simulink Property Table (requires Simulink Report Generator)
• Stateflow Property Table (requires Simulink Report Generator)
The component used in this example represents MATLAB Report Generator property
table components, all of which exhibit similar behavior.
6-7
6
Add Content with Components
Open the Example Report Template
This example uses the figloop-tutorial report template. To open the figure loop
tutorial report template, at the MATLAB command line enter:
setedit figloop-tutorial
Examine the Property Table Output
Property pages for all property table components are similar in form. In the Outline
pane, select the Figure Prop Table component. To modify table settings, in the
Handle Graphics Property Table dialog box, click the Edit... button.
6-8
Property Table Components
Select Object Types
Property table components offer multiple object types on which to report. For example,
the Handle Graphics Property Table lets you report on a figure, an axes object, or a
Handle Graphics object.
You can select a different object type on which to report in the Object type list in the
Properties pane for the component.
Display Property Name/Property Value Pairs
Split Property/Value Cells
1
In the Properties pane for the Handle Graphics Property Table component, clear the
Split property/value cells check box.
2
Click Edit. The table is now in nonsplit mode. Nonsplit mode supports more than
one property name/property value pair per cell and text.
3
For the property name and property value to appear in adjacent horizontal cells
in the table, select the Split property/value cells check box. The table is now in
6-9
6
Add Content with Components
split mode. Split mode supports only one property name/property value pair per cell.
If more than one property pair appears in a cell, only the first pair appears in the
report; all subsequent pairs are ignored.
Display Options
Property name/property value pairs can appear in cells in several ways. To specify how
a given property name/property value pair appears in a cell, select that field in the table
(for this tutorial, select the Name property). Choose Value from the display options
drop-down list at the bottom of the dialog box. In the selected table row, only the value
appears.
6-10
Property Table Components
Format Options
To specify alignment for text in a given cell, in the toolbar at the bottom of the dialog box
use the four justification buttons.
Select the HandleVisibility table row. Then select the double-justify button (the last
button to the right).
6-11
6
Add Content with Components
Edit Table Titles
Table titles can contain properties and text. By default, the title of a table is the same as
the value of the %<Name> property. You can modify this property to modify the table title.
Note: Table titles are always in nonsplit mode.
Enter Text into Table Cells
For the text to be visible, the table must be in nonsplit mode. Clear Split property/
value cells.
To enter text into the HandleVisibility table cell, double-click the cell. A gray box
appears with the label for the cell property.
6-12
Property Table Components
If you type text outside the angle brackets, the text appears as is in the report. Text
inside the table brackets must specify a valid property name. If you enter an invalid
property name, the property name appears in the report without a property value.
Add, Replace, and Delete Properties in Tables
Adding Table Properties
To add a Handle Graphics property to a table, use the following steps.
1
In the Figure Property Table window, select a table row above which you want add a
new property.
2
Click the Add Row Above Current Cell
button
A new row appears above the current row.
3
Add the property to the new table row.
a
Select the new table row.
6-13
6
Add Content with Components
b
In the Properties Type drop-down list at the upper-right of the dialog box, select
a property type.
c
In the Properties list, select the property you want to add.
d
Click the << Add button, or double-click the property name. The property
appears in the table row.
Alternatively, if you know the name of the property you want to add, enter the
property name directly into the cell as described in “Enter Text into Table Cells”. For
information about adding new table rows, see “Add and Delete Columns and Rows”.
Replace Table Properties
To replace a property in a cell of a table in split mode, follow the instructions in “Adding
Table Properties” on page 6-13.
Note: You cannot use these steps to delete a property in a cell when the table is in
nonsplit mode.
Delete Table Properties
Delete a property by backspacing over it or using the Delete key.
Format Table Columns, Rows, and Cells
Add and Delete Columns and Rows
To add or delete a column or row, select a cell and then click one of the buttons described
in the following table.
Note: You cannot delete a row or column when it is the only row or column in the table.
Button
Action
Add column (added to the left of the selected column)
6-14
Property Table Components
Button
Action
Delete selected column
Add row (added above the selected row)
Delete selected row
Resize Columns
To resize the width of a column, click and drag its vertical borders as needed.
Merge and Split Cells
To merge or split table cells, select a row and then click one of the buttons described in
the following table.
Button
Action
Merge cells downward
Merge cells to the right
Split cells
Display or Hide Cell Borders
To toggle cell borders on and off:
1
Place your cursor in a cell and right-click to invoke its context menu.
2
Choose Cell borders > Top, Bottom, Right, or Left to toggle the specified border
on or off.
6-15
6
Add Content with Components
Zoom and Scroll
You can zoom in and out of the table with the zoom buttons, which are located to the left
of the horizontal scroll bar.
Button
Action
Zoom in
Zoom out
You can scroll vertically and horizontally using the table scroll bars.
Select a Table
To display property name/property value pairs, you can select a preset table or use a
custom table.
• A preset table is built-in and formatted. You can select a preset table in the preset
table selection list in the upper-left of the Figure Prop Table window. To apply a
preset table, select the table and click Apply.
• To create a custom table, select a preset table and modify it to fit your needs by
adding and/or deleting rows and properties. You may want to start with the Blank
4x4 preset table.
Note: You cannot save a custom table as a preset table. If you do so, you lose all
changes to the custom table.
6-16
Summary Table Components
Summary Table Components
In this section...
“About Summary Table Components” on page 6-17
“Open the Example Report Template” on page 6-18
“Select Object Types” on page 6-19
“Add and Remove Properties” on page 6-19
“Set Relative Column Widths” on page 6-20
“Set Object Row Options” on page 6-20
About Summary Table Components
Summary table components insert tables that include specified properties for objects into
generated reports. Summary tables contain one object per row, with each object property
appearing in a column, as shown in the following summary table in the figlooptutorial report.
6-17
6
Add Content with Components
Many types of summary table components are available, including:
• Handle Graphics Summary Table
• Simulink Summary Table (requires Simulink Report Generator)
• Stateflow Summary Table (requires Simulink Report Generator)
The component used in this example represents MATLAB Report Generator summary
table components, all of which exhibit similar behavior
Open the Example Report Template
This example uses the figloop-tutorial report template. To open the figure loop
tutorial report template, enter the following at the MATLAB command line:
6-18
Summary Table Components
setedit figloop-tutorial
Select Object Types
You can use the Object type selection list to choose Handle Graphics object types for the
summary table, including blocks, signals, systems, and models. The figloop-tutorial
reports on figure objects.
Add and Remove Properties
You can select object properties to appear in the summary table from the Property
Columns pane. To add a property to the summary table, select the property category from
the property category drop-down box to the right of the Property columns table. Each
property category has its own list of properties, which appear in the field under the box.
The following figure shows Main Properties as the selected category.
To add a property:
1
Select the category from the property category drop-down box.
2
Select a property in the properties list.
3
Click the Add property
button.
The property appears in the Property columns table.
6-19
6
Add Content with Components
To remove a property from the table:
1
2
Select the property in the Property columns table.
Click the Delete property
button.
The property name is removed from the Property columns table.
Note: After making changes in the Report Explorer, click Apply to make the changes
take effect.
You can define your own properties by entering their names into the Property columns
table using valid variable notation. For more information, see “%<VariableName>
Notation” on the Text component reference documentation.
Set Relative Column Widths
To apply a relative column width to the summary table columns in the generated report,
double-click on the Width column of a row in the Property columns table . If you do not
specify a value for this field, column widths automatically set.
Set Object Row Options
You can use the Object Rows pane to set options for table rows, including anchor,
filtering, and sorting options. Select Insert anchor for each row to place an anchor
in each table row in the report. Use the Include figures list to specify what objects to
include in the summary table.
Summary table components in figloop-tutorial report on figure objects. For more
information on options for these figure objects, see the following sections:
• “Loop on the Current Figure”
• “Loop on Visible Figures”
• “Loop on Figures with Tags”
6-20
Logical and Looping Components
Logical and Looping Components
Logical and looping components execute conditionally, determining when a child
component executes or how many times a child component executes.
A looping component runs its child components a specified number of times. There are
several looping components, such as logical loops, Handle Graphics loops, and model and
chart loops. For model and chart loops, you can control aspects such as the order in which
the report sorts blocks.
For an example that uses loop components, see “Edit Figure Loop Components”.
You can use loop context functions with loop components. For details, see:
• “Filter with Loop Context Functions” on page 6-22
• “Loop Context Functions” on page 6-24
6-21
6
Add Content with Components
Filter with Loop Context Functions
In this section...
“Create and Save the Setup File” on page 6-22
“Add Components” on page 6-22
“Run the Report” on page 6-23
Use loop context functions to filter the modeling elements to report on and to perform
special reporting on specific elements.
In the following example, in a Block Loop component, you use
RptgenSL.getReportedBlock in a Logical If component to report on targeted blocks
within a Block Loop component.
For a summary of loop context functions, see “Loop Context Functions” on page 6-24.
Create and Save the Setup File
1
Open the f14 model.
2
At the MATLAB command prompt, enter:
report
3
In the Report Explorer, select File > New.
4
In the Properties pane, set Directory to Present working directory.
5
Save the setup file as inport_outport.rpt.
Add Components
Add these components to the report, in order.
From this Library
Folder
Add this Component
Set this Property
Simulink
Model Loop
N/A
Formatting
Chapter
Title to Inport Blocks
Simulink
Block Loop
N/A
Logical and Flow Logical If
Control
6-22
Test Expression to
strcmp(get_param...
Filter with Loop Context Functions
From this Library
Folder
Add this Component
Set this Property
(RptgenSL.getReportedBlock,'BlockType'),...
'Inport')
Simulink
Simulink Property
Table
N/A
The report setup file looks like this:
Run the Report
1
Select inport_outport.rpt.
2
From the context menu, select Report.
The report includes a chapter with properties for the Inport blocks only.
If you wish, create a second chapter that reports on Outport blocks only, as shown below.
6-23
6
Add Content with Components
Loop Context Functions
In this section...
“For Simulink Modeling Elements” on page 6-24
“For Stateflow Modeling Elements” on page 6-24
You can use these loop context functions in similar ways as shown in “Filter with Loop
Context Functions” on page 6-22.
For Simulink Modeling Elements
Modeling Element
Looping Component
Function
Simulink modeling elements
Block
Block Loop
RptgenSL.getReportedBlock
Signal
Signal Loop
RptgenSL.getReportedSignal
System
System Loop
RptgenSL.getReportedSystem
Model
Model Loop
RptgenSL.getReportedModel
For Stateflow Modeling Elements
6-24
Modeling Element
Looping Component
Function
Object
Object Loop
RptgenSF.getReportedObject
State
State Loop
RptgenSF.getReportedState
Chart
Chart Loop
RptgenSF.getReportedChart
Edit Figure Loop Components
Edit Figure Loop Components
In this section...
“Figure Loop in a Report” on page 6-25
“Figure Properties” on page 6-26
“Loop on the Current Figure” on page 6-27
“Loop on Visible Figures” on page 6-27
“Loop on Figures with Tags” on page 6-27
“Modify Loop Section Options” on page 6-27
Figure Loop in a Report
This example uses the Figure Loop, which is representative of many types of loops. The
Figure Loop component runs its child components several times. In each iteration, the
Figure Loop applies its child components to Handle Graphics figures. The figlooptutorial report setup file creates a report that documents several Handle Graphics
figures.
1
At the MATLAB command prompt, enter:
setedit figloop-tutorial
2
To display the Handle Graphics figures, enter:
figloopfigures
The figures Membrane Data, An Application, and Peaks Data appear on the
screen because their visible property is 'on'. The Invisible Membrane Data
and An Invisible Application figures do not appear on screen because their
visible property is 'off'. These invisible figures exist, but they are hidden.
3
In the Report Explorer, in the Outline pane on the left, select the Figure Loop
component called Figure Loop Section 1.
The Properties pane for the Figure Loop component appears.
6-25
6
Add Content with Components
Figure Properties
Figure properties control which figures appear in the report. Table 1.1 of the figlooptutorial report includes a summary of the properties of the figures used in this
tutorial.
6-26
Edit Figure Loop Components
For this example, do not change these properties. For more information, see “Add,
Replace, and Delete Properties in Tables” on page 6-13.
Loop on the Current Figure
To include only the current figure in the report, select Current figure only from
the Include figures selection list. The current figure is the figure that is current when
the report generates. This figure may not be the same figure that you selected as the
current figure in the Report Explorer before report generation. For example, if the
report generation process creates figures in your report, the last figure created with
HandleVisibility set to 'on' is the current figure.
Loop on Visible Figures
To include snapshots of all visible figures in your report, in the Include figures
selection list, select Visible figures. This option inserts a snapshot and Property
Table for all figures that are currently open and visible.
1
Select the Data figures only (Exclude applications) option to exclude figures
from the loop whose HandleVisibility parameter is 'off'.
2
To generate the report, in the Report Explorer toolbar click the Report button.
In the generated report, scroll down to “Chapter 2 Figures in Report.” The Membrane
Data and Peaks Data figures appear in the generated report.
Loop on Figures with Tags
To include figures with specified tags in the report:
1
In the Include figures selection list, select the All figures with tags option.
2
In the list of tags, delete membrane.
3
Click Report to generate the report.
The An Application and An Invisible Application figures appear in the report.
They both have an app tag.
Modify Loop Section Options
In a loop, a section refers to a space in the generated report in which information,
including text, images, and tables, appears. You can alter the appearance of sections
6-27
6
Add Content with Components
in each loop appear in the report by using the options in the Figure Loop component's
Section Options pane.
• Create Section for Each Object in Loop — Create an individual section for each
object found in the loop, using the object title as the section title. This option is useful
when a loop does not contain a Chapter/Subsection component that organizes the loop
results.
• Display the Object Type in the Section Title — Precede section titles with object
titles. Enable this option by selecting Create section for each object in loop. For
example:
1
Enter membrane back in the list of tags.
2
Generate the figloop-tutorial report.
The figures produced by the loop are:
Membrane Data
Invisible Membrane Data
An Application
An Invisible Application
3
Enable the Create section for each object in loop option.
4
Enable the Display the Object Type in the Section Title option.
5
Generate the figloop-tutorial report.
The figures produced are now:
Figure
Figure
Figure
Figure
-
Membrane Data
Invisible Membrane Data
An Application
An Invisible Application
The figures produced are now:
Figure
Figure
Figure
Figure
-
Membrane Data
Invisible Membrane Data
An Application
An Invisible Application
• Create a Link Anchor for Each Object in Loop — Create a hyperlink to the
object in the generated report.
6-28
7
Compare Simulink Model XML Files
• “About Simulink Model XML Comparison” on page 7-2
• “Select Simulink Models for XML Comparison” on page 7-5
• “Compare Simulink Model XML Files” on page 7-8
• “Display Items in Original Models” on page 7-17
• “Merge Simulink Models from the Comparison Report” on page 7-21
• “Export, Print, and Save XML Comparison Results” on page 7-24
• “Comparing XML Files from Models with Identical Names” on page 7-27
• “Work with Referenced Models and Library Links” on page 7-28
• “Compare XML from Models Managed with Subversion” on page 7-30
• “Compare Templates” on page 7-34
7
Compare Simulink Model XML Files
About Simulink Model XML Comparison
In this section...
“Creating XML Comparison Reports” on page 7-2
“Using XML Comparison Reports” on page 7-2
Creating XML Comparison Reports
If you have Simulink Report Generator software, you can compare XML text files from
Simulink models.
You can select a pair of Simulink models to compare their XML files. You can use models
from any version of Simulink. The XML comparison tool produces a comparison report
based on the SLX files. You can use the report to explore the differences, view the
changes highlighted in the original models, and merge differences.
You can access the XML comparison tool from:
• The MATLAB Current Folder browser context menu
• The MATLAB Comparison Tool
• The MATLAB command line
• The Simulink Editor Analysis menu
• The Simulink Project Modified Files view
The Simulink Report Generator XML comparison functionality is an extension of the
MATLAB Report Generator XML comparison feature.
You can use the XML comparison tool with both model file formats, SLX and MDL. If
the selected files are .mdl files, the XML comparison tool first exports the .mdl files to
SLX files in a temporary directory. The XML comparison tool then produces a comparison
report based on the SLX files.
For more information on creating reports, see “Select Simulink Models for XML
Comparison” on page 7-5.
Using XML Comparison Reports
You can display XML comparison reports in the MATLAB Comparison Tool. The
comparison tool processes the output of the XML comparison into an interactive report
7-2
About Simulink Model XML Comparison
with links that you can click to reverse annotate from the XML tag comparison to the
corresponding Simulink models. “Reverse annotation” means when you click items in the
report, Simulink Report Generator displays the corresponding items highlighted in the
original models, as shown in the following example.
The XML comparison report shows a hierarchical view of the portions of the two XML
files that differ. The report does not show sections of the files that are identical.
If the files are identical you see a message reporting there are no differences.
If files have not been saved, you see an error message informing you that you must save
modified or newly created models before running an XML comparison.
Note: It might not be possible for the analysis to detect matches between previously
corresponding sections of files that have diverged too much.
7-3
7
Compare Simulink Model XML Files
Change detection in the Chawathe analysis is based on a scoring algorithm. Items
match if their Chawathe score is above a threshold. The Simulink Report Generator
implementation of Chawathe's algorithm uses a comparison pattern that defines the
thresholds assigned to particular node types (e.g., “block”). For more information, see
“How the Matching Algorithm Works” in the MATLAB Report Generator documentation.
For more information on using the report, see “Compare Simulink Model XML Files” on
page 7-8.
To control reverse annotation, see “Display Items in Original Models” on page 7-17.
To merge differences, see “Merge Simulink Models from the Comparison Report” on page
7-21.
For more information about the Comparison Tool, see “Comparing Files and Folders” in
the MATLAB documentation.
7-4
Select Simulink Models for XML Comparison
Select Simulink Models for XML Comparison
In this section...
“Select Files from the Simulink Editor” on page 7-5
“Select Files from the Current Folder Browser” on page 7-5
“Select Files from a Simulink Project” on page 7-6
“Select Files from the Comparison Tool” on page 7-6
“Select Files from the Command Line” on page 7-6
“Choose a Comparison Type” on page 7-7
“Examples of XML Comparison” on page 7-7
To learn what you can do with XML comparison reports, see “About Simulink Model
XML Comparison” on page 7-2.
Select Files from the Simulink Editor
To compare files using the Simulink Editor:
1
Select Analysis > Compare Simulink XML Files.
The Select Files or Folders for Comparison dialog box opens.
2
If the Editor currently displays a model, the current model name and path appear
automatically selected in the First file or folder edit box. Use the browse buttons
to locate and select files for the first and second model files.
3
When you click Compare, the XML comparison tool performs the analysis, and
displays the resulting report in the Comparison Tool.
Select Files from the Current Folder Browser
To compare two files from the Current Folder browser:
• For two files in the same folder, select the files, right-click and select Compare
Selected Files/Folders.
• To compare files in different folders:
1
Select a file, right-click and select Compare Against
7-5
7
Compare Simulink Model XML Files
2
Select the second file to compare in the Select Files or Folders for Comparison
dialog box.
3
Leave the default Comparison type, Simulink XML text comparison.
4
Click Compare.
If the selected files are XML or model files, the XML text comparison tool performs a
Chawathe analysis and displays a report in the Comparison Tool.
For more information about comparisons of other file types (e.g., text, MAT, or binary)
with the Comparison Tool, see “Comparing Files and Folders” in the MATLAB
documentation.
Select Files from a Simulink Project
If you have a Simulink Project using source control, you can create an XML comparison
report from the Modified Files view of the Simulink Project Tool. For details, see “Project
Management ”.
Select Files from the Comparison Tool
To compare files using the Comparison Tool, from the MATLAB Toolstrip, in the File
section, select the Compare button. In the dialog box select files to compare.
If the selected files are XML or model files, the XML text comparison tool performs a
Chawathe analysis and displays a report in the Comparison Tool.
Select Files from the Command Line
To compare XML files from the command line, enter
visdiff(filename1, filename2)
where filename1 and filename1 are XML files or Simulink models.
If the files are models, the XML comparison tool performs the comparison on the XML
files. This XML comparison functionality is an extension to the MATLAB visdiff
function. visdiff produces a report in the Comparison Tool.
To create an xmlcomp.Edits object at the command line without opening the
Comparison Tool, enter:
7-6
Select Simulink Models for XML Comparison
Edits = slxmlcomp.compare(modelname_A,modelname_B)
See “Export Results to the Workspace” on page 7-24 for information about the
xmlcomp.Edits object.
Choose a Comparison Type
If you specify two XML or model files to compare using either the Current Folder
Browser or the visdiff function, then the Comparison Tool automatically performs the
default comparison type. The defaults are XML text comparison for XML files and
Simulink XML text comparison for model files.
To change comparison type, either create a new comparison from the Comparison Tool,
or use the Compare Against option from the Current Folder browser. You can change
comparison type in the Select Files or Folders for Comparison dialog box. For example,
if you want the MATLAB text differences report for XML or model files, change the
comparison type to Text comparison in the dialog before clicking Compare.
Examples of XML Comparison
For examples with instructions, see:
• slxml_radar_matlab_function
• slxml_sfcar
• slxml_truthtables
For information on using and understanding the report and the XML comparison
functionality, refer to “Compare Simulink Model XML Files” on page 7-8.
7-7
7
Compare Simulink Model XML Files
Compare Simulink Model XML Files
In this section...
“Navigate the Simulink XML Comparison Report” on page 7-8
“Step Through Changes” on page 7-10
“Explore Changes in the Original Models” on page 7-11
“Merge Differences” on page 7-11
“Open Child Comparison Reports for Selected Nodes” on page 7-12
“Understand the Report Hierarchy and Matching” on page 7-13
“Filter Out Differences” on page 7-13
“Change Color Preferences” on page 7-15
“Save Comparison Results” on page 7-15
Navigate the Simulink XML Comparison Report
You can select a pair of Simulink models to compare their XML files. You can use models
from any version of Simulink. The XML comparison tool produces a comparison report
based on the SLX files. You can use the report to explore the differences, view the
changes highlighted in the original models, and merge differences.
The XML Comparison report shows changes only, not the entire XML text file contents.
The report shows a hierarchical view of the portions of the two XML files that differ. The
report does not show sections of the files that are identical. To learn about the report, see
“About Simulink Model XML Comparison” on page 7-2.
To step through differences, use the Comparison tab on the toolstrip. To move to the
next or previous group of differences, on the Comparison tab, in the Navigate section,
click the arrow buttons to go to the previous or next difference. See “Step Through
Changes” on page 7-10.
You can also click to select items in the hierarchical trees and observe the following
display features:
• Selected items appear highlighted in a box.
• If the selected item is part of a matched pair it is highlighted in a box in both left and
right trees.
7-8
Compare Simulink Model XML Files
• When you select an item, the original model displays and the corresponding item is
highlighted. See “Explore Changes in the Original Models” on page 7-11.
Report item highlighting indicates the nature of each difference as follows:
Type of report
item
Highlighting
Notes
Modified
Pink
Modified items are matched pairs that differ between the
two files. When you select a modified item it is highlighted
in a box in both trees.
Example of a modified pair of nodes:
Changed parameters for the selected pair are displayed in
a separate Parameters panel for review. If strings are too
long to display in the Parameters table, right-click and
select Compare as Text to open a new comparison of the
parameters.
Example of modified parameters:
Unmatched
Green
When you select an unmatched item it is highlighted in a
box in one tree only.
Example of an unmatched node:
Container
None
Rows with no highlighting indicate a container item that
contains other modified or unmatched items.
Example of a container node:
Icons indicate the category of item, for example: model, subsystem, Stateflow machine or
chart, block, line, parameter, etc.
7-9
7
Compare Simulink Model XML Files
To expand or filter the tree view, use the View tab controls on the toolstrip for the
following functions:
• Expand All — Expands every item in the tree.
Tip Right-click to expand or collapse the hierarchy within the selected tree node.
• Collapse All — Collapses all items in the tree to the most compact view possible.
• Filter — Opens the Filter list. Select check boxes to enable or disable display
of categories of changes in the report. Use the filters to show only the changes
you are interested in. By default the report hides all nonfunctional changes,
such as repositioning of items. Turn off filters to explore all differences including
nonfunctional changes. See “Filter Out Differences” on page 7-13.
If you want to swap the files, on the Comparison tab, select Swap Sides. The report
swaps the sides and reruns the comparison. Refresh also runs the analysis again.
To create a new report, see “Select Simulink Models for XML Comparison” on page 7-5.
For examples with instructions, see also “Examples of XML Comparison” on page 7-7 .
Step Through Changes
On the Comparison tab, in the Navigate section, when you click the Next arrow button
(or press the Down key when the report has focus), you step through groups of changes in
the report, in the following order:
1
The first time you click Next, it selects the first changed (pink) or inserted (green)
node on the left tree.
2
Step through the differences with the Next button.
• When selected items have a match in the right tree then they are also
highlighted.
• Next skips white nodes with no color background. White nodes are parts of the
hierarchy that contain no differences.
• If there is an insertion or deletion with child nodes, Next skips the child
nodes if they are all also insertions or deletions. For example, if you insert a
subsystem, Next selects the top subsystem node, then skips all the nodes inside
the subsystem (if they are all also insertions) and selects the next difference.
7-10
Compare Simulink Model XML Files
• Next minimizes context switching when highlighting in models. When you click
Next, the report steps through all differences at the same level of the model,
subsystem, or chart, in both left and right trees in the report, before moving to
the next level of the report. For example, you step through all differences in a
subsystem in the left and right trees, before moving to another subsystem.
3
When you have stepped through all changes, Next returns to the beginning of the
left tree.
If you click an item in the report, the Next/Previous controls will step through changes
from the point you selected.
Explore Changes in the Original Models
When you compare the XML text files from Simulink® models, you can choose to display
the corresponding items in the original models when you select report items. You can use
this reverse annotation function to explore the changes in the original models. When you
select an item, the report invokes reverse annotation to the original model and highlights
the corresponding item in the model.
Control the display by using the View tab Highlight in Models button and the Always
Highlight check box.
Tip Click a Subsystem contents node to see the report highlight all visible modified
objects in the subsystem.
For details, see “Display Items in Original Models” on page 7-17.
Merge Differences
Tip You can only merge from left to right. If you want to merge into the other file, use
Swap Sides before you start merging. Swap Sides reverts any merges already made and
creates a new comparison report for the original files.
To merge a selection, use the following buttons on the Comparison tab, in the Merge
section:
7-11
7
Compare Simulink Model XML Files
• Merge Node — Merge the selected node from the left side of the report to the right.
• Merge Parameter — Merge the selected parameter from the left side of the report to
the right.
• Undo All — Revert all merge operations.
For more information, see “Merge Simulink Models from the Comparison Report” on page
7-21.
Open Child Comparison Reports for Selected Nodes
If additional comparisons are available for particular nodes, you see a Compare button
to open a report for that pair of nodes. For example, if there are differences in the Model
Workspace, you can click Compare to open a new report to explore differences in
variables.
You can open child reports for parameters, MATLAB Function blocks, truth tables and
Model Workspaces.
• To compare parameters, click the Parameters pane, then on the Comparison tab
select Compare Selected Parameter. This opens a new report for the currently
selected pair of parameters. Use this when the report cannot display all the details in
the Parameters pane, e.g., long strings or a script.
• If the original models contain MATLAB Function block components, and if differences
are found, the XML comparison tool lists them in the Stateflow section of the report.
Click the Compare button at the end of the MATLAB Function block report items
to open new comparisons in the Comparison Tool, showing the text difference
reports for the MATLAB Function block components. You can merge differences
in MATLAB Function block code from the text comparison report. See “Merge
Simulink Models from the Comparison Report” on page 7-21, and the example
slxml_radar_matlab_function.
• If the original models contain truth tables, and if differences are found, the XML
comparison tool lists them in the Stateflow section of the report.
• Click the Compare button at the end of the MATLAB Function node to see a
summary of all changes.
7-12
Compare Simulink Model XML Files
• Click the truthtable node to reverse annotate and display both truthtable
editors.
• Click the Compare button at the end of the Condition Table node to open a
new text comparison showing only Condition differences.
• Similarly click the Compare button for Action Table to view only Action
changes.
See the example slxml_truthtables.
Understand the Report Hierarchy and Matching
Hierarchical node tags (such as subsystem tags in the .xml file) appear twice in the tree
as nested nodes. This is because the container node and the contents can have separate
differences in their properties. This feature of the XML report allows you to distinguish
between property differences of the node itself, and differences contained within nodes
nested inside.
To understand matching results within an XML comparison report, see “How the
Matching Algorithm Works” in the MATLAB Report Generator documentation.
Note: It might not be possible for the analysis to detect matches between previously
corresponding sections of files that have diverged too much.
If you cannot see changes you expected to see in the report, on the View tab, click
the Filter button to turn off filters and see all identified changes. See “Filter Out
Differences” on page 7-13.
Comparing Signal Builder Blocks
You can see differences in Signal Builder blocks when you have not touched them. This
occurs because Signal Builder blocks generate new handles when you load a model. The
report shows that the handles have changed. To view the differences, click the Compare
button in the report and observe that handles called blockH and modelH are different.
Filter Out Differences
You can use the Filter button on the View tab to control display of categories of changes.
Turn off filtering to view all identified changes.
7-13
7
Compare Simulink Model XML Files
In the Filter list, select check boxes to enable or disable display of categories of changes
in the report. Use the filters to show only the changes you are interested in. By default
the report hides all nonfunctional changes, such as repositioning of items. Turn off filters
to explore all differences including nonfunctional changes. Try this if you cannot see
changes you expected to see in the report.
Categories for filtering include:
• Hide changes in lines. Hide all changes to signal lines including functional changes.
• Hide nonfunctional changes. The report processing identifies certain items in
the XML file as nonfunctional, for example, tags representing parameters such
as block, system, chart or label positions, font and color settings for blocks and
lines, and system print and display settings. The report processing tries to identify
“consequential” changes as nonfunctional (that is, changes as a consequence of
another change). For example, if a block name changes from block_A to block_B, a
line emerging from that block has a change in its source block parameter. This change
in the line parameters is considered nonfunctional. Lines are highly functional, but
line changes can be very noisy because of changes in blocks they connect to.
• Hide changes in graphical interface. This information is a summary of inports
and outports at the top level of the model. Filter graphical interface changes to avoid
duplication in the report, as any changes in root ports are also reported as functional
changes where you can use reverse annotation.
• Hide changes in block parameter defaults. Hiding changes in defaults can avoid
duplication in the report, as any changes in blocks are also reported as functional
changes where you can use reverse annotation. Block parameter defaults are an
undocumented part of the Simulink XML file that store the default parameters for the
blocks used in a model.
Exceptions
The report does not filter out changes to Block and System names, annotations, and
Stateflow Notes as nonfunctional, even though changes to these items do not affect the
outcome of simulation. The report always displays these changes to facilitate review of
code changes, because they can contain important information about users' intentions.
In certain rare cases the report filters out changes that can impact the behavior of the
design. By default moves are filtered as nonfunctional, but in the following cases moves
can change design behavior:
• Moving blocks can in some cases change the execution order.
7-14
Compare Simulink Model XML Files
• In a Stateflow chart, if you move states or junctions so that they intersect, the model
fails to simulate.
To view these types of changes in the report, turn off the filter for nonfunctional changes.
Change Color Preferences
You can change and save your diff color preferences for the Comparison tool. You can
apply your color preferences to all comparison types.
1
On the MATLAB Home tab, click Preferences.
2
In the Preferences dialog box, under MATLAB, click Comparison.
3
Edit color settings as desired for differences and merges. View the colors in the
Sample pane.
The Active Settings list displays Default (modified).
4
To use your modified settings in the comparison, click Apply and refresh the
comparison report.
5
To return to the default color settings, in the Preferences dialog box, click Reset and
click Apply. Refresh the comparison report.
6
If you want to save your modified color preferences for use in future MATLAB
sessions, click Save As. Enter a name for your color settings profile and click OK.
After saving settings, you can select them in the Active Settings list.
Save Comparison Results
To save your comparison results, use these Comparison tab buttons:
• Save As > Save as HTML — Opens the Save dialog box, where you can choose to
save a printable version of the XML comparison report. See “Save Printable HTML
Report” on page 7-24.
• Save As > Save to Workspace — Export XML comparison results to workspace. See
“Export Results to the Workspace” on page 7-24.
Related Examples
•
“Select Simulink Models for XML Comparison” on page 7-5
7-15
7
Compare Simulink Model XML Files
•
“Display Items in Original Models” on page 7-17
•
“Merge Simulink Models from the Comparison Report” on page 7-21
•
“Compare XML from Models Managed with Subversion” on page 7-30
•
“Compare Revisions”
•
“Source Control in Simulink Project”
More About
7-16
•
“About Simulink Model XML Comparison” on page 7-2
•
“Comparing XML Files from Models with Identical Names” on page 7-27
•
“Work with Referenced Models and Library Links” on page 7-28
Display Items in Original Models
Display Items in Original Models
In this section...
“Highlighting in Models” on page 7-17
“Control Highlighting in Models” on page 7-19
“View Changes in Model Configuration Parameters” on page 7-20
Highlighting in Models
When you compare the XML text files from Simulink models, you can choose to display
the corresponding items in the original models when you select report items. You can use
this reverse annotation function to explore the changes in the original models. When you
select an item, the report invokes reverse annotation to the original model and highlights
the corresponding item in the model.
Tip If you click a Subsystem contents node, the report highlights all visible modified
objects in the subsystem.
Click a report entry to view the highlighted item (or its parent) in the model:
• If the item occurs in both models, they both appear with highlighting.
• If there is no match for the item, the unmatched report item row is green. It is
considered unique and appears highlighted by itself.
When there is no match in the other model, the report highlights the first matched
ancestor to show the context of the missing item. If this ancestor is a system or
subsystem, then the report highlights all visible modified objects in the system.
• If the XML comparison tool cannot highlight an item directly (e.g., configuration
parameters), then it highlights the nearest ancestor of the selected node.
The following screenshots show reverse annotation of Simulink and Stateflow items in
original models using the example slxml_sfcar.
7-17
7
Compare Simulink Model XML Files
7-18
Display Items in Original Models
Control Highlighting in Models
To control highlighting in models, on the View tab in the Comparison Tool, select or
clear the check box Always Highlight. You can click the Highlight in Models button
to highlight the currently selected report node at any time. This can be useful if you turn
off automatic highlighting and only want to display specific nodes.
By default, models display to the right of the comparison report, with the model
corresponding to the left side of the report on top, and the right below. If you move or
resize the models your position settings are respected by subsequent model highlighting
operations within the same session. The tool remembers your window positions.
If you want to preserve window positions across sessions, position the window, and then
enter:
slxmlcomp.storeWindowPositions
7-19
7
Compare Simulink Model XML Files
This preserves the placement of any Simulink windows, Stateflow windows, and truth
table windows.
To stop storing window positions and return to the defaults, enter:
slxmlcomp.clearWindowPositions
View Changes in Model Configuration Parameters
You can use the report to explore differences in the model Configuration Parameters. If
you select a Configuration Parameter item, the report displays the appropriate root node
pane, if possible, of both Configuration Parameters dialog boxes.
The Parameters pane of the report displays the label text from the dialog controls
(or the parameter name if it is command line only), and the parameter values. Some
configuration parameters have a different hierarchy in the XML file and the dialog box.
You can right-click to merge a selected parameter value in the Parameters pane.
Related Examples
•
“Select Simulink Models for XML Comparison” on page 7-5
•
“Compare Simulink Model XML Files” on page 7-8
•
“Merge Simulink Models from the Comparison Report” on page 7-21
•
“Compare Revisions”
More About
•
7-20
“About Simulink Model XML Comparison” on page 7-2
Merge Simulink Models from the Comparison Report
Merge Simulink Models from the Comparison Report
In this section...
“Merge Models” on page 7-21
“Merge MATLAB Function Block Code” on page 7-23
Merge Models
You can merge Simulink models from the XML text comparison report. You can merge
individual parameters, blocks or entire subsystems.
The merge feature enables you to merge two versions of a design modeled in Simulink.
Tip You can only merge from left to right. If you want to merge into the other file, use
Swap Sides before you start merging. Swap Sides reverts any merges already made and
creates a new comparison report for the original files.
You can merge from the left model to the right model using the XML text files. You can
click Undo to revert all merge operations. You can merge modified, added or deleted
nodes in the report as follows:
1
Select a report item you want to merge.
2
On the Comparison tab, in the Merge section, click Merge Node to merge the
selected node. Merge is disabled when you cannot merge the selected node. For
example, you cannot merge the top level model nodes, data nodes, or nodes within
configuration settings.
Tip Merge blocks before lines, and merge states and junctions before merging
transitions. See “Merging Tips” on page 7-22.
3
View the results in the report and the models.
The report merges the selected node from the left side of the report to the right.
Merged report nodes have gray row highlighting, and a green merge arrow if the
node has an icon, e.g.,
.
7-21
7
Compare Simulink Model XML Files
The merge copies the change (a modified, added or deleted item) from the left model
to the right model. If the node exists only in the left tree, then the merge inserts
it into the right tree. The software attempts to connect all lines to blocks after the
merge.
4
To merge individual parameters, right-click an item in the Parameters pane and
select Merge Left to Right. Alternatively, click the Merge Parameter button in
the Merge section of the toolstrip.
You cannot insert or delete parameters, and not all parameters can be merged.
If you merge all possible parameters for a node then the report marks that node as
merged, e.g.,
. If you partially merge some parameters of a node,
the report marks the node as partially merged with a green merge arrow icon and no
gray row highlighting.
5
(Optional) To revert all merge operations, on the Comparison tab, in the Merge
section, click Undo All. A dialog prompts you to confirm you want to throw away all
merge operations and revert the report and models to their original state.
6
Inspect your merge changes in the Simulink Editor. If necessary, connect any lines
that the software did not connect automatically. The comparison report does not
update to show any changes you make in the Editor.
7
Save the model in the Editor or in the comparison report.
Merging Tips
• You must merge blocks before lines in the Simulink part of the report, and in the
Stateflow section you must merge states and junctions before merging transitions, or
the report cannot make the connections.
For an example showing how to merge a change involving multiple nodes, see
slxml_sfcar.
• If you want to merge subsystems, be aware that in XML text files, subsystems are
represented by two nodes, the container and the contents. The two nodes have the
same name but different properties, for example, name changes are a property of the
container node. You can merge the container parameters and contents independently.
If you want to merge a subsystem and all its properties, merge both the container and
the contents nodes.
• You cannot insert or delete parameters, and not all parameters can be merged. For
example, you cannot merge Simulink Identifier (SID) parameters.
7-22
Merge Simulink Models from the Comparison Report
• If you change filter settings after any merge operations, you will lose your merge
changes. A dialog prompts you to confirm you want to throw away all merge
operations and revert the report and models to their original state. If you click Yes
to continue, the analysis runs again and you see a new report with the new filtering
applied.
• For information on merging between models with identical names, see “Comparing
XML Files from Models with Identical Names” on page 7-27.
Merge MATLAB Function Block Code
1
To merge differences in MATLAB Function block code, create a comparison report for
the parent models.
2
(Optional) On the View tab, turn off Highlight in Models. Otherwise the parent
models display each time you merge a difference in the MATLAB Function block
code text comparison.
3
Next to the MATLAB Function block node in the XML comparison report, click the
Compare button .
A new text comparison report opens.
4
In the text comparison report, select a difference in the code and click Merge to copy
the selected difference from the left block to the right block.
5
After you finish merging differences, save the parent model in the Editor.
Related Examples
•
“Select Simulink Models for XML Comparison” on page 7-5
•
“Compare Simulink Model XML Files” on page 7-8
•
“Display Items in Original Models” on page 7-17
•
“Source Control in Simulink Project”
•
“Compare Revisions”
More About
•
“About Simulink Model XML Comparison” on page 7-2
•
“Comparing XML Files from Models with Identical Names” on page 7-27
7-23
7
Compare Simulink Model XML Files
Export, Print, and Save XML Comparison Results
In this section...
“Save Printable HTML Report” on page 7-24
“Export Results to the Workspace” on page 7-24
“Save Comparison Log Files in a Zip File” on page 7-25
Save Printable HTML Report
To save a printable version of an XML comparison report,
1
On the Comparison tab, in the Comparison section, select Save As > Save as
HTML.
The Save dialog box opens, where you can choose to save a printable version of the
XML comparison report.
2
Select a file name and location to save the report.
The report is a noninteractive HTML document of the differences detected by the
algorithm for printing, sharing, or archiving a record of the comparison. If you have
applied filters, your filtered results appear in the printable report.
Export Results to the Workspace
To export the XML comparison results to the MATLAB base workspace,
1
On the Comparison tab, in the Comparison section, select Save As > Save to
Workspace.
The Input Variable Name dialog box appears.
2
Specify a name for the export object in the dialog and click OK. This action exports
the results of the XML comparison to an xmlcomp.Edits object in the workspace.
The xmlcomp.Edits object contains information about the XML comparison including
file names, filters applied, and hierarchical nodes that differ between the two XML files.
To create an xmlcomp.Edits object at the command line without opening the
Comparison Tool, enter:
Edits = slxmlcomp.compare(modelname_A,modelname_B)
7-24
Export, Print, and Save XML Comparison Results
Property of xmlcomp.Edits
Description
Filters
Array of filter structure arrays. Each
structure has two fields, Name and Value.
LeftFileName
File name of left model exported to XML.
LeftRoot
xmlcomp.Node object that references the
root of the left tree.
RightFileName
File name of right model exported to XML.
RightRoot
xmlcomp.Node object that references the
root of the right tree.
TimeSaved
Time when results exported to the
workspace.
Version
MathWorks release-specific version
number of xmlcomp.Edits object.
Property of xmlcomp.Node
Description
Children
Array of xmlcomp.Node references to child
nodes, if any.
Edited
Boolean — If Edited = true then the
node is either inserted (green) or part of a
modified matched pair (pink).
Name
Name of node.
Parameters
Array of parameter structure arrays. Each
structure has two fields, Name and Value.
Parent
xmlcomp.Node reference to parent node, if
any.
Partner
If matched, Partner is an xmlcomp.Node
reference to the matched partner node in
the other tree. Otherwise empty [].
Save Comparison Log Files in a Zip File
Temporary comparison files accumulate in tempdir/MatlabComparisons/
XMLComparisons/TempDirs/. These temporary files are deleted when you close the
related comparison report.
7-25
7
Compare Simulink Model XML Files
You can zip the temporary files (such as log files) created during XML text comparisons
for sharing or archiving. While the comparison report is open, enter:
xmlcomp.zipTempFiles('c:\work\myexportfolder')
The destination folder must exist. The output reports the zip file name:
Created the zipfile "c:\work\myexportfolder\20080915T065514w.zip"
To view the log file for the last comparison in the MATLAB Editor, enter:
xmlcomp.showLogFile
7-26
Comparing XML Files from Models with Identical Names
Comparing XML Files from Models with Identical Names
You can compare XML text from files of the same name. To complete the operation,
the XML comparison tool copies one of the models to a temporary folder, because
Simulink cannot have two models of the same name in memory at the same
time. The XML comparison tool creates a read-only copy of one model named
modelname_TEMPORARY_COPY, and compares the resulting XML files.
Warning When you use reverse annotation from the report, one of the models displayed
is a temporary copy with a new name. The temporary copy is read-only, to avoid making
changes that can be lost.
Alternatively, you can run the comparison by renaming or copying one of the files.
All merge operations merge from left to right, so you cannot accidentally merge to a
temporary copy. Merge operations on models with identical names copy changes from
the left (temporary copy) model to the right model. If you swap sides, the report always
places a new temporary copy on the left side of the report, so any merges change the
original model file and never a temporary copy.
If one of the models is open when you try to compare XML files, a dialog box appears
where you can click Yes to close the file and proceed, or No to abort. You must close open
models before the XML comparison tool can compare XML files from two models with
the same name. The problem requiring you to close the loaded model is called “shadowed
files”. In some cases, another model with the same name might be in memory, but not
visible. See “Shadowed Files ” in the Simulink documentation for more information.
If you want to automatically close open models of the same name when comparing XML
files and not see the dialog box again, run these commands:
opt = slxmlcomp.options
opt.setCloseSameNameModel(true)
This is persistent across MATLAB sessions. To revert to default behavior and be
prompted whether or not to close the open model every time, enter:
opt = slxmlcomp.options
opt.setCloseSameNameModel(false)
7-27
7
Compare Simulink Model XML Files
Work with Referenced Models and Library Links
The XML comparison report applies only to the currently selected models, and does not
include changes to any referenced models or linked libraries. For compatibility with
source control and peer review workflows, the comparison report shows only changes in
the files selected for comparison.
Tip If you want to examine your whole hierarchy instead, try using a Simulink Project,
where you can examine modified files and dependencies across your whole project, and
compare to selected revisions. See “Project Management ”.
If you are comparing models that contain referenced models with the same name, then
your MATLAB path can affect the results. For example, this can happen if you generate
an XML comparison report for the current version of your model and a previous baseline.
Make sure that your referenced models are not on your MATLAB path before you
generate the report.
The reason why results can change is that Simulink records information in the top
model about the interface between the top model and the child model. This interface
information in the top model enables incremental loading and diagnostic checks without
any need to load child models.
When you load a model (for example, to compare XML) then Simulink refreshes the
interface information for referenced models if it can find the child model. Simulink can
locate the child model if it is on the path. If another model of the same name is higher
on the path, Simulink updates the interface information for that other model before
comparing XML. This can produce entries for interface changes for model reference
blocks in the comparison report. Make sure your referenced models are not on your
path before you generate the report, to avoid these interface changes in the results. If
both model versions are off the path, the interface information in the top model is not
refreshed during the XML comparison process. Instead the cached information is used,
resulting in a valid XML comparison report.
With library links, Simulink does not update the cached interface information when
comparing XML, and so the report correctly captures library interfaces. However with
both referenced models and library links, Simulink updates the information when
displaying the model. When displaying report items in original models, you may see that
Simulink finds another model or library that is higher in the path. To obtain the clearest
results, make sure that the models and associated libraries are temporarily removed
7-28
Work with Referenced Models and Library Links
from the path. By removing the files from the path you will see unresolved library links
and referenced models when you view the original models, but their interfaces will be
correct and will correctly align with the comparison report.
7-29
7
Compare Simulink Model XML Files
Compare XML from Models Managed with Subversion
In this section...
“Work with Subversion” on page 7-30
“Configure TortoiseSVN” on page 7-31
“Test TortoiseSVN Setup” on page 7-32
Work with Subversion
Simulink Projects provide built-in Subversion source control integration. You can create
an XML comparison report from the Modified Files view of the Simulink Project Tool. See
“Project Management ”.
Alternatively, you can customize your external Configuration Management tools to call
the XML comparison functionality in the Simulink Report Generator, as described on
this page.
Comparing two versions of the same file is a common workflow when using Configuration
Management tools. If your Configuration Management tool is configurable, you can
customize your Diff operations on Simulink model files from your Configuration
Management tool to call the XML comparison functionality in the Simulink Report
Generator. This allows you to compare two versions of the XML from the same model file
and generate a report of the differences.
TortoiseSVN and Subversion are a popular suite of open-source version control tools.
The following example describes how to configure TortoiseSVN to use the Simulink
Report Generator XML comparison. You can register the XML comparison function
with TortoiseSVN as an extension-specific diff program to use for model files. When you
perform a TortoiseSVN diff on a model file, TortoiseSVN uses the XML comparison to
generate a report. This workflow describes a typical usage of Subversion on a Windows
PC.
1
Configure TortoiseSVN to use the fileComparisonDriver function for model files.
2
When you perform a TortoiseSVN diff on a model file, the fileComparisonDriver
function invokes the visdiff function to generate an XML comparison report.
Optionally, you can also configure TortoiseSVN to use the same function to call the
Comparison Tool for .mat files and for Simulink manifest files (.smf files).
7-30
Compare XML from Models Managed with Subversion
Configure TortoiseSVN
This example is compatible with Release 2008b+ onwards and was tested with
Subversion 1.7.7 on Windows 7 Enterprise.
Configure TortoiseSVN to use the XML comparison tool for model files, as follows:
1
Right-click a file in Windows Explorer and select TortoiseSVN > Settings.
2
In the TortoiseSVN Settings dialog box, click Diff Viewer under External
Programs in the tree, then click the Advanced button.
3
In the Advanced Diff settings dialog box, add an entry to specify what to do with
model files by clicking Add.
4
In the Add extension specific diff program dialog box, enter .mdl or .slx for the
Extension and enter the following command in the External Program edit box:
"matlabroot\bin\matlab.exe" -r fileComparisonDriver("'%base'","'%mine'") -nosplash
Replace matlabroot with the path to the specific location on your computer for your
MATLAB installation, for example, C:\Program files\MATLAB\R2009a.
The following example shows this setup on an R2013b installation.
7-31
7
Compare Simulink Model XML Files
5
Click OK to apply your changes and close all the Tortoise SVN dialog boxes.
6
If you also want to use the MATLAB Comparison Tool to compare MATLAB files,
such as .m and .mat files, or Simulink manifest files (.smf files) you can repeat the
steps to add exactly the same External Program command for .m, .mat and .smf
files.
Test TortoiseSVN Setup
To test your setup, follow these steps:
7-32
Compare XML from Models Managed with Subversion
1
Start MATLAB and open, modify, and save a Simulink model that is managed in a
Subversion archive. This creates a local working copy that is different to the head
repository copy.
2
In Windows Explorer, right-click your modified file, and select TortoiseSVN > Diff.
TortoiseSVN runs a new instance of MATLAB. MATLAB loads and runs the
fileComparisonDriver.m file, located in the folder matlab\toolbox\rptgenext
\rptgenextdemos\slxmlcomp. The fileComparisonDriver function performs these
steps:
1
Creates temporary copies of the current working version of the Simulink model and
the previously stored version of the model.
2
Compares the XML text files from both models and generates a comparison report
displayed in the MATLAB Comparison Tool.
The function must preprocess the file names by creating renamed temporary copies
because Subversion uses a temporary file naming convention that is not compatible with
Simulink because of invalid delimiting characters. The branch and version information is
embedded in the temporary model names. See also “Comparing XML Files from Models
with Identical Names” on page 7-27 for information about using the report and a warning
to avoid losing work in the temporary models.
Other TortoiseSVN workflows using Diff operations are also supported, such as
comparing two versions in an archive.
7-33
7
Compare Simulink Model XML Files
Compare Templates
In this section...
“Compare Project Templates” on page 7-34
“Compare Model Templates” on page 7-35
Compare Project Templates
You can compare project templates (SLTX files). If you select two project template files
to compare, you see a comparison report showing differences in template properties
and project metadata. You can open a new report to investigate project file and folder
differences.
• Click Template Properties to view differences in the Parameters, such as the
description or date modified.
• Expand the Project Metadata node to view metadata differences such as label
changes.
• Next to Project Files, click Compare to open a folder comparison where you can
investigate changed, added, or removed files and folders.
7-34
Compare Templates
Compare Model Templates
You can compare model templates (SLTX files). If you select two model template files to
compare, you see a comparison report showing differences in template properties. You
can open a new comparison report to compare XML text files from the Simulink models.
• Click Template Properties to view differences in the Parameters, such as the
description or date modified.
• Next to Model, click Compare to open a Simulink model XML comparison report
where you can investigate differences.
7-35
7
Compare Simulink Model XML Files
Related Examples
7-36
•
“Compare Simulink Model XML Files” on page 7-8
•
“Comparing Folders and Zip Files”
•
“Create a Template from the Current Project”
•
“Create a Template from a Model”
8
Components — Alphabetical List
For a list of MATLAB Report Generator components, see the MATLAB Report Generator
documentation.
8
Components — Alphabetical List
Acronym Definitions
Create table of Polyspace acronyms used in report and their full forms
Description
This component creates a table containing the acronyms used in the report and their
full forms. Aronyms are used for Polyspace® Code Prover™ checks and Polyspace result
status.
8-2
Annotation Loop
Annotation Loop
Run child components multiple times for each Simulink annotation in current context
Description
This component runs its child components multiple times for each Simulink annotation
in the current context. The parent component determines the context.
• Model Loop: Reports on all annotations inside the reported portion of the reported
model.
• System Loop: Reports on all annotations inside the current system.
• Block Loop or Signal Loop: Does nothing.
Loop Options
The Loop Options pane displays information about the current context. You can sort
Alphabetically by text or In traversal order.
Child components of the Annotation Loop consider their context to be annotations
when the report is running.
For example, the following components report on the looped annotation:
• Simulink Automatic Table
• Simulink Linking Anchor
• Simulink Name
• Simulink Property
• Simulink Property Table
Use a Summary Table component to show annotation objects in reports. Each Summary
Table component creates a single table with each reported annotation on a single row of
the table.
8-3
8
Components — Alphabetical List
Section Options
• Create section for each object in loop: Inserts a section in the generated report
for each object found in the loop.
• Display the object type in the section title: Inserts the object type automatically
into the section title in the generated report.
• Create link anchor for each object in loop: Creates a hyperlink to each object in
the loop, the generated report.
See Also
Block Loop, Model Loop, Signal Loop, System Loop, Simulink Linking
Anchor, Simulink Name, Simulink Property, Simulink Property Table,
Simulink Summary Table
8-4
Block Execution Order List
Block Execution Order List
Create a list or table of all nonvirtual blocks in the model, showing order in which they
execute
Description
This component creates a list or table of all nonvirtual blocks in the model, showing the
order in which they execute.
For more information about virtual and nonvirtual blocks, see “Nonvirtual and Virtual
Blocks” in the Simulink documentation.
Properties
• List Title:
• Automatic: Generates a list or table title automatically.
• Custom: Enables you to enter a title.
• Include block type information: Include each block's BlockType property in the
list or table.
• Look under nonvirtual subsystems: The default is Automatic (On for
models, Off for systems). Set it to On or Off.
Insert Anything into Report?
Yes. List.
Class
rptgen_sl.csl_blk_sort_list
8-5
8
Components — Alphabetical List
See Also
Block Loop
8-6
Block Loop
Block Loop
Run child components for each block in the current system, model, or signal
Description
This component runs its child components for each block contained in the current system,
model, or signal.
For conditional processing based of blocks, you can use the
RptgenSL.getReportedBlock function. For more information, see “Loop Context
Functions” on page 6-24.
Report On
This pane describes the type of object on which this component operates.
• Automatic list from context: Report on all blocks in the current context. The
parent component of the Block Loop determines its context. If this component does not
have the Model Loop, System Loop, Signal Loop, or Block Loop as its parent,
selecting this option causes this component to report on all blocks in all models.
• Model Loop: Reports on all blocks in the current model.
• System Loop: Reports on all blocks in the current system.
• Signal Loop: Reports on all blocks connected to the current signal.
• Custom - use block list: Enables you to specify a list of blocks on which to report.
Enter the full path of each block.
Loop Options
Choose block sorting options and reporting options in this pane.
• Sort blocks:
Use this option to select how to sort blocks (applied to each level in a model):
• Alphabetically by block name. Sorts blocks alphabetically by their names.
8-7
8
Components — Alphabetical List
• Alphabetically by system name. Sorts systems alphabetically. The report
lists blocks in each system, but in no particular order.
• Alphabetically by full Simulink path. Sorts blocks alphabetically by
Simulink path.
• By block type. Sorts blocks alphabetically by block type.
• By block depth. Sorts blocks by their depth in the model.
• By layout (left to right): Sorts blocks by their location in the model
layout, by rows. The block appearing the furthest toward the left top corner of the
model is the anchor for the row. The row contains all other blocks that overlap
the horizontal area defined by the top and bottom edges of the anchor block. The
other rows use the same algorithm, using as the anchor the next unreported block
nearest the left top of the model.
• By layout (top to bottom): Sorts blocks by their location in the model
layout, by columns. The block appearing the furthest toward the left top corner
of the model is the anchor for the column. The column contains all other blocks
that overlap the vertical area defined by the left and right edges of the anchor
block. The other columns use the same algorithm, using as the anchor the next
unreported block nearest the left top of the model.
• By traversal order. Sorts blocks by traversal order.
• By simulation order. Sorts blocks by execution order.
• %<VariableName>: Inserts the value of a variable from the MATLAB workspace.
The %<> notation can denote a string or cell array. The following example reports
on the theta dot integrator block and the theta integrator block in the model
simppend, using the variable Z={ 'simppend/theta'}:
8-8
Block Loop
simppend/theta dot
%<Z>
The generated report includes information about the following blocks:
• simppend/theta dot
• simppend/theta
For more information, see %<VariableName> Notation on the Text component
reference page in the MATLAB Report Generator documentation.
• Search for Simulink property name/property value pairs: Reports only on
Simulink blocks with specified property name/property value pairs.
Section Options
• Create section for each object in loop: Inserts a section in the generated report
for each block found in the loop.
• Display the object type in the section title: Automatically inserts the object type
into the section title in the generated report.
• Create link anchor for each object in loop: Create a hyperlink to the block in the
generated report.
Insert Anything into Report?
Yes, inserts a section if you select the Create section for each object in loop option.
Class
rptgen_sl.csl_blk_loop
See Also
Model Loop, Signal Loop, System Loop, Simulink Linking Anchor, Simulink
Name, Simulink Property, Simulink Property Table, Simulink Summary Table
8-9
8
Components — Alphabetical List
Block Type Count
Count number of each block type in the current model or system
Description
This component counts the number of each block type in the current model or system.
Within a model, this component counts blocks underneath masks and inside library
links.
For more information about block types, see “Nonvirtual and Virtual Blocks” in the
Simulink documentation.
Count Types
The parent of this component determines where to count block types:
• Model Loop: Reports all block types in the current model:
• All blocks in model: Counts block types in the entire model.
• All blocks in reported systems: Counts block types only in systems that
appear in the report.
• System Loop: Reports all block types in the current system.
Table Content
• Table title: Allows you to enter the table title.
• Show block names in table: Includes a column that displays all block names in the
table.
• Sort table:
• Alphabetically by block type: Sorts blocks alphabetically by block type.
• By number of blocks: Sorts by decreasing number of occurrences.
• Show total count: Displays total number of block types.
8-10
Block Type Count
Insert Anything into Report?
Yes. Table.
Class
rptgen_sl.csl_blk_count
See Also
Block Loop, Model Loop, System Loop
8-11
8
Components — Alphabetical List
Bus
Create list of signals exiting from Bus Selector block
Description
This component creates a list of signals exiting a Bus Selector block. The list contains
signals leaving from the reported block or downstream buses and signals.
The parent of this component determines which buses appear in the report:
• Model Loop: Includes all buses in the current model.
• System Loop: Includes all buses in the current system.
• Block Loop : If the current block is a bus block, then the report includes that block.
• Signal Loop: Includes all buses connected to the current signal.
If the Bus component does not have a looping component as its parent, it reports on all
buses in all open models.
Properties
• Show Bus Hierarchy: Specifies whether the list displays downstream buses
hierarchically.
• Insert linking anchor for bus blocks: Inserts a linking anchor for each bus block.
This property designates the list item as the location to which other links for that
block point. (For more information, see the Simulink Linking Anchor or Link
component reference pages.) Do not use this option if you have already specified an
anchor location for the bus block with an Object Linking Anchor component.
• Insert linking anchor for signals: Inserts a linking anchor for each signal.
This property designates the list item as the location to which other links for that
signal point. For more information, see the Simulink Linking Anchor or Link
component reference pages.) Do not use this option if you have already specified an
anchor location for the signal with an Object Linking Anchor component.
• Title: Inserts a title before each list. This attribute supports the %<varname>
notation. For more information, see %<VariableName> Notation on the Text
component reference page in the MATLAB Report Generator documentation.
8-12
Bus
Insert Anything into Report?
Yes. List.
Class
rptgen_sl.csl_blk_bus
See Also
Block Loop, Model Loop, Signal Loop, Simulink Linking Anchor, System
Loop,
8-13
8
Components — Alphabetical List
Call Hierarchy
Create table showing call graph in source code
Description
This component creates a table showing the call hierarchy in your source code. For each
function call in your source code, the table displays the following information:
• Level of call hierarchy, where the function is called.
Each level is denoted by |. If a function call appears in the table as |||->
file_name.function_name, the function call occurs at the third level of the
hierarchy. Beginning from main or an entry point, there are three function calls
leading to the current call.
• File containing the function call.
In addition, the line and column is also displayed.
• File containing the function definition.
In addition, the line and column where the function definition begins is also
displayed.
In addition, the table also displays uncalled functions.
This table captures the information available on the Call Hierarchy pane in the
Polyspace user interface.
8-14
Chart Loop
Chart Loop
Run child components for specified Stateflow charts
Description
This component runs its children for specified Stateflow charts.
For conditional processing for a chart, you can use the RptgenSF.getReportedChart
function. For more information, see “Loop Context Functions” on page 6-24.
Report On
• Automatic list from context: Report on all chart blocks in the context set by the
parent of this component.
• Model Loop: Reports on all Stateflow chart blocks in the current model.
• System Loop: Reports on all Stateflow chart blocks in the current system.
• Signal Loop: Reports on all Stateflow chart blocks connected to the current
signal.
• Machine Loop: Reports on the current block if it is in a Stateflow chart.
If the Chart Loop component has any other type of component as its parent,
selecting this option causes it to report on all Stateflow chart blocks.
• Custom - use block list: Reports on a specified list of Stateflow chart blocks.
Loop Options
Choose chart block sorting options and reporting options in this pane.
• Sort blocks: Specifies how to sort blocks (applied to each level in a model). This
option is available if you select Automatic list from context in the Report On
section, or if you select Custom - use block list and the Sort blocks option.
• Alphabetically by block name. Sorts blocks alphabetically by name.
• Alphabetically by system name. Sorts systems alphabetically by name. Lists
blocks in each system, but in no particular order.
8-15
8
Components — Alphabetical List
• Alphabetically by full Simulink path. Sorts models alphabetically by
their full paths.
• By block type. Sorts blocks alphabetically by block type.
• By depth. Sorts blocks by their depth in the model.
• By layout (left to right): Sorts blocks by their location in the model
layout, by rows. The block appearing the furthest toward the left top corner of the
model is the anchor for the row. The row contains all other blocks that overlap
the horizontal area defined by the top and bottom edges of the anchor block. The
other rows use the same algorithm, using as the anchor the next unreported block
nearest the left top of the model.
• By layout (top to bottom): Sorts blocks by their location in the model
layout, by columns. The block appearing the furthest toward the left top corner
of the model is the anchor for the column. The column contains all other blocks
that overlap the vertical area defined by the left and right edges of the anchor
block. The other columns use the same algorithm, using as the anchor the next
unreported block nearest the left top of the model.
• By simulation order. Sorts blocks by execution order.
• %<VariableName>: Inserts the value of a variable from the MATLAB workspace.
The %<> notation can denote a string or cell array. For more information, see
%<VariableName> Notation on the Text component reference page in the
MATLAB Report Generator documentation.
• Search for Simulink property name/property value pairs: Reports on Simulink
blocks with specified property name/property value pairs.
• Search Stateflow: Reports on Stateflow charts with specified property name/
property value pairs.
8-16
Chart Loop
Section Options
• Create section for each object in loop: Inserts a section in the generated report
for each object found in the loop.
• Display the object type in the section title: Inserts the object type automatically
into the section title in the generated report.
• Create link anchor for each object in loop: Creates a hyperlink to the object in
the generated report
Insert Anything into Report?
Yes, inserts a section if you select the Create section for each object in loop option.
Class
rptgen_sf.csf_chart_loop
See Also
Block Loop, Machine Loop, Model Loop, Signal Loop, System Loop, Simulink
Function System Loop
8-17
8
Components — Alphabetical List
Code Generation Summary
Insert version number information, list of generated files, tables summarizing code
generation configuration information, and subsystem maps into report
Description
This component reports the following information:
• Version number information
• List of generated files
• Code generation configuration information
• Subsystem map
Summary
• General information: Includes the following information in the report:
• Model name and version
• Simulink Coder version number
• List of full paths of generated files
• Configuration settings: Includes tables that list optimization and Simulink Coder
target selection and build process Configuration Parameter settings.
• Subsystem map: Includes in the report a unique mapping between subsystem
numbers and subsystem labels in the model.
Traceability Report
Use settings from model: When you select this option, the report uses all of the
following configuration settings, as specified in your model. Deselecting this option allows
you to turn off one or more of these settings as needed:
• Eliminated/virtual blocks
• Traceable blocks
8-18
Code Generation Summary
• Traceable StateFlow Objects
• Traceable MATLAB Function Blocks
For more information on these configuration settings, see “Code Generation Pane:
Report” in the Simulink Coder documentation.
Insert Anything into Report?
Yes. Tables and list.
Class
RptgenRTW.CCodeGenSummary
See Also
Import Generated Code
8-19
8
Components — Alphabetical List
Code and Verification Information
Create table of verification times and code characteristics
Description
This component creates tables containing verification times and code characteristics such
as number of lines.
Properties
Include Verification Time Information
If you select this option, the report contains verification times broken down by phase.
• For Polyspace Bug Finder™, the phases are compilation, pass0, pass1, etc.
• For Polyspace Code Prover, the phases are compilation, global, function, etc.
Include Code Details
If you select this option, the report contains the following code characteristics:
• Number of files
• Number of lines
• Number of lines without comment
8-20
Code Metrics Details
Code Metrics Details
Create table of Polyspace metrics broken down by file and function
Description
This component creates a table containing metrics from a Polyspace project. If you select
the appropriate properties, the metrics appear broken down by file and function.
Properties
Project Metrics
If you select this option, the report contains the following metrics about the project:
• Number of direct recursions
• Number of files
• Number of headers
• Number of protected and unprotected shared variables
File Metrics
If you select this option, the report contains the following metrics about each file in the
project:
• Estimated function coupling
• Lines without comment
• Comment density
• Total lines
Function Metrics
If you select this option, the report contains the following metrics about each function in
the project:
8-21
8
Components — Alphabetical List
• Number of lines within body
• Number of executable lines
• Number of goto statements
• Number of call levels
• Number of called functions
• Number of call occurrences
• Number of function parameters
• Number of paths
• Number of return statements
• Number of instructions
• Cyclomatic complexity
• Language scope
• Number of calling functions
8-22
Code Metrics Summary
Code Metrics Summary
Create table of Polyspace metrics
Description
This component creates a table containing metrics from a Polyspace project. The metrics
are the same as those displayed under Code Metrics Details. However, the file and
function metrics are not broken down by individual files and functions. Instead, the table
provides the minimum and maximum value of a file metric over all files and a function
metric over all functions.
8-23
8
Components — Alphabetical List
Code Verification Summary
Create table of Polyspace analysis results
Description
This component creates tables containing the following results:
• Number of results
• Number of coding rule violations for each coding rule type such as MISRA C®
• Number of defects, for Polyspace Bug Finder results
• Number of checks of each color, for Polyspace Code Prover results
• Whether the project passed or failed the software quality objective
Properties
Include Checks from Polyspace Standard Library Stub Functions
Unless you deselect this option, the tables contain Polyspace Code Prover checks that
appear in Polyspace stubs for the standard library functions.
8-24
Coding Rules Details
Coding Rules Details
Create table of coding rule violations broken down by file
Description
This component creates tables containing coding rule violations broken down by each
file in the Polyspace project. For each rule violation, the table contains the following
information:
• Rule number
• Rule description
• Function containing the violation
• Line and column number
• Review information such as classification, status and comments
Properties
Select Coding Rules Type
Using this option, you can choose which coding rule violations to display. You can display
violations for the following set of coding rules:
• MISRA C rules
• MISRA® AC AGC rules
• MISRA C++ rules
• JSF® C++ rules
• Custom coding rules
Display by
Using this option, you can break down the display of coding rule violations by file.
8-25
8
Components — Alphabetical List
Coding Rules Summary
Create table with number of coding rule violations
Description
This component creates a table containing the number of coding rule violations. You can
choose whether to break this information down by rule number or file.
Properties
Select Coding Rules Type
Using this option, you can choose which coding rule violations to display. You can display
violations for the following set of coding rules:
• MISRA C rules
• MISRA AC AGC rules
• MISRA C++ rules
• JSF C++ rules
• Custom coding rules
Include Files/Rules with No Problems Detected
If you select this option, the table displays:
• Files containing no coding rule violations
• Rules that your code does not violate
Display by
Using this option, you can break down the display of coding rule violations by:
• Rule number
8-26
Coding Rules Summary
• File
8-27
8
Components — Alphabetical List
Configuration Parameters
Create table of analysis options and coding rules
Description
This component creates two tables:
• Polyspace Settings: The analysis options that you used to obtain your results. The
table lists command-line version of the options along with their values.
• Coding Rules Configuration: The coding rules whose violations you checked for. The
table lists the rule number, rule description and other information about the rules.
8-28
Defects Summary
Defects Summary
Create table of Polyspace Bug Finder defects
Description
This component creates a table of Polyspace Bug Finder defects. From this table, you can
see the number of defects of each type.
Properties
Include Checkers with No Defects Detected
If you select this option, the table includes all defects that Polyspace Bug Finder detects,
including those that do not occur in your code.
8-29
8
Components — Alphabetical List
Documentation
Insert text extracted from DocBlock blocks in Simulink models
Description
This component inserts text extracted from DocBlock blocks in Simulink models. It can
have the following components as its parent:
• Model Loop
• System Loop
• Block Loop
The specified report format determines the format of the DocBlock block data inserted
into the report:
• HTML: Imports HTML data into the report.
Note: For non-English HTML DocBlock text that you want to include in a
Documentation component, use UTF-8 file encoding. Use a simple text editor to create
the HTML code.
• RTF: Imports RTF data into the report.
Properties
• Import file as: Specifies how to format the imported information. The following
example shows how each option works, using the following text as input:
First row.
Second row.
Third row follows blank line.
• Plain text (ignore line breaks). Imports plain text without any line
breaks (no paragraphs), as in this example:
First row. Second row. Third row follows blank line.
8-30
Documentation
• Paragraphs defined by line breaks. Imports the text contained in
paragraphs defined by line breaks (hard returns or carriage returns), as in this
example:
First row.
Second row.
Third row follows blank line.
• Paragraphs defined by empty rows. Imports text contained in paragraphs
defined by empty rows (rows that do not contain text), as in this example:
First row. Second row.
Third row follows blank line.
• Text (retain line breaks). Imports plain text, including line breaks, as in
this example:
First row.
Second row.
Third row follows blank line.
• Fixed-width text (retain line breaks). Imports fixed-width text (all
letters have the same width or size) including line breaks, as in this example:
First row.
Second row.
Third row follows blank line.
Tip This option is useful for importing MATLAB files.
• Insert linking anchor for blocks: Inserts a linking anchor for each DocBlock
block that designates the location where other links for that block point. (See the
Simulink Linking Anchor or Link component reference pages for more help.) Do
not use this option if you have already specified an anchor location for a DocBlock
block with an Object Linking Anchor component.
8-31
8
Components — Alphabetical List
Insert Anything into Report?
Yes. Text, paragraph, or external RTF/HTML data.
Class
rptgen_sl.csl_blk_doc
See Also
Block Loop, Model Loop, Simulink Linking Anchor, System Loop
8-32
Fixed Point Block Loop
Fixed Point Block Loop
Run child components for the Simulink model, system, or signal defined by parent
component
Description
This component runs its children for the Simulink model, system, or signal that its
parent defines. Options for the parent component are:
• Model Loop
• System Loop
• Signal Loop
Report On
• Automatic list from context: Reports on all fixed-point blocks in the context of the
parent of this component. For example, if the parent component is the System Loop,
then this component reports on all fixed-point blocks in the current system. If this
component does not have a looping component as its parent, then selecting this option
causes the component to report on all fixed-point blocks in all models.
• Custom - use block list:: Reports on a specified list of blocks.
Loop Options
Choose block sorting options and reporting options in this pane.
• Sort blocks: Specifies how to sort blocks (applied to each level in a model). This
option is available if you select the Automatic list from context option in
the Report On section, or if you select Custom - use block list and the Sort
blocks options.
• Alphabetically by block name. Sorts blocks alphabetically by name.
• Alphabetically by system name. Sorts systems alphabetically. Lists blocks
in each system, but in no particular order.
8-33
8
Components — Alphabetical List
• Alphabetically by full Simulink path. Sorts blocks alphabetically by
Simulink path.
• By block type. Sorts blocks alphabetically by block type.
• By block depth. Sorts blocks by their depth in the model.
• By layout (left to right): Sorts blocks by their location in the model
layout, by rows. The block appearing the furthest toward the left top corner of the
model is the anchor for the row. The row contains all other blocks that overlap
the horizontal area defined by the top and bottom edges of the anchor block. The
other rows use the same algorithm, using as the anchor the next unreported block
nearest the left top of the model.
• By layout (top to bottom): Sorts blocks by their location in the model
layout, by columns. The block appearing the furthest toward the left top corner
of the model is the anchor for the column. The column contains all other blocks
that overlap the vertical area defined by the left and right edges of the anchor
block. The other columns use the same algorithm, using as the anchor the next
unreported block nearest the left top of the model.
• By traversal order. Sorts blocks by traversal order.
• By simulation order. Sorts blocks by execution order.
• %<VariableName>: Inserts the value of a variable from the MATLAB workspace.
For more information, see %<VariableName> Notation on the Text component
reference page in the MATLAB Report Generator documentation.
• Search for Simulink name/property value pairs: Reports only on blocks with the
specified property name/property value pairs. To enable searching, click the check
box. In the first row of the property name and property value table, click inside the
8-34
Fixed Point Block Loop
edit box, delete the existing text, and type the property name and value. To add a row,
use the Add row button (
).
For information about subsystem property names and values, in “Block-Specific
Parameters”, see the “Ports & Subsystems Library Block Parameters” section.
Section Options
• Create section for each object in loop: Inserts a section in the generated report
for each object found in the loop.
• Display the object type in the section title: Inserts the object type automatically
into the section title in the generated report.
• Create link anchor for each object in loop: Creates a hyperlink to the object in
the generated report.
Insert Anything into Report?
Yes, inserts a section if you select the Create section for each object in loop option.
Class
rptgen_fp.cfp_blk_loop
See Also
Block Loop, Model Loop, Signal Loop, Simulink Linking Anchor, System Loop
8-35
8
Components — Alphabetical List
Fixed Point Logging Options
Set fixed-point options like in Fixed Point Tool
Description
This component sets fixed-point options like those set in the Fixed Point Tool (invoked by
running the fxptdlg function).
This component must be a child of the Model Loop component. Use this component to
set the following options on the current model:
• Data type override
• Fixed-point instrument mode
• Logging type
This component can have child components. It is a good practice to use this component
with a Model Simulation component as its child. This approach sets fixed-point
properties for the model for the purpose of the simulation, and then restores them to
their original values after the simulation is complete.
Data Type Override
• Use local settings: Overrides data types according to the value of this parameter
set for each subsystem. Otherwise, settings for parent systems override those of child
systems.
• Scaled double: Overrides the output data type of all blocks in the current system
or subsystem with doubles. However, this option maintains the scaling and bias
specified in the mask of each block.
• Doubles: Overrides the output data type of all blocks in the current system or
subsystem with doubles. The overridden values have no scaling or bias.
• Singles: Overrides the output data type of all blocks in the current system or
subsystem with singles. The overridden values have no scaling or bias.
• Off: Does not perform any data type override on any block in the current system or
subsystem.
8-36
Fixed Point Logging Options
Fixed-Point Instrumentation Mode
Specify logging options in this section. For logged blocks, minimum and maximum
simulation values are written to the workspace.
• Use local settings: Logs data according to the value of this parameter set for each
subsystem. Otherwise, settings for parent systems always override those of child
systems.
• Min, max, and overflow: Logs minimum value, maximum value, and overflow data
for all blocks in the current system or subsystem.
• Overflow only: Logs only overflow data for all blocks in the current system or
subsystem.
• Force off: Logs no data for any block in the current system or subsystem. Use this
selection to work with models containing fixed point-enabled blocks, if you do not have
a Fixed-Point Designer license.
For more information on logging simulation results, see “Propose Fraction Lengths Using
Simulation Range Data” in the Fixed-Point Designer documentation.
Logging Type
Specify how to record logs in this section:
• Overwrite log: Clears information in the logs before new logging data is entered.
• Merge log: Merges new logging data with previously logged information.
Insert Anything into Report?
No.
Class
rptgen_fp.cfp_options
8-37
8
Components — Alphabetical List
See Also
Model Simulation
8-38
Fixed Point Property Table
Fixed Point Property Table
Insert table that reports on Fixed-Point Designer block property name/property value
pairs
Description
This component inserts a table that reports on Fixed-Point Designer block property
name/property value pairs.
Table
Select a preset table, which is already formatted and configured, in the preset table list
in the upper-left corner of the attributes page.
• preset table
Specifies the type of object property table.
• Default
• Mask properties
• Block limits
• Out-of-range errors
• All fixed-point properties
• Blank 4x4
To apply the specified table, select the table and click Apply.
• Split property/value cells: Split property name/property value pairs into separate
cells. For the property name and property value to appear in adjacent horizontal cells
in the table, select the Split property/value cells check box. In this case, the table is
in split mode, so there only one property name/property value pair can exist in a cell.
If there is more than one name/property pair in a cell, only the first pair appears in
the report. The report ignores all subsequent pairs.
For the property name and property value to appear together in one cell, clear the
Split property/value cells check box. That option specifies nonsplit mode. Nonsplit
mode supports more than one property name/property value pair and text.
8-39
8
Components — Alphabetical List
Before switching from nonsplit mode to split mode, make sure that there is only one
property name/property value pair per table cell. If you have more than one property
name/property value pair or text in one cell, only the first value pair appears in the
report. Subsequent pairs and text are omitted.
• Display outer border: Display the outer border of the table in the generated report.
Table Cells
Select table properties to modify. The selection in this pane affects the available fields in
the Cell Properties pane.
Cell Properties
• Contents
Modify the contents of the table cell selected in the Table Cells pane.
• Show as: Specifies the format for the contents of the table cell.
• PROPERTY Value
• Value
• Property Value
• Property: Value
• PROPERTY: Value
• Property - Value
• PROPERTY - Value
• Alignment: Aligns the contents of the table cell.
• Center
• Left
• Right
• Double justified
• Lower border: Displays the lower border of the table in the generated report.
• Right border: Displays the right border of the table in the generated report.
8-40
Fixed Point Property Table
Creating Custom Tables
To create a custom table, edit a preset table, such as the Blank 4x4 table. Add and
delete rows and add properties. To open the Edit Table dialog box, click Edit.
For details about creating custom property tables, see “Property Table Components” on
page 6-6.
Insert Anything into Report?
Yes. Table.
Class
rptgen_fp.cfp_prop_table
See Also
Fixed Point Summary Table
8-41
8
Components — Alphabetical List
Fixed Point Summary Table
Table of specified fixed-point block properties or parameters
Description
This component displays properties or parameters of specified fixed-point blocks in a
table.
Properties
Table title
Choose a table title in the generated report:
• Automatic: Generates a title automatically from the parameter.
• Custom: Specifies a custom title.
Property Columns
Property name
This field displays the object properties to include in the Summary Table in the
generated report.
• To add a property:
1
Select the appropriate property level in the menu
2
Select the property to add from the selection list and click Add.
• To delete a property, select the property name and click the Delete button.
• To move properties up and down in the list, click the Up and Down buttons.
Note: Some entries in the list of available properties (such as Depth) are “virtual”
properties that you cannot access using the get_param command. The properties used
8-42
Fixed Point Summary Table
for property/value filtering in the block and system loop components must be retrievable
by the get_param. Therefore, you cannot configure your Summary Table to report on all
blocks of Depth == 2.
Transpose table
Enabling this check box changes the summary table rows into columns in the generated
report, putting the property names in the first column and the values in the other
columns.
Object Rows
• Insert anchor for each row: Inserts an anchor for each row in the summary table.
• Report On: Specifies blocks on which to report:
• Automatic list from context. Reports on all blocks in the current context.
• Custom - use block list. Reports on a specified list of blocks. To include a
given block in the report, specify its full path.
Loop Options
• Sort blocks: Specifies how to sort blocks (applied to each level in a model):
• Alphabetically by block name. Sorts blocks alphabetically by name.
• Alphabetically by system name. Sorts systems alphabetically. Lists blocks
in each system, but in no particular order.
• Alphabetically by full Simulink path. Sorts blocks alphabetically by
Simulink path.
• By block type. Sorts blocks alphabetically by block type.
• By block depth. Sorts blocks by their depth in the model.
• By layout (left to right): Sorts blocks by their location in the model
layout, by rows. The block appearing the furthest toward the left top corner of the
model is the anchor for the row. The row contains all other blocks that overlap
the horizontal area defined by the top and bottom edges of the anchor block. The
8-43
8
Components — Alphabetical List
other rows use the same algorithm, using as the anchor the next unreported block
nearest the left top of the model.
• By layout (top to bottom): Sorts blocks by their location in the model
layout, by columns. The block appearing the furthest toward the left top corner
of the model is the anchor for the column. The column contains all other blocks
that overlap the vertical area defined by the left and right edges of the anchor
block. The other columns use the same algorithm, using as the anchor the next
unreported block nearest the left top of the model.
• By traversal order. Sorts blocks by traversal order.
• By simulation order. Sorts blocks by execution order.
• Search for Simulink property name/property value pairs: Reports only on
Simulink blocks with specified property name/property value pairs.
Insert Anything into Report?
Yes. Table.
Class
rptgen_fp.cfp_summ_table
See Also
Fixed Point Property Table
8-44
Import Generated Code
Import Generated Code
Import source and header files generated by Simulink Coder software, and custom files
specified as part of model
Description
This component imports source and header files generated by Simulink Coder software.
It also imports custom files that you specify as part of your model.
Properties
• Source files (auto-generated): Includes the following files in the report:
• .c and .cpp source files generated by Simulink Coder software.
• Simulink Coder source files, such as the setup file and supporting files in the build
folder.
This check box is selected by default. Clear it to omit source files.
• Header files (auto-generated): Includes the following files in the report:
• .h and .hpp header files generated by Simulink Coder software.
• Simulink Coder header files in the build folder.
This check box is selected by default. Clear it to omit source files.
• Custom files: Includes custom source files that you specify in the Code Generation
> Custom Code pane of the Configuration Parameters dialog box. This check box is
deselected by default.
Insert Anything into Report?
Yes. Generated code listings.
8-45
8
Components — Alphabetical List
Class
RptgenRTW.CImportCode
See Also
Code Generation Summary
8-46
Look-Up Table
Look-Up Table
Report on lookup table blocks
Description
The Look-Up Table component reports on the following blocks in the Simulink Lookup
Tables library. Some examples of the lookup table blocks include:
• 1-D Lookup Table
• n-D Lookup Table
• Cosine
• Interpolation Using Prelookup
• Direct Lookup Table (n-D)
The Look-Up Table component inserts a figure and/or table into the report. The table
contains input and output numeric values. A figure plots these values.
Note: The Look-Up Table component does not display a table or plot for the Direct
Lookup Table (n-D) block if the block is configured to generate the table during
simulation as a block input. Instead, the Look-Up Table displays a note in the report to
the effect that the table is generated dynamically during simulation.
Look-Up Table Options
This pane allows you to specify the types of lookup table blocks to include in the report
and how they appear. If you select none of the check boxes in this pane, the component
does not insert anything into the report.
• The Look-Up Table displays results according to the type of its parent component:
• Model Loop: Includes all lookup tables in the current model.
• System Loop: Includes all lookup tables in the current system.
• Block Loop: If the current block is a lookup table, the reports that block.
• Signal Loop: Includes all lookup tables connected to the current signal.
8-47
8
Components — Alphabetical List
• If the Look-Up Table does not have any of the looping components as its parent, it
includes all lookup tables in all open models.
• Plot 1-D data: Plots data from a 1-D Lookup Table block. Choose the plot type,
Line plot or Bar plot, from the corresponding list. The input data appears on the
horizontal or x-axis, and the output data appears on the vertical or y-axis.
For more information on line and bar plots, see “2-D and 3-D Plots” in the MATLAB
Graphics documentation.
• Create table for 1-D data: Creates a table that contains numeric data values from
the 1-D Lookup Table block.
• Plot 2-D data: Creates a plot of 2-D Lookup Table blocks. You can specify whether
the data appears as a surface plot or a line plot. The line plot is best for small data
sets, and the surface plot for larger tables. For more information on surface and line
plots, see “2-D and 3-D Plots” in the MATLAB Graphics documentation.
Note: This option creates a 2-D slice through n-D data.
• Create table for 2-D data: Creates a table that contains numeric data values from
the 2-D Lookup Table block.
• Create table for N-D data: Creates a table that contains numeric data values from
the n-D Lookup Table block.
Print Options
• Image file format: Specifies the image file format. Select Automatic HG Format
(the default) to choose automatically the format best suited for the output format that
you chose in the Report component. Otherwise, choose an image format that your
output viewer can read.
• Automatic SL Format (Uses the Simulink file format selected in the Preferences
dialog box)
• Bitmap (16m-color)
• Bitmap (256-color)
• Black and white encapsulated PostScript
• Black and white encapsulated PostScript (TIFF)
• Black and white encapsulated PostScript2
8-48
Look-Up Table
• Black and white encapsulated PostScript2 (TIFF)
• Black and white PostScript
• Black and white PostScript2
• Color encapsulated PostScript
• Color encapsulated PostScript (TIFF)
• Color encapsulated PostScript2
• Color encapsulated PostScript2 (TIFF)
• Color PostScript
• Color PostScript2
• JPEG high quality image
• JPEG medium quality image
• JPEG low quality image
• PNG 24-bit image
• TIFF - compressed
• TIFF - uncompressed
• Windows metafile
• Paper orientation:
• Landscape
• Portrait
• Rotated
• Use figure orientation: Uses the orientation for the figure, which you set
with the orient command.
• Full page image (PDF only): In PDF reports, scales images to fit the full
page, minimizes page margins, and maximizes the size of the image by using
either a portrait or landscape orientation.
For more information about paper orientation, see the orient command in the
MATLAB documentation.
• Image size: Allows you to specify the image size in the report by selecting Use
figure PaperPositionMode setting and setting the PaperPositionMode
property of the Handle Graphics figure.
8-49
8
Components — Alphabetical List
• Automatic (same size as on screen):
• Custom: Specifies a custom image size. Set the image size using the Size field and
Units list.
For more information on paper position mode, see orient in the MATLAB
documentation.
• Size: Allows you to enter the size of the Handle Graphics figure snapshot in the
format wxh (width times height). This field is active only if you choose Custom in the
Image size list box.
• Units: Allows you to enter for the size of the Handle Graphics figure snapshot. This
field is active only if you choose Custom in the Image size list box.
• Invert hardcopy: Causes the Handle Graphics InvertHardcopy property to invert
colors for printing. In other words, this option changes dark colors to light colors and
light colors to dark colors. To change colors in your image, choose one of the following
options:
• Automatic: Automatically changes a dark axes colors to light axes colors. If the
axes color is a light color, this option does not invert the color.
• Invert: Changes dark axes colors to light axes colors, and light axes colors to dark
axes colors.
• Don't invert: Does not change the colors in the image that appears on the
screen for printing.
• Use figure's InvertHardcopy setting: Uses the InvertHardcopy
property set in the Handle Graphics image.
• Make figure background transparent: Makes the image background
transparent.
Display Options
• Scaling: Controls size of the image, as displayed in a browser. Making an image
larger using this option does not affect the storage size of the image, but the quality
of the displayed image may decrease as you increase or decrease the size of the
displayed image.
Generally, to achieve the best and most predictable display results, use the default
setting of Use image size.
8-50
Look-Up Table
• Use image size: Causes the image to appear the same size in the report as on
screen (default).
• Fixed size: Specifies the number and type of units.
• Zoom: Specifies the percentage, maximum size, and units of measure.
• Size: Specifies the size of the snapshot in the form w h (width, height) format. This
field is active only if you choose Fixed size in the Scaling selection list.
• Max size: Specifies the maximum size of the snapshot in the form w h (width,
height). This field is active only if you choose Zoom from the Scaling selection list.
• Units: Allows you to enter units for the size of the snapshot. This field is active only if
you choose Zoom or Fixed size in the Image size list box.
• Alignment: Only reports in PDF or RTF format support this property.
• Auto
• Right
• Left
• Center
• Title: Enter text to appear above the snapshot.
• Caption: Enter text to appear under the snapshot.
Insert Anything into Report?
Yes. Figure and/or table.
Class
rptgen_sl.csl_blk_lookup
See Also
Block Loop, Model Loop, Signal Loop, System Loop
8-51
8
Components — Alphabetical List
Machine Loop
Run child components for specified Stateflow machines
Description
This component runs its child components for selected Stateflow machines. The behavior
of this component depends on its parent component. If it has no parent, the Machine
Loop runs its child components for all machines. If it has the Model Loop is its parent,
it runs its child components for all machines in the model.
Loop Options
Search Stateflow
If selected, searches states that you specify in the field that appears under the check box.
Section Options
• Create section for each object in loop: Inserts a section in the generated report
for each object in the loop.
• Display the object type in the section title: Inserts the object type automatically
into the section title in the generated report.
• Create link anchor for each object in loop: Creates a hyperlink to each object in
the loop.
Insert Anything into Report?
Yes, inserts a section if you select the Create section for each object in loop option.
Class
rptgen_sf.csf_machine_loop
8-52
Machine Loop
See Also
Model Loop
8-53
8
Components — Alphabetical List
Missing Requirements Block Loop
Apply all child components to blocks that do not have requirements
Description
This component runs its child components for each block in the current system, model, or
signal that do not have associated requirements.
For more information on working with looping components, see “Logical and Looping
Components” on page 6-21.
Report On
This pane describes the type of object on which this component operates.
• Automatic list from context: Report on all blocks in the current context that do not
have associated requirements. The parent component of the Block Loop component
determines its context. If this component does not have the Model Loop, System
Loop, Signal Loop, or Block Loop as its parent, selecting this option causes
this component to report on all blocks in all models that do not have associated
requirements.
• Model Loop: Reports on all blocks in the current model with no associated
requirements.
• System Loop: Reports on all blocks in the current system with no associated
requirements.
• Signal Loop: Reports on all blocks connected to the current signal with no
associated requirements.
• Custom - use block list: Enables you to specify a list of blocks on which to report.
Enter the full path of each block.
Loop Options
Choose block sorting options and reporting options in this pane.
• Sort blocks:
8-54
Missing Requirements Block Loop
Use this option to select how to sort blocks (applied to each level in a model):
• Alphabetically by block name: Sorts blocks alphabetically by their names.
• Alphabetically by system name: Sorts systems alphabetically. Lists the
blocks in each system, but in no particular order.
• Alphabetically by full Simulink path: Sorts blocks alphabetically by
Simulink path.
• By block type: Sorts blocks alphabetically by block type.
• By block depth: Sorts blocks by their depth in the model.
• By layout (left to right): Sorts blocks by their location in the model
layout, by rows. The block appearing the furthest toward the left top corner of the
model is the anchor for the row. The row contains all other blocks that overlap
the horizontal area defined by the top and bottom edges of the anchor block. The
other rows use the same algorithm, using as the anchor the next unreported block
nearest the left top of the model.
• By layout (top to bottom): Sorts blocks by their location in the model
layout, by columns. The block appearing the furthest toward the left top corner
of the model is the anchor for the column. The column contains all other blocks
that overlap the vertical area defined by the left and right edges of the anchor
block. The other columns use the same algorithm, using as the anchor the next
unreported block nearest the left top of the model.
• By traversal order. Sorts blocks by traversal order.
• By simulation order. Sorts blocks by execution order.
• %<VariableName>: Inserts the value of a variable from the MATLAB workspace.
The %<> notation can denote a string or cell array. The following example reports
8-55
8
Components — Alphabetical List
on the theta dot integrator block and the theta integrator block in the model
simppend, using the variable Z={ 'simppend/theta'}:
simppend/theta dot
%<Z>
The generated report includes information about the following blocks:
• simppend/theta dot
• simppend/theta
For more information, see %<VariableName> Notation on the Text component
reference page in the MATLAB Report Generator documentation.
• Search for Simulink property name/property value pairs: Reports only on
Simulink blocks with specified property name/property value pairs that do not have
associated requirements.
Section Options
• Create section for each object in loop: Inserts a section in the generated report
for each block found in the loop.
• Display the object type in the section title: Automatically inserts the object type
into the section title in the generated report.
• Create link anchor for each object in loop: Create a hyperlink to the block in the
generated report.
Insert Anything into Report?
Yes, inserts a section if you select the Create section for each object in loop option.
Class Name
RptgenRMI.NoReqBlockLoop
8-56
Missing Requirements Block Loop
See Also
Block Loop, Missing Requirements System Loop, Requirements Block Loop,
Requirements Documents Table, Requirements Signal Loop, Requirements
Summary Table, Requirements System Loop, Requirements Table
8-57
8
Components — Alphabetical List
MATLAB Function
Insert information about MATLAB Function block contents
Description
This component displays tables with information about MATLAB code included in
MATLAB Function blocks. You specify which of the following kinds of information to
include in the report:
• Function properties — Parameter settings for the MATLAB Function block
• Argument properties — Properties of the function arguments (for example,
complexity)
• The function script — MATLAB code of the function
• Function symbol data — Information about the user-defined and (optionally) built-in
MATLAB variables and functions invoked by the MATLAB function that computes
the block outputs.
• Supporting functions — User-defined functions and, optionally, MATLAB functions
that are included in the MATLAB Function block function.
For details about MATLAB Function blocks, see the MATLAB Function block reference
page.
Use the MATLAB Function component within a section, paragraph, or table.
Note: To view the contents of a MATLAB Function block in a Web viewer, use the Web
view feature of the Simulink Report Generator. In the Web view, hover your cursor over
the MATLAB Function block. For details, see “Model Web Views”.
Function Properties Table
• Include function properties: Generates a table with function property information.
• Table title: Insert a title for the function properties table.
• Automatic: Use the default title for the table.
• Custom: Use the title that you specify for the table.
8-58
MATLAB Function
• You can change the header text for property and value columns of the function
properties table. In the Header column, double-click to change the header text. The
Width column indicates the relative width, in relative terms, based on the smallest
width you specify. For example, for a three-column table, if the first column width
is 1, and the column width of the other two columns is 3, then the second and third
columns is three times wider than the first column.
• Grid lines: Show grid lines for the table.
• Spans page width: Make the table as wide as the page.
Argument Summary Table
• Include argument summary table: Generate a table with summary information
about the MATLAB Function block function arguments.
• Table title: Insert a title for the argument summary table.
• Automatic: Use the default title for the table.
• Custom: Use the title that you specify for the table.
• Argument Summary Table Options: Specify the property columns to include in the
table.
• To add a property column:
1
In the table on the right, select a property near where you want to insert the
new property column.
2
From the list of properties to the left of the table, select a property that you
want to add to the table.
3
Click the left-arrow button.
4
If necessary, use the up or down arrow button to position the new column.
• To delete a property column, select the property in the table and click the rightarrow button
• You can change the header text for property and value columns of the table. In
the Header column, double-click to change the header text. The Width column
indicates the relative width, in relative terms, based on the smallest width you
specify. For example, for a three-column table, if the first column width is 1, and
the column width of the other two columns is 3, then the second and third columns
is three times wider than the first column.
8-59
8
Components — Alphabetical List
• Grid lines: Show grid lines for the table.
• Spans page width: Make the table as wide as the page.
• Column alignment: Align the text in each column:
• Left
• Center
• Right
• Double justified
Detailed Argument Report
• Include detailed argument report: Generate a table with detailed information
about the MATLAB Function block function arguments.
• Argument Property Table Format Options: Specify the argument property
columns to include in the table.
• Table title: Insert a title for the argument properties table.
• Automatic: Use the default title for the table.
• Custom: Use the title that you specify for the table.
• You can change the header text for property and value columns of the table. In the
Header column, double-click to change the header text.
• Grid lines: Show grid lines for the table.
• Spans page width: Make the variable table as wide as the page on which the
table appears.
• Include function script: Include the script for the function.
• Include function symbol data: Generate a table that includes information about
the user-defined and (optionally) built-in MATLAB variables and functions invoked by
the MATLAB function that computes the block outputs.
• Highlight script syntax: Use colors to highlight syntax keywords.
• Include supporting functions: Include a list of functions invoked directly or
indirectly by the function script. If you specify to include supporting functions in the
report, also specify whether to include both MATLAB and user-defined functions or
just user-defined functions.
• Supporting Function Table Format Options:
8-60
MATLAB Function
• Table title: Insert a title for the supporting functions table.
• Automatic: Use the default title for the table.
• Custom: Use the title that you specify for the table.
• You can change the header text for property and value columns of the table. In
the Header column, double-click to change the header text. The Width column
indicates the relative width, in relative terms, based on the smallest width you
specify. For example, for a three-column table, if the first column width is 1, and
the column width of the other two columns is 3, then the second and third columns
is three times wider than the first column.
• Grid lines: Show grid lines for the table.
• Spans page width: Make the table as wide as the page.
Insert Anything into Report?
Yes. Tables and, optionally, code.
Class
rptgen_sl.csl_emlfcn
See Also
Stateflow Property
8-61
8
Components — Alphabetical List
Missing Requirements System Loop
Loop only on systems and subsystems that do not have associated requirements
Description
This component runs its child components for each system or subsystem defined by the
parent component that does not have associated requirements. Insert this component
as the child of a Model Loop component to include systems and subsystems that do not
have any associated requirements in the report.
Report On
• Loop on Systems:
• Select systems automatically: Reports on all systems in the current context
that do not have associated requirements.
• Model Loop: Reports on systems in the current model.
• System Loop: Reports on the current system.
• Signal Loop: Reports on the parent system of the current signal.
• Block Loop: Reports on the parent system of the current block.
If this component does not have any of these components as its parent, selecting
this option reports on all systems in all models that do not have associated
requirements.
• Custom - use system list: Reports on a list of specified systems. Specify the full path
of each system.
• %<VariableName>: Inserts the value of a variable from the MATLAB workspace.
The %<> notation can denote a string or cell array. For more information, see
%<VariableName> Notation on the Text component reference page.
Loop Options
• Sort Systems: Specifies how to sort systems.
8-62
Missing Requirements System Loop
• Alphabetically by system name (default): Sorts systems alphabetically by
name.
• By number of blocks in system: Sorts systems by number of blocks. The
list shows systems by decreasing number of blocks. In other words, it shows the
system with the largest number of blocks that do not have requirements appears
first in the list.
• By system depth: Sorts systems by their depth in the model.
• By traversal order: Sorts systems in the traversal order.
• Search for: Reports only on blocks with the specified property name/property value
pairs. To enable searching, click the check box. In the first row of the property name
and property value table, click inside the edit box, delete the existing text, and type
the property name and value. To add a row, use the Add row button (
).
For information about subsystem property names and values, in “Block-Specific
Parameters”, see the “Ports & Subsystems Library Block Parameters” section.
Section Options
• Create section for each object in loop: Inserts a section in the generated report
for each object found in the loop.
• Display the object type in the section title: Inserts the object type automatically
into the section title in the generated report.
• Number sections by system hierarchy: Hierarchically numbers sections in the
generated report. Requires that Sort Systems be set to By traversal order.
• Create link anchor for each object in loop: Creates a hyperlink to the object in
the generated report.
Insert Anything into Report?
Yes, inserts a section if you select the Create section for each object in loop option.
8-63
8
Components — Alphabetical List
Class
RptgenRMI.NoReqSystemLoop
See Also
Block Loop, Missing Requirements Block Loop, Requirements Block Loop,
Requirements Documents Table, Requirements Signal Loop, Requirements
Summary Table, Requirements System Loop, Requirements Table, System Loop
8-64
Model Advisor Report
Model Advisor Report
Insert Model Advisor report or link to Model Advisor report for current model
Description
This component inserts a Model Advisor report for the current model into the report
if the report is in HTML format. For other report formats, it inserts a link to a Model
Advisor report for the current model. For more information about Model Advisor reports,
see “Save and View Model Advisor Reports” in the Simulink documentation.
Properties
Use existing report: Includes an existing Model Advisor report in the report. This
check box is selected by default. Clearing this option generates a new Model Advisor
report.
Insert Anything into Report?
Yes, a Model Advisor report.
Class
rptgen_sl.CModelAdvisor
See Also
Model Change Log
8-65
8
Components — Alphabetical List
Model Change Log
Construct model history table that displays model revision information
Description
Run this component before you run the Model Simulation component. It uses a
reported model's ModifiedHistory parameter to construct a model history table that
displays information about each logged revision to the model. This model history table
includes:
• The author of each change
• The model version of the change
• The time and date of the change
• A description of the change
For more information on model history, see “Log Comments History” in the Simulink
documentation.
Tip If your model has a long revision history, consider limiting the number of revisions
reported.
Table Columns
Choose the information displayed in the model revision table in this section:
• Author name: Includes the name of the person who last revised the model.
• Version: Includes the version number of the model.
• Date changed: Includes the revision date of the model.
• Description of change: Includes a description of the revision to the model.
Table Rows
• Limit displayed revisions to: Limits the number of revisions that appears in the
report.
8-66
Model Change Log
• Show revisions since date: Limits the number of revisions that appears in the
report by date. Enter the date in the corresponding text field. This field supports
%<varname> notation. For example, the default value, %<datestr(now-14)>,
returns revision history for the last two weeks.
Table Display
Choose how the model revision history table appears in this section.
• Table title: Specifies the title of the table.
• Sort order: Sorts the table entries from most recent to oldest, or from oldest to most
recent.
• Date format: Specifies a preferred date format for the date/time stamps in the table.
Insert Anything into Report?
Yes. Table.
Class
rptgen_sl.csl_mdl_changelog
See Also
Model Advisor Report
8-67
8
Components — Alphabetical List
Model Configuration Set
Insert active configuration set of a model into a report
Description
This component displays a table with the active configuration set for the model.
For information about configurations sets, see “Manage a Configuration Set”.
Display Options
• Title: Specifies a title for the table in the generated report.
• Automatic: Generates a title automatically from the parameter.
• Custom: Specifies a custom title.
• None: Uses no title.
• Show configuration set table grids: Show grid lines for the table.
• Make configuration set tables page wide: Make the table as wide as the page.
Insert Anything into Report?
Yes. Table.
Class
rptgen_sl.csl_mdl_cfgset
See Also
Model Loop, System Loop
8-68
Model Loop
Model Loop
Loop on Simulink models and systems, as specified by child components
Description
This component loops on Simulink models and systems, as specified by child components.
For example, you can use a Model Loop with a child System Loop to report on the
subsystems of the specified system.
Consider making these components children of the Model Loop (although the Model
Loop not necessarily required to be the immediate parent of a given component).
For conditional processing based of blocks, you can use the
RptgenSL.getReportedBlock function. For more information, see “Loop Context
Functions” on page 6-24.
Models to Include
You can add a model to the list by clicking Add New Model to List. The following table
shows the buttons you can use to move a model up or down in the list, or to add or delete
a model.
Button
Action
Move a model up in the list.
Move a model down in the list.
Remove a model from the list.
Add a new model to the list.
8-69
8
Components — Alphabetical List
Model Options
• Active: Includes a given model in the loop. This option is selected by default. Clearing
this option omits the model from the loop.
This option allows you to temporarily omit one or more models from a report.
• Model name: Specifies the model name.
• Current block diagram
• All open models
• All open libraries
• Block diagrams in current directory
• Custom block diagram: Selecting this option automatically sets the Starting
system(s) field $top to start in the model root system.
• %<VariableName>: For more information, see %<VariableName> Notation
on the Text component reference page in the MATLAB Report Generator
documentation.
• Traverse model: Specifies the systems to traverse.
• All systems in model
• Selected system(s) only
• Selected system(s) and ancestors
• Selected system(s) and children
• Look under masks: Specifies how to handle masks.
• Functional masks only
• No masks
• All masks
• Graphical masks only
For more information, see “Block Masks” in the Simulink documentation.
• Follow library links: Specifies library links to include.
• Do not follow library links
• Include library links
8-70
Model Loop
• Include unique library links
For more information, see “Work with Library Links ” in the Simulink documentation.
• Model reference: Specifies whether to report on models referenced by a Model block.
If you want to report on referenced models, then you can control the depth of the
model referencing hierarchy and whether to report on model reference variants.
• Do not follow model reference blocks: Do not report on blocks contained
in referenced models.
• Follow all model reference blocks: Report on blocks contained in all
models that any part of the model hierarchy references.
• Follow model reference blocks defined in current model: Report on
blocks in models that the currently selected model references.
• <Custom model reference depth>: Report on blocks in models that your
specified level in the model reference hierarchy references.
• Include all variants: Report on all model reference variants. To enable this option,
set the Model reference option to report on blocks in referenced models.
• Starting system(s): Specifies the system in which to start the loop. Available options
depend on the value that you select in the Traverse model option. Selecting any
option other than All systems in model for Traverse model activates the
Starting system(s) option.
If you do not enter a model name in the Model name option, then select either Root
model or Current to specify where to start the loop.
If you specify a model name in the Model name option, then the Starting system(s)
option provides an edit box in which you can enter:
• The full path of a subsystem or subsystems
• $top to start the loop in the model root system
• $current to start the loop in the currently selected system
Section Options
• Create section for each object in loop: Inserts a section in the generated report
for each object found in the loop.
8-71
8
Components — Alphabetical List
• Display the object type in the section title: Inserts the object type automatically
into the section title in the generated report.
• Create link anchor for each object in loop: Creates a hyperlink to the object in
the generated report.
Examples
Generating Reports on Specified Systems and their Subsystems
This example shows how to loop over a specified system and its subsystems in the sample
model sldemo_auto_climate_elec, which the Simulink software includes.
1
(Optional) To open the sldemo_auto_climate_elec model, at the MATLAB
command prompt, enter the following command:
sldemo_auto_climate_elec
Explore the model to familiarize yourself with its subsystems.
2
Open the Report Explorer.
3
Create a report setup file by clicking File > New.
4
Save the report setup file by clicking File > Save As. Give it the name
sldemo_auto_report.
5
Add a Chapter/Subsection component to the report setup file to include
information about model subsystems:
6
8-72
a
In the Library pane in the middle, double-click Chapter/Subsection to add it
to the report setup file.
b
For Title, choose Custom. In the title field, enter Description of
subsystems.
Add a Model Loop as a child of the Chapter/Subsection component. This
loops over the ClimateControlSystem system and its subsystems in the
sldemo_auto_climate_elec model:
a
In the Library pane in the middle, double-click Model Loop to add it to the
report setup file. By default, the Report Explorer adds that component as a child
of the Chapter/Subsection component.
b
In the Model Loop properties pane, from the Model name selection list, select
<Custom block diagram> .
Model Loop
c
In the Model name field, delete the text <Custom block diagram>, and then
enter sldemo_auto_climate_elec.slx. Click any component in the report
setup file to add this model to the Models to include list.
d
In the Traverse model selection list, select Selected system(s) and
children.
e
In the Look under masks selection list, select All masks.
f
In the Model reference selection list, select Do not follow model
reference blocks.
g
In the Starting system(s) field, enter sldemo_auto_climate_elec/
ClimateControlSystem. Because you selected Selected system(s)
and children for Traverse model, the Model Loop loops over
sldemo_auto_climate_elec/ClimateControlSystem and its subsystems.
h
Under Section Options, select the Create section for each object in loop
check box. Selecting this option creates separate sections in the generated report
for each model over which the component loops.
The Model Loop properties pane looks as follows.
8-73
8
Components — Alphabetical List
7
Save the report by clicking File > Save.
8
Add a System Loop as a child of the Model Loop component.
9
8-74
a
In the Library pane in the middle, double-click System Loop to add it to the
report setup file. By default, Model Explorer adds this component as a child of
the Model Loop component.
b
In the System Loop properties pane, under Section Options, select the
Create section for each object in loop check box. Selecting this option
creates a section in the generated report for each subsystem on which the
component loops. Accept the default values for all other fields.
Add a System Snapshot component as a child of the System Loop component.
This step creates snapshots of all the subsystems of ClimateControlSystem
in the generated report. In the Library pane in the middle, double-click System
Snapshot. By default, Model Explorer adds this component as a child of the System
Loop component.
Model Loop
10 Save the report.
The report setup file hierarchy now looks as follows.
11 Run the report by clicking File > Report.
The report loops on the system ClimateControlSystem of the
sldemo_auto_climate_elec model and all of its subsystems, as shown in the
following Message List.
8-75
8
Components — Alphabetical List
Below is an excerpt from the generated report.
8-76
Model Loop
Temporarily Omitting a Model from a Loop
This example shows how to use the Model Loop Active check box to temporarily
omit a model from the loop. This example uses the report setup file that you
created in Generating Reports on Specified Systems and their Subsystems,
sldemo_auto_report.rpt, and the model f14, which the Simulink software includes.
1
In the Report Explorer, click File > Open, and then open
sldemo_auto_report.rpt by double-clicking it.
8-77
8
Components — Alphabetical List
2
3
In the Outline pane on the left, click Model Loop Section 1 sldemo_auto_climate_elec.
In the Model Loop properties pane, click the
Models to include list.
button to add a model to the
4
In the Model Loop properties pane, from the Model name selection list, select
<Custom block diagram>.
5
In the Model name field, delete the text <Custom block diagram> and enter
f14.mdl.
The Model Loop properties pane now looks as follows.
8-78
6
Save the report setup file.
7
Generate the report.
Model Loop
The report generation process loops over the specified systems in the f14 and
sldemo_auto_climate_elec models, as shown in the following message box.
Below is an excerpt from the generated report.
8-79
8
Components — Alphabetical List
8
In the Models to include list, click f14 to select it.
9
Clear the Active check box to omit f14 model information from the generated
report.
10 Rerun the report.
The report now includes information only on the sldemo_auto_climate_elec
model, as shown at the end of the previous example, Generating Reports on Specified
Systems and their Subsystems.
8-80
Model Loop
11 To reactivate the f14 model, in the Model Loop Models to include list, select the
f14 model and then select the Active check box.
Insert Anything into Report?
Yes, inserts a section if you select the Create section for each object in loop option.
Class
rptgen_sl.csl_mdl_loop
See Also
Block Loop, System Loop
8-81
8
Components — Alphabetical List
Model Simulation
Run current model with specified simulation parameters
Description
This component runs the current model using specified simulation parameters. Ensure
that this component has the Model Loop component as its parent.
For more information on simulation parameters, see “Configure Simulation Conditions”
in the Simulink documentation.
I/O Parameters
Use model's workspace I/O variable names
Use the names of the parameters specified in the Simulation Parameters dialog box.
The following options are available if you do not select the Use model's workspace I/O
variable names option:
• Time : Specifies a new variable name for the Time parameter.
• States: Specifies a new variable name for the States parameter.
• Output: Specifies a new variable name for the Output parameter.
Timespan
Use model's timespan values: Use the model's Start time and Stop time values,
as specified in the Solver tab in the Simulation Parameters dialog box.
The following options are available if you do not select the Use model's timespan
values option:
• Start: Specifies a simulation starting time.
• Stop: Specifies a simulation ending time.
8-82
Model Simulation
Note: If you set the stop time of your model to inf (infinity) in Simulink or on
this component attribute page, Simulink Report Generator terminates the model
simulation after 60 seconds. Terminating the report prevents the report generation
process from entering an infinite loop.
Simulation Options
• Compile model before simulation: Compiles the model before simulating,
preserving scope content. Select this option if:
• You use Simulink Coder Summary properties.
• You sort systems or blocks by simulation order.
• You use scope snapshots.
• Simulation status messages: Displays simulation status messages, or inserts them
into the report.
• Display to command line: Sends messages to a command-line window.
• Display to Report Generator Message List: Sends messages to the
Simulink Report Generator message window.
• Insert into report: Includes messages in the report.
• Simulation parameters: Specifies simulation parameters.
Insert Anything into Report?
No.
Class
rptgen_sl.csl_mdl_sim
See Also
Model Loop
8-83
8
Components — Alphabetical List
Object Loop
Run child components for Stateflow objects, and then insert table into report
Description
This component runs its child components for each Stateflow object and inserts a table
into the generated report.
For conditional processing of Stateflow objects, you can use the
RptgenSF.getReportedObject function. For more information, see “Loop Context
Functions” on page 6-24.
Object Types
• Report on “Data” objects: Includes Stateflow data objects in the loop.
• Report on “Event” objects: Includes Stateflow event objects in the loop.
• Report on “Transition” objects: Includes Stateflow transition objects in the loop.
• Report on “Junction” objects: Includes Stateflow junction objects in the loop.
• Report on “Target” objects: Includes Stateflow target objects in the loop.
• Report on “Note” objects: Includes Stateflow note objects in the loop.
Loop Options
• Report depth: Specifies the level at which to loop:
• Local children only (Default). Reports only on children one level down.
• All objects. Reports on all Stateflow objects.
• Skip autogenerated charts under truth tables: Excludes autogenerated charts
under truth tables from the report.
• Remove objects which do not contain more information than a snapshot:
Excludes objects that contain only a snapshot.
• Search Stateflow: Reports on Stateflow charts with specified property name/
property value pairs.
8-84
Object Loop
Section Options
• Create section for each object in loop: Inserts a section in the generated report
for each object found in the loop.
• Display the object type in the section title: Automatically inserts the object type
into the section title in the generated report.
• Create link anchor for each object in loop: Creates a hyperlink to the Stateflow
object in the generated report.
Insert Anything into Report?
Yes, inserts a section if you select the Create section for each object in loop option.
Class
rptgen_sf.csf_obj_loop
See Also
Stateflow Filter, Stateflow Hierarchy, Stateflow Hierarchy Loop,
Simulink Function System Loop
8-85
8
Components — Alphabetical List
Recursive Functions
Create table of recursive functions
Description
This component creates a table containing the recursive functions in your source code.
For each recursive function, the table lists its immediate caller.
8-86
Report Customization (Filtering)
Report Customization (Filtering)
Create filters that apply to your Polyspace reports
Description
This component allows you to filter unwanted information from existing Polyspace report
templates. To apply global filters, place this component immediately below the node
representing the report name.
Properties
Code Metrics Filters
The properties in table below apply to the inclusion of code metrics in your report.
Property
Purpose
User Action
Include Project Metrics
Choose whether to include
metrics about your
Polyspace project.
Select the check box to
include project metrics.
Project metrics to
include
Specify project metrics to
include or exclude from
report.
Enter a regular MATLAB
expression.
Include File Metrics
Choose whether to include
per file metrics in report.
Select the check box to
include per file metrics.
File Metrics > Files to
include
Specify files to include or
exclude when reporting file
metrics.
Enter a regular MATLAB
expression.
File metrics to include
Specify file metrics to
include or exclude from
report.
Enter a regular MATLAB
expression.
Include Function Metrics Choose whether to include
per function metrics in
report.
Select the check box to
include per function metrics.
8-87
8
Components — Alphabetical List
Property
Purpose
User Action
Function Metrics > Files
to include
Specify files to include or
exclude when reporting
function metrics.
Enter a regular MATLAB
expression.
Functions to include
Specify functions to include Enter a regular MATLAB
or exclude when reporting
expression.
function metrics.
Function metrics to
include
Specify function metrics
to include or exclude from
report.
Enter a regular MATLAB
expression.
Coding Rules Filters
The properties in table below apply to the inclusion of coding rule violations in your
report.
Property
Purpose
User Action
Files to include
Specify files to include or
exclude when reporting
coding rule violations.
Enter a regular MATLAB
expression.
Coding rule numbers to
include
Specify coding rules to
include or exclude when
reporting coding rule
violations.
Enter a regular MATLAB
expression.
Classifications to include Specify classifications to
include or exclude when
reporting coding rule
violations.
Enter a regular MATLAB
expression.
Status types to include
Specify statuses to include
or exclude when reporting
coding rule violations.
Enter a regular MATLAB
expression.
Run-time Check Filters
The properties in table below apply to the inclusion of Polyspace Code Prover checks in
your report.
8-88
Report Customization (Filtering)
Property
Purpose
Red Checks
Specify whether to include red checks in
your report. Red checks indicate proven
run-time errors.
Gray Checks
Specify whether to include gray checks
in your report. Gray checks indicate
unreachable code.
Orange Checks
Specify whether to include orange checks
in your report. Orange checks indicate
possible run-time errors.
Green Checks
Specify whether to include green checks in
your report. Green checks indicate that an
operation does not contain a specific runtime error.
Inspection Point Checks
Specify whether to include inspection point
checks in your report. These checks allow
an user to find the values that a variable
can take at a certain point in the code.
Unreachable Functions
Specify whether to include unreachable
functions in your report.
Advanced Filters
The properties in table below apply to the inclusion of metrics, coding rule violations and
Polyspace Code Prover checks in your report.
Property
Purpose
User Action
Justification status
Choose whether to report
only justified checks, only
unjustified checks or all
checks.
Choose an option from the
dropdown list.
Files to include
Specify files to include or
exclude from your report.
Enter a regular MATLAB
expression.
Check types to include
Specify Polyspace Code
Prover checks to include in
your report.
Enter a regular MATLAB
expression.
8-89
8
Components — Alphabetical List
Property
Purpose
Function names to
include
Specify functions to include Enter a regular MATLAB
or exclude from your report. expression.
Classification types to
include
Specify classifications to
Enter a regular MATLAB
include or exclude from your expression.
report.
Status types to include
Specify statuses to include Enter a regular MATLAB
or exclude from your report. expression.
Comments to include
Specify comments to include Enter a regular MATLAB
or exclude from your report. expression.
More About
•
8-90
“Regular Expressions”
User Action
Requirements Block Loop
Requirements Block Loop
Apply child components to blocks with requirements
Description
This component applies its child components to blocks with associated requirements.
Report On
• Automatic list from context: If selected, this option reports on all blocks in
the current context. The parent of the Requirements Block Loop component
determines its context.
• Model Loop: Reports on all blocks with requirements in the current model.
• System Loop: Reports on all blocks with requirements in the current system.
• Signal Loop: Reports on all blocks with requirements connected to the current
signal.
If the Requirements Block Loop does not have the Model Loop, System Loop,
Signal Loop, or Block Loop component as its parent, it reports on all blocks in all
models.
• Custom - use block list: Reports on a list of blocks with specified requirements.
Enter the full paths of each block into this field.
Loop Options
• Sort blocks
Specify how to sort blocks (applied to each level in a model):
• Alphabetically by block name: Sorts blocks alphabetically by name.
• Alphabetically by system name: Sorts systems and subsystems
alphabetically by name. (Blocks in each system do not appear in alphabetical
order).
8-91
8
Components — Alphabetical List
• Alphabetically by full Simulink path: Sorts blocks alphabetically by
Simulink path.
• By block type: Sorts blocks alphabetically by block type.
• By block depth: Sorts blocks by their depth in the model.
• By layout (left to right): Sorts blocks by their location in the model
layout, by rows. The block appearing the furthest toward the left top corner of the
model is the anchor for the row. The row contains all other blocks that overlap
the horizontal area defined by the top and bottom edges of the anchor block. The
other rows use the same algorithm, using as the anchor the next unreported block
nearest the left top of the model.
• By layout (top to bottom): Sorts blocks by their location in the model
layout, by columns. The block appearing the furthest toward the left top corner
of the model is the anchor for the column. The column contains all other blocks
that overlap the vertical area defined by the left and right edges of the anchor
block. The other columns use the same algorithm, using as the anchor the next
unreported block nearest the left top of the model.
• By traversal order: Sorts blocks by traversal order.
• By simulation order: Sorts blocks by execution order.
• Search for Simulink property name/property value pairs: Reports on Simulink
blocks with specified property name/property value pairs that have associated
requirements.
8-92
Requirements Block Loop
Section Options
• Create section for each object in loop: Inserts a section in the generated report
for each block found in the loop that has associated requirements.
• Display the object type in the section title: Inserts the object type automatically
into the section title in the generated report.
• Create link anchor for each object in loop: Creates a hyperlink to the block in
the generated report.
Insert Anything into Report?
Yes, inserts a section if you select the Create section for each object in loop option.
Class
RptgenRMI.CBlockLoop
See Also
Missing Requirements Block Loop, Missing Requirements System Loop,
Model Loop, Requirements Block Loop, Requirements Documents Table,
Requirements Signal Loop, Requirements Summary Table, Requirements
System Loop, Requirements Table
8-93
8
Components — Alphabetical List
Requirements Documents Table
Insert table of linked requirements documents
Description
This component creates a table that lists all requirements documents linked to model
objects.
Table Options
• Show documents linked to
• Simulink and Stateflow objects: Inserts requirements documents linked to
both Simulink and Stateflow objects in the model.
• Simulink objects: Inserts requirements documents linked only to Simulink
objects in the model.
• Stateflow objects: Inserts requirements documents linked only to Stateflow
objects in the model.
• Table title: Specifies a title for the table.
• No title
• Model name (Default)
• Custom
Table Columns
• Replace document paths with links: Inserts links to requirements documents
when possible.
• When replacing with links, note absolute vs. relative file path: Indicates
absolute or relative file paths when including links to requirements documents.
• Include document modification time: Includes the document modification
information.
8-94
Requirements Documents Table
• Count # references to each document: Includes a count of the number of
references to the requirements document in the model.
Document References
• Replace file names with document IDs in the main body of the report:
Includes shortened IDs to identify requirements documents to simplify the
requirements documents table.
• Retrieve full module path for DOORS links (requires login): This option
applies only to DOORS® requirements. Append the DOORS module ID to the module
path in the DOORS database if the module information is not stored with the model.
Insert Anything into Report?
Yes. Table.
Class
RptgenRMI.ReqDocTable
See Also
, Requirements Summary Table, Requirements Table
8-95
8
Components — Alphabetical List
Requirements Signal Loop
Apply all child components to signal groups with requirements
Description
The Requirements Signal Loop component applies all child components to signal groups
that have requirements in Signal Builder blocks.
Properties
• Create link anchor for each object in loop: Creates a hyperlink to each object
with requirements in the loop.
• Display the object type in the section title: Inserts the object name with
requirements into the section title.
• Create section for each object in loop: Creates a hyperlink to each object with
requirements in the loop.
• Section Type: Specifies the section type to insert. If you choose Automatic, the
Simulink Report Generator software determines the appropriate section type:
• Book
• Chapter
• Section 1
• Section 2
• Section 3
• Section 4
• Section 5
• Simple Section
• Automatic
Report On
Loops on signal groups in systems:
8-96
Requirements Signal Loop
• Collect all Signal Builders: Processes all Signal Builder blocks, looking for
signal groups with requirements.
• Custom - use list: Processes all subsystems in the user-defined list. If a
subsystem on the list does not have requirements, the Simulink Report Generator
software does not include it in the report.
Insert Anything into Report?
Yes, inserts a section if you select the Create section for each object in loop option.
Class
RptgenRMI.CSystemLoop
See Also
Missing Requirements Block Loop, Missing Requirements System Loop,
Requirements Block Loop, Requirements Documents Table, Requirements
Summary Table, Requirements System Loop, Requirements Table, Signal Loop
8-97
8
Components — Alphabetical List
Requirements Summary Table
Properties of blocks, systems, or Stateflow objects with associated requirements
Description
This component displays properties of blocks, systems, or Stateflow objects with
associated requirements.
Object Type
Choose the object type to display in the generated report.
• Block (Default)
• System
• Stateflow
The selected object type affects the options available in the Property Columns pane.
Table Title
Specify a table title in the generated report.
• Automatic: Generates a title automatically from the parameter.
• Custom: Specifies a custom title.
Property Columns
• Object properties to include in the Requirements Summary Table appear in a list.
• To add a property:
1
Select the appropriate property level in the text box on the left.
2
In the text box on the right, select the property that you want to add and click
Add.
• To delete a property, select the property name and click Delete.
8-98
Requirements Summary Table
%<SplitDialogParameters> is a unique property that you can specify for
Requirements Summary Tables where the object type is Block. This property
generates multiple summary tables, grouped by block type. Each Summary Table
group contains the dialog box parameters for that block.
Some entries in the list of available properties (such as Depth) are “virtual”
properties that you cannot access using the get_param command. The properties
used for property/value filtering in the block and System Loop components must be
retrievable by the get_param. Therefore, you cannot configure your Requirements
Summary Table to report on all blocks of Depth == 2.
• Remove empty columns: Removes empty columns from the table.
• Transpose table: Changes the summary table rows into columns in the generated
report, putting the property names in the first column and the values in the other
columns.
Object Rows
• Insert anchor for each row: Inserts an anchor for each row in the Requirements
Summary Table.
• Report On
• Automatic list from context: Reports on all blocks in the current context.
The parent of this component determines its context.
• Custom - use block list: Reports on a list of blocks that you specify, and
enters the block names in the corresponding field. Specify the full path of each
block.
Loop Options
Choose block sorting options and reporting options in this pane.
• Sort blocks: Use this option to select how to sort blocks (applied to each level in a
model):
• Alphabetically by block name: Sorts blocks alphabetically by name.
• Alphabetically by system name. Sorts systems alphabetically. Lists blocks
in each system, but in no particular order.
8-99
8
Components — Alphabetical List
• Alphabetically by full Simulink path: Sorts blocks alphabetically by
Simulink path.
• By block type: Sorts blocks alphabetically by block type.
• By block depth: Sorts blocks by their depth in the model.
• By layout (left to right): Sorts blocks by their location in the model
layout, by rows. The block appearing the furthest toward the left top corner of the
model is the anchor for the row. The row contains all other blocks that overlap
the horizontal area defined by the top and bottom edges of the anchor block. The
other rows use the same algorithm, using as the anchor the next unreported block
nearest the left top of the model.
• By layout (top to bottom): Sorts blocks by their location in the model
layout, by columns. The block appearing the furthest toward the left top corner
of the model is the anchor for the column. The column contains all other blocks
that overlap the vertical area defined by the left and right edges of the anchor
block. The other columns use the same algorithm, using as the anchor the next
unreported block nearest the left top of the model.
• By traversal order: Sorts blocks by traversal order.
• By simulation order: Sorts blocks by execution order.
• Search for Simulink property name/property value pairs: Reports on blocks
with specified property name/property value pairs.
Insert Anything into Report?
Yes. Table.
8-100
Requirements Summary Table
Class
RptgenRMI.CSummaryTable
See Also
Block Loop, Missing Requirements Block Loop, Missing Requirements
System Loop, Requirements Block Loop, Requirements Documents Table,
Requirements Signal Loop, Requirements System Loop, Requirements Table
8-101
8
Components — Alphabetical List
Requirements System Loop
Apply child components to systems with requirements
Description
This component applies its child components to systems with associated requirements.
Report On
• Loop on systems
• Select systems automatically: If selected, this option reports on all systems
in the current context. The parent of the component determines the context of this
setting:
• Model Loop: Reports on systems in the current model.
• System Loop: Reports on the current system.
• Signal Loop: Reports on the parent system of the current signal.
• Block Loop: Reports on the parent system of the current block.
If the Requirement System Loop does not have any of these components as
its parent, selecting this option reports on all systems with requirements in all
models.
• Custom - use system list: Reports on a list of specified systems. Enter the
full path of each system.
Loop Options
• Sort Systems:
• Alphabetically by system name (default): Sorts systems alphabetically by
name.
• By number of blocks in system: Sorts systems by the number of blocks in
the system. The list displays systems by decreasing number of blocks; the system
with the largest number of blocks appears first in the list.
8-102
Requirements System Loop
• By system depth: Sorts systems by their depth in the model.
• By traversal order: Sorts systems in the traversal order .
• Search for: Reports on Simulink blocks with specified property name/property value
pairs.
Section Options
• Create section for each object in loop: Inserts a section in the generated report
for each object found in the loop.
• Display the object type in the section title: Inserts the object type automatically
into the section title in the generated report.
• Number sections by system hierarchy: Numbers sections in the generated report
hierarchically. Requires that Sort Systems be set to By traversal order.
• Create link anchor for each object in loop: Creates a hyperlink to the object in
the generated report.
Insert Anything into Report?
Yes, inserts a section if you select the Create section for each object in loop option.
Class
RptgenRMI.CSystemLoop
See Also
Missing Requirements Block Loop, Missing Requirements System Loop,
Requirements Block Loop, Requirements Documents Table, Requirements
Signal Loop, Requirements Summary Table, Requirements Table, System Loop
8-103
8
Components — Alphabetical List
Requirements Table
Requirements links for current context
Description
This component creates a table that contains information from the Simulink Verification
and Validation software. Objects can have multiple requirements. Each requirement is a
row in the table.
Table Options
• Show requirements for current: Specifies the object type to display.
• Simulink object
• Stateflow object
• Table title: Specifies a title for the table.
• No title
• Object name (Default)
• Custom
Table Columns
• Description: Includes the object description in the table.
• Document name: Includes the report name in the table.
• Locations within document: Includes the locations of the object within the
document in the table.
• Requirement keyword: Includes the requirement keyword for the object in the
table.
Insert Anything into Report?
Yes. Table.
8-104
Requirements Table
Class
RptgenRMI.CReqTable
See Also
Missing Requirements Block Loop, Missing Requirements System Loop,
Requirements Block Loop, Requirements Documents Table, Requirements
Signal Loop, Requirements Summary Table, Requirements System Loop,
Stateflow Automatic Table, Stateflow Name
8-105
8
Components — Alphabetical List
Run-time Checks Details Ordered by Color/File
Create overrides for global filters in Polyspace reports
Description
This component adds detailed information about the run-time checks to your report. This
component can also be used to override global filters in specific chapters of your report.
Use the following workflow when using filters in your report:
1
To create filters that apply to all chapters of your report, use the Report
Customization (Filtering) component. For more information, see Report
Customization (Filtering).
2
To override some of the filters in individual chapters, use the Run-time Checks
Details Ordered by Color/File component. Select the Override Global Report
filter box.
Properties
Categories To Include
The properties in table below apply to the inclusion of Polyspace Code Prover checks in
your report.
8-106
Property
Purpose
Red Checks
Specify whether to include red checks in
your report. Red checks indicate proven
run-time errors.
Gray Checks
Specify whether to include gray checks
in your report. Gray checks indicate
unreachable code.
Orange Checks
Specify whether to include orange checks
in your report. Orange checks indicate
possible run-time errors.
Run-time Checks Details Ordered by Color/File
Property
Purpose
Green Checks
Specify whether to include green checks in
your report. Green checks indicate that an
operation does not contain a specific runtime error.
Inspection Point Checks
Specify whether to include inspection point
checks in your report. These checks allow
an user to find the values that a variable
can take at a certain point in the code.
Unreachable Functions
Specify whether to include unreachable
functions in your report.
Advanced Filters
The properties in table below apply to the inclusion of metrics, coding rule violations and
Polyspace Code Prover checks in your report.
Property
Purpose
User Action
Justification status
Choose whether to report
only justified checks, only
unjustified checks or all
checks.
Choose an option from the
dropdown list.
Files to include
Specify files to include or
exclude from your report.
Enter a regular MATLAB
expression.
Check types to include
Specify Polyspace Code
Prover checks to include in
your report.
Enter a regular MATLAB
expression.
Function names to
include
Specify functions to include Enter a regular MATLAB
or exclude from your report. expression.
Classification types to
include
Specify classifications to
Enter a regular MATLAB
include or exclude from your expression.
report.
Status types to include
Specify statuses to include Enter a regular MATLAB
or exclude from your report. expression.
Comments to include
Specify comments to include Enter a regular MATLAB
or exclude from your report. expression.
8-107
8
Components — Alphabetical List
Run-time Checks Details Ordered by Review
Information
Create table with Polyspace Code Prover checks ordered by review information
Description
This component creates tables displaying the Polyspace Code Prover checks in your code.
All checks with same combination of Classification and Status appear in the same
table.
8-108
Run-time Checks Summary Ordered by File
Run-time Checks Summary Ordered by File
Create table with Polyspace Code Prover checks ordered by file
Description
This component creates a table displaying the number of Polyspace Code Prover checks
per file in your code.
Properties
Sort the data
Use this option to sort the rows in the table alphabetically by filename or by percentage
of unproven code.
Display as
Use this option to display the number of checks in a table or in bar charts.
Display ratio of checks in a file
Select this option to display the number of checks of a certain color as a ratio of total
number of checks in the file.
Include checks from Polyspace standard library stub functions
Select this option to include the checks from Polyspace standard library stub functions in
your display.
8-109
8
Components — Alphabetical List
Scope Snapshot
Insert images of scopes and XY graphs
Description
This component inserts images of scopes and XY graphs. Examples of blocks for which
this component inserts snapshots include:
• Scope (and Floating Scope) blocks and the XY Graph block (Simulink)
• Spectrum Analyzer and Time Scope blocks (DSP System Toolbox™)
• Video Viewer (Computer Vision System Toolbox™)
• Blocks in the Simulink Control Design™ Linear Analysis Plots library (for example,
the Bode Plot block)
If the model has not been simulated, scopes are empty. For more information, see the
Model Simulation component reference page.
The parent component of the Scope Snapshot determines its behavior.
• Model Loop or no Simulink looping component: Includes all XY graphs and
scopes in the current model.
• System Loop: Includes all XY graphs and scopes in the current system.
• Block Loop: Includes the current block when it is an XY graph or scope.
• Signal Loop: Includes all XY graphs and scopes connected to the current signal.
If the Scope Snapshot does not have any of the Simulink looping components as its
parent, it includes all XY graphs and scopes in all open models.
Scope Options
• Report on closed scopes: Takes a snapshot of all scopes in context. This option
forces closed scopes to open when the report is generating.
• Autoscale time axis: Scales the Simulink scope time axis to include the entire log.
8-110
Scope Snapshot
Print Options
• Image file format: Specifies the image file format (for example, JPEG, TIFF, etc.).
Select Automatic HG Format (the default) to choose the format best suited for the
specified output format automatically. Otherwise, choose an image format that your
output viewer can read.
• Automatic HG Format (uses the Simulink file format selected in the Preferences
dialog box)
• Bitmap (16m-color)
• Bitmap (256-color)
• Black and white encapsulated PostScript
• Black and white encapsulated PostScript (TIFF)
• Black and white encapsulated PostScript2
• Black and white encapsulated PostScript2 (TIFF)
• Black and white PostScript
• Black and white PostScript2
• Color encapsulated PostScript
• Color encapsulated PostScript (TIFF)
• Color encapsulated PostScript2
• Color encapsulated PostScript2 (TIFF)
• Color PostScript
• Color PostScript2
• JPEG high quality image
• JPEG medium quality image
• JPEG low quality image
• PNG 24-bit image
• TIFF - compressed
• TIFF - uncompressed
• Windows metafile
• Paper orientation:
8-111
8
Components — Alphabetical List
• Landscape
• Portrait
• Rotated
• Use figure orientation: Uses the orientation for the figure, which you set
with the orient command.
• Full page image (PDF only): In PDF reports, scales images to fit the full
page, minimizes page margins, and maximizes the size of the image by using
either a portrait or landscape orientation.
For more information about paper orientation, see the orient reference page in the
MATLAB documentation.
• Image size: Specifies the size of the Handle Graphics figure snapshot in the form [w
h] (width, height). In the units text box, select one of the following options:
• Inches
• Centimeters
• Points
• Normalized
• Invert hardcopy: Inverts colors for printing; changes dark colors to light colors and
light colors to dark colors.
• Automatic: Automatically changes dark axes colors to light axes colors. If the
axes color is a light color, this option does not invert the color.
• Invert: Changes dark axes colors to light axes colors and light axes colors to dark
axes colors.
• Don't invert: Does not change the colors in the image on the screen for printing.
• Use figure's InvertHardcopy setting: Uses the InvertHardcopy
property set in the Handle Graphics image.
• Make figure background transparent: Makes the image background
transparent.
8-112
Scope Snapshot
Display Options
• Scaling: Controls size of the image, as displayed in a browser. Making an image
larger using this option does not affect the storage size of the image, but the quality
of the displayed image may decrease as you increase or decrease the size of the
displayed image.
Generally, to achieve the best and most predictable display results, use the default
setting of Use image size.
• Use image size: Causes the image to appear the same size in the report as on
screen (default).
• Fixed size: Specifies the number and type of units.
• Zoom: Specifies the percentage, maximum size, and units of measure.
• Size: Specifies the size of the snapshot in the form w h (width, height). This field is
active only if you choose Fixed size from the Scaling selection list.
• Max size: Specifies the maximum size of the snapshot in the form w h (width,
height). This field is active only if you choose Zoom from the Scaling selection list.
• Units: Specifies the units for the size of the snapshot. This field is active only if you
choose Zoom or Fixed size in the Image size list box.
• Alignment: Only reports in PDF or RTF format support this property.
• Auto
• Right
• Left
• Center
• Title: Specifies a title for the snapshot figure.
• Block name: Uses the block name as the title.
• Full Simulink path name: Uses the Simulink path as the title.
• Custom: Specifies a custom title.
• Caption: Select or enter a short text description for the snapshot figure.
• No caption
• Automatic (use block description). Uses the Simulink block description as
the caption.
8-113
8
Components — Alphabetical List
• Custom. Specifies a short text description for the snapshot figure.
Insert Anything into Report?
Yes. Image.
Class
rptgen_sl.csl_blk_scope
See Also
Block Loop, Model Loop, Signal Loop, System Loop
8-114
Signal Loop
Signal Loop
Run child components for each signal contained in current system, model, or block
Description
The Signal Loop component runs its child components for each signal contained in the
current system, model, or block. The parent component determines the behavior of this
component.
• Model Loop: Loops on all signals in the current model.
• System Loop: Loops on all signals in the current system. Choose not to report on
the following types of signals by clearing the corresponding option in the Section
options area:
• System input signals
• System output signals
• System internal signals
• Signal Loop: Loops on the current signal.
• Block Loop : Loops on all signals connected to the current block. Choose not to
report on the following types of signals by clearing the corresponding option in the
Section options area:
• Block input signals
• Block output signals
• If the Signal Loop does not have a looping component as its parent, it loops on all
signals in all models. Choose not to report on the following types of signals by clearing
the corresponding option in the Section options area:
• Block input signals
• Block output signals
• System input signals
• System output signals
• System internal signals
8-115
8
Components — Alphabetical List
For conditional processing of signals, you can use the RptgenSL.getReportedSignal
function. For more information, see “Loop Context Functions” on page 6-24.
Select Signals
• Include block input signals: Loops on signals that feed into blocks. This option is
valid only when the parent component of this component is aBlock Loop.
• Include block output signals: Loops on signals that leave the block. This option is
valid only when the parent component of this component is aBlock Loop.
• Include system input signals: Loops on signals coming from inports. This option is
valid only when the parent component of this component is aSystem Loop.
• Include system internal signals: Loops on system internal signals. This option is
valid only when the parent component of this component is aSystem Loop.
• Include system output signals: Loops on signals going to outports. This option is
valid only when the parent component of this component is aSystem Loop.
• Sort signals: Specifies how to sort signals:
• Alphabetically by signal name: Sorts signals alphabetically by name.
• Alphabetically by signal name (exclude empty): Sorts signals
alphabetically by name.
• Alphabetically by system name: Sorts alphabetically by parent system
names. Lists signals in each system, but in no particular order.
• By signal depth: Sorts signals by their depth in the model.
Section Options
• Create section for each object in loop: Inserts a section in the generated report
for each object found in the loop.
• Display the object type in the section title: Automatically inserts the object type
into the section title in the generated report.
• Create link anchor for each object in loop: Creates a hyperlink to the object in
the generated report.
8-116
Signal Loop
Insert Anything into Report?
Yes, inserts a section if you select the Create section for each object in loop option.
Class
rptgen_sl.csl_sig_loop
See Also
Block Loop, Model Loop, System Loop
8-117
8
Components — Alphabetical List
Simulink Automatic Table
Insert two-column table with information on selected model, system, signal, or block
Description
This component inserts a two-column table that contains details for the selected model,
system, signal, or block into a generated report.
Options
• Show current: Modeling object to specify properties for.
• Automatic: Uses the context of the parent loop.
• Model
• System
• Block
• Annotation
• Properties list: Specifies whether to have Report Explorer select properties
automatically or to list the properties to report on.
• Determine properties automatically: Let the Report Explorer
automatically select the properties to report.
Modeling Component Selected in the Show Listed Properties
current Field
Model
Description
System
Description
Block
Block parameter dialog box prompt
properties
Annotation
Text
Signal
Description
• Show properties: Specify a list of properties to report. Enter the names of object
properties that you want the report to include for the modeling object you specified
8-118
Simulink Automatic Table
in the Show current field. Use this option to display properties that the Report
Explorer does not include automatically.
Property names often differ from the Simulink dialog box prompts. Refer to the
Simulink documentation to determine property names for blocks, signals, and
other modeling objects. You can also use the MATLAB get command to determine
the property names of an object. For example, to determine the property names
of the block currently selected in a model, enter the following at the MATLAB
command line:
get(get_param(gcb,'Handle'))
• Show full path name: Displays the full path of the selected Simulink model.
• Display property names as prompts: Displays property names as prompts in the
generated report. The report includes the dialog box string instead of the underlying
code property.
Display Options
• Table title: Displays a table title in the generated report.
• Name: Automatically generates a title from the parameter.
• Custom: Specifies a custom title.
• No title: Does not include a title.
• Header row: Select a header row for the table in the generated report.
• No header: Includes no header row.
• Type and Name: Includes a header row with columns for name and object type.
• Custom: Includes a custom header.
• Don't display empty values: Excludes empty parameters in the generated report.
Insert Anything into Report?
Yes. Table.
8-119
8
Components — Alphabetical List
Class
rptgen_sl.csl_auto_table
See Also
Block Loop, Model Loop, Signal Loop, System Loop
8-120
Simulink Data Dictionary
Simulink Data Dictionary
Report Simulink data dictionary information
Description
This component reports on the data dictionary currently active in the data dictionary
loop specified by the Data Dictionary Loop component. Include this component as a child
of a Simulink Data Dictionary Loop component.
Presentation Format
The report for a data dictionary includes a table that summarizes the properties of each
variable in the dictionary. The report also includes a dictionary details section that
fully reports the properties and value of each variable in the dictionary. If you use a
conversion template to generate the report, you can specify template-defined styles for
the summary table title and the summary table.
To use a conversion template, in the Report Options dialog box, set File format to one of
these values:
• Word (from template)
• HTML (from template)
• PDF (from template)
• Table title style name: Specifies the style to use for the data dictionary table title.
To specify the default style name rgTableTitle, which the default conversion
template defines, use Auto. To specify a custom style defined in a custom template
that you use with this report, select Specify.
• Table style name: Specifies the style to use for the data dictionary table. To specify
the default table style name rgUnruledTable, which is the default conversion
template defines, use Auto. To specify a custom style defined in a custom template
that you use with this report, select Specify.
8-121
8
Components — Alphabetical List
Options
You can specify whether to include dictionaries referenced by a dictionary and how to
present the referenced information.
• Include referenced data dictionaries: Includes information from the data
dictionaries that the dictionary currently active in the data dictionary loop specified
by the Data Dictionary Loop component references. The referenced information
displays at the end of the table for the referencing data dictionary, unless you select
Make separate table for each referenced dictionary.
• Make separate table for each referenced dictionary: If you select Include
referenced data dictionaries, display a table for each referenced data dictionary.
• Include referenced dictionaries list: If you select Include referenced data
dictionaries, following the referencing data dictionary summary table, include a list
of the referenced data dictionaries.
Sections to Report
You can specify the data dictionary sections to include data for.
• Design Data (default): Include information from the Design Data section of the
current data dictionary.
• Configuration: Include information from the Configuration section of the current
data dictionary.
• Other Data: Include information from the Other Data section of the current data
dictionary.
Fields to Report
The current dictionary summary table lists properties of the variables that it contains.
The table always includes the variable name and value. In addition, it optionally includes
these properties:
• Data type
• Last modified
8-122
Simulink Data Dictionary
• Last modified by
• Status
• Referenced dictionary that contains data
Example
Suppose that you configure an HTML report with the Simulink Data Dictionary Loop
component.
Then you configure the Simulink Data Dictionary component.
8-123
8
Components — Alphabetical List
Here is the resulting report.
8-124
Simulink Data Dictionary
8-125
8
Components — Alphabetical List
Class
rptgen_sl.csl_data_dictionary
See Also
Simulink Data Dictionary Loop
8-126
Simulink Data Dictionary Loop
Simulink Data Dictionary Loop
Run Simulink Data Dictionary child component for each Simulink data dictionary in
specified context
Description
This component runs the Simulink Data Dictionary child component for each Simulink
data dictionary in the specified context. You can specify whether to have each data
dictionary in the loop.
Report on
Specify the data dictionaries to report on.
• Dictionaries in MATLAB path: Report on all data dictionaries on the MATLAB
path. If you select Include child data dictionaries, then also reports on child data
dictionaries whose parent is on the MATLAB path.
• Dictionaries in list: Report on all data dictionaries that you specify in the text
box. Enter data dictionary names, separated by either a comma or semicolon. You
can use multiple lines. If you do not specify the full path to a data dictionary, the loop
includes that data dictionary only if the dictionary is on the MATLAB path.
Use a Summary Table component to show annotation objects in reports. Each Summary
Table component creates a single table with each reported annotation on a single row of
the table.
Section Options
Create section for each object in loop: Create a separate chapter for each data
dictionary.
Example
Suppose you have an HTML report with the Simulink Data Dictionary Loop component
configured like this:
8-127
8
Components — Alphabetical List
Then you configure the Simulink Data Dictionary component like this:
8-128
Simulink Data Dictionary Loop
The resulting report looks like this:
8-129
8
Components — Alphabetical List
8-130
Simulink Data Dictionary Loop
Class
rptgen_sl.csl_data_dict_loop
See Also
Simulink Data Dictionary
8-131
8
Components — Alphabetical List
Simulink Dialog Snapshot
Insert snapshots of Simulink editor dialog boxes
Description
This component takes snapshots of Simulink editor dialog boxes. You use it to display the
current settings associated with an object or document the appearance of your custom
mask dialog boxes.
The parent component of this component determines the behavior of this component.
• Block Loop: Documents the dialog box of the current reported block.
• System Loop: Documents the dialog box of the current reported system.
Format
• Image file format: Specifies the format for the snapshot image file. The automatic
format chooses BMP format for PDF files, and PNG for other formats.
• Show all tabs: Automatically generates images for all the tabs for the dialog box. If
you clear this check box, Simulink Report Generator creates an image of only the first
tab.
Display Options
• Scaling: Controls size of the image, as displayed in a browser. Making an image
larger using this option does not affect the storage size of the image, but the quality
of the displayed image may decrease as you increase or decrease the size of the
displayed image.
Generally, to achieve the best and most predictable display results, use the default
setting of Use image size.
• Use image size: Causes the image to appear the same size in the report as on
screen (default).
• Fixed size: Specifies the number and type of units.
8-132
Simulink Dialog Snapshot
• Zoom: Specifies the percentage, maximum size, and units of measure.
• Size: Specifies the size of the snapshot in the format w h (width, height). This field is
active only if you choose Fixed size from the Scaling selection list.
• Max size: Specifies the maximum size of the snapshot in the format w h (width,
height). This field is active only if you choose Zoom from the Scaling selection list.
• Units: Specifies the units for the size of the snapshot. This field is active only if you
choose Zoom or Fixed size in the Image size list box.
• Alignment: Only reports in PDF or RTF format support this property.
• Auto
• Right
• Left
• Center
• Title: Specifies text to appear above the snapshot.
• Caption: Specifies text to appear under the snapshot.
Insert Anything into Report?
Yes. Snapshot.
Class
rptgen_sl.CDialogSnapshot
See Also
Block Loop, System Loop
8-133
8
Components — Alphabetical List
Simulink Function System Loop
Report on Simulink functions specified in a Stateflow loop
Description
This component runs its child components for each Simulink function system defined by
the parent component. For example, to include Simulink functions within a given model
in the report, you can include this component as the child of a Stateflow Object Loop
or Object Loop component, each of which in turn is usually a child of a Chart Loop
component.
Report On
Include subsystems in nested Simulink functions: Specifies whether to include
subsystems in nested Simulink functions. By default, this option is enabled.
Loop Options
• Sort Systems: Specifies how to sort systems.
• Alphabetically by system name (default): Sorts systems alphabetically by
name.
• By number of blocks in system: Sorts systems by number of blocks. The list
shows systems by decreasing number of blocks; that is, the system with the largest
number of blocks appears first in the list.
• By system depth: Sorts systems by their depth in the model.
• By traversal order: Sorts systems in traversal order.
• Search for: Reports only on Subsystem blocks with the specified property name/
property value pairs. To enable searching, click the check box. In the first row of the
property name and property value table, click inside the edit box, delete the existing
text, and type the property name and value.
For information about subsystem property names and values, in “Block-Specific
Parameters”, see the “Ports & Subsystems Library Block Parameters” section.
8-134
Simulink Function System Loop
Section Options
• Create section for each object in loop: Inserts a section in the generated report
for each object found in the loop.
• Display the object type in the section title: Inserts the object type automatically
into the section title in the generated report.
• Number sections by system hierarchy: Hierarchically numbers sections in the
generated report. Requires that Sort Systems be set to By traversal order.
• Create link anchor for each object in loop: Creates a hyperlink to the object in
the generated report.
Insert Anything into Report?
Yes, inserts a section if you select the Create section for each object in loop option.
Class
rptgen_sl.csl_sys_loop
See Also
Object Loop, State Loop, Chart Loop, System Loop, Block Loop, Model Loop,
Signal Loop
8-135
8
Components — Alphabetical List
Simulink Functions and Variables
Create table that displays workspace variables and MATLAB functions used by reported
blocks in Simulink models
Description
This component creates a table that displays workspace variables and MATLAB
functions used by blocks in a Simulink model. The Model Loop component specifies the
current model and systems in which the blocks appear. For example, suppose a Simulink
Gain block has a string cos(x) instead of a number. The Simulink software looks for a
variable x in the workspace and uses the cos function.
Functions
• Include table of functions: Includes a table of Simulink functions in the generated
report.
• Table Title: Specifies a title for the table in the generated report:
• Automatic: Generates a title automatically from the parameter.
• Custom: Specifies a custom title.
• Parent block: Includes a column in the table that includes the name of the block,
which contains the reported variable.
• Calling string: Includes the MATLAB code that calls the reported variable.
• Include fixed-point functions (sfix, ufix, ...): Includes Fixed-Point Designer
functions in the report.
Variables
• Include table of variables: Includes a table of Simulink variables in the generated
report.
• Table title: Specifies a title for the table in the generated report.
• Automatic: Generates a title automatically from the parameter.
• Custom: Specifies a custom title.
8-136
Simulink Functions and Variables
• Include Workspace I/O parameters: Reports on variables that contain parameters
with time vectors and state matrices. Set these parameters in the Workspace I/O
pane in the Simulation Parameters dialog box in a Simulink model.
In the following table, if any of the entries in the first column are on, the component
looks for the variable listed in the second column. If the component finds the variable
in the workspace, it includes it in the report.
Parameter name
Variable name
LoadExternalInput
ExternalInput
SaveTime
TimeSaveName
SaveState
StateSaveName
SaveOutput
OutputSaveName
LoadInitialState
InitialState
SaveFinalState
FinalStateName
• Parent block: Includes the name of the block that contains the reported variable.
• Calling string: Includes the MATLAB code that calls the reported variable.
• Size of variable: Includes the size of the reported variable.
• Class of variable: Includes the variable class to which the reported variable belongs.
• Memory size: Includes the amount of memory in bytes that the reported variable
needs.
• Value in workspace: Includes the value of the reported variable.
Large arrays may appear as [MxN CLASS]. For example, if you have a 300-by-200
double array, it appears in the report as [300x200 DOUBLE].
• Storage class: Include the storage class of the reported variable.
The title of this column is Storage Class. This option looks at the model's
TunableVars property to see if any of the model variables specify their storage
class. If you specify the storage class, TunableVarsStorageClass and
TunableVarsTypeQualifier appear in a table column in the model variables table.
The column entries are TunableVarsStorageClass
(TunableVarsTypeQualifier) when TunableVarsTypeQualifier is
not empty. If TunableVarsTypeQualifier is empty, the column entry is
TunableVarsStorageClass.
8-137
8
Components — Alphabetical List
Values for TunableVarsStorageClass include:
• Exported Global
• Auto
• ImportedExtern
• ImportedExtern Pointer
• Data object properties: For variables that are Simulink.Parameter data objects,
includes the values of the object properties that you list in the edit box.
Example
This table is an example of a table created by the Model Variables component. This
Property Table reports on the variables in the Controller in the F14 model.
Variable Name
Parent Blocks
Calling
String
Value
Ka
f14/Controller/Gain3
Ka
0.677
Kf
f14/Controller/Gain
Kf
-1.746
Ki
f14/Controller/Proportional plus
integral compensator
[Ki]
-3.864
Kq
f14/Controller/Gain2
Kq
0.8156
Insert Anything into Report?
Yes. Table.
Class
rptgen_sl.csl_obj_fun_var
See Also
Block Loop, Model Loop, Signal Loop, System Loop
8-138
Simulink Library Information
Simulink Library Information
Insert table that lists library links in the current model, system, or block
Description
This component inserts a table that lists library links in the current model, system, or
block.
Table Columns
• Block: Includes the Simulink block name in the generated table.
• Library: Includes the Simulink library root name in the generated table.
• Reference block: Includes the Simulink reference block name in the generated
table.
• Link status: Includes the link status in the generated table.
Display Options
• Title: Specifies a title for the generated report.
• Sort table by:
• Block: Sorts the table by block name.
• Library: Sorts the table by library name.
• Reference Block: Sorts the table by reference block name.
• Link Status: Sorts the table by link status.
• Merge repeated rows: Merges sorted rows in the generated table.
Example
The following table sorts based on Reference Block column. The Report Explorer uses
the aero_guidance model with Merge repeated rows deselected to generate the
table.
8-139
8
Components — Alphabetical List
Block
Library
Reference Block
Status
Equations of
Motion (Body
Axes)
Aerospace
Equations of Motion
(Body Axes)
resolved
Incidence &
Airspeed
Aerospace
Incidence & Airspeed
resolved
Fin Actuator
Aerospace
2nd Order Nonlinear
Actuator
resolved
3DoF Animation
Aerospace
3DoF Animation
resolved
Atmosphere
Aerospace
Atmosphere model
resolved
Cm
Simulink
Interpolation (n-D)
using PreLookup
resolved
Cx
Simulink
Interpolation (n-D)
using PreLookup
resolved
Cz
Simulink
Interpolation (n-D)
using PreLookup
resolved
Kg
Simulink
Interpolation (n-D)
using PreLookup
resolved
Ki
Simulink
Interpolation (n-D)
using PreLookup
resolved
Alpha Index
Simulink
PreLookup Index Search resolved
Mach Index
Simulink
PreLookup Index Search resolved
Mach Index
Simulink
PreLookup Index Search resolved
|Alpha| Index
Simulink
PreLookup Index Search resolved
When you select Merge repeated rows, the generated table collapses rows in the Block
column. Each row in the Reference Block column is unique, as shown in the following
table.
8-140
Block
Library
Reference Block
Status
Equations of
Motion (Body
Axes)
Aerospace
Equations of Motion
(Body Axes)
resolved
Simulink Library Information
Block
Library
Reference Block
Status
Incidence &
Airspeed
Aerospace
Incidence & Airspeed
resolved
Fin Actuator
Aerospace
2nd Order Nonlinear
Actuator
resolved
3DoF Animation
Aerospace
3DoF Animation
resolved
Atmosphere
Aerospace
Atmosphere model
resolved
Cm
Simulink
Interpolation (n-D)
using PreLookup
resolved
Simulink
PreLookup Index
Search
resolved
Cx
Cz
Kg
Ki
Alpha Index
Mach Index
Mach Index
|Alpha| Index
Insert Anything Into Report?
Yes. Table.
Class
rptgen_sl.CLibinfo
See Also
Block Loop, Model Loop, System Loop
8-141
8
Components — Alphabetical List
Simulink Linking Anchor
Designate locations to which links point
Description
This component designates a location to which links point. Use the Model Loop, System
Loop, Block Loop, or Signal Loop component as the parent component for this
component.
Properties
• Insert text: Specifies text to appear after the linking anchor.
• Link from current: Sets the current model, system, block, or signal as the linking
anchor.
• Automatic: Automatically selects the appropriate model, system, block, or signal
as a linking anchor. If the Model Loop component is the parent component,
the linking anchor is set on the current model. Similarly, if the Block Loop or
Signal Loop is the parent component, the linking anchor is inserted for the
current system, block, or signal, respectively.
• Model: Sets the linking anchor to the current model.
• System: Sets the linking anchor to the current system.
• Block: Sets the linking anchor to the current block.
• Annotation: Sets the linking anchor to the current annotation.
• Signal: Sets the linking anchor to the current signal.
Note: Use only one anchor per report each object. For more information, see the
Simulink Summary Table component reference page.
Insert Anything into Report?
Yes. A link, and possibly text, depending on attribute choices.
8-142
Simulink Linking Anchor
Class
rptgen_sl.csl_obj_anchor
See Also
Block Loop, Model Loop, Signal Loop, System Loop
8-143
8
Components — Alphabetical List
Simulink Name
Insert name of a Simulink model, system, block, or signal into report
Description
This component inserts the name of a Simulink model, system, block, or signal into the
report.
Using this component as the first child component of a Chapter/Subsection
component allows the current Simulink model, system block, or signal name to be the
chapter or section title.
Properties
• Object type
• Automatic: Automatically selects the appropriate model, system, block, or signal
name as the Simulink object name to include in the report. If the Model Loop
component is the parent component, the object name is the current model name.
If the System Loop, Block Loop, or Signal Loop is the parent component, then the
object name is the name of the current system, block, or signal, respectively.
• Model: Includes the current model name in the report.
• System: Includes the current system name in the report.
• Block: Includes the current block name in the report.
• Signal: Includes the current signal name in the report. If the signal name is
empty, the signal <handle>, which is a unique numerical identifier to that signal,
appears in the report.
• Annotation: Includes the current annotation name in the report.
• Display name as: Display the Simulink object name in the report.
• Name: For example, f14
• Type Name: For example, Model f14
• Type - Name: For example, Model - f14
• Type: Name: For example, Model: f14
8-144
Simulink Name
• Show full path name: Displays the full path of a system or block. Choosing this
option for a block causes the Simulink block name to appear as <Model Name>/
<System Name>/<Block Name>.
Note: This option is not available for models or signals.
Insert Anything into Report?
Yes. Text.
Class
rptgen_sl.csl_obj_name
See Also
Chapter/Subsection
8-145
8
Components — Alphabetical List
Simulink Property
Insert property name/property value pair for current Simulink model, system, block, or
signal
Description
This component inserts a single property name/property value pair for the current
Simulink model, system, block, or signal.
Simulink Object and Parameter
• Object type: Specifies the Simulink object type to include in the report.
• System
• Model
• Block
• Signal
• Annotation
• System parameter name: Specifies a Simulink parameter name to include in the
generated report:
• If you select Model for Object type, this option appears as Model parameter
name.
• If you select Block for Object type, this option appears as Block parameter
name.
• If you select Signal for Object type, this option appears as Signal parameter
name.
Display Options
• Title: Choose a title to display in the generated report:
• Automatic: Uses the parameter name as the title.
8-146
Simulink Property
• Custom: Specifies a custom title.
• None: Uses no title.
• Size limit: Limits the width of the display in the generated report. Units are in
pixels. The size limit for a given table is equal to the hypotenuse of the table width
and height [sqrt(w^2+h^2)]. The size limit for text is the number of characters
squared. If you exceed the size limit, the variable appears in condensed form. Setting
a size limit of zero always causes the variable to display, regardless of its size
• Display as: Specifies a display style.
• Auto table/paragraph: Displays as a table or paragraph based on the
information.
• Table: Displays as a table.
• Paragraph: Displays as a text paragraph.
• Inline text: Displays as inline, which fits in line with the surrounding text.
• Ignore if value is empty: If the parameter is empty, the report excludes the
parameter from the generated report.
Insert Anything into Report?
Yes. Text.
Class
rptgen_sl.csl_property
See Also
Block Loop, Model Loop, System Loop
8-147
8
Components — Alphabetical List
Simulink Property Table
Insert table that reports on model-level property name/property value pairs
Description
This component inserts a table that reports on model-level property name/property value
pairs.
Properties
Select Object: Choose the object for the Property Table in the generated report.
• Model
• System
• Block
• Signal
• Annotation
For more information about selecting object types in Property Table components, see
“Select Object Types” on page 6-9.
Table
Select a preset table, which is already formatted and set up, in the preset table list in the
upper-left corner of the attributes page.
• Preset table: Specifies the type of the object property table.
• Default
• Simulation parameters
• Version information
• Simulink Coder information
8-148
Simulink Property Table
• Summary (req. Simulink Coder)
• Blank 4x4
To apply a preset table, select the table and click Apply.
• Split property/value cells: Split property name/property value pairs into separate
cells. For the property name and property value to appear in adjacent horizontal cells,
select the Split property/value cells check box. In this case, the table is in split
mode, so there is only one property name/property value pair per cell. If there is more
than one name/property pair in a cell, only the first pair appears in the report. All
subsequent pairs are ignored.
For the property name and property value to appear together in one cell, clear the
Split property/value cells check box. That setting specifies nonsplit mode. Nonsplit
mode supports more than one property name/property value pair and text per cell.
Before switching from nonsplit mode to split mode, make sure that there is only one
property name/property value pair per table cell. If there is more than one property
name/property value pair or text per cell, only the first property name/property value
pair appears in the report. The report omits subsequent pairs and text.
• Display outer border: Displays the outer border of the table in the generated
report.
• Table Cells: Specifies table properties to modify. The selection in this pane affects
available fields in the Cell Properties pane.
Cell Properties
The options in this pane depend on the object selected in the Table Cells pane. If you
select %<Name> Information, only Contents and Show appear. If you select any other
object in the Table Cells pane, Lower border and Right border display.
• Contents: Enables you to change the contents of the table cell selected in the Table
Cells pane.
• Show as: Specifies the format for the contents of the table cell.
• Value
• Property Value
• PROPERTY Value
8-149
8
Components — Alphabetical List
• Property: Value
• PROPERTY: Value
• Property - Value
• PROPERTY - Value
• Alignment: Specifies the alignment of the contents of the selected table cell in the
Table Cells pane.
• Left
• Center
• Right
• Double justified
• Lower border: Displays the lower border of the table in the generated report.
• Right border: Displays the right border of the table in the generated report.
Creating Custom Tables
To create a custom table, edit a preset table, such as the Blank 4x4 table. Add and
delete rows and add properties. To open the Edit Table dialog box, click Edit.
For more information on creating custom property tables, see “Property Table
Components” on page 6-6.
If the Simulink Coder software is not installed, Summary (req Simulink Coder)
does not appear in this list. If you are using a report setup file that contains a summary
property, the property name appears in the report, but the property value does not.
Example
The following report displays information on the F14 model using the Simulation
Parameters preset table.
8-150
Solver ode45
ZeroCross on
StartTime 0.0 StopTime 60
RelTol 1e-4
AbsTol 1e-6
Refine 1
InitialStep auto
FixedStep auto
MaxStep auto
LimitMaxRows off
MaxRows 1000
Decimation 1
Simulink Property Table
Insert Anything into Report?
Yes. Table.
Class
rptgen_sl.csl_prop_table
See Also
Model Loop, Signal Loop, System Loop
8-151
8
Components — Alphabetical List
Simulink Sample Time
Insert title of Simulink sample time into report
Description
This component inserts a title for a Simulink sample time into the report.
Properties
• Table Options
• Title: Specifies a title for the table in the generated report.
• Grid lines: Show grid lines for the table.
Insert Anything into Report?
Yes. Table.
Class
rptgen_sl.CSampleTime
See Also
Chapter/Subsection
8-152
Simulink Summary Table
Simulink Summary Table
Properties or parameters of specified Simulink models, systems, blocks, or signals in
table
Description
This component displays properties or parameters of selected Simulink models, systems,
blocks, or signals in a table.
Object type
Choose the object type to display in the generated report.
• Block (Default)
• Model
• System
• Signal
• Annotation
The selected object type affects the options available in the Property Columns pane.
Table title
Choose a title to appear in the generated report:
• Automatic: Automatically generates a title from the parameter.
• Custom: Specifies a custom title.
Property Columns
This pane displays object properties to include in the Summary Table in the generated
report.
• To add a property:
8-153
8
Components — Alphabetical List
1
select the appropriate property level in the text box on the left.
2
In the text box on the right, select the property that you want to add and click
Add.
• To delete a property, select the property name and click Delete.
%<SplitDialogParameters> is a unique property for Simulink Summary Tables,
where the object type is Block. This property generates multiple summary tables,
organized by block type. Each Summary Table group contains the dialog box parameters
for that block.
Some entries in the list of available properties (such as Depth) are “virtual” properties
that you cannot access using the get_param command. The properties used for property/
value filtering in the block and System Loop components must be retrievable by the
get_param. Therefore, you cannot configure your Summary Table to report on all blocks
of Depth == 2.
You can create multiple values for a property in a Simulink Summary Table. For
example, to report on blocks of type Inport, Outport and Constant:
1
Check the Search for Simulink property name/property value pairs box.
2
Make sure that you set Property Name to BlockType.
3
Type the following text into the Property Value field:
\<(Inport|Outport|Constant)\>
Remove empty columns: Removes empty columns from the table.
Transpose table: Changes the summary table rows into columns in the generated
report, putting the property names in the first column and the values in the other
columns.
Object Rows
• Insert anchor for each row: Inserts an anchor for each row in the summary table.
• Report On:
• Automatic list from context: Reports on all blocks in the current context, as
set by the parent component.
8-154
Simulink Summary Table
• Custom - use block list: Reports on a list of specified blocks. Specify the full
path of each block.
Loop Options
• Sort blocks
• Alphabetically by block name: Sorts blocks alphabetically by name.
• Alphabetically by system name: Sorts systems alphabetically by name. Lists
blocks in each system, but in no particular order.
• Alphabetically by full Simulink path: Sorts blocks alphabetically by
Simulink path.
• By block type: Sorts blocks alphabetically by block type.
• By block depth: Sorts blocks by their depth in the model.
• By layout (left to right): Sorts blocks by their location in the model
layout, by rows. The block appearing the furthest toward the left top corner of the
model is the anchor for the row. The row contains all other blocks that overlap
the horizontal area defined by the top and bottom edges of the anchor block. The
other rows use the same algorithm, using as the anchor the next unreported block
nearest the left top of the model.
• By layout (top to bottom): Sorts blocks by their location in the model
layout, by columns. The block appearing the furthest toward the left top corner
of the model is the anchor for the column. The column contains all other blocks
that overlap the vertical area defined by the left and right edges of the anchor
8-155
8
Components — Alphabetical List
block. The other columns use the same algorithm, using as the anchor the next
unreported block nearest the left top of the model.
• By traversal order: Sorts blocks by traversal order.
• By simulation order: Sorts blocks by execution order.
• %<VariableName>: Inserts the value of a variable from the MATLAB workspace.
The %<> notation can denote a string or cell array. For more information, see
%<VariableName> Notation on the Text component reference page.
• Search for Simulink property name/property value pairs: Reports on blocks
with specified property name/property value pairs.
Example
Specify the following options to generate a Summary Table in a report for on the model
F14:
• Sort on systems by system depth.
• Include the system parameters Name and Block in the table.
The following table appears in the report.
8-156
Name
Blocks
f14
u, Actuator Model, Aircraft Dynamics Model, Angle of Attack,
Controller, Dryden Wind Gust Models, Gain, Gain1, Gain2,
Gain5, More Info, More Info1, Nz pilot calculation, Pilot, Pilot G
force Scope, Stick Input, Sum, Sum1, alpha (rad), Nz Pilot (g)
Aircraft Dynamics
Model
Elevator Deflection d (deg), Vertical Gust wGust (ft/sec), Rotary
Gust qGust (rad/sec), Gain3, Gain4, Gain5, Gain6, Sum1, Sum2,
Transfer Fcn.1, Transfer Fcn.2, Vertical Velocity w (ft/s), Pitch
Rate q (rad/s)
Controller
Stick Input (in), alpha (rad), q (rad/s), Alpha-sensor Low-pass
Filter, Gain, Gain2, Gain3, Pitch Rate Lead Filter, Proportional
plus integral compensator, Stick Prefilter, Sum, Sum1, Sum2,
Elevator Command (deg)
Dryden Wind Gust
Models
Band-Limited White Noise, Q-gust model, W-gust model, Wg, Qg
More Info
None
Simulink Summary Table
Name
Blocks
More Info1
None
Nz pilot calculation
w, q, Constant, Derivative, Derivative1, Gain1, Gain2, Product,
Sum1, Pilot g force (g)
Insert Anything into Report?
Yes. Table.
Class
rptgen_sl.csl_summ_table
See Also
Block Loop, Model Loop, Signal Loop, System LoopSimulink Function System
Loop
8-157
8
Components — Alphabetical List
Simulink Workspace Variable
Report on workspace variables used in model, in loop generated by Simulink Workspace
Variable Loop component
Description
This component provides information about those workspace variables that the
Simulink model uses, in a loop generated by a Simulink Workspace Variable
Loop component. Your report setup must include Simulink Workspace Variable
component as a child of a Simulink Workspace Variable Loop component.
The report includes the name and value each variable. Optionally, you can include the
following information for each variable:
• Variable source (MATLAB workspace, model workspace, or data dictionary)
• Blocks that use the variable
For variables that are Simulink data objects (for example, a Simulink.Parameter
object), the report includes the properties of the object. You can filter out properties to
streamline the report.
Use a Simulink Workspace Variable Loop component as a parent for a Simulink
Workspace Variable component. In the Report Options dialog box, select Compile
model to report on compiled information.
8-158
Simulink Workspace Variable
Options
The following options specify additional information that the report can include about
each variable:
• Show workspace: Report the source of each variable — MATLAB workspace, model
workspace, or data dictionary.
• Show blocks that use variable: Report the blocks that use each variable.
For variables whose values are Simulink data objects, you can filter the properties to
include in the report, using one of the following approaches:
• Use the Filter Properties area of the dialog box to specify a standard filter.
The standard filter options apply to all variables whose values are instances of the
class or classes that you specify. For example, you can use a standard filter to filter
out the Description property for all variables used by the model whose values use a
Simulink.Parameter object.
• Select the Use custom property filter option and write MATLAB code for filtering.
8-159
8
Components — Alphabetical List
Writing custom filtering code allows you to do kinds of filtering that the standard
filter does not perform. Some common examples of custom filters that you might want
to create are filters that filter out:
• A property for some, but not all, instances of a class
• Properties that match a regular expression
The Filter Properties area of the dialog box, where you specify a standard filter, has
these fields.
• Class name (* for all classes): Specify the class of the variables for which you
want to filter out specific properties. You can specify one class at a time, or enter an
asterisk (*) to specify all classes. After you enter the class name, move the cursor
outside of the edit box.
• Available Properties: If the class that you entered in Class name (* for all
classes) is on the MATLAB path, then this list displays the properties of that class.
• Filtered Properties: Displays the properties to filter out. Use the right-arrow
button to add to the Filtered Properties list the properties that you selected in the
Available Properties list.
• If the class that you enter is not on the MATLAB path, then a Comma-separated
list of properties to be filtered edit box appears. Enter the names of properties to
use for filtering.
• Convert to Custom: Generate custom MATLAB code that implements your Filter
Properties standard filter settings.
Note: Selecting the Convert to Custom button overwrites any existing MATLAB
custom filtering code for this component.
To create and apply custom filtering MATLAB code, select the Use custom property
filter check box. Selecting this check box opens an edit box where you define a MATLAB
function for filtering properties. The edit box includes a sample function (commented
out) that you can use as a starting point for your filtering function. Use the isFiltered
variable for the output of your function. For example:
• To filter out the Owner and testProp properties, in the edit box enter:
isFiltered = strcmpi(propertyName, 'Owner')||...
strcmpi(propertyName, 'testProp');
8-160
Simulink Workspace Variable
• To filter out all properties except for the CoderInfo property, in the edit box, enter:
isFiltered = ~strcmpi(propertyName, 'CoderInfo');
If you clear the Use custom property filter check box, Simulink Report Generator
saves your custom MATLAB filtering code, but does not use that code to filter properties.
Insert Anything into Report?
Yes. List.
Class
rptgen_sl.csl_ws_variable
See Also
Simulink Workspace Variable Loop, Bus, Simulink Functions and
Variables
8-161
8
Components — Alphabetical List
Simulink Workspace Variable Loop
Generates a model variable loop
Description
This component generates a model variable loop used by the Simulink Workspace
Variable component to report on those workspace variables that the Simulink model
uses.
You can limit the variables included in the loop to those that match property name
and value pairs that you specify. If you want to report on model variables, your report
setup file must include this component as a child of a Model Loop component and must
include a Simulink Workspace Variable component as its child. Also, in the Report
Options dialog box, select Compile model to report on compiled information. For
example:
8-162
Simulink Workspace Variable Loop
Loop Options
• Sort
• Alphabetically by text: Sort variables alphabetically by name.
• By data type: Sort variables alphabetically by data type.
• Search for Simulink property name/property value pairs: Reports on variables
with specified property name/property value pairs.
Section Options
• Create section for each object in loop: Creates a separate section in the output
for each variable.
• If you specify to create a section for each variable, you can select the Display the
object type in the section title to insert a variable name in each section title.
• Create link anchor for each object in loop: Specifies a custom title.
Insert Anything into Report?
Yes, inserts sections if you select the Create section for each object in loop option
Class
rptgen_sl.csl_ws_var_loop
See Also
Simulink Workspace Variable, Bus, Simulink Functions and Variables
8-163
8
Components — Alphabetical List
Software Quality Objectives - Coding Rules
Summary
Create table of coding rule violations in results downloaded from Polyspace Metrics
Description
This component creates a table containing coding rule violations in results downloaded
from Polyspace Metrics.
8-164
Software Quality Objectives - Run-time Checks Details
Software Quality Objectives - Run-time Checks
Details
Create table of run-time checks in results downloaded from Polyspace Metrics
Description
This component creates a table containing run-time checks in results downloaded from
Polyspace Metrics.
8-165
8
Components — Alphabetical List
Software Quality Objectives - Run-time Checks
Summary
Create table of run-time check distribution in results downloaded from Polyspace Metrics
Description
This component creates a table containing the distribution of run-time checks in results
downloaded from Polyspace Metrics.
8-166
State Loop
State Loop
Run child components for all states in current context
Description
This component runs its children for all states in its context. The parent component of
this component determines the context.
• Model Loop: Includes all states in the models.
• System Loop: Includes all states in the systems.
• Machine Loop: Includes all states in the machines.
• Chart Loop: Includes all states in the charts.
• State Loop: Includes all states in the current state.
For conditional processing based on states, you can use the
RptgenSF.getReportedState function. For more information, see “Loop Context
Functions” on page 6-24.
State Types
• Include “and” and “or” states: Includes AND and OR states in the loop.
• Include “box” states: Includes “box” states in the loop.
• Include functions: Includes “function” states in the loop.
• Include truth tables: Includes truth tables in the loop.
• Include MATLAB functions: Includes MATLAB functions in the loop.
Loop Options
• Report depth: Specifies the level on which to loop.
• Local children only
• All objects
8-167
8
Components — Alphabetical List
• Skip autogenerated charts under truth table: Keeps autogenerated state objects
under truth tables from appearing in the report.
• Search Stateflow: Indicates specific states to include in the loop.
Section Options
• Create section for each object in loop: Inserts a section in the generated report
for each object found in the loop.
• Display the object type in the section title: Inserts the object type automatically
into the section title in the generated report.
• Create link anchor for each object in loop: Creates a hyperlink to the object in
the generated report.
Insert Anything into Report?
Yes, section, if you select the Create section for each object in loop option.
Class
rptgen_sf.csf_state_loop
See Also
Chart Loop, Machine Loop, Model Loop, State Loop, System Loop, Simulink
Function System Loop
8-168
State Transition Matrix
State Transition Matrix
Insets state transition matrix contents into report
Description
This component inserts the contents of state transition matrices into a report. A state
transition matrix is an alternative view of a state transition table. In the state transition
matrix, you can easily see how the state transition table reacts to each condition and
event.
Options
• Title
• No title (default): Report uses no title for the state transition matrix.
• Use Stateflow name: For the title in the report, uses the names of the State
Transition Table blocks from which the state transition matrices are generated.
• Custom: In the text field, specify a custom name for the state transition matrix.
• Display condition actions on matrix: Include the state transition matrix condition
actions. A condition action is an action that executes as soon as a condition evaluates
to true. The condition action is part of a transition label.
Insert Anything into Report?
Yes, inserts state transition matrices and optionally, condition actions.
Class
rptgen_sf_csf_statetransitionmatrix
See Also
State Transition Table
8-169
8
Components — Alphabetical List
State Transition Table
Insets state transition tables into report
Description
This component inserts the state transition tables into a report. A state transition table
is an alternative way of expressing sequential modal logic. Instead of drawing states
and transitions graphically in a Stateflow® chart, you express the modal logic in tabular
format.
Options
• Title
• No title (default): Report uses no title for the state transition table.
• Use Stateflow name: Uses the name of the State Transition Table block as the
title.
• Custom: In the text field, specify a custom name for the state transition table.
Insert Anything into Report?
Yes, inserts state transition table.
Class
rptgen_sf_csf_statetransitiontable
See Also
State Transition Matrix
8-170
Stateflow Automatic Table
Stateflow Automatic Table
Insert table with properties of current Stateflow object
Description
The Stateflow Automatic Table component inserts a table that contains the properties of
the current Stateflow object. Parents of this component can be:
• Machine Loop
• State Loop
• Chart Loop
• Graphics Object Loop
Display Options
• Table title: Specifies a title for the table in the generated report.
• No title: Includes no title.
• Custom: Includes a custom title.
• Name (default): Uses an object name as the title.
• Object name
• Object name with Stateflow path
• Object name with Simulink and Stateflow path
• Header row: Selects a header row for the table in the generated report.
• No header: Includes no header row.
• Type and Name: Includes a header row with columns for name and object type.
When selected, this option creates a header row for the table with object name and
type.
• Custom: Includes a custom header.
• Don't display empty values: Excludes empty values from the generated report.
8-171
8
Components — Alphabetical List
Insert Anything into Report?
Yes. Table.
Class
rptgen_sf.csf_auto_table
See Also
Chart Loop, Graphics Object Loop, Machine Loop, State Loop
8-172
Stateflow Count
Stateflow Count
Count number of Stateflow objects in current context
Description
This component counts the number of Stateflow objects in the current context.
Properties
• Search depth: Specifies the search depth for the count.
• Immediate children only (default): Searches only children one level under the
Stateflow object.
• All descendants: Searches all children of the Stateflow object.
• Sort results: Specifies the sort method for the count results.
• Numerically decreasing by object count (Default)
• Alphabetically increasing by object type
• Include a list of objects in table: Inserts a column containing the counted objects.
• Show total count: Displays a total of counted objects.
Insert Anything into Report?
Yes. Table.
Class
rptgen_sf.csf_count
See Also
State Loop
8-173
8
Components — Alphabetical List
Stateflow Dialog Snapshot
Insert snapshots of Stateflow editor dialog boxes
Description
This component reports on the current reported Stateflow dialog box object, depending
on its context. If this component is the child of a State Loop, for example, the report
includes information about the dialog box of the current State. Display the current
settings associated with an object or document the appearance of your custom mask
dialog boxes.
Format
• Image file format: Specifies the format for the snapshot image file. The Automatic
format uses BMP format for PDF files and PNG for other formats.
• Show all tabs: Automatically generates images for all the tabs for the dialog box. If
you clear this check box, the Simulink Report Generator software creates an image of
only the first tab.
Display Options
• Scaling: Controls size of the image, as displayed in a browser. Making an image
larger using this option does not affect the storage size of the image, but the quality
of the displayed image may decrease as you increase or decrease the size of the
displayed image.
Generally, to achieve the best and most predictable display results, use the default
setting of Use image size.
• Use image size: Causes the image to appear the same size in the report as on
screen (default).
• Fixed size: Specifies the number and type of units.
• Zoom: Specifies the percentage, maximum size, and units of measure.
• Size: Specifies the size of the snapshot in the form w h (width, height). This field is
active only if you choose Fixed size in the Scaling selection list.
8-174
Stateflow Dialog Snapshot
• Max size: Specifies the maximum size of the snapshot in the form w h (width,
height). This field is active only if you choose Zoom in the Scaling selection list.
• Units: Specifies the units for the size of the snapshot. This field is active only if you
choose Zoom or Fixed size in the Image size list box.
• Alignment: Aligns your snapshot. Only reports in PDF or RTF format support this
property.
• Auto
• Right
• Center
• Left
• Title: Specifies text to appear above the snapshot.
• Caption: Specifies text to appear under the snapshot.
Insert Anything into Report?
Yes. Snapshot.
Class
rptgen_sl.Cdialog boxesnapshot
See Also
State Loop
8-175
8
Components — Alphabetical List
Stateflow Filter
Run child components only if current object type matches specified object type
Description
This component runs its children only if the current object type, as set by its parent
Stateflow Hierarchy Loop, matches the selected object type.
Properties
• Object type: Specifies the Stateflow object type to include in the report.
• Run only if Stateflow object has at least the following number of Stateflow
children: Specifies a minimum number of children that a Stateflow object must have
to include in the report.
• Automatically insert linking anchor: Inserts a linking anchor before the reported
object. If an anchor for this object exists, this option does not create a second anchor.
Insert Anything into Report?
No.
Class
rptgen_sf.csf_obj_filter
See Also
Stateflow Hierarchy Loop
8-176
Stateflow Hierarchy
Stateflow Hierarchy
Provide visual representation of the hierarchy of a Stateflow object
Description
This component inserts a tree that shows the hierarchy of a given Stateflow object.
Tree Options
• Construct tree from: Specifies the object to use for the tree representation.
• Current object
• Root of current object: Starts reporting from the top of the hierarchy.
• Emphasize current object in tree: Highlights the current object in the tree
representation.
• Show number of parents: Specifies the number of parents to include in the tree
representation.
• Show siblings: Displays siblings in the tree representation.
• Show children to depth: Specifies the depth of children to display for each object in
the tree representation.
Children
• Show junctions: Specifies the level of junction detail to display in the generated
report.
• All
• Non-redundant
• None
• Show transitions: Specifies the level of transition detail to display in the generated
report.
• All
• Labeled or non-redundant
8-177
8
Components — Alphabetical List
• Non-redundant
• Labeled
• None
• Skip autogenerated charts under truth tables: Excludes autogenerated charts
under truth tables.
List Formatting
• List style:
• Bulleted list
• Numbered list: Allows you to specify numbering options in the Numbering
style section.
• Numbering style: Allows you to specify a numbering style. This setting
supports only the RTF/DOC report format.
• 1,2,3,4...
• a,b,c,d...
• A,B,C,D...
• i,ii,iii,iv...
• I,II,III,IV...
To show the parent number in each list entry, select Show parent number
in nested list (1.1.a). To show only the current number or letter, select
Show only current list value (a).
Insert Anything into Report?
Yes. Tree graphic.
Class
rptgen_sf.csf_hier
8-178
Stateflow Hierarchy
See Also
Stateflow Hierarchy Loop
8-179
8
Components — Alphabetical List
Stateflow Hierarchy Loop
Run child components on Stateflow object hierarchy
Description
This component runs its child components on the Stateflow object hierarchy.
Loop Options
• Minimum legible font size: Specifies the minimum font size to use in the report.
The default font size, 8, is the smallest recommended font size.
• Skip autogenerated charts under truth tables; Excludes autogenerated charts
under truth tables in the report.
• Search Stateflow: Reports on Stateflow charts with specified property name/
property value pairs.
Section Options
• Create section for each object in loop: Inserts a section in the generated report
for each object found in the loop.
• Display the object type in the section title: Inserts the object type automatically
into the section title in the generated report.
• Create link anchor for each object in loop: Creates a hyperlink to the object in
the generated report.
Insert Anything into Report?
No.
Class
rptgen_sf.csf_hier_loop
8-180
Stateflow Hierarchy Loop
See Also
Stateflow Hierarchy
8-181
8
Components — Alphabetical List
Stateflow Linking Anchor
Designate locations to which links point
Description
This component designates a location to which other links point. The linking anchor is
set to the current object, as defined by the parent component.
This component must have the Chart Loop, State Loop, Machine Loop, or
Stateflow Filter component as its parent.
Properties
Insert text: Specifies text to appear after the linking anchor.
Insert Anything into Report?
Yes. A link, and possibly text, depending on attribute choices.
Class
rptgen_sf.csf_obj_anchor
See Also
Chart Loop, Machine Loop, State Loop, Stateflow Filter,
8-182
Stateflow Name
Stateflow Name
Insert into report name of Stateflow object specified by parent component
Description
This component inserts the name of the Stateflow object, as defined by its parent
component, into the report. This component must have the State Loop, Chart Loop,
or Stateflow Filter component as its parent.
Using this component as the first child component of a Chapter/Subsection
component allows the current Stateflow object name to be the chapter or section title.
Properties
• Display name as: Displays the Stateflow object name in the report.
• Name: For example, Object
• Type Name: For example, Object <ObjectName>
• Type - Name: For example, Object - <ObjectName>
• Type: Name: For example, Object: <ObjectName>
• Display name as: Specifies the level of detail with which the Stateflow object name
displays the report.
• Object name
• Object name with Stateflow path
• Object name with Simulink and Stateflow path
Insert Anything into Report?
Yes. Text.
Class
rptgen_sf.csf_obj_name
8-183
8
Components — Alphabetical List
See Also
Chapter/Subsection, Chart Loop, State Loop, Stateflow Filter
8-184
Stateflow Property
Stateflow Property
Insert into report table, text, or paragraph with information on selected Stateflow object
property
Description
This component inserts a table, text, or paragraph that contains details of the selected
Stateflow object property.
Property to Display
Property name: Specifies the Stateflow property name to display.
Display Options
• Title: Specifies a title to display in the generated report.
• Automatic: Uses the parameter name as the title.
• Custom: Specifies a custom title.
• None: Specifies no title.
• Size limit: Specifies the width of the display in the generated report. Units are in
pixels. The size limit for a given table is the hypotenuse of the width and height of the
table, sqrt(w^2+h^2). The size limit for text is the number of characters squared. If
you exceed the size limit, the variable appears in condensed form.
Setting a size limit of 0 always displays the variable in long form, regardless of its
size.
• Display as: Specifies a display style from the menu.
• Auto table/paragraph (default): Displays as a table or paragraph based on the
information.
• Table: Displays as a table.
• Paragraph: Displays as a text paragraph.
8-185
8
Components — Alphabetical List
• Inline text: Displays in line with the surrounding text.
• Ignore if value is empty: Excludes empty parameters from the generated report.
Insert Anything into Report?
Yes. Text, paragraph, or table.
Class
rptgen_sf.csf_property
See Also
Paragraph, Table, Text, Stateflow Name
8-186
Stateflow Property Table
Stateflow Property Table
Insert into report property-value table for Stateflow object
Description
This component inserts a property-value table for a Stateflow object into the report. Use
the Stateflow Filter component as the parent of this component.
For more information on working with Property Table components, see “Property Table
Components” on page 6-6.
Table
Select a preset table, which is already formatted and set up, in the preset table list in the
upper-left corner of the attributes page.
• preset table: Specifies a type of table to display the object property table.
• Default
• Machine
• Chart
• State
• Truth table
• EM function
• Data
• Event
• Junction
To apply a preset table, select the table and click Apply.
• Split property/value cells: Splits property name/property value pairs into separate
cells.
• For the property name and property value to appear in adjacent horizontal cells,
select the Split property/value cells check box. In this case, the table is in split
8-187
8
Components — Alphabetical List
mode, there is only one property name/property value pair per cell. If there is more
than one name/property pair in a cell, only the first pair appears in the report. The
report ignores all subsequent pairs.
• For the property name and property value to appear together in one cell, clear the
Split property/value cells check box. This setting is nonsplit mode. Nonsplit
mode supports more than one property name/property value pair and text.
• Before switching from nonsplit mode to split mode, make sure that there is
only one property name/property value pair per table cell. When there is more
than one property name/property value pair or any text in a given cell, only the
first property name/property value pair appears in the report. The report omits
subsequent pairs and text.
• Display outer border: Displays the outer border of the table in the generated
report.
• Table Cells: Specifies table properties to modify. The selection in this pane affects
the available fields in the Cell Properties pane.
Cell Properties
The options in the Title Properties pane depend on the object selected in the Table
Cells pane. If you select %<Name>, only Contents and Show appear. If you select any
other object in the Table Cells pane, Lower border and Right border appear.
• Contents: Modifies the contents of the table cell selected in the Table Cells pane.
• Alignment: Justifies the contents of the selected table cell in the Table Cells pane.
• Left
• Center
• Right
• Double justified
• Show As: Specifies the format for the contents of the table cell.
• Value
• Property Value
• PROPERTY Value
• Property: Value
8-188
Stateflow Property Table
• PROPERTY: Value
• Property - Value
• PROPERTY - Value
• Lower border: Displays the lower border of the table in the generated report.
• Right border: Displays the right border of the table in the generated report.
Creating Custom Tables
You can edit a preset table, such as the Blank 4x4 table, to create a custom table. Add
and delete rows and add properties. To open the Edit Table dialog box, click Edit.
For details about creating custom property tables, see “Property Table Components” on
page 6-6.
Insert Anything into Report?
Yes. Table.
Class
rptgen_sf.csf_prop_table
See Also
Stateflow Filter
8-189
8
Components — Alphabetical List
Stateflow Snapshot
Insert into report snapshot of Stateflow object
Description
This component inserts a snapshot of a Stateflow object, defined by the Stateflow
Filter parent component, into the report.
This component only executes if the selected object in the Stateflow Filter
component is a graphical object, such as Chart, State, Transition, and Frame.
Snapshot
• Image file format: Specifies the image file format (for example, JPEG or TIFF).
Select Automatic SF Format (default) to choose the format best suited for the
specified report output format automatically. Otherwise, choose an image format that
your output viewer can read.
• Automatic SF Format (uses the file format selected in the Preferences dialog
box)
• Bitmap (16m-color)
• Bitmap (256-color)
• Black and white encapsulated PostScript
• Black and white encapsulated PostScript (TIFF)
• Black and white encapsulated PostScript2
• Black and white encapsulated PostScript2 (TIFF)
• Black and white PostScript
• Black and white PostScript2
• Color encapsulated PostScript
• Color encapsulated PostScript (TIFF)
• Color encapsulated PostScript2
• Color encapsulated PostScript2 (TIFF)
8-190
Stateflow Snapshot
• Color PostScript
• Color PostScript2
• JPEG high quality image
• JPEG medium quality image
• JPEG low quality image
• PNG 24-bit image
• Scalable vector graphics (SVG)
• TIFF - compressed
• TIFF - uncompressed
• Windows metafile
• Paper orientation:
• Portrait
• Landscape
• Rotated
• Largest dimension vertical: Positions the image so that its largest
dimension is vertical.
• Use Chart PaperOrientation setting: Uses the paper orientation setting
for the chart. Use the Simulink PaperOrientation parameter to specify the
orientation.
• Full page image (PDF only): In PDF reports, scales images to fit the full
page, minimizes page margins, and maximizes the size of the image by using
either a portrait or landscape orientation.
For more information about paper orientation, see the orient command in the
MATLAB documentation.
• Image sizing:
• Shrink image to minimum font size specified in Stateflow
Hierarchy Loop: Resizes the image so that the text label font size is the
minimum font size.
• Fixed and Zoom: Specifies the size of the image.
• Scaling: Specifies the percentage of the image size to which to scale it.
8-191
8
Components — Alphabetical List
• Maximum size: Specifies the maximum size for the snapshot in the generated report
in the selected units. Use [width, height] format. In the units text box, select
Inches, Centimeters, Points, or Normalized.
• Use printframe: Inserts a frame around your image. Use the default frame or create
a custom one.
• Use printframe paper settings: Uses the dimensions and parameters as set by the
specified printframe to size your image. If you choose this option, all other options
(except for Image file format) become inactive.
Properties
• Include callouts to describe visible objects: Displays descriptive callouts for
visible objects.
• Insert anchors for transitions and junctions: Inserts anchors for transitions and
junctions into the report.
• None
• Redundant children only
• All
• Run only if Stateflow object has at least the following number of children:
Specifies the minimum number of children that the current Stateflow object must
have to include in the report. This option is inactive unless the selected object in the
parent Stateflow Filter component is a graphical object.
Tip This option allows you to exclude certain images to decrease the size of the report
for large models.
Display Options
• Scaling:
• Use image size: Uses the image size that you specify in the snapshot option.
• Zoom and Fixed size: Allows you to specify the size of the image.
• Size: Specifies a size in inches for your image. The default is 7-by-9.
8-192
Stateflow Snapshot
• Max size: Specifies the maximum size of the snapshot in the format w h (width,
height). This field is active only if you choose Zoom from the Scaling selection list.
• Units: Specifies the units for the size of the snapshot. This field is active only if you
choose Zoom or Fixed size in the Image size list box.
• Alignment: Only reports in PDF or RTF format support this property.
• Auto
• Right
• Center
• Left
• Image title:
• None(Default).
• Object name: Uses the object name as the title.
• Full Stateflow name: Specifies the Stateflow path and the name of the object.
• Full Simulink + Stateflow name: Specifies the Simulink path and name of
the object.
• Custom: Enter a different title.
• Caption: Specifies a caption for your image.
• None(Default).
• Custom: Specifies a custom caption.
• Description: Sets the caption to the value of the object Description property.
Insert Anything into Report?
Yes. Image.
Class
rptgen_sf.csf_obj_snap
8-193
8
Components — Alphabetical List
Class
rptgen_sf.csf_prop_table
See Also
Stateflow Filter
8-194
Stateflow Summary Table
Stateflow Summary Table
Table of properties or parameters of specified Stateflow object
Description
This component displays a table of properties or parameters of specified Stateflow
objects. It can have the following parents:
• Any Stateflow looping component
• Any Simulink looping component (Model Loop, System Loop, Block Loop, or
Signal Loop)
Properties
• Object type: Specifies the object type to display in the generated report. This value
affects the options available in the Property Columns pane.
• Table title: Specifies a title for the Summary Table in the generated report.
• Automatic: Generates a title automatically from the parameter.
• Custom: Specifies a custom title.
Property Columns
• Property columns: Displays the object properties to include in the Summary Table
in the generated report.
• To add a property:
• Select the appropriate property level in the text box.
• In the context list under the text box, select the property that you want to add
and click Add.
• To delete a property, select the property name and press the Delete key.
Some entries in the list of available properties (such as Depth) are “virtual”
properties that you cannot access using the get_param command. The properties
8-195
8
Components — Alphabetical List
used for property/value filtering in the block and System Loop components must be
retrievable by the get_param. Therefore, you cannot configure your Summary Table
to report on all blocks of Depth == 2.
• Remove empty columns: Removes empty columns from the Summary Table in the
generated report.
• Transpose table: Changes the summary table rows into columns in the generated
report, putting the property names in the first column and the values in the other
columns.
Object Rows
Insert anchor for each row: Inserts an anchor for each row in the summary table.
Report On
• Automatic list from context: Reports on all blocks in the current context, as set by
the parent component.
• Custom - use block list: Reports on a specified list of blocks. Specify the full path of
each block.
Loop Options
Choose block sorting options and reporting options in this pane.
• Sort blocks: Specifies how to sort blocks (applied to each level in a model):
• Alphabetically by block name: Sorts blocks alphabetically by name.
• Alphabetically by system name: Sorts systems alphabetically by name. Lists
blocks in each system, but in no particular order.
• Alphabetically by full Simulink path: Sorts blocks alphabetically by
Simulink path.
• By block type: Sorts blocks alphabetically by block type.
• By block depth: Sorts blocks by their depth in the model.
• By layout (left to right): Sorts blocks by their location in the model
layout, by rows. The block appearing the furthest toward the left top corner of the
8-196
Stateflow Summary Table
model is the anchor for the row. The row contains all other blocks that overlap
the horizontal area defined by the top and bottom edges of the anchor block. The
other rows use the same algorithm, using as the anchor the next unreported block
nearest the left top of the model.
• By layout (top to bottom): Sorts blocks by their location in the model
layout, by columns. The block appearing the furthest toward the left top corner
of the model is the anchor for the column. The column contains all other blocks
that overlap the vertical area defined by the left and right edges of the anchor
block. The other columns use the same algorithm, using as the anchor the next
unreported block nearest the left top of the model.
• By traversal order: Sorts blocks by traversal order.
• By simulation order: Sorts blocks by execution order.
• Search for Simulink property name/property value pairs: Reports on blocks
with specified property name/property value pairs.
• Search Stateflow: Reports on Stateflow charts with specified property name/
property value pairs.
Insert Anything into Report?
Yes. Table.
Class
rptgen_sf.csf_summ_table
8-197
8
Components — Alphabetical List
See Also
Block Loop, Chart Loop, Model Loop, Object Loop, Signal Loop, State Loop,
Stateflow Hierarchy Loop, System Loop
8-198
System Filter
System Filter
Run child components if current system meets specified conditions
Description
This component runs its child components if the current system meets the conditions
that you specify with this component.
Properties
• Report only if system has at least N blocks: Specifies the minimum number of
blocks that the system must include for any of the child components to run. If you
enter 0, child components run regardless of the number of blocks in the system.
• Report only if system has at least N subsystems: Specifies the minimum number
of subsystems that the system must include for the child components to run. If you
enter 0, child components run regardless of the number of subsystems in the system.
• Report only if system mask type is: Specifies which masks to include in the
generated report.
• Either masked or unmasked
• Masked
• Unmasked
• Custom filtering MATLAB code: Specifies custom MATLAB filtering code that the
System Filter applies when determining which systems and subsystems to report on
in a System Loop component. The edit box includes a sample function (commented
out) that you can use as a starting point for your own filtering function. Use the
isFiltered variable for the output of your function. For example, to filter out
systems and subsystems whose names start with engine, enter:
isFiltered = strncmpi( currentSystem, 'engine', 6);
Insert Anything into Report?
No.
8-199
8
Components — Alphabetical List
Class
rptgen_sf.csf_obj_filter
See Also
System Loop
8-200
System Hierarchy
System Hierarchy
Create nested list that shows hierarchy of specified system
Description
This component creates a nested list that shows the hierarchy of a specified system. The
list can display all systems in a model, or the parents and children of the current system.
Starting System
• Build list from: Specifies the system or model from which to build the list.
• Current system
• Current model
• Emphasize current system: Highlights the current system or model in the
generated report.
Display Systems
• Show number of parents: Specifies the number of parents to list.
• Display peers of current system: Shows the peers of the current system in the
generated report.
• Show children to depth: Specifies the depth of children to list.
List Formatting
• List style:
• Bulleted list
• Numbered list: Allows you to select numbering options in the Numbering style
section.
8-201
8
Components — Alphabetical List
• Numbering style: Allows you to select a numbering style in the selection list, by
setting List style to Numbered List. Only the RTF/DOC report format supports this
option.
• 1,2,3,4,...
• a,b,c,d,...
• A,B,C,D,...
• i,ii,iii,iv,...
• I,II,III,IV,...
Insert Anything into Report?
Yes. List.
Class
rptgen_sl.csl_sys_list
See Also
Model Loop, System Loop
8-202
System Loop
System Loop
Specify systems and subsystems on which to loop, as defined by parent component
Description
This component runs its child components for each system defined by the parent
component. For example, to include systems and subsystems within a given model in the
report, you can include this component as the child of a Model Loop component.
For conditional processing systems, you can use the RptgenSL.getReportedSystem
function. For more information, see “Loop Context Functions” on page 6-24.
Report On
• Loop on Systems:
• Select systems automatically: Reports on all systems in the current context as
set by the parent component.
• Model Loop: Reports on systems in the current model.
• System Loop: Reports on the current system.
• Signal Loop: Reports on the parent system of the current signal.
• Block Loop: Reports on the parent system of the current block.
If this component does not have any of these components as its parent, selecting
this option reports on all systems in all models.
• Custom - use system list: Reports on a list of specified systems. Specify the full path
of each system.
• %<VariableName>: Inserts the value of a variable from the MATLAB workspace.
The %<> notation can denote a string or cell array. For more information, see
%<VariableName> Notation on the Text component reference page.
• Include subsystems in Simulink functions: Specifies whether to include
subsystems in Simulink functions. By default, this option is enabled.
8-203
8
Components — Alphabetical List
Loop Options
• Sort Systems: Specifies how to sort systems.
• Alphabetically by system name (default): Sorts systems alphabetically by
name.
• By number of blocks in system: Sorts systems by number of blocks. The list
shows systems by decreasing number of blocks; that is, the system with the largest
number of blocks appears first in the list.
• By system depth: Sorts systems by their depth in the model.
• By traversal order: Sorts systems in traversal order.
• Search for: Reports only on blocks with the specified property name/property value
pairs. To enable searching, click the check box. In the first row of the property name
and property value table, click inside the edit box, delete the existing text, and type
the property name and value. To add a row, use the Add row button (
).
For information about subsystem property names and values, in “Block-Specific
Parameters”, see the “Ports & Subsystems Library Block Parameters” section.
Section Options
• Create section for each object in loop: Inserts a section in the generated report
for each object found in the loop.
• Display the object type in the section title: Inserts the object type automatically
into the section title in the generated report.
• Number sections by system hierarchy: Hierarchically numbers sections in the
generated report. Requires that Sort Systems be set to By traversal order.
• Create link anchor for each object in loop: Creates a hyperlink to the object in
the generated report.
Examples
For an example of how to use this component with a Model Loop as its parent, see
Model Loop.
8-204
System Loop
Insert Anything into Report?
Yes, inserts a section if you select the Create section for each object in loop option.
Class
rptgen_sl.csl_sys_loop
See Also
Block Loop, Model Loop, Signal Loop, System Loop
8-205
8
Components — Alphabetical List
System Snapshot
Insert snapshot of the current system into report
Description
This component inserts a snapshot of the current system into the report. The Snapshot
options control how the image file is stored. The Properties options control whether the
image display includes callouts and a print frame. The Display options control how the
image is displayed in a browser.
Snapshot Options
• Format: Specifies the image file format (for example, JPEG or TIFF). Select
Automatic SL Format (the default) to choose the format best suited for the
specified report output format automatically. Otherwise, choose an image format that
your output viewer can read.
• Automatic SL Format (uses file format selected in the Preferences dialog box)
• Bitmap (16m-color)
• Bitmap (256-color)
• Black and white encapsulated PostScript
• Black and white encapsulated PostScript (TIFF)
• Black and white encapsulated PostScript2
• Black and white encapsulated PostScript2 (TIFF)
• Black and white PostScript
• Black and white PostScript2
• Color encapsulated PostScript
• Color encapsulated PostScript (TIFF)
• Color encapsulated PostScript2
• Color encapsulated PostScript2 (TIFF)
• Color PostScript
8-206
System Snapshot
• Color PostScript2
• JPEG high quality image
• JPEG low quality image
• JPEG medium quality image
• PNG (screenshot)
• PNG 24-bit image
• Scalable Vector Graphics
• Windows metafile
• Orientation:
• Largest dimension vertical: Positions the image so that its largest
dimension is vertical.
• Landscape
• Portrait
• Use system orientation: Uses the paper orientation setting for the system.
Use the Simulink PaperOrientation parameter to specify the orientation.
• Full page image (PDF only): In PDF reports, scales images to fit the full
page, minimizes page margins, and maximizes the size of the image by using
either a portrait or landscape orientation.
• Scaling: Controls the size of the image in the image file.
• Automatic (default): Automatically scales the image to output dimensions.
• Custom: Specifies image size.
• Zoom: Enlarges or reduces the image size to the percent that you specify. Use Max
Size to specify the maximum size other than the default for the image.
Note: Selecting the Use printframe deactivates the Custom and Zoom options
and automatically scales the image to the print frame size.
Properties Options
• Include callouts to describe visible objects: Displays descriptive callouts for
visible objects
8-207
8
Components — Alphabetical List
• Use printframe: Prints a frame around the image. You can use the default frame,
rptdefaultframe.fig, or use the Frame Editor to build a custom frame. For more
information, see the frameedit function in Simulink documentation.
The default frame is five inches wide and four inches high. It includes the name of the
system and the model folder. This frame is optimized for use with a portrait paper
orientation. The Flight Control Model in the f14 Simulink model appears here with
the default Simulink Report Generator frame option.
8-208
System Snapshot
Display Options
To access the display options, click the Advanced button.
• Scaling: Controls size of the image, as displayed in a browser. Making an image
larger using this option does not affect the storage size of the image, but the quality
of the displayed image may decrease as you increase or decrease the size of the
displayed image.
Generally, to achieve the best and most predictable display results, use the default
setting of Use image size.
• Use image size: Causes the image to appear the same size in the report as on
screen (default).
• Fixed size: Specifies the number and type of units.
• Zoom: Specifies the percentage, maximum size, and units of measure.
• Size: Specifies the size of the snapshot in a browser, using the format w h (width,
height). This field is active only if you choose Fixed size in the Scaling selection
list.
• Max size: Specifies the maximum size of the snapshot in a browser, using the format
w h (width, height). This field is active only if you choose Zoom in the Scaling
selection list.
• Units: Specifies the units for the size of the snapshot in a browser. This field is active
only if you choose Fixed size in the Image size list box.
• Alignment: Only reports in PDF or RTF format support this property.
• Auto
• Right
• Left
• Center
• Image title:
• None (Default)
• System name: Uses the system name as the image name.
• Full system name: Uses the system name, with path information, as the image
name.
• Custom: Specifies a custom title.
8-209
8
Components — Alphabetical List
• Caption:
• None (Default)
• Description (use system description)
• Custom: Specifies a custom caption.
Insert Anything into Report?
Yes. Image.
Class
rptgen_sl.csl_sys_snap
See Also
System Loop
8-210
Test Sequence
Test Sequence
Capture Test Sequence block information
Description
This component captures information about Simulink Test™ Test Sequence blocks. The
report includes the test sequence using the tabular series of steps from the Test Sequence
block.
Test Sequence Block Section Title
Title to use for the Test Sequence block section:
• Use Test Sequence name (default): Use the name of the Test Sequence block as
the section title.
• Custom: Specify a custom section title in the text box.
Insert Anything into Report?
Yes.
Class
rptgen_stm.cstm_testseq
8-211
8
Components — Alphabetical List
To Workspace Plot
Capture plot figure created in the MATLAB workspace
Description
This component captures a plot figure created in the MATLAB workspace, and then
inserts one or both of the following into the report:
• A table that includes input and output numeric values.
• A figure that plots the values included in the table.
Print Options
• Image file format: Specifies the image file format (for example, JPEG or TIFF) from
this list. Select Automatic HG Format (the default) to choose the format best suited
for the specified report output format automatically. Otherwise, choose an image
format that your output viewer can read. Other options are:
• Automatic HG Format (Uses the file format selected in the Preferences dialog
box)
• Bitmap (16m-color)
• Bitmap (256-color)
• Black and white encapsulated PostScript
• Black and white encapsulated PostScript (TIFF)
• Black and white encapsulated PostScript2
• Black and white encapsulated PostScript2 (TIFF)
• Black and white PostScript
• Black and white PostScript2
• Color encapsulated PostScript
• Color encapsulated PostScript (TIFF)
• Color encapsulated PostScript2
• Color encapsulated PostScript2 (TIFF)
8-212
To Workspace Plot
• Color PostScript
• Color PostScript2
• JPEG high quality image
• JPEG medium quality image
• JPEG low quality image
• PNG 24-bit image
• TIFF - compressed
• TIFF - uncompressed
• Windows metafile
• Paper orientation:
• Landscape
• Portrait
• Rotated
• Use figure orientation: Uses the orientation for the figure, which you set
with the orient command.
• Full page image (PDF only): In PDF reports, scales images to fit the full
page, minimizes page margins, and maximizes the size of the image by using
either a portrait or landscape orientation.
For more information about paper orientation, see the orient command in the
MATLAB documentation.
• Image size:
• Use figure PaperPositionMode setting: Uses the PaperPositionMode
property of the Handle Graphics figure to set the image size in the report. For
more information about paper position mode, see the orient command in the
MATLAB documentation.
• Automatic (same size as on screen): Sets the image in the report to the
same size as it appears on the screen.
• Custom: Specifies a custom image size. Specify the image size in the size and
units fields.
8-213
8
Components — Alphabetical List
• Size: Specifies the size of the Handle Graphics figure snapshot in the format wxh
(width times height). This field is active only if you choose Custom in the Image size
list box.
• Units: Specifies units for the size of the Handle Graphics figure snapshot. This field is
active only if you choose Set image size in the Custom list box.
• Invert hardcopy: Uses the Handle Graphics figures InvertHardcopy property,
which inverts colors for printing; it changes dark colors to light colors, and light colors
to dark colors.
• Automatic: Automatically changes dark axes colors to light axes colors. If the
axes color is a light color, it is unchanged.
• Invert: Changes dark axes colors to light axes colors, and light axes colors to dark
axes colors.
• Don't invert: Retains image colors displayed on screen in the printed report.
• Use figure's InvertHardcopy setting: Uses the InvertHardcopy
property set in the Handle Graphics image.
• Make figure background transparent: Makes the image background
transparent.
Display Options
• Scaling: Controls size of the image, as displayed in a browser. Making an image
larger using this option does not affect the storage size of the image, but the quality
of the displayed image may decrease as you increase or decrease the size of the
displayed image.
Generally, to achieve the best and most predictable display results, use the default
setting of Use image size.
• Use image size: Causes the image to appear the same size in the report as on
screen (default).
• Fixed size: Specifies the number and type of units.
• Zoom: Specifies the percentage, maximum size, and units of measure.
• Size: Specifies the size of the snapshot in the format w h (width, height). This field is
active only if you choose Fixed size in the Scaling list.
8-214
To Workspace Plot
• Max size: Specifies the maximum size of the snapshot in the format w h (width,
height). This field is active only if you choose Zoom from the Scaling list.
• Units: Specifies units for the size of the snapshot. This field is active only if you
choose Zoom or Fixed size in the Image size list box.
• Alignment: Only reports in PDF or RTF format support this property.
• Auto
• Right
• Left
• Center
• Title: Specifies text to appear above the snapshot.
• Caption: Specifies text to appear under the snapshot.
Insert Anything into Report?
Yes. Figure.
Class
rptgen_sl.csl_blk_toworkspace
See Also
Figure Loop
8-215
8
Components — Alphabetical List
Truth Table
Report on truth tables in Simulink and Stateflow models
Description
The Truth Table component reports on truth tables in Simulink and Stateflow models. It
displays both the condition table and the action table. The parent component of the Truth
Table determines its behavior.
• Model Loop: Reports on all truth tables in the current model.
• System Loop: Reports on all truth tables in the current system.
• Block Loop : Reports on all truth tables in the current block.
• Signal Loop: Reports on all truth tables in the current signal.
Title
Title: Specifies a title for the truth table.
• No title
• Use Stateflow name
• Custom
Condition Table
Specify display parameters for the condition table.
• Show header: Displays the column headers in the table.
• Show number: Displays the condition number column in the table.
• Show condition: Displays the condition column in the table.
• Show description: Displays the description column in the table.
• Wrap if column count: Specifies how many columns to display before creating a
table continuation. If the specified number is greater than the number of columns
that can appear on the page, some columns do not appear in the report.
8-216
Truth Table
Action Table
• Show header: Displays the column headers in the table.
• Show number: Displays the condition number column in the table.
• Show condition: Displays the condition column in the table.
• Show description: Displays the description column in the table. If you do not select
this option, no action table appears in the report.
Insert Anything into Report?
Yes. Table.
Class
rptgen_sf.csf_truthtable
See Also
Block Loop, Model Loop, Signal Loop, System Loop
8-217
8
Components — Alphabetical List
Variable Access
Create table showing global variable access in source code
Description
This component creates a table showing the global variable access in your source code.
For each global variable, the table displays the following information:
• Variable name.
The entry for each variable is denoted by |.
• Type of the variable.
• Number of read and write operations on the variable.
• Details of read and write operations. For each read or write operation, the table
displays the following information:
• File and function containing the operation in the form
file_name.function_name.
The entry for each read or write operation is denoted by ||. Write operations are
denoted by < and read operations by >.
• Line and column number of the operation.
This table captures the information available on the Variable Access pane in the
Polyspace user interface.
8-218
9
Functions – Alphabetical List
9
Functions – Alphabetical List
report
Generate report from specified Simulink system
Syntax
report
report (filename,...)
report ( ___ ,-oOPATH)
report ( ___ ,-fFORMAT)
report ( ___ ,-genOption1,...)
[report1, report2, ...] = report (rptfile1, rptfile2, ...)
Description
• report with no arguments opens the Report Explorer. For more information on the
Report Explorer, see “Working with the Report Explorer”
• report (filename,...) generates a report from the specified report setup files.
You can specify one or more report setup files. When specifying the name of the report
setup file, omit the .rpt file name extension.
• report ( ___ ,-oOPATH) sets the name of the generated report. You can specify a
path or a single file name for the OPATH path argument.
• report ( ___ ,-fFORMAT) sets the output format and file name extension of the
generated report. Supported formats include:
• Adobe Acrobat PDF (.pdf)
• HTML (.html)
• Microsoft Word (.doc)
• Rich Text format (.rtf)
For example, report(‘simple-report’,’-fPDF) generates a PDF file.
• report ( ___ ,-genOption1,...) specifies one or more of the following report
generation options:
• -noview — Prevents launching the file viewer
9-2
report
• -graphical — Shows hierarchy in Report Explorer
• -debug — Enables debug mode
• -quiet — Sets error echo level to 0
• -sSTYLESHEETNAME — Sets stylesheet name (not required when choosing format)
• [report1, report2, ...] = report (rptfile1, rptfile2, ...) returns
the names of the generated reports. If the MATLAB Report Generator software
cannot generate a given report, its returned name is empty.
Examples
Example 1: Setting the format of the generated report
• Generate the report testrpt in PDF format:
report testrpt -fpdf
• Generate the report testrpt in RTF format:
report testrpt -frtf
• Generate the report testrpt in Microsoft Word format:
report testrpt -fdoc
Note: Only Microsoft Windows platforms support this option.
• Generate a multipage HTML report from the figloop-tutorial report setup file:
report figloop-tutorial -fhtml -shtml-!MultiPage
Example 2: Specifying the file and path of the generated report
Generate a report named simple-report in the folder /tmp/index.html:
report ('simple-report','-o/tmp/index.html')
More About
•
“Generate Reports”
9-3
9
Functions – Alphabetical List
See Also
setedit | rptconvert | rptlist | compwiz
9-4
rptlist
rptlist
Return list of all report s in MATLAB path
Syntax
rptlist
rptlist ('system_name')
list = rptlist
Description
rptlist with no arguments opens the Report Explorer, which lists available report
setup files in the MATLAB path. You can open, run, or associate these files with the
current Simulink system.
rptlist ('system_name') opens the Report Explorer with the Simulink system's
ReportName property selected.
list = rptlist returns a list of report setup files in the MATLAB path.
See Also
report | setedit | rptconvert | compwiz
9-5
9
Functions – Alphabetical List
slwebview
Export Simulink models to Web views
Syntax
slwebview
filename = slwebview(system_name)
filename = slwebview(system_name,Name,Value)
Description
slwebview starts the Web View dialog box in the Report Explorer.
filename = slwebview(system_name) exports the subsystem system_name and its
child systems to the file filename.
filename = slwebview(system_name,Name,Value) provides additional options
specified by one or more Name,Value pairs.
Examples
Export Web View for a Subsystem and Systems that Contain that Subsystem
Open the fuel rate controller subsystem.
open_system('fuelsys')
Export to a Web view the fuel rate controller subsystem and the system that contains it.
Do not export the subsystems that it contains. This example assumes the current folder
is the H: drive.
fuelsys_web_view = slwebview...
('fuelsys/fuel rate controller','SearchScope','CurrentAndAbove')
fuelsys_web_view =
9-6
slwebview
H:\fuel_rate_controller\webview.html
The Web view displays in the system browser.
Export Web View with Access to Referenced Models
Open the sldemo_mdlref_depgraph model.
open_system('sldemo_mdlref_depgraph')
Export to a Web view the sldemo_mdlref_depgraph model and allow access to the
models it references.
depgraph_web_view = slwebview...
('sldemo_mdlref_depgraph','FollowModelReference','on')
depgraph_web_view =
H:\sldemo_mdlref_depgraph\webview.html
The Web view displays in the system browser. In the Web view, you can open the models
referenced by the Model blocks.
9-7
9
Functions – Alphabetical List
Click a Model block to see its properties. Double-click a Model block to display the
referenced model.
•
“Create and Use a Web View” on page 5-13
Input Arguments
system_name — The system to export to a Web view file
string containing the path to the system | handle to a subsystem or block diagram |
handle to a chart or subchart
Exports the specified system or subsystem and its child systems to a Web view file.
By default, child systems of the system_name system are also exported. Use the
SearchScope name-value pair to export other systems, in relation to system_name.
Name-Value Pair Arguments
Specify optional comma-separated pairs of Name,Value arguments. Name is the
argument name and Value is the corresponding value. Name must appear inside single
9-8
slwebview
quotes (' '). You can specify several name and value pair arguments in any order as
Name1,Value1,...,NameN,ValueN.
Example: htmlFileName = slwebview(gcs,'LookUnderMasks','all',...
'FollowLinks','on') Export to a Web view all layers of the model hierarchy to which
the current system belongs, including the ability to interact with library links and masks.
'SearchScope' — Systems to export, relative to the system_name system
'CurrentAndBelow' (default) | 'Current' | 'CurrentAndAbove' | 'All'
'CurrentAndBelow' exports the Simulink system or the Stateflow chart specified by
system_name and all systems or charts that it contains.
'Current' exports only the Simulink system or the Stateflow chart specified by
system_name.
'CurrentAndAbove' exports the Simulink system or the Stateflow chart specified by
the system_name and all systems or charts that contain it.
'All' exports all Simulink systems or Stateflow charts in the model that contains the
system or chart specified by system_name.
Data Types: char
'LookUnderMasks' — Specifies whether to export the ability to interact with masked blocks
'none' (default) | 'all'
'none' does not export masked blocks in the Web view. Masked blocks are included in
the exported systems, but you cannot access the contents of the masked blocks.
'all' exports all masked blocks.
Data Types: char
'FollowLinks' — Specifies whether to follow links into library blocks
'off' (default) | 'on'
'off' does not allow you to follow links into library blocks in a Web view.
'on' allows you to follow links into library blocks in a Web view.
Data Types: char
'FollowModelReference' — Specifies whether to access referenced models in a Web view
'off' (default) | 'on'
9-9
9
Functions – Alphabetical List
'off' does not allow you to access referenced models in a Web view.
'on' allows you to access referenced models in a Web view.
Data Types: char
'ViewFile' — Specifies whether to display the Web view in a Web browser when you
export the Web view
true (default) | false
true displays the Web view in a Web browser when you export the Web view.
false does not display the Web view in a Web browser when you export the Web view.
Data Types: logical
'ShowProgressBar' — Specifies whether to display the status bar when you export a Web
view
true (default) | false
true displays the status bar when you export a Web view.
false does not display the status bar when you export a Web view.
Data Types: logical
Output Arguments
filename — The name of the HTML file for displaying the Web view
string
Reports the name of the HTML file for displaying the Web view. Exporting a Web view
creates the supporting files, in a folder.
More About
Tips
A Web view is an interactive rendition of a model that you can view in a Web browser.
You can navigate a Web view hierarchically to examine specific subsystems and to see
properties of blocks and signals.
9-10
slwebview
You can use Web views to share models with people who do not have Simulink installed.
Web views require a Web browser that supports Scalable Vector Graphics (SVG).
Introduced in R2006a
9-11
10
Template-Based Report Formatting
• “Report Conversion Templates” on page 10-2
• “Generate a Report Using a Template” on page 10-4
• “Conversion Template Contents” on page 10-5
• “Copy a Conversion Template” on page 10-12
• “Open a Conversion Template” on page 10-14
• “Set Conversion Template Properties” on page 10-15
• “Move a Conversion Template” on page 10-16
• “Delete a Conversion Template” on page 10-17
• “Customize Microsoft Word Report Styles” on page 10-18
• “Customize Microsoft Word Part Templates” on page 10-21
• “Customize a Microsoft Word Title Page Template” on page 10-30
• “Create a Custom HTML Template” on page 10-36
10
Template-Based Report Formatting
Report Conversion Templates
In this section...
“Templates for Report Conversion” on page 10-2
“Custom Templates” on page 10-2
“Custom Component Styles” on page 10-2
“Benefits of Using Templates” on page 10-2
Templates for Report Conversion
By selecting the Word (from template) output type, you can cause the Report
Generator to use a Microsoft Word template to convert the XML content for a report to a
Word or PDF document. Similarly, by selecting HTML (from template), you can cause
the Report Generator to use an HTML template to convert XML content to an HTML
document. The Report Generator uses the template to determine the layout and format of
the resulting document.
Custom Templates
The MATLAB Report Generator comes with default HTML and Word templates. You can
create customized versions of these templates to meet your report formatting and layout
requirements. You can use a custom template to generate a report. Specify the name of
the custom template in the Report Options dialog box, in the Template field.
Custom Component Styles
You can use styles defined in your custom template to format instances of Paragraph,
Text, and other report components. In the component properties dialog box, specify the
name of the style in the Style field.
Benefits of Using Templates
When you use a template to generate a report, report generation:
• Is faster.
10-2
Report Conversion Templates
• Does not use Java memory to convert report XML content to HTML, Word, or PDF.
Converting report XML content without using a template can cause Java to run out of
memory.
Also, templates allow you to use your knowledge of Word and HTML document
formatting to format reports.
Related Examples
•
“Generate a Report Using a Template” on page 10-4
•
“Copy a Conversion Template” on page 10-12
•
“Customize Microsoft Word Report Styles” on page 10-18
•
“Customize Microsoft Word Part Templates” on page 10-21
•
“Customize a Microsoft Word Title Page Template” on page 10-30
•
“Create a Custom HTML Template” on page 10-36
More About
•
“Report Conversion Templates” on page 10-2
•
“Conversion Template Contents” on page 10-5
10-3
10
Template-Based Report Formatting
Generate a Report Using a Template
1
In Report Explorer, in the Outline pane, select the report.
2
In the Report Options dialog box that appears in the Properties pane, set the File
format field to one of these options:
• HTML (from template)
• PDF (from template)
• Word (from template)
3
Optionally, from the list of templates available for the current file format, select a
template.
4
If you select HTML (from template) for the file format, choose a packaging option
for the output files.
• Unzipped — Generate the report files in a subfolder of the current folder. The
subfolder has the report name.
• Zipped — Package report files in a single compressed file that has the report
name, with a .zip extension.
• Both Zipped and Unzipped
5
In the toolbar, click the Report button (
).
Generate SDD Report Using a Template
If you have Simulink installed, you can generate a System Design Description (SDD)
report. You can use a template when you generate the SDD report. This example shows
how to generate a report using the PDF format template.
1
Open a model, such as vdp.
2
In the Simulink Editor, select File > Reports > System Design Description.
3
In the Design Description dialog box, set File format to PDF (from template).
4
Optionally, in the Template field, specify a template.
5
Click Generate.
More About
•
10-4
“Report Conversion Templates” on page 10-2
Conversion Template Contents
Conversion Template Contents
In this section...
“Default Styles” on page 10-5
“Part Templates” on page 10-9
“Header and Footers in Word Conversion Templates” on page 10-10
A report conversion template contains:
• A main template with default style definitions for report elements.
• Part templates for the report elements such as title pages, chapters, and titles for
sections and tables. Part templates contain fill-in-the-blanks holes for generated
content.
• Headers and footers.
Default Styles
The default conversion template includes styles that the Report Explorer uses to
format components during report generation. Most styles begin with rg (for example,
rgTitle). Styles for syntax highlighting MATLAB code begin with MWSG, for example,
MWSHKeywords. The default style names and formatting are the same for the Word and
HTML templates, to the extent applicable. For example, page break formatting applies
when you use a Word template, but not an HTML template.
You can modify the built-in styles, but do not delete them. In addition, you can define
your own styles and use them in components that allow you to specify a style, such as the
Paragraph component.
Style
Report Explorer Components the Style Formats
MWSHComment
MATLAB code comment
MWSHKeywords
MATLAB code keywords
MWSHStrings
MATLAB code strings
rgAbstract
Title Page component abstract
rgAbstractTitle
Title Page component abstract section
rgAuthor
Title Page component front page author
rgAuthorVerso
Title Page component back page author
10-5
10
10-6
Template-Based Report Formatting
Style
Report Explorer Components the Style Formats
rgBody
Text component
rgChapter
Chapter component
rgChapterTitle
Chapter component title
rgCopyright
Title Page component copyright
rgFigure
Paragraph that contains an image
generated by a snapshot or Image
component, to adjust the spacing of images
relative to adjacent paragraphs
rgFigureCaption
The caption for Image component and
snapshot components
rgFigureTitle
The Image component and snapshot
components title
rgFigureTitleNumber
The Image component and snapshot
components title number
rgFigureTitlePrefix
The Image component and snapshot
components title prefix
rgFigureTitleText
The Image component and snapshot
components title text
rgLegalNotice
Title Page component legal notice
section
rgListTitle
The List component title
rgListTitleNumber
The List component title number
rgListTitlePrefix
The List component title prefix
rgListTitleText
The List component title text
rgParagraph
Paragraph component text
rgParagraphTitle
Paragraph component title
Conversion Template Contents
Style
Report Explorer Components the Style Formats
rgProgramListing
Code generated by:
• Text component with Show text as
syntax highlighted MATLAB code
option is selected
• MATLAB Function Block component
• Truth Table component
rgPubDate
Title page report creation date
rgPubDatePrefix
Title page report creation date prefix
rgSect1Title
Section title for first-level section in a
chapter
rgSect1TitleNumber
Number for Section title for first-level
section in a chapter
rgSect1TitlePrefix
Prefix for Section title for first-level
section in a chapter
rgSect1TitleText
Text for Section title for first-level section
in a chapter
rgSect2Title
Section title for second-level section in a
chapter
rgSect2TitleNumber
Number for Section title for second-level
section in a chapter
rgSect2TitlePrefix
Prefix for Section title for second-level
section in a chapter
rgSect2TitleText
Text for Section title for second-level
section in a chapter
rgSect3Title
Section title for third-level section in a
chapter
rgSect3TitleNumber
Number for Section title for third-level
section in a chapter
rgSect3TitlePrefix
Prefix for Section title for third-level
section in a chapter
10-7
10
10-8
Template-Based Report Formatting
Style
Report Explorer Components the Style Formats
rgSect3TitleText
Text for Section title for third-level
section in a chapter
rgSect4Title
Section title for fourth-level section in a
chapter
rgSect4TitleNumber
Number for Section title for fourth-level
section in a chapter
rgSect4TitlePrefix
Prefix for Section title for fourth-level
section in a chapter
rgSect4TitleText
Text for Section title for fourth-level
section in a chapter
rgSect5Title
Section title for fifth-level section in a
chapter
rgSect5TitleNumber
Number for Section title for fifth-level
section in a chapter
rgSect5TitlePrefix
Prefix for Section title for fifth-level
section in a chapter
rgSect5TitleText
Text for Section title for fifth-level section
in a chapter
rgSubTitle
Title Page component subtitle
rgTable
Table content
rgTableTitle
Table title
rgTableTitleNumber
Table title number
rgTableTitlePrefix
Table title prefix
rgTableTitleText
Table title text
rgTitle
Title Page component front page title
abstract, and legal notice section
rgTitleVerso
Title Page component back page title
abstract, and legal notice section
rgTOCSection
Table of contents
Conversion Template Contents
Part Templates
The conversion templates include template parts to format specific elements of a report.
Part Template
Report Explorer Components the Part Template
Formats
rgRectoTitlePage
Title Page
Front title page contents, including the
report title, subtitle, author, and an image.
rgVersoTitlePage
Title Page
Back title page contents, including the
date published, copyright, legal notice, and
abstract.
rgTOCSectionTitle
The table of contents automatically
generated for Word and PDF.
rgChapter
Chapter/Section
Chapter (top-level section), including the
title (prefix, such as Chapter, number, and
title) and for the content.
rgSect1Title
Chapter/Section
rgSect2Title
Title for a section (sections below the
chapter level). The title can include a prefix
(such as Chapter), number, and title.
rgSect3Title
rgSect4Title
rgSect5Title
rgListTitle
List
Title of the list.
rgTableTitle
Table, Array-BasedTable, and table
components such as Handle Graphics
Property Table
10-9
10
Template-Based Report Formatting
Part Template
Report Explorer Components the Part Template
Formats
Table title, including prefix (such as Table,
number, and title) and for the content.
rgFigureTitle
Table and Array-BasedTable
Table title, including prefix (such as Table,
number, and title) and for the content.
Part Template Holes
Part templates include fill-in-the-blanks hole markup. The report converter fills holes
with content that the MATLAB Report Generator generates.
For example, the rgChapter part template in the default Word conversion template
includes an rgChapterTitle hole.
The report converter fills the rgChapterTitle hole with the contents of the Title
property of top-level Chapter/Section components in a report.
You can rearrange or delete holes to change the order in which generated content
appears in the report or to omit content. Do not add holes. If you add holes, the report
converter ignores them.
Header and Footers in Word Conversion Templates
Word conversion templates include headers and footers for the document as a whole.
You can also specify headers and footers for the rgRectoTitlePage,
rgVersoTitlePage, and rgChapter part templates.
10-10
Conversion Template Contents
Related Examples
•
“Generate a Report Using a Template” on page 10-4
•
“Copy a Conversion Template” on page 10-12
•
“Customize Microsoft Word Report Styles” on page 10-18
•
“Customize Microsoft Word Part Templates” on page 10-21
•
“Customize a Microsoft Word Title Page Template” on page 10-30
More About
•
“Report Conversion Templates” on page 10-2
10-11
10
Template-Based Report Formatting
Copy a Conversion Template
Copy a Conversion Template
1
In Report Explorer, select Tools > Edit Document Conversion Template. The
Template Browser appears in the Report Explorer.
2
In the Library pane (middle pane), select a template from the list of Word or HTML
templates. For example, select Default Word Template.
3
In the Template Browser, click Copy template. A file browser appears.
4
In the file browser, navigate to the location where you want to save the template file.
Select a folder that is on the MATLAB path (for example, in the MATLAB folder in
your home folder).
Specify the file name, using the default file extension for a Word template (.dotx).
5
Click Save.
Results
A template you create by copying a template appears in the list of Word or HTML
templates. The initial name of the copy in the list of templates is Copy of ORIGINAL,
where ORIGINAL is the name of the template that you copied. The name in the list is not
the file name you used when you saved the copy.
To change the template name that appears in the list of templates, in the Template
Properties dialog box, specify the name in the Display name field. For details, see “Set
Conversion Template Properties” on page 10-15.
Related Examples
10-12
•
“Set Conversion Template Properties” on page 10-15
•
“Open a Conversion Template” on page 10-14
•
“Move a Conversion Template” on page 10-16
•
“Delete a Conversion Template” on page 10-17
•
“Customize Microsoft Word Report Styles” on page 10-18
•
“Customize Microsoft Word Part Templates” on page 10-21
•
“Customize a Microsoft Word Title Page Template” on page 10-30
Copy a Conversion Template
More About
•
“Report Conversion Templates” on page 10-2
10-13
10
Template-Based Report Formatting
Open a Conversion Template
1
In Report Explorer, select Tools > Edit Document Conversion Template. The
Template Browser appears in the Report Explorer.
2
Select a template from the list of Word and HTML templates in the Library pane.
For example, select Default Word Template. The properties of the template
appear in the Report Explorer Properties pane.
3
In the Template Browser, click Open template.
If you open a default template, you cannot edit it. To edit a template, make a copy of the
default template and open the copy.
To open both the template and the template stylesheet, in the Template Browser click
Open stylesheet.
Related Examples
•
“Copy a Conversion Template” on page 10-12
•
“Set Conversion Template Properties” on page 10-15
More About
•
10-14
“Report Conversion Templates” on page 10-2
Set Conversion Template Properties
Set Conversion Template Properties
For custom conversion templates, you can specify properties to describe the template.
1
In Report Explorer, select Tools > Edit Document Conversion Template.
2
From the list of templates in the Library pane, click the template whose properties
you want to set.
3
In the fields at the top of the Properties pane, specify properties for the template.
• Template id — Description of the template, such as Word template for
model reports
• Display name — Template name to display in the list of Word templates (for
example, Model reports)
• Description — Description of the template
• Creator — Name of the person or organization that created the template
4
Apply the properties by selecting another template in the list of templates.
Related Examples
•
“Copy a Conversion Template” on page 10-12
•
“Open a Conversion Template” on page 10-14
More About
•
“Report Conversion Templates” on page 10-2
10-15
10
Template-Based Report Formatting
Move a Conversion Template
You can change the location of a template file.
1
In Report Explorer, select Tools > Edit Document Conversion Template. The
Template Browser appears in the Report Explorer.
2
In the Report Explorer, select the template to move.
3
In the Template Browser, select Move template.
4
In the file browser, navigate to the new location for the template file. Enter a file
name, using the appropriate extension for the type of template (.dotx or .htmtx).
5
Click Save. The Path property in the Template Browser shows the new location.
Related Examples
•
“Copy a Conversion Template” on page 10-12
•
“Open a Conversion Template” on page 10-14
•
“Delete a Conversion Template” on page 10-17
More About
•
10-16
“Report Conversion Templates” on page 10-2
Delete a Conversion Template
Delete a Conversion Template
1
In Report Explorer, select Tools > Edit Document Conversion Template. The
Template Browser appears in the Report Explorer.
2
In the Report Explorer, select the template to delete.
3
In the Template Browser, select Delete template and click Yes.
Related Examples
•
“Copy a Conversion Template” on page 10-12
•
“Open a Conversion Template” on page 10-14
•
“Move a Conversion Template” on page 10-16
More About
•
“Report Conversion Templates” on page 10-2
10-17
10
Template-Based Report Formatting
Customize Microsoft Word Report Styles
In this section...
“Customize Default Microsoft Word Component Styles” on page 10-18
“Create Styles in a Microsoft Word Template” on page 10-18
You can customize report styles in a custom Word conversion template or add styles to a
custom Word template.
For more information about Word styles, see the Microsoft Word documentation.
Customize Default Microsoft Word Component Styles
Note: If you do not have a custom Word conversion template, see “Copy a Conversion
Template” on page 10-12.
1
In the Report Explorer, select Tools > Edit Document Conversion Template.
2
In the list of templates in the middle pane, select the custom template that contains
the style you want to customize.
3
In the Properties pane, click Open stylesheet. The Word Manage Styles dialog
box appears.
4
Use the Manage Styles dialog box to modify or create styles.
Styles that begin with rg (for example, rgParagraph) are the default styles used
for report components. A default style applies to all instances of a component with
which it is associated. (In the Report Explorer, some components allow you to replace
the name of a default style with the name a style that you create. This allows you to
specify different styles for different instances of the same component.)
For details, see “Create Styles in a Microsoft Word Template” on page 10-18.
Create Styles in a Microsoft Word Template
Note: If you do not have a custom Word conversion template, see “Copy a Conversion
Template” on page 10-12.
10-18
Customize Microsoft Word Report Styles
1
In the Report Explorer, select Tools > Edit Document Conversion Template.
2
In the list of templates in the middle pane, select a custom template.
3
In the Properties pane, click Open stylesheet.
4
If applicable, select an existing style to use as a starting point for the new style.
5
Click the New Style button.
6
Specify a name for the new style and define the style characteristics. To save the new
style definition, click OK and close the dialog box.
7
In the Manage Styles dialog box, click OK.
8
In Word, save and close the template.
Related Examples
•
“Customize Microsoft Word Part Templates” on page 10-21
•
“Customize a Microsoft Word Title Page Template” on page 10-30
More About
•
“Report Conversion Templates” on page 10-2
10-19
10
Template-Based Report Formatting
•
10-20
“Conversion Template Contents” on page 10-5
Customize Microsoft Word Part Templates
Customize Microsoft Word Part Templates
In this section...
“Custom Word Part Templates” on page 10-21
“Display the Developer Ribbon in Word” on page 10-22
“Customize a Word Conversion Part Template” on page 10-22
“Set Default Text Style for a Hole” on page 10-23
“Distinguish Inline and Block Holes” on page 10-25
“Avoid Changing Block Holes to Inline Holes” on page 10-26
“Delete a Hole” on page 10-26
“Add an Inline Hole” on page 10-28
“Add a Block Hole” on page 10-29
Custom Word Part Templates
You can create custom Word part templates (such as a title page part template) to:
• Tailor report formatting to meet your specific formatting requirements.
• Delete a hole. For a description of holes, see “Part Template Holes” on page 10-10.
• Rearrange the order of holes.
• Add fixed content to a footer or header.
If you delete a hole in a part template, then the generated report does not include the
component data associated with that hole. For example, the rgRectoTitlePage part
template includes an rgAuthor hole. If you delete the rgAuthor hole, then reports
generated with the template do not include the author, even if the report has a Title
Page component that specifies a value for the Author property.
The only kind of holes that you can add to a part template are the holes that the
Report Explorer supports for that part template. For example, for the rgChapter part
template, you can only reinsert rgChapterTitlePrefix, rgChapterTitleNumber,
rgChapterTitle, and rgChapterContent holes. Do not add multiple instances of the
same kind of hole in a part template.
10-21
10
Template-Based Report Formatting
Display the Developer Ribbon in Word
To work with holes in a Word template, use the Word Developer ribbon. If the
Developer tab is not showing in your Word ribbon, add it to the ribbon.
1
In Word, select File > Options.
2
In the Word Options dialog box, select Customize Ribbon.
3
In the Customize the Ribbon list, select the Developer check box and click OK.
Tip If you do not see Developer check box in the list, set Customize the Ribbon to
Main Tabs.
Customize a Word Conversion Part Template
To customize a report element such as a title page, replace the appropriate default part
template with a customized copy of the part template. For another example illustrating
how to create a custom Word part template, see “Customize Title Page Content and
Layout” on page 10-34.
Note: If you do not have a custom Word conversion template, see “Copy a Conversion
Template” on page 10-12.
1
In the Report Explorer, select Tools > Edit Document Conversion Template.
2
In the list of templates in the middle pane, select a custom template.
3
In the Properties pane, click Open template.
4
At the beginning of the template, position the cursor in the first paragraph and click
the Quick Parts button.
5
10-22
In the Insert tab, select the Quick Parts
button.
6
In the Quick Parts Gallery, select the part template (for example, rgChapter).
7
Edit the copy of the part template. For example, remove a hole by right-clicking and
selecting Remove Content Control.
8
In the template, select the part template, including all of its holes.
9
In the Quick Parts Gallery, select Save Selection to Quick Part Gallery.
Customize Microsoft Word Part Templates
10 In the Create New Building Block dialog box, set Name to the part template name
(for example, rgChapter) and the Category to mlreportgen. Click OK.
11 In the template, delete the customized part template.
12 Save the main template.
Set Default Text Style for a Hole
Your template can specify the name of a style to use as a default to format text generated
for a hole.
Note: If you do not have a custom Word conversion template, see “Copy a Conversion
Template” on page 10-12.
1
2
3
4
In the Report Explorer, select Tools > Edit Document Conversion Template.
In the list of templates in the middle pane, select the custom template that has the
hole you want to set the default text style for.
In the Template Browser, click Open template.
In the Insert tab, select the Quick Parts
button.
5
In the Quick Parts Gallery, select the part template that contains the hole (for
example, rgChapter).
6
Right-click in the text area of the hole whose default text style you want to specify.
For example, in rgChapter, right-click in the rgChapterTitle hole.
7
Select Properties.
8
9
In the Content Control Properties dialog box, select the Use a style to format text
typed into the empty control check box.
From the Style list, select a style to use an existing style or select New Style to
create a new style to use as the default style and click OK.
10-23
10
Template-Based Report Formatting
10 Select the part template and click the Quick Parts button.
11 Click Save Selection to Quick Part Gallery.
12 In the Create New Building Block dialog box, set Name to the part template name
(for example, rgChapter) and the Category to mlreportgen. Click OK.
13 Save and close the template.
10-24
Customize Microsoft Word Part Templates
Distinguish Inline and Block Holes
The Report Explorer supports two types of holes: inline and block.
• Use an inline hole is for content that you can include in a Word paragraph.
• Use a block hole for content that you cannot embed in a paragraph.
You can configure the Word editor to provide visual cues that indicate whether a hole is
an inline or block hole.
Note: If you do not have a custom Word conversion template, see “Copy a Conversion
Template” on page 10-12.
1
Open the custom Word template.
2
On the Word ribbon, select the Home tab.
3
Click the Show/Hide
4
On the Word ribbon, select the Developer tab.
5
Click Design Mode to Word markup for holes.
6
Click a hole to determine whether it is an inline or block hole.
button to display Word paragraph markers.
• Inline hole — The bounding box does not include the paragraph marker.
• Block hole — The bounding box does includes the paragraph marker.
10-25
10
Template-Based Report Formatting
Avoid Changing Block Holes to Inline Holes
Do not change a block hole to an inline hole.
You can accidentally change a block hole to an inline hole by removing the paragraph
marker of an inline hole that is followed by a block hole. For example, if you delete the
paragraph marker for the rgChapterTitle inline hole, the rgChapterContent block
hole changes to an inline hole.
Delete a Hole
Note: If you do not have a custom Word conversion template, see “Copy a Conversion
Template” on page 10-12.
1
In the Report Explorer, select Tools > Edit Document Conversion Template.
2
In the list of Word templates in the middle pane, select the custom template that you
want to edit.
3
In the Template Browser, click Open template.
4
To display Word paragraph markers (if they are not already visible), on the Word
ribbon in the Home tab, click the Show/Hide
10-26
button.
5
In the Word ribbon, in the Insert tab, click the Quick Parts
6
Select the part template to customize. For example, select rgChapter to customize
the part template for a chapter.
button.
Customize Microsoft Word Part Templates
Tip To display Word markup for the part template, on the Word ribbon, in the
Developer tab, click Design Mode.
7
Write down the name of the part template you are customizing, because you need to
enter that name later in this procedure.
8
In the rgChapter part template, delete the rgChapterTitlePrefix hole. Select
the hole markup and click the Delete key.
9
In the template, select all of the contents of the part template.
10 Right-click and select Properties.
11 In the Content Control Properties dialog box, in the Title and Tag fields, enter the
name of the template part you are customizing rgChapter. Click OK.
12 In the template, select all of the contents of the part template. In the Insert tab,
click the Quick Parts button.
13 Click Save Selection to Quick Part Gallery.
14 In the Create New Building Block dialog box, set Name to the part template name
(for example, rgChapter) and the Category to mlreportgen. Click OK.
15 In the template, select all of the contents of the part template and click the Delete
button.
16 Save and close the template.
10-27
10
Template-Based Report Formatting
Add an Inline Hole
The only kind of holes that you can add to a part template are the holes that the
Report Explorer supports for that part template. For example, for the rgChapter part
template, the only inline holes that you can reinsert are rgChapterTitlePrefix,
rgChapterTitleNumber, and rgChapterTitle holes. Do not add multiple instances of
the same kind of hole in a part template.
Note: If you do not have a custom Word conversion template, see “Copy a Conversion
Template” on page 10-12.
1
In the Report Explorer, select Tools > Edit Document Conversion Template.
2
In the list of Word templates in the middle pane, select the custom template that you
want to edit.
3
In the Template Browser, click Open template.
4
To display Word paragraph markers, click the Show/Hide
5
Position the Word insertion mark at the point in a paragraph where you want to add
an inline hole.
button.
Tip If the hole is the only content in a paragraph or is at the end of a paragraph, add
several blank spaces and insert the hole before the spaces.
6
Click the Rich Text Control button
insertion point.
7
To see hole markup, on the Word ribbon, in the Developer tab click Design Mode.
8
Right-click in the hole and select Properties.
9
In the dialog box, in the Title and Tag fields, enter the name of the hole. Use a
Report Explorer hole name. For example, if you insert an rgChapterTitlePrefix
hole, set the Title and Tag fields to rgChapterTitlePrefix.
. Word inserts a rich text control at the
10 In the template, select all of the contents of the part template. In the Insert tab,
click the Quick Parts button.
11 Click Save Selection to Quick Part Gallery.
12 In the Create New Building Block dialog box, set Name to the part template name
(for example, rgChapter) and the Category to mlreportgen. Click OK.
10-28
Customize Microsoft Word Part Templates
13 In the template, select all of the contents of the part template and click the Delete
button.
14 Save and close the template.
Add a Block Hole
The only kind of holes that you can add to a part template are the holes that the Report
Explorer supports for that part template. For example, for the rgChapter part template,
the block hole that you can reinsert is rgChapterContent holes. Do not add multiple
instances of the same kind of hole in a part template.
Creating a block-level hole in a Word document is essentially the same as creating an
inline hole. The main difference is that rich text content control must contain an (empty)
paragraph instead of residing in a paragraph. Create an empty paragraph at the point
where you want to create a block-level hole. If you are at the end of a document, create a
second empty paragraph.
Related Examples
•
“Copy a Conversion Template” on page 10-12
•
“Customize Microsoft Word Report Styles” on page 10-18
•
“Customize a Microsoft Word Title Page Template” on page 10-30
More About
•
“Report Conversion Templates” on page 10-2
•
“Conversion Template Contents” on page 10-5
10-29
10
Template-Based Report Formatting
Customize a Microsoft Word Title Page Template
In this section...
“Create a Custom Template” on page 10-30
“Change the Color of a Report Title” on page 10-31
“Assign the Template to a Report” on page 10-33
“Customize Title Page Content and Layout” on page 10-34
The Report Explorer default Word document conversion template contains document
part templates for the front (recto) and back (verso) side of a report title page. The Report
Explorer file converter for the Word (from template) output type uses the title page
part templates to produce the title pages in the Word output.
This example shows how to create a custom template that changes the color of the title
and how to customize the layout of a title page. The example uses a custom template
with the Report Generator magic square report example.
Create a Custom Template
Note: To complete the rest of this example, you need a custom Word conversion template.
If you have a custom template that you want to use for this example, you can skip to
“Change the Color of a Report Title” on page 10-31.
10-30
1
In the Report Explorer, select Tools > Edit Document Conversion Template.
2
In the list of templates, select the Default Word Template.
3
In the Template Browser, click Copy template.
4
In the file browser, navigate to the folder on the MATLAB path that you want to use
for the custom template. For the file name, enter magic-square and click Save.
5
In the list of templates, select Copy of Default Word Template.
6
At the top of the Template Properties dialog box, use these settings:
Customize a Microsoft Word Title Page Template
7
Apply the properties by selecting another template in the list of templates.
Change the Color of a Report Title
You can customize the Magic Square Template (see “Create a Custom Template” on
page 10-30) to use blue text for the report title.
1
In the Report Explorer, select Tools > Edit Document Conversion Template.
2
In the Report Explorer list of Word templates, select Magic Square Template.
3
In the Template Browser, click Open style sheet. In Word, the template opens,
with the Manage Styles dialog box displayed.
4
In the Manage Styles dialog box, select the rgTitle style and click Modify.
10-31
10
Template-Based Report Formatting
5
10-32
In the Modify Style dialog box for rgTitle, click the down arrow for Automatic.
Select the blue color box and click OK.
Customize a Microsoft Word Title Page Template
6
In the Manage Styles dialog box, click OK.
7
Save and close the template.
Assign the Template to a Report
You can assign the customized template to the magic-square.rpt Report Explorer
report.
1
In the Report Explorer, select Report Generator node.
2
In the Report Explorer, in the list of reports, select magic_square.rpt.
10-33
10
Template-Based Report Formatting
3
In the Report Options pane, click Open report.
4
In the magic_squares report, add a Title Page component. In the Title Page
dialog box, set the Title field to Magic Squares.
5
Below the Title Page component, add a Chapter component.
6
In the Report Options dialog box, set File format to Word (from template) and
instead of Default Word Template, select Magic Squares Template.
7
Generate the report. Select the magic_squares report. In the Report Explorer
toolbar, click the Report
button.
In the generated report, the title, Magic Squares, appears in blue.
Customize Title Page Content and Layout
This example assumes you have created a custom Magic Square Template (see “Create a
Custom Template” on page 10-30). You can use a different custom Word template.
10-34
1
In the Report Explorer, select Tools > Edit Document Conversion Template.
2
In the Report Explorer list of Word templates, select Magic Square Template. In
the Report Options pane, click Open template.
3
With the cursor in the first (and only visible) paragraph in the template, in the
Insert tab, select the Quick Parts button.
Customize a Microsoft Word Title Page Template
4
In the Quick Parts gallery, select rgRectoTitlePage to insert of the front title page
part template in the main document conversion template.
Tip To display Word markup for the part template, on the Word ribbon, in the
Developer tab, click Design Mode.
5
Highlight the rgImage hole and drag it above the rgTitle hole.
6
Delete the rgAuthor hole.
7
Select the rgRectoTitlePage part template and click the Quick Parts button.
8
Click Save Selection to Quick Part Gallery.
9
In the Create New Building Block dialog box, set Name to rgRectoTitlePage and
the Category to mlreportgen. Click OK.
10 In the template, select the contents of the part template (including the section break)
and click the Delete button.
11 Save and close the template.
Suppose that you use the custom template to generate a report that has a Title Page
component that specifies an image and an author. The generated report displays the
image at the top of the title page and does not include an author.
Related Examples
•
“Copy a Conversion Template” on page 10-12
•
“Customize Microsoft Word Report Styles” on page 10-18
More About
•
“Report Conversion Templates” on page 10-2
•
“Conversion Template Contents” on page 10-5
10-35
10
Template-Based Report Formatting
Create a Custom HTML Template
In this section...
“Copy an HTML Template” on page 10-36
“Select an HTML Editor” on page 10-37
“Edit HTML Styles in a Template” on page 10-37
Copy an HTML Template
To customize the format styles used in the default HTML template, you need to copy that
template (or a template that was copied from the default template) and modify or add
style definitions in the copy.
1
In Report Explorer, select Tools > Edit Document Conversion Template.
2
In the Library pane (middle pane), select a template from the list of HTML
templates. For example, select the DefaultHTMLTemplate.
3
In the Properties pane, click Copy template.
4
In the file browser, navigate to the location where you want to save the template file.
Select a path that is on the MATLAB path (for example, in the MATLAB folder in your
home directory).
Specify the file name, using the default file extension for a HTML template
(.htmtx). Click Save.
5
In the list of templates in the middle pane, select the template copy you just created.
6
In the Properties pane, in the Template id and Display name fields, specify a
unique ID and display name for the template.
The display name is the name that appears in the Report Explorer list of templates.
The template ID is what you use to identify a template when using a command-line
interface.
7
10-36
To save the template properties you entered, move the cursor outside of the
Properties pane and click.
Create a Custom HTML Template
Select an HTML Editor
By default, when you edit an HTML style sheet, the style sheet appears in the MATLAB
Editor.
To use a different editor for editing an HTML template:
1
In the Report Explorer, select File > Preferences
2
In Edit HTML Command, enter a MATLAB expression that opens the HTML editor
you want to use. For example:
system('Dreamweaver %<FileName> &')
When you open an HTML stylesheet, the Report Explorer automatically replaces
FileName with the template that you selected.
Edit HTML Styles in a Template
You can customize or add format styles in a custom HTML template.
1
In the list of templates in the middle pane, select the custom template that you want
to edit.
Tip If the Report Explorer middle pane does not show a list of templates, then select
Tools > Edit Document Conversion Template.
2
In the Properties pane, click Open stylesheet.
3
In the HTML editor, edit the cascading style sheet (CSS).
For information about editing a cascading style sheet, see documentation such as the
W3Schools.com CSS tutorial.
4
Save the style sheet.
Related Examples
•
“Generate a Report Using a Template” on page 10-4
•
“Customize Microsoft Word Report Styles” on page 10-18
•
“Customize Microsoft Word Part Templates”
10-37
10
Template-Based Report Formatting
More About
•
10-38
“Report Conversion Templates”
11
Create a Report Program
• “Create a Report Program” on page 11-3
• “Document Object Model” on page 11-4
• “Construct a DOM Object” on page 11-6
• “Import the DOM API Package” on page 11-7
• “Get and Set DOM Object Properties” on page 11-8
• “Create a Document Object to Hold Content” on page 11-9
• “Add Content to a Report” on page 11-11
• “Clone a DOM Object” on page 11-13
• “Add Content as a Group” on page 11-14
• “Stream a Report” on page 11-16
• “Report Packages” on page 11-17
• “Close a Report” on page 11-18
• “Display a Report” on page 11-19
• “Report Formatting Approaches” on page 11-20
• “Use Style Sheets” on page 11-21
• “Use Format Objects” on page 11-23
• “Use Format Properties” on page 11-24
• “Format Inheritance” on page 11-25
• “Create Object Containers” on page 11-26
• “Form-Based Reporting” on page 11-28
• “Fill the Blanks in a Report Form” on page 11-29
• “Use Subforms in a Report” on page 11-31
• “Create Document Part Template Libraries” on page 11-33
• “Object-Oriented Report Creation” on page 11-38
• “Simplify Filling in Forms” on page 11-39
11
Create a Report Program
• “Create and Format Text” on page 11-41
• “Create and Format Paragraphs” on page 11-46
• “Create and Format Lists” on page 11-52
• “Create and Format Tables” on page 11-58
• “Create Links” on page 11-72
• “Create and Format Images” on page 11-75
• “Create a Table of Contents” on page 11-77
• “Create Image Maps” on page 11-84
• “Automatically Number Document Content” on page 11-86
• “Appending HTML to DOM Reports” on page 11-90
• “Append HTML Content to DOM Reports” on page 11-92
• “Append HTML File Contents to DOM Reports” on page 11-94
• “Use an HTML Cleanup Program” on page 11-96
• “HTML Code Requirements for DOM Reports” on page 11-100
• “Display Report Generation Messages” on page 11-106
• “Compile a Report Program” on page 11-110
• “Create a Microsoft Word Template” on page 11-111
• “Add Holes in a Microsoft Word Template” on page 11-112
• “Modify Styles in a Microsoft Word Template” on page 11-117
• “Create an HTML Template” on page 11-122
• “Add Holes in an HTML Template” on page 11-124
• “Modify Styles in an HTML Template” on page 11-127
• “Create Microsoft Word Page Layout Sections” on page 11-128
• “Create Page Footers and Headers” on page 11-131
11-2
Create a Report Program
Create a Report Program
The MATLAB Report Generator includes a set of functions, called the DOM (Document
Object Model) API, that allows you to generate Word, HTML, and PDF reports
programmatically. For example, the following MATLAB script uses the API to generate
and display an HTML report displaying today’s date.
import mlreportgen.dom.*;
report = Document('today');
append(report, ['Today is ', date, '.']);
close(report);
rptview(report.OutputPath);
To get started learning about creating reports with the DOM API, see “Document Object
Model” on page 11-4.
More About
•
“Document Object Model” on page 11-4
11-3
11
Create a Report Program
Document Object Model
The DOM API creates a representation of a report document in your system's memory.
Such a representation is often referred to as a Document Object Model (DOM). Hence,
the DOM API's name.
The DOM API's document object model consists of a hierarchical set of data structures,
known as objects, that represent the document and its contents. At the top of the
hierarchy is an object representing the document itself. The document object maintains a
list of objects, called its children, that represent its contents (such as paragraphs, images,
tables, lists, and so on). Each child object, in turn, maintains a list of its contents. For
example, a table lists its rows, a row lists its table entries, a table entry lists its contents,
and so on.
The DOM API contains functions that allow you to create and assemble DOM objects,
such as paragraphs, images, and tables, into a model of a specific document. You can
then use the API to write the model out to disk as an HTML or Microsoft Word document
file.
DOM Object Help and Documentation
For a list of the DOM objects, type the following at the MATLAB prompt.
help mlreportgen.dom
To get help for a specific object, such as a Paragraph, use a help command such as this.
help mlreportgen.dom.Paragraph
To get a complete list of DOM API classes and functions in the MATLAB Report
Generator documentation, open the Functions pane.
To see the documentation reference page for an object, search in documentation or in
MATLAB use a doc command such as this.
doc mlreportgen.dom.Paragraph
Related Examples
11-4
•
“Construct a DOM Object” on page 11-6
•
“Get and Set DOM Object Properties” on page 11-8
Document Object Model
•
“Import the DOM API Package” on page 11-7
11-5
11
Create a Report Program
Construct a DOM Object
The DOM API includes a special set of MATLAB functions, called constructors, for
creating DOM objects of various types, or classes.
The name of an object constructor is the name of the MATLAB class from which the
DOM creates an object. For example, the name of the constructor for a DOM paragraph
object is mlreportgen.dom.Paragraph. Some constructors do not require any
arguments. Other constructors can take one or more arguments that typically specify its
initial content and properties. For example, the following line creates a paragraph whose
initial content is Chapter 1.
p = mlreportgen.dom.Paragraph('Chapter 1.');
A constructor returns a handle to the object it creates. Assigning the handle to a variable
allows you to subsequently append content to the object or set its properties. For
example, the following line appends content to the paragraph object p created in the
previous example.
append(p,'In the Beginning');
Note that you can assign an object handle to multiple variables and hence access the
same object via multiple variables.
Related Examples
•
“Import the DOM API Package” on page 11-7
•
“Get and Set DOM Object Properties” on page 11-8
More About
•
11-6
“Document Object Model” on page 11-4
Import the DOM API Package
Import the DOM API Package
All DOM class names, and hence constructor names, include the prefix
mlreportgen.dom. To avoid the need to include the prefix in your code, insert the
following statement at the beginning of any script or function that uses the DOM API.
import mlreportgen.dom.*;
The documentation frequently refers to DOM API objects and functions without the
mlreportgen.dom prefix, assuming that you have already imported the DOM API
package.
Related Examples
•
“Create a Report Program” on page 11-3
More About
•
“Document Object Model” on page 11-4
11-7
11
Create a Report Program
Get and Set DOM Object Properties
To get or set the property of a document object, use dot notation, which involves
appending a period to the name of a variable that references the object, followed by
the property name. For example, the following line saves the current font family of a
paragraph referenced by p and sets it to a new font family.
saveFont = p.FontFamily;
p.FontFamily = 'Arial';
Related Examples
•
“Construct a DOM Object” on page 11-6
•
“Use Format Properties” on page 11-24
More About
•
11-8
“Document Object Model” on page 11-4
Create a Document Object to Hold Content
Create a Document Object to Hold Content
Every report program must create an mlreportgen.dom.Document object to hold
report content. Use the mlreportgen.dom.Document constructor to create a Document
object.
If you use the constructor with no arguments, the DOM API creates an HTML document
named Untitled.htmx in the current folder.
You can specify the file system path of the report as the first argument of the constructor.
You can specify the type of report to be generated by using a second argument. You can
specify the type to be 'html' or 'docx' (for Microsoft Word). You can then use the
rptview function to convert a Word report to PDF, or you can open the report in Word
and save it as PDF.
This Document constructor creates an HTML report called myReport.
d = Document('myreport','html');
Using a third argument, you can specify the file system path of a Word or HTML
template to be used as a basis for creating the report. You need to specify a template
only if you are using template-based formatting (using style sheets) or form-based report
generation. If you specify a template, it must be a Word template (.dotx) for Word
reports or an HTML template (.htmtx) for HTML reports. For example, this Document
constructor creates a Word report using the Word template myWordTemplate.dotx.
d = Document('myreport','docx','myWordTemplate');
See Also
Functions
rptview
Classes
mlreportgen.dom.Document
Related Examples
•
“Create a Report Program” on page 11-3
•
“Use Style Sheets” on page 11-21
11-9
11
Create a Report Program
•
“Construct a DOM Object” on page 11-6
More About
11-10
•
“Form-Based Reporting” on page 11-28
•
“Document Object Model” on page 11-4
Add Content to a Report
Add Content to a Report
The DOM append function allows you to add content to documents, paragraphs, tables,
and other DOM objects that serve as containers for report content. The append function
takes two arguments. The first argument is the object to which the content is to be
appended. The second is the content to be appended. In this example, the text Hello
World is appended to the document.
d = Document('MyReport');
append(d,'Hello World');
The append function throws an error if the second argument (the content to be
appended), is incompatible with the first argument (the object to which the content is to
be appended). For example, the append method in the following script throws an error.
% This code throws an error
image = Image('membrane.png');
append(image,Paragraph('Hello World'));
This is because you cannot add a paragraph to an image. The reference documentation
for classes lists the types of objects that you can append to instances of the classes. To
get a complete list of DOM API classes and functions in the MATLAB Report Generator
documentation, open the Functions pane. To see the documentation reference page for
an object, search in documentation or in MATLAB use a doc command such as this.
doc mlreportgen.dom.Paragraph
As shown in the preceding examples, the append method, depending on the target object
type, allows you to append strings, doubles, arrays, and other basic MATLAB data types,
without first converting the data to DOM objects. The function converts the appended
data to a DOM object before appending it to the target object. For example, the following
script appends a two-dimensional array of strings to a document as a table.
d = Document('MyDoc');
tableArray = {'a','b';'c','d'};
append(d,tableArray);
Many constructors also allow you to specify basic MATLAB data types as the initial
content of the object when you construct the object. This example is equivalent to the
preceding example.
d = Document('MyDoc');
tableArray = {'a','b';'c','d'};
11-11
11
Create a Report Program
append(d,Table(tableArray));
See Also
Functions
mlreportgen.dom.Paragraph.append
Related Examples
•
“Construct a DOM Object” on page 11-6
•
“Clone a DOM Object” on page 11-13
•
“Add Content as a Group” on page 11-14
•
“Stream a Report” on page 11-16
More About
•
11-12
“Document Object Model” on page 11-4
Clone a DOM Object
Clone a DOM Object
If you attempt to append an object more than once to the same object or to append an
object to multiple objects, the append function throws an error. If you need to append an
object multiple times, use the clone function to create copies of the object.
d = Document('MyDoc');
text = append(d,'Hello World');
text.Color = 'magenta';
text = clone(text);
text.Color = 'cyan';
append(d,text);
See Also
Functions
mlreportgen.dom.Paragraph.clone
Related Examples
•
“Add Content to a Report” on page 11-11
•
“Construct a DOM Object” on page 11-6
More About
•
“Document Object Model” on page 11-4
11-13
11
Create a Report Program
Add Content as a Group
You can use a group to include the same content in different parts of a report. The DOM
API clones the members of a group before appending them to another object.
This example shows the key code to include. After describing the steps involved in using
a group, this example includes code for a complete report that uses a group.
1
Define the DOM objects that you want to include repeatedly in a report.
disclaimerHead = Heading(2,'Results May Vary');
disclaimerIntro = Paragraph('The following results assume:');
disclaimerList = UnorderedList(...
{'Temperature between 30 and 70 degrees F',...
'Wind less than 20 MPH','Dry road conditions'});
2
Define a Group object that includes the DOM objects for the group. For example:
disclaimer = Group();
append(disclaimer,disclaimerHead);
append(disclaimer,disclaimerIntro);
append(disclaimer,disclaimerList);
3
Append the Group object in the place in the report where you want to repeat the
content. For example, if the document object is doc:
append(doc,disclaimer);
This code builds on the code shown above.
import mlreportgen.dom.*;
doc = Document('groupReport','html');
disclaimerHead = Heading(2,'Results May Vary');
disclaimerIntro = Paragraph('The following results assume:');
disclaimerList = UnorderedList(...
{'Temperature between 30 and 70 degrees F',...
'Wind less than 20 MPH','Dry road conditions'});
disclaimer = Group();
append(disclaimer,disclaimerHead);
append(disclaimer,disclaimerIntro);
append(disclaimer,disclaimerList);
append(doc,disclaimer);
p1 = Paragraph('First set of results...');
p1.Bold = true;
p2 = Paragraph('more report content...');
11-14
Add Content as a Group
p2.Bold = true;
append(doc,p1);
append(doc,p2);
append(doc,disclaimer);
close(doc);
rptview('groupReport','html');
See Also
Functions
mlreportgen.dom.Paragraph.append
Classes
mlreportgen.dom.Group
Related Examples
•
“Add Content to a Report” on page 11-11
11-15
11
Create a Report Program
Stream a Report
The DOM API supports two modes of appending content to a document:
• In-memory — Creates the document entirely in memory. In-memory is the default
mode.
• Streaming — Streaming mode writes objects to disk as they are appended to a
document. Streaming mode allows you to create large reports on systems with modest
memory.
To enable streaming mode, set the StreamOutput property of the Document object for
the report to true.
d = Document('MyDoc');
d.StreamOutput = true;
See Also
Classes
mlreportgen.dom.Document
Related Examples
•
11-16
“Add Content to a Report” on page 11-11
Report Packages
Report Packages
A Microsoft Word document packages all of its contents, text, images, style sheets, and so
on, in a single compressed file having a docx extension.
For HTML documents, the DOM API defines an analogous packaging scheme, with an
htmtx compressed file extension. By default, the DOM API generates HTML reports
as htmx files. To generate an HTML report in unzipped format or both zipped and
unzipped format, set the PackageType property of the Document object for a report to
'unzipped' or 'both', respectively.
See Also
Functions
unzipTemplate | zipTemplate
Classes
mlreportgen.dom.Document
More About
•
“Document Object Model” on page 11-4
11-17
11
Create a Report Program
Close a Report
The last step in creating a report with the DOM API is to close the report. Closing a
report writes out any content that remains in memory and closes the report file. Use the
close function.
d = Document('MyDoc');
append(d,'Hello World');
close(d);
See Also
Functions
mlreportgen.dom.Document.close
Related Examples
•
“Create a Report Program” on page 11-3
More About
•
11-18
“Document Object Model” on page 11-4
Display a Report
Display a Report
The DOM API rptview function allows you to display a generated report in a viewer
appropriate to its document type: the Microsoft Word editor for Word documents, an
HTML browser for HTML reports, and Adobe Acrobat for PDF reports.
The rptview function takes two arguments:
• The path of the report
• The output type: 'html', 'docx', or 'pdf'
If you omit the second argument (the output type), rptview uses the output type from
the report’s extension.
If an HTML report is in zipped format, rptview creates a copy of the report in your
temporary directory and displays the temporary copy. If you specify 'pdf', the function
uses Word to convert the report to PDF format. It then displays the report in Adobe
Acrobat.
See Also
Functions
rptview
Related Examples
•
“Create a Report Program” on page 11-3
11-19
11
Create a Report Program
Report Formatting Approaches
The DOM API supports three approaches to formatting document objects in reports:
• Style sheets — Assign to a document object (such as a paragraph, table, or list) a
style from a Microsoft Word or HTML template, using the StyleName property of a
document object. A style is a collection of formats.
• Format objects — Use format objects, such as a FontFamily object, with the Style
property of a document object.
• Format properties — Use format properties of a document object. For example, for a
Paragraph object p, you can specify
p.Color = 'red'
Related Examples
•
“Use Style Sheets” on page 11-21
•
“Use Format Objects” on page 11-23
•
“Use Format Properties” on page 11-24
More About
•
11-20
“Format Inheritance” on page 11-25
Use Style Sheets
Use Style Sheets
A style is a collection of formats that together define the appearance of a document
object, such as a paragraph, table, or list. Microsoft Word allows you to define styles and
then assign them to paragraphs, tables, and other documents by name. The assigned
style then determines how Word renders the document object on the screen or printed
page. Word stores the styles in a document as an object called a style sheet. HTML
browsers support a similar capability.
DOM API objects that have a StyleName property allow you to leverage Word and
HTML style sheets to format reports as follows.
1
Create a Word or HTML template, using the DOM API or a Word or HTML editor,
depending on the report type.
2
Optionally, you can change a template style definition or add a new style. For
details, see “Modify Styles in a Microsoft Word Template” on page 11-117 or
“Modify Styles in an HTML Template” on page 11-127.
3
In a DOM report, create a Document object that uses the template.
4
Assign the names of styles defined in the style sheet to the StyleName property of
objects that you want to have the specified style.
For example, the following script assigns a style named Warning to a paragraph object.
It assumes that you have defined the Warning style previously in a Word template
named MyTemplate.dotx.
d = Document('MyDoc','docx','MyTemplate');
p = Paragraph('Danger');
p.StyleName = 'Warning';
append(d,p);
close(d);
Assigning the Warning style to the DOM paragraph object causes Word to use the
Warning style to render the generated paragraph when you open the generated report.
Tip Some document object constructors allow you to specify the value of the StyleName
property as an argument. For example, this paragraph has the text Danger and uses a
style defined for the template style named Warning.
p = Paragraph('Danger','Warning');
11-21
11
Create a Report Program
Related Examples
•
“Create a Microsoft Word Template” on page 11-111
•
“Modify Styles in a Microsoft Word Template” on page 11-117
•
“Create an HTML Template” on page 11-122
•
“Modify Styles in an HTML Template” on page 11-127
More About
11-22
•
“Report Formatting Approaches” on page 11-20
•
“Format Inheritance” on page 11-25
Use Format Objects
Use Format Objects
A format object is a MATLAB program entity that defines the properties and functions
of a specific type of document format, such as a font family or font size. The DOM API
provides a set of constructors for creating format objects corresponding to most of the
formatting options available in HTML and Word documents. Most DOM document
objects include a Style property that you can set to a cell array of format objects.
Together, format objects and the document object Style property allow you to format a
document object by creating an array of format objects that define the appearance (style),
of the object and assigning this array to the Style property of the document object.
For example, the following script uses format objects to specify the style of a warning
paragraph.
p = Paragraph('Danger!');
p.Style = {Color('red'),FontFamily('Arial'),FontSize('18pt')};
You can assign the same array of format objects to more than one DOM document object.
This allows you to create a programmatic equivalent of a template style sheet. For
example:
warning = {Color('red'), FontFamily('Arial'), FontSize('18pt')};
p = Paragraph('Danger!');
p.Style = warning;
p = Paragraph('Caution!');
p.Style = warning;
The DOM API allows you to assign any format object to any document object, regardless
of whether the format applies. If the format does not apply, it is ignored.
More About
•
“Report Formatting Approaches” on page 11-20
•
“Format Inheritance” on page 11-25
11-23
11
Create a Report Program
Use Format Properties
Most DOM objects have a set of properties corresponding to the format options most
commonly used for an object of that class. You can use dot notation with format
properties to specify formats for an object. For example, the following code sets the font
and color of text in a paragraph, using the Color, FontFamily, and FontSize format
properties of a Paragraph object.
p = Paragraph('Danger!');
p.Color = 'red';
p.FontFamilyName = 'Arial';
p.FontSize = '18pt';
Assigning a value to a format property causes the API to create an equivalent format
object and assign it to the Style property of the document object. Similarly, assigning
a format object to an object's Style property causes the API to assign an equivalent
value to the corresponding format property if it exists. In this way, the API keeps format
properties for an object in sync with the Style property of the object.
Note: When you change the value of a format property, the DOM API:
• Creates a clone of the corresponding format object
• Changes the value of the clone's corresponding format object property
• Replaces the original format object with the clone in the array of format objects
assigned to the document object
In this way, the DOM prevents changing a format property in one object from changing a
style originally assigned to other objects as well.
More About
11-24
•
“Report Formatting Approaches” on page 11-20
•
“Format Inheritance” on page 11-25
Format Inheritance
Format Inheritance
The DOM API allows you to use both template-based styles and format object-based
styles (or equivalent format properties) to specify the appearance of an object. If you
set both the StyleName and the Style property of an object, the formats in the Style
property override corresponding formats specified by the template-based style of the
StyleName property. Consider, for example, the following script.
d = Document('MyDoc','docx','MyTemplate');
p = Paragraph('Danger!');
p.StyleName = 'Warning';
p.Style = {Color('red')};
append(d,p);
close(d);
Suppose that the Warning style defines the color of a warning as yellow. In that case,
this example overrides the color specified by the Warning style.
If a document object does not specify a StyleName (a template-based style), it inherits
from its container any formats that it does not itself specify. The container itself inherits
any formats that it does not specify from its container, and so on, all the way to the top of
a container hierarchy. Format inheritance allows you to use a single statement to assign
a format for all the objects contained by a container. For example, the following script
uses a single Style property to assign a color to all the entries in a table.
d = Document('MyDoc');
tableArray = {'a', 'b'; 'c', 'd'};
table = append(d, tableArray);
table.Style = {Color('blue')};
append(d, table);
close(d);
Related Examples
•
“Use Style Sheets” on page 11-21
•
“Use Format Objects” on page 11-23
More About
•
“Report Formatting Approaches” on page 11-20
11-25
11
Create a Report Program
Create Object Containers
You can use an mlreportgen.dom.Container object to create an HTML container
object, such as a div, section, or article, not otherwise supported by the DOM API
and to simulate HTML format inheritance in Word output.
In HTML output, a Container object generates an HTML element of the type specified
by its HTMLTag property and containing HTML elements corresponding to its DOM
contents. For example, a Container object with the HTMLTag property div and that
contains the text Hello World generates this markup:
<div><p><span>Hello World</span></p></div>
The generated HTML container element has the class and style properties specified
by the Container object StyleName and Style properties, respectively. The rules
of HTML CSS (cascading style sheets) format inheritance assure that the generated
children of the Container object inherit the formats specified by the Container object
Style and StyleName properties. For example, if the Container object specifies red as
its text color and none of its text children specify a color, the text children are colored red.
For Microsoft Word report output, a Container object simulates container format
inheritance, applying the formats specified by the Container object Style attribute
to each child, unless overridden by the child, and then appending the child to the
Word output. The Word output ignores the HTMLTag and StyleName properties of the
Container object.
Tip You can use mlreportgen.dom.Container or mlreportgen.dom.Group objects to
produce collections of document elements.
• Use a container object to apply format inheritance to a set of objects and to create
HTML container elements not otherwise supported by the DOM, such as div, section,
and article.
• Use a group object to append the same content in multiple places in a document
without cloning the group.
See Also
Classes
mlreportgen.dom.Container | mlreportgen.dom.Group
11-26
Create Object Containers
Related Examples
•
“Use Style Sheets” on page 11-21
•
“Use Format Objects” on page 11-23
More About
•
“Report Formatting Approaches” on page 11-20
11-27
11
Create a Report Program
Form-Based Reporting
The DOM API supports a form-based approach to report generation. You can use
Microsoft Word or an HTML editor to create a template that defines the fixed content
of the form, interspersed with holes (blanks), that your DOM report program fills with
generated content.
Related Examples
11-28
•
“Fill the Blanks in a Report Form” on page 11-29
•
“Use Subforms in a Report” on page 11-31
•
“Create a Microsoft Word Template” on page 11-111
•
“Add Holes in a Microsoft Word Template” on page 11-112
•
“Create an HTML Template” on page 11-122
•
“Add Holes in an HTML Template” on page 11-124
Fill the Blanks in a Report Form
Fill the Blanks in a Report Form
Navigate Holes in the Form
When you create a form template, you associate an ID with each hole in the template.
This allows you to navigate the holes in a form, using the DOM moveToNextHole
function. The first time you execute this function, the DOM API copies to the output
document all of the text up to the first hole in the template. At this point, you can start
adding content to the output document, using this DOM append function, thereby filling
in the first hole. The next time you execute this function, the DOM API copies all the text
between the first and second hole in the template to the output document. You can then
fill in the second hole by appending content to the output document. In this way, you
generate the output document by copying the content from the template and filling in all
its holes.
For example, this function generates a report from a Word template that has three holes
named Title, Author, and Content. The arguments title, author, and content, are
assumed to be strings.
function makerpt(title,author,content,rptname,rpttemplate)
import mlreportgen.dom.*
rpt = Document(rptname,'docx',rpttemplate);
while ~strcmp(rpt.CurrentHoleId,'#end#')
switch rpt.CurrentHoleId
case 'Title'
append(rpt,title);
case 'Author'
append(rpt,author);
case 'Content'
append(rpt,content);
end
moveToNextHole(rpt);
end
close(rpt);
See Also
Functions
mlreportgen.dom.Document.moveToNextHole
11-29
11
Create a Report Program
Related Examples
•
“Use Subforms in a Report” on page 11-31
•
“Create a Microsoft Word Template” on page 11-111
•
“Add Holes in a Microsoft Word Template” on page 11-112
•
“Create an HTML Template” on page 11-122
•
“Add Holes in an HTML Template” on page 11-124
More About
•
11-30
“Form-Based Reporting” on page 11-28
Use Subforms in a Report
Use Subforms in a Report
A document part is a form that you can add to a document or to another document part.
Document parts simplify generation of sections of a report that have the same form, such
as sections that report on the results of a series of tests or the performance of a series of
financial portfolios. Use a similar approach as you do for main document forms.
1
Create a template that defines the form of the document part.
2
For each section:
a
Create an mlreportgen.dom.DocumentPart object.
b
Fill in the holes.
c
Append the part to the main document.
For an example of a report that uses subforms, open the Functional Report example.
Tip The DOM API allows you to store the templates for document parts in the main
template for a report. This allows you to use a single template file to supply all the
templates required for a report. For details, see “Create Document Part Template
Libraries” on page 11-33.
See Also
Functions
mlreportgen.dom.Document.moveToNextHole
Classes
mlreportgen.dom.DocumentPart
Related Examples
•
“Fill the Blanks in a Report Form” on page 11-29
•
“Create a Microsoft Word Template” on page 11-111
•
“Add Holes in a Microsoft Word Template” on page 11-112
•
“Create an HTML Template” on page 11-122
•
“Add Holes in an HTML Template” on page 11-124
11-31
11
Create a Report Program
More About
•
11-32
“Form-Based Reporting” on page 11-28
Create Document Part Template Libraries
Create Document Part Template Libraries
In this section...
“Create a Document Part Template Library in a Microsoft Word Template File” on page
11-33
“Create a Document Part Template Library in an HTML Template File” on page
11-35
A document part template library is a set of document part templates stored by name in
another template. You can create a document part based on a template stored in a library
by specifying the name of the template in the document part constructor. Document part
template libraries allow you to store all the templates for a report in a single template
file, for example, the main template file of a report.
Create a Document Part Template Library in a Microsoft Word Template
File
You can use the Quick Part Gallery in Word to create a document part template library
in the main template of a report. A Quick Part Gallery is a collection of reusable pieces
of preformatted content, called quick parts, that is stored in the document. You can use
quick parts as templates for DOM DocumentPart objects.
1
Open the Word template in which you want to create the document part template.
2
In the template, create the Word content to serve as a prototype for the document
part template. (You will delete the prototype after copying it to the parent template
Quick Part Gallery.) The document part template content that you create can
contain holes and page layout sections, as well as other types of Word content. For
example:
11-33
11
Create a Report Program
11-34
3
On the Word ribbon, select the Insert tab.
4
Select the content that you have created for the document part template.
5
On the Insert ribbon, click the Explore Quick Parts button. Select Save
Selection to the Quick Part Gallery to save a copy of the selected prototype in
the Quick Part Gallery of the template file. The Create New Building Block dialog
box appears.
6
In the Create New Building Block dialog box, in the Name field, enter a unique
name for the template. Use this name in the constructor of a DocumentPart object
to be based on this quick part.
7
For the first document part template you create in the template file, in the
Category list, click Create New Category. Create a category named
mlreportgen. Then select mlreportgen from the Category list.
Create Document Part Template Libraries
Otherwise, select mlreportgen from the Category list.
8
In the Description field, enter a template description and click OK.
9
Delete the content that served as the prototype for the document part template.
10 Save the template file.
Modify a Document Part Template in a Quick Part Gallery
You can modify a document part template located in a Quick Part Gallery.
1
Open the Word template that contains the document part template.
2
Click in the template where you want to create an instance of the document part
template.
3
In the Word ribbon, select the Insert tab.
4
On the Insert ribbon, click the Explore Quick Parts
Quick Part Gallery.
5
To create an instance of the template in the parent template file, in the Quick Part
Gallery, select the document part template to modify.
6
Edit the instance.
7
Select and save the modified instance to the Quick Part Gallery using the same
name as the original template.
8
Delete the instance from the parent template file.
9
Save the parent template file.
button to display the
Create a Document Part Template Library in an HTML Template File
HTML template packages created by copying the DOM API default HTML
template package contains a document part template library file named
docpart_templates.html.
The docpart_templates.html file contains default document part templates whose
names and content are indicated by HTML markup conventions defined by the DOM
11-35
11
Create a Report Program
API. You can modify these templates and add your own templates by editing this file,
using the markup conventions.
You can also create a template part library file in an HTML template that you create
from scratch. In this case, you must ensure that the file observes the HTML markup
conventions that the DOM API uses to indicate the name and content of a document
part template in a document part library. To ensure this, copy the default template part
library file into the template you create from scratch.
Add a Template to an HTML Document Part Template Library File
1
Unzip the template package containing the part template library file.
2
Open the file, named docpart_templates.html by default, in an HTML or text
editor.
3
Create the following HTML markup in the <body> element of the file.
<div class="Template">
<div class="TemplateName">
<span class="TemplateName">TEMPLATE_NAME</span>
</div>
<div class="TemplateBody">
TEMPLATE_BODY
</div>
</div>
4
Replace TEMPLATE_NAME with a unique name for the template. Use this name in the
constructor of a DOM DocumentPart object to be based on this template.
5
Replace TEMPLATE_BODY with HTML markup that defines the fixed content and
holes of the template.
6
Save the library file.
7
Repackage the template.
See Also
Classes
mlreportgen.dom.DocumentPart
Related Examples
•
11-36
“Fill the Blanks in a Report Form” on page 11-29
Create Document Part Template Libraries
•
“Create a Microsoft Word Template” on page 11-111
•
“Add Holes in a Microsoft Word Template” on page 11-112
•
“Create an HTML Template” on page 11-122
•
“Add Holes in an HTML Template” on page 11-124
More About
•
“Form-Based Reporting” on page 11-28
11-37
11
Create a Report Program
Object-Oriented Report Creation
Note: This section assumes that you are familiar with object-oriented programming in
MATLAB. For information on object-oriented programming in MATLAB, see “ObjectOriented Programming” in the MATLAB documentation.
The DOM API supports an object-oriented approach to creating report programs. With
this approach, you subclass the DOM Document and DocumentPart classes to create
document and document part classes tailored to your report application. You then create
instances of these classes to generate a report.
Related Examples
•
11-38
“Simplify Filling in Forms” on page 11-39
Simplify Filling in Forms
Simplify Filling in Forms
The object-oriented approach allows you to exploit the DOM fill method to simplify
form-based reporting. The fill method is intended to be used with instances of classes
derived from mlreportgen.dom.Document or mlreportgen.dom.DocumentPart
class. It assumes that for each hole in a document or document part template the derived
class defines a method having the following signature:
fillHoleId(obj)
The HoleID part of the signature is the ID of a hole defined by the document or
document part template. The obj argument is an instance of the derived class. For
example, supposed that a template defines a hole named Author. Then the derived class
would define a method name fillAuthor to fill the Author hole. Assuming that the
derived class defines methods for filling the holes, the fill method moves from the first
hole in the document or part to the last, invoking the corresponding fillHoleId method
to fill each hole.
The fill method eliminates the need for a report program to loop explicitly through
the holes in a document or document part's template. The report need only invoke the
document or part fill method. For example, suppose that you have derived a report
class, name MyReport, from the mlreportgen.dom.Document class and that this
derived class defines methods for each of the holes defined by the report template, based
on data supplied in its constructor. Then, you would need only three lines to generate an
instance of MyReport:
function makeReport(rptdata)
rpt = MyReport(rptdata);
fill(rpt);
close(rpt);
For an example of a forms-based, object-oriented report program, in the Examples pane
of the MATLAB Report Generator documentation, open the Object-Oriented Report
example.
See Also
Functions
mlreportgen.dom.Document.moveToNextHole
Classes
mlreportgen.dom.DocumentPart
11-39
11
Create a Report Program
Related Examples
•
“Use Subforms in a Report” on page 11-31
•
“Fill the Blanks in a Report Form” on page 11-29
•
“Create a Microsoft Word Template” on page 11-111
•
“Add Holes in a Microsoft Word Template” on page 11-112
•
“Create an HTML Template” on page 11-122
•
“Add Holes in an HTML Template” on page 11-124
More About
•
11-40
“Form-Based Reporting” on page 11-28
Create and Format Text
Create and Format Text
In this section...
“Create Text” on page 11-41
“Create Special Characters” on page 11-41
“Append HTML or XML Markup” on page 11-42
“Format Text” on page 11-42
Create Text
You can create text by appending a string to a document, paragraph, table entry, or list
item. The DOM append function converts the string to a Text object, appends it, and
returns the Text object. Use the Text object to format the text. You can also create a
text object directly and append it to a document. This example:
• Creates the Text object t1 by appending the string 'Hello' to the document
• Uses a Text constructor to create a Text object and append the text 'World' to the
document
import mlreportgen.dom.*
doc = Document('mydoc','html');
t1 = append(doc,'Hello');
append(doc, Text('World'));
close(doc);
rptview('mydoc','html');
Create Special Characters
You can define special characters, such as the British pound symbol, to
include in a report by creating an mlreportgen.dom.CharEntity object.
Specify a name of a character entity listed at http://en.wikipedia.org/wiki/
List_of_XML_and_HTML_character_entity_references. For example:
import mlreportgen.dom.*;
d = Document('test','html');
11-41
11
Create a Report Program
p = Paragraph(CharEntity('pound'));
append(d,p);
append(p,'3');
close(d);
rptview('test','html');
Append HTML or XML Markup
To append HTML markup to an HTML document or Microsoft Word XML markup to a
Word document, use an mlreportgen.dom.RawText object. This is useful for creating
HTML or Word elements that the DOM API does not support directly, such as the HTML
div element. This example shows how to create a RawText object to append HTML
markup.
import mlreportgen.dom.*;
d = Document('test','html');
append(d,RawText('<div id = toc> </toc>'));
close(d);
rptview('test','html');
Format Text
You can format text programmatically, using either DOM format objects or Text object
format properties. You can also use Word and HTML template styles. For information
about these formatting techniques and format inheritance, see “Report Formatting
Approaches” on page 11-20.
Format Text Programmatically
You can use format objects to format Text objects or format properties to specify
commonly used text formats. This example uses:
• A FontFamily format object to specify the primary and backup font
• The Bold format property to specify text weight
import mlreportgen.dom.*;
d = Document('test','html');
11-42
Create and Format Text
t = append(d, 'Bold Arial text');
fontFamily = FontFamily('Arial');
fontFamily.BackupFamilyNames = {'Helvetica'};
t.Style = {fontFamily};
t.Bold = true;
close(d);
rptview('test','html');
Use these format objects and format properties to format text.
Formatting
Format Object
Format Property
Font
FontFamily
FontFamilyName
Backup font (HTML only)
FontFamily
n/a
Complex script font (for
example, Arabic)
FontFamily
n/a
East Asian font
FontFamily
n/a
Font size
FontSize
FontSize
Foreground color
Color
Color
Background color
BackgroundColor
BackgroundColor
Bold
Bold
Bold
Italic
Italic
Italic
Subscript or superscript
VerticalAlign
n/a
Strike through
Strike
Strike
Underline type (single,
double, etc.)
Underline
Underline
Underline color
Underline
n/a
Preserve white space
WhiteSpace
WhiteSpace
Display as specified
Display
n/a
Format Text Using Microsoft Word Style Sheets
You can format a paragraph using a style defined in the Word template used to generate
the report.
11-43
11
Create a Report Program
To define a text style in a Word template, start by using these steps.
1
Open the Word template used with the report.
2
Open the Styles pane.
3
Click the Manage Styles button
.
4
Click New Style.
5
In the Create New Style from Formatting dialog box, set Style type to Character
or Linked (paragraph and character).
For more information about working with Word styles, see “Modify Styles in a Microsoft
Word Template” on page 11-117.
Format Text Using HTML Style Sheets
You can format text using a style defined in the HTML template used to generate the
report. Apply a template style to a Text object either as the second argument in a Text
object constructor or by setting the StyleName property to a template style.
For an HTML report, use a span style. For example:
span.Pass {
font-family: "Times New Roman", Times, serif;
color: green;
}
For more information about using HTML styles with DOM objects, see “Modify Styles in
an HTML Template” on page 11-127 .
Apply a Style to a Text Object
Apply a template style to a Text object either as the second argument in a Text object
constructor or by setting the StyleName property to a template style. For example,
suppose you have defined styles named Body, Pass, and Fail in the template for your
report. You can then apply the styles as follows.
import mlreportgen.dom.*;
passed = rand(1) >= 0.5;
rpt = Document('MyReport','html','MyTemplate');
t1 = Text('Test status: ');
t1.StyleName = 'Body';
11-44
Create and Format Text
t1.WhiteSpace = 'preserve';
if passed
status = 'Passed';
statusStyle = 'Pass';
else
status = 'Failed';
statusStyle = 'Fail';
end
t2 = Text(status,statusStyle);
statusPara = Paragraph(t1);
append(statusPara,t2);
append(rpt, statusPara);
close(rpt);
rptview(rpt.OutputPath);
Override Template Formats
You can use programmatic formats to override the formats defined in a template-based
style. For example, suppose you define a style named AlertLevel in your template and
set the color to be green by default. You can override the style in your report program to
set a color based on the current alert level. For example:
t = Text('Danger!','AlertLevel');
t.Color = 'red';
See Also
Classes
mlreportgen.dom.Bold | mlreportgen.dom.CharEntity | mlreportgen.dom.FontFamily
| mlreportgen.dom.FontSize | mlreportgen.dom.Italic | mlreportgen.dom.Strike |
mlreportgen.dom.Text | mlreportgen.dom.Underline
Related Examples
•
“Add Content to a Report” on page 11-11
More About
•
“Report Formatting Approaches” on page 11-20
11-45
11
Create a Report Program
Create and Format Paragraphs
In this section...
“Create a Paragraph” on page 11-46
“Create a Heading” on page 11-46
“Format a Paragraph” on page 11-47
Create a Paragraph
You can create a paragraph by using an mlreportgen.dom.Paragraph constructor
with a text string. For example:
p = Paragraph('Text for a paragraph');
You can also specify these DOM objects in a Paragraph object constructor.
• mlreportgen.dom.Text
• mlreportgen.dom.ExternalLink
• mlreportgen.dom.InternalLink
• mlreportgen.dom.LinkTarget
• mlreportgen.dom.Image
Create a Heading
You can use an mlreportgen.dom.Heading object to create a paragraph that you want
to appear in the table of contents of a document (see “Create a Table of Contents” on
page 11-77). Specify the heading level as the first argument in the Heading object
constructor, followed by the heading content. Optionally, as a third argument, you can
specify the name of a paragraph style defined in the template used to generate your
report.
This example creates a heading with the text Chapter 1: System Overview and
specifies the heading to appear at the top level in a table of contents.
h1 = Heading(1,'Chapter 1: System Overview');
11-46
Create and Format Paragraphs
Format a Paragraph
You can format a paragraph programmatically, using DOM format objects or format
properties. You can also use Word and HTML template styles. For information about
these formatting techniques and format inheritance, see “Report Formatting Approaches”
on page 11-20.
Note: You can use the same format objects and properties for Heading objects as you do
for Paragraph objects.
Format a Paragraph Programmatically
You can use format objects to format Paragraph objects or format properties to specify
commonly used paragraph formats. This example uses:
• An OuterMargin format object to specify the margins for the paragraph
• The HAlign format property to center the paragraph
import mlreportgen.dom.*;
doc = Document('test','html');
p = Paragraph('Indent a half inch and space after 12 points.');
p.Style = {OuterMargin('0.5in','0in','0in','12pt')};
append(doc,p);
p = Paragraph('Centered paragraph');
p.HAlign = 'center';
append(doc,p);
close(doc);
rptview('test','html');
Use these format objects and format properties to format a paragraph.
Formatting
Format Object
Format Property
Font
FontFamily
FontFamilyName
Backup font (HTML only)
FontFamily
n/a
Complex script font (for
example, Arabic)
FontFamily
n/a
11-47
11
Create a Report Program
11-48
Formatting
Format Object
Format Property
East Asian font
FontFamily
n/a
Font size
FontSize
FontSize
Foreground color
Color
Color
Background color
BackgroundColor
BackgroundColor
Bold
Bold
Bold
Italic
Italic
Italic
Subscript or superscript
VerticalAlign
n/a
Strike through
Strike
Strike
Underline type (single,
double, etc.)
Underline
Underline
Underline color
Underline
n/a
Create border around
paragraph
Border
n/a
Preserve white space
WhiteSpace
WhiteSpace
Indent a paragraph
OuterMargin
OuterLeftMargin
Indent first line of
paragraph
FirstLineIndent
FirstLineIndent
Hanging indent
FirstLineIndent
n/a
Space before and after
paragraph
OuterMargin
n/a
Space to right of paragraph OuterMargin
n/a
Space between paragraph
and its bounding box
InnerMargin
n/a
Space between paragraph
lines
LineSpacing
n/a
Align paragraph left, center, HAlign
right
HAlign
Start paragraph on next
page
PageBreakBefore
n/a
Keep with next paragraph
KeepWithNext
n/a
Create and Format Paragraphs
Formatting
Format Object
Format Property
Keep paragraph on same
page
KeepLinesTogether
n/a
Eliminate widows and
orphans
WidowOrphanControl
n/a
Table of contents level of
paragraph
OutlineLevel
OutlineLevel
Display as specified
Display
n/a
Format a Paragraph Using Microsoft Word Style Sheets
You can format using an existing style in a Word template or using a template style that
you modify or add.
To define a paragraph style in a Word template, start by using these steps.
1
Open the Word template used with the report.
2
Open the Styles pane.
3
Click the Manage Styles button
.
4
Click New Style.
5
In the Create New Style from Formatting dialog box, set Style type to Character
or Linked (paragraph and character).
For more information about working with Word styles, see “Modify Styles in a Microsoft
Word Template” on page 11-117.
Format a Paragraph Using HTML Style Sheets
You can format using an existing style in an HTML template or using a template style
that you modify or add.
For an HTML report, define the style as a p style. For example:
p.BodyPara {
font-family: "Times New Roman", Times, serif;
font-style: normal;
font-size: 11pt;
color: black;
11-49
11
Create a Report Program
margin-left: 0.5in;
}
For more information about using HTML styles with DOM objects, see “Modify Styles in
an HTML Template” on page 11-127.
Apply a Style to a Paragraph Object
Apply a template style to a Paragraph object either as the second argument in a
Paragraph object constructor or by setting the StyleName property to a template
style. For example, suppose you have defined styles named BodyPara and TableTitle
in the template for your report. This example specifies a style name in a Paragraph
constructor and in a Paragraph object StyleName format property, using the
TableTitle style defined in MyTemplate.
import mlreportgen.dom.*;
rank = 5;
rpt = Document('MyReport','html','MyTemplate');
p = Paragraph('Here is a magic square or rank 5:','BodyPara');
append(rpt,p);
p = Paragraph(sprintf('Rank %d MagicSquare',rank));
p.StyleName = 'TableTitle';
append(rpt,magic(rank));
close(rpt);
rptview(rpt.OutputPath);
Override Template Formats
You can use programmatic formats to override the paragraph formats defined in a
template-based paragraph style. For example, suppose you define a paragraph style
named BodyPara in your Word template and set the KeepWithNext property to off. You
can override the style in your report program to keep a particular paragraph on the same
page with the next paragraph. For example:
import mlreportgen.dom.*;
rpt = Document('MyReport','docx','MyTemplate');
p = Paragraph('Keep this body paragraph with next.','BodyPara');
p.Style = {'KeepWithNext'};
append(rpt,p);
11-50
Create and Format Paragraphs
p = Paragraph('Next paragraph.');
append(rpt, p);
close(rpt);
rptview(rpt.OutputPath);
See Also
Classes
mlreportgen.dom.Bold | mlreportgen.dom.Display | mlreportgen.dom.FontFamily
| mlreportgen.dom.FontSize | mlreportgen.dom.Italic |
mlreportgen.dom.KeepLinesTogether | mlreportgen.dom.KeepWithNext
| mlreportgen.dom.LineSpacing | mlreportgen.dom.PageBreakBefore |
mlreportgen.dom.Paragraph | mlreportgen.dom.Strike | mlreportgen.dom.Text |
mlreportgen.dom.Underline
Related Examples
•
“Add Content to a Report” on page 11-11
More About
•
“Report Formatting Approaches” on page 11-20
11-51
11
Create a Report Program
Create and Format Lists
In this section...
“Create an Unordered List” on page 11-52
“Create an Ordered List” on page 11-53
“Create a Multilevel List” on page 11-55
“Format Lists” on page 11-56
You can add two kinds of lists to a report:
• Unordered (bulleted)
• Ordered (numbered)
• Multilevel (lists that contain ordered or unordered lists in any combination)
Create an Unordered List
You can create an unordered list from a numeric or cell array or from scratch.
• Creating a list from a cell array allows you to include items of different types in the
list.
• Creating a list from scratch is useful for including multiple objects in a list item.
Create an Unordered List from an Array
You can create an unordered list by appending a one-dimensional numeric or cell
array to a document (or document part). The append function converts the array to an
mlreportgen.dom.UnorderedList object, appends the object to the document, and
returns the object, which you can then format. In the cell array, you can include strings,
numbers, and some DOM objects, such as a Text object. For a list of DOM objects you
can include, see mlreportgen.dom.ListItem.
import mlreportgen.dom.*;
d = Document('myListReport','html');
t = Text('third item');
append(d,{'first item',6,t,'fourth item'});
11-52
Create and Format Lists
close(d);
rptview('myListReport','html');
You can also create an unordered list from an array by including the array in an
UnorderedList object constructor.
import mlreportgen.dom.*;
d = Document('unorderedListReport','html');
ul = UnorderedList({Text('item1'),'item 2',3});
append(d,ul);
close(d);
rptview('unorderedListReport','html');
Create an Unordered List from Scratch
You can create an unordered list from scratch by creating mlreportgen.dom.ListItem
objects and appending them to an UnorderedList object.
import mlreportgen.dom.*;
d = Document('unorderedListReport','html');
li1 = ListItem('Rank 3 magic square:');
table = append(li1,Table(magic(3)));
table.Border = 'inset';
table.Width = '1in';
li2 = ListItem('second item');
li3 = ListItem('third item');
ul = UnorderedList();
append(ul,li1);
append(ul,li2);
append(ul,li3);
append(d,ul);
close(d);
rptview('unorderedListReport','html');
Create an Ordered List
You can create an ordered list from a numeric or cell array or from scratch.
11-53
11
Create a Report Program
• Creating an ordered list from a cell array allows you to include items of different
types in the list.
• Creating a list from scratch is useful for including multiple objects in a list item.
Create an Ordered List from an Array
You can create an unordered list from a numeric array or cell array by including the
array in an mlreportgen.dom.OrderedList object constructor. In the cell array, you
can include strings, numbers, and some DOM objects, such as a Text object. For a list of
DOM objects you can include, see mlreportgen.dom.ListItem.
import mlreportgen.dom.*;
d = Document('orderedListReport','html');
t = Text('step 1');
ol = OrderedList({t,'step 2','step 3'});
append(d,ol);
close(d);
rptview('orderedListReport','html');
Create an Ordered List from Scratch
You can create an unordered list from scratch by creating mlreportgen.dom.ListItem
objects and appending them to an OrderedList object.
import mlreportgen.dom.*;
d = Document('orderedListReport','html');
li1 = ListItem('Create a rank 3 magic square:');
p = append(li1,Paragraph('>> magic(3)'));
p.FontFamilyName = 'Courier New';
li2 = ListItem('step 2');
li3 = ListItem('step 3');
ol = OrderedList();
append(ol,li1);
append(ol,li2);
append(ol,li3);
append(d,ol);
close(d);
rptview('orderedListReport','html');
11-54
Create and Format Lists
Create a Multilevel List
A multilevel list is an ordered or unordered list whose list items contain ordered or
unordered lists. You can create lists that have as many as nine levels.
You can create multilevel lists either from cell arrays or from scratch. Creating a
multilevel list from scratch is useful for creating list items that contain multiple
paragraphs, paragraphs and tables, and other combinations of document elements.
Create a Multilevel List from a Cell Array
You can use any of these approaches to create a multilevel list from a cell array.
• Nest one-dimensional cell arrays representing sublists in a one-dimension cell array
representing the parent list.
import mlreportgen.dom.*;
d = Document('orderedListReport','html');
ol = OrderedList({'step 1','step 2',...
{'option 1','option 2'},...
'step 3'});
append(d,ol);
close(d);
rptview('orderedListReport','html');
• Include list objects as members of a one-dimensional cell array representing the
parent list. Use this approach to create ordered sublists from cell arrays.
d = Document('myListReport','html');
append(d,{'first item',OrderedList({'step 1','step 2'}),'second item'});
close(d);
rptview('myListReport','html');
• Combine the nested cell array and nested list object approaches.
Create a Multilevel List from Scratch
You can create a multilevel list from scratch by appending child lists to parent lists.
import mlreportgen.dom.*;
11-55
11
Create a Report Program
d = Document('orderedListReport','html');
ol = OrderedList({'Start MATLAB', ...
'Create a rank 3 or 4 magic square:'});
optionList = UnorderedList;
li = ListItem('>> magic(3)');
table = append(li,Table(magic(3)));
table.Width = '1in';
append(optionList, li);
li = ListItem('>> magic(4)');
table = append(li,Table(magic(4)));
table.Width = '1in';
append(optionList,li);
append(ol, optionList);
append(ol, ListItem('Close MATLAB'));,
append(d,ol);
close(d);
rptview('orderedListReport','html');
Format Lists
You can use list styles defined in a report style sheet to specify the indentation of each
level of a list and the type of bullet or the number format used to render list items. To use
a template-defined list style to format a list, set the StyleName property of the list to the
name of the style. For example:
import mlreportgen.dom.*;
d = Document('myListReport','html','MyTemplate');
list = append(d,{'first item',...
OrderedList({'step 1','step 2'}),'second item'});
list.StyleName = 'MyListStyle';
close(d);
rptview('myListReport','html');
Note: A list style determines how list items are rendered regardless of the list type.
If you do not specify a list style, the DOM API uses a default list style that renders
the list according to type. For example, the default list style for unordered lists uses
bullets to render list items. If you specify a list style for an UnorderedList object that
numbers top-level items, the top-level items are numbered, even though the object type is
unordered (bulleted).
11-56
Create and Format Lists
Create a Word List Style
To define a list style in a Word template, select List as the style type in the Create
New Style from Formatting dialog box (see “Add Styles to a Word Template” on page
11-118).
Create an HTML List Style
To define a list style in an HTML template cascading style sheet (CSS), use the ul
element for unordered list styles and the ol element for ordered list styles. You can use
the parent element selector (>) to define multilevel list styles. For example, this CSS
code defines the appearance of a two-level unordered list that can contain ordered or
unordered sublists.
ul.MyUnorderedList {
list-style-type:disc;
}
ul.MyUnorderedList > ul {
list-style-type:circle;
}
ul.MyUnorderedList > ol {
list-style-type:decimal;
}
For information about editing a cascading style sheet (CSS), see documentation such as
the W3Schools.com CSS tutorial.
See Also
Classes
mlreportgen.dom.ListItem | mlreportgen.dom.OrderedList |
mlreportgen.dom.UnorderedList
Functions
mlreportgen.dom.OrderedList.append
Related Examples
•
“Use Style Sheets” on page 11-21
11-57
11
Create a Report Program
Create and Format Tables
In this section...
“Two Types of Tables” on page 11-58
“Create a Table from a Two-Dimensional Array” on page 11-59
“Create a Table Using the Table entry Function” on page 11-59
“Create a Table from Scratch” on page 11-60
“Format a Table” on page 11-61
“Create a Formal Table” on page 11-66
“Format a Formal Table” on page 11-66
“Create and Format Table Rows” on page 11-67
“Format Table Columns” on page 11-68
“Create and Format Table Entries” on page 11-69
Two Types of Tables
You can use the DOM API to create two types of tables that differ in structure.
• An informal table (i.e., a table) consists of rows that contain table entries.
• A formal table contains a header, a body, and a footer section. Each section contains
rows that contain table entries.
Informal tables are useful for most of your reporting needs. Use formal tables for tables
whose headers or footers contain multiple rows.
For details about informal tables, see:
• “Create a Table from a Two-Dimensional Array” on page 11-59
• “Create a Table Using the Table entry Function” on page 11-59
• “Create a Table from Scratch” on page 11-60
• “Format a Table” on page 11-61
For details about formal tables, see:
• “Create a Formal Table” on page 11-66
• “Format a Formal Table” on page 11-66
11-58
Create and Format Tables
Create a Table from a Two-Dimensional Array
You can create a table by appending a two-dimensional numeric array or a cell array
containing built-in MATLAB data (strings and numbers) and DOM objects (Text, Table,
Image, etc.) to a document. The append function converts the array to a Table object,
appends it to the document, and returns the Table object, which you can then format.
You can also create a Table object directly by including a two-dimensional array in its
constructor.
This example shows how to create a table from a numeric array and another table from
a cell array of various object types. The cell array contains a magic square, which is
rendered as an inner table. The cell array also includes a Text object constructor that
uses the AlertLevel template style.
import mlreportgen.dom.*;
doc = Document('test');
table1 = append(doc,magic(5));
table1.Border = 'single';
table1.ColSep = 'single';
table1.RowSep = 'single';
ca = {'text entry',Paragraph('a paragraph entry'); ...
Text('Danger!','AlertLevel'),magic(4)};
table2 = Table(ca);
append(doc,table2);
close(doc);
rptview(doc.OutputPath);
Create a Table Using the Table entry Function
You can use the entry function with a Table object to add content to a table entry
or to format an entry. This approach is useful when you need to format table entries
individually. For example:
import mlreportgen.dom.*;
doc = Document('test');
a = magic(5);
[v,i] = max(a);
[v1,i1] = max(max(a));
11-59
11
Create a Report Program
table = Table(a);
text = table.entry(i(i1),i1).Children(1);
text.Color = 'red';
append(doc,table);
close(doc);
rptview(doc.OutputPath);
Create a Table from Scratch
You can create a table from scratch by creating TableEntry objects, appending them to
TableRow objects, and appending the TableRow objects to a Table object. This approach
is useful when you need to create table entries that span multiple columns or rows that
have a different number of entries. This example shows how to create a table with four
columns and two rows. In the first table row, the second entry spans the second and third
columns.
import mlreportgen.dom.*;
doc = Document('test');
table = Table(4);
table.Border = 'single';
table.ColSep = 'single';
table.RowSep = 'single';
row = TableRow;
append(row, TableEntry('entry 11'));
te = TableEntry('entry 12-13');
te.ColSpan = 2;
te.Border = 'single';
append(row, te);
append(row, TableEntry('entry 14'));
append(table,row);
row = TableRow;
for c = 1:4
append(row, TableEntry(sprintf('entry 2%i', c)));
end
append(table,row);
append(doc,table);
11-60
Create and Format Tables
close(doc);
rptview(doc.OutputPath);
Format a Table
You can format a table programmatically, using DOM format objects or format
properties. You can also use Word and HTML template styles. For information about
these formatting techniques and format inheritance, see “Report Formatting Approaches”
on page 11-20.
Format a Table Programmatically
You can use format objects to format tables or use Table format properties to specify
commonly used table formats. This example uses:
• Border, ColSep, and RowSep format objects to specify a red table border and the
green column and row separators
• The Width format property to specify the table width
import mlreportgen.dom.*;
doc = Document('test','html');
table = Table(magic(5));
table.Style = {Border('inset','red','3px'), ...
ColSep('single','green','1px'), ...
RowSep('single','green','1px')};
table.Width = '50%';
append(doc, table);
close(doc);
rptview(doc.OutputPath);
Use these format objects and format properties to format a table.
Formatting
Format Object
Format Property
Width of table
Width
Width
Color of table background
BackgroundColor
BackgroundColor
Create border around table
Border
Border
11-61
11
Create a Report Program
Formatting
Format Object
Format Property
Color of border
Border
BorderColor
Thickness of border
Border
BorderWidth
Create left, right, top, or
bottom table border
Border
n/a
Collapse table and table
entry borders (HTML)
BorderCollapse
BorderCollapse
Create column separator
ColSep
ColSep
Column separator color
ColSep
ColSepColor
Column separator thickness ColSep
ColSepWidth
Create row separator
RowSep
RowSep
Row separator color
RowSep
RowSepColor
Row separator thickness
RowSep
RowSepWidth
Indent table from left
margin
OuterMargin
OuterLeftMargin
Space before or after table
OuterMargin
n/a
Space to right of table
OuterMargin
n/a
Align table left, right, or
center
HAlign
HAlign
Specify table entry flow
direction (left-to-right or
right-to-left)
FlowDirection
FlowDirection
Resize table columns to fit
contents
ResizeToFitContents
n/a
Format Table Entries
A Table object has properties that allow you to specify the same format or set of formats
for all of its entries.
11-62
Formatting
Table Object Property
Align entries vertically (top, middle,
bottom)
TableEntriesValign
Create and Format Tables
Formatting
Table Object Property
Align entries horizontally (left, right,
center)
TableEntriesHalign
Create space (padding) between entry
boundary and content
TableEntriesInnerMargin
Apply a set of format objects to all table
entries
TableEntriesStyle
Keep a Table and Its Title on the Same Page
Use the KeepLinesTogether and KeepWithNext paragraph formats to keep a table
title and the table together on the same page. This example creates a table title, creates
table content, and makes the table header row bold, using table entry indexing. To keep
the table on the same page, the code specifies KeepLinesTogether and KeepWithNext
for all rows except the last row. The last row has only KeepLinesTogether set and not
KeepWithNext. This prevents the table from being forced to stay with the paragraph
that follows.
import mlreportgen.dom.*
rpt = Document('test','docx');
p = Paragraph('Table 1');
p.Style = {Bold,KeepLinesTogether,KeepWithNext};
append(rpt, p);
ca = {Paragraph('Col 1'),Paragraph('Col 2'); ...
Paragraph('data 11'),Paragraph('Data 12'); ...
Paragraph('data 21'),Paragraph('Data 22')};
ca{1,1}.Children(1).Bold = true;
ca{1,2}.Children(1).Bold = true;
for r = 1:2
for c = 1:2
ca{r, c}.Style = {KeepLinesTogether,KeepWithNext};
end
end
for c = 1:2
ca{3, c}.Style = {KeepLinesTogether};
end
11-63
11
Create a Report Program
append(rpt, ca);
close(rpt);
rptview(rpt.OutputPath);
Format a Table Using Microsoft Word Style Sheets
You can format tables using an existing Word styles in a template or a template style
that you modify or add.
To define a table style in a Word template, start by using these steps.
1
Open the Word template used with the report.
2
Open the Styles pane.
3
Click the Manage Styles button
.
4
Click New Style.
5
In the Create New Style from Formatting dialog box, set Style type to Table.
For more information about using Word styles with DOM objects, see “Modify Styles in a
Microsoft Word Template” on page 11-117.
Format a Table Using an HTML Style Sheet
You can format tables using an HTML style defined in the template used to generate the
report.
To define a table style in an HTML template, define the style as a table style. For
example:
table.MyTable {
border-bottom-color: rgb(128, 128, 128);
border-bottom-width: thin;
border-collapse: collapse;
}
Tip Use the CSS parent (>) selector to specify the format of the children of a table to be
formatted with your table style. For example, this CSS code specifies the format of the
table entries (td elements) of a table whose style is MyTable.
table.MyTable > tr > td {
11-64
Create and Format Tables
font-family: Arial, Helvetica, sans-serif;
font-size: 11pt;
text-align: center;
}
Apply a Table Style to a Table
Once you have defined a table style in a template, you can apply it to a Table object in
your report program either as the second argument in the Table object constructor or
by setting it to the StyleName property of the Table object. For example, suppose you
have defined styles named BodyPara, TableTitle, and RuledTable in the template
for your report. This example specifies style names in a Paragraph constructor, in the
StyleName property of a Paragraph object, and in a Table constructor.
import mlreportgen.dom.*;
rank = 5;
rpt = Document('MyReport','html','MyTemplate');
p = Paragraph('Here is a magic square or rank 5:','BodyPara');
append(rpt,p);
p = Paragraph(sprintf('Rank %d MagicSquare',rank));
p.StyleName = 'TableTitle';
append(rpt,Table(magic(rank),'RuledTable'));
close(rpt);
rptview(rpt.OutputPath);
You can use programmatic formats to override the styles defined in a template-based
table style. For example, suppose you define a table style named UnruledTable in your
template to create tables without any borders or column or row separators. You can then
override the style in your report program to draw a frame around a table.
import mlreportgen.dom.*;
rpt = Document('MyReport','html','MyTemplate');
table = Table(magic(5),'UnruledTable');
table.Border = 'single';
append(rpt,table);
close(rpt);
rptview(rpt.OutputPath);
11-65
11
Create a Report Program
Create a Formal Table
To create a formal table, use the same basic approaches as with an informal table, except
that you must use an mlreportgen.domlFormalTable constructor to construct a
formal table. The constructor optionally accepts a two-dimensional numeric array or a
cell array of MATLAB data for the body, header, and footer sections.
If you choose to build a formal table completely or partially from scratch, you can use the
FormalTable object functions appendHeaderRow and appendBodyRow to append rows
to the table header and footer sections. The FormalTable.append function appends a
row to the body section. Alternatively, you can access a section using the Header, Body,
or Footer properties of the FormalTable object.
import mlreportgen.dom.*
d = Document('test');
t = FormalTable({'a','b';'c','d'});
r = TableRow();
append(r,TableEntry('Column 1'));
append(r,TableEntry('Column 2'));
append(t.Header,r);
append(d,t);
close(d);
rptview(d.OutputPath);
Format a Formal Table
You can format a formal table programmatically, using DOM format objects or format
properties. You can also use Word and HTML template styles. For information about
these formatting techniques and format inheritance, see “Report Formatting Approaches”
on page 11-20.
Format a Formal Table Programmatically
You can format a formal table programmatically the same way you format an informal
table. The format objects and properties that apply to an informal table also apply to
formal tables. In addition, you can format the header, body, and footer sections of an
informal table programmatically. If you specify a format for the table and one of its
sections, the value you specify for the section overrides the value you specify for the table
11-66
Create and Format Tables
as a whole. Not all formal table formats apply to formal table sections. For example, you
cannot indent a header, body, or footer section independently of the containing table. In
other words, the OuterLeftMargin property does not apply to formal table sections.
Apply Table Styles to a Formal Table and Its Sections
Use the same procedure for defining formal table styles in Word and HTML templates as
you use for defining informal table styles.
You can apply a table style to a formal table and to each of its sections. If you apply
a table style to the table itself and to one of its section (for example, the header), the
section style overrides the table style.
Note: If you apply a table style to one or more sections of a Word formal table, you must
specify the widths of each of the table columns. Otherwise, the columns of the sections
may not line up.
Create and Format Table Rows
If you need to build a table from scratch, you can use the TableRow constructor to create
the rows. Format the rows and then append the rows to a table that you are building.
Create a Table Row
The mlreportgen.dom.TableRow constructor takes no arguments and returns a
TableRow object. You can then create and append TableEntry objects to the object to
complete the row construction. Once you construct the row, you can add the row to the
table, using the append function. This example creates a two-column table with two
rows.
import mlreportgen.dom.*
rpt = Document('test');
table = Table(2);
row = TableRow();
append(row,TableEntry('Col1'));
append(row,TableEntry('Col2'));
append(table,row);
11-67
11
Create a Report Program
row = TableRow();
append(row,TableEntry('data11'));
append(row,TableEntry('data12'));
append(table,row);
append(rpt,table);
close(rpt);
rptview(rpt.OutputPath);
Format a Table Row
Use these format objects and format properties to format a table row.
Row Height Formatting
Format Object
Format Property
Specify the exact height of a RowHeight
row
Height
Specify the minimum height RowHeight
of row (Word only)
n/a
Cause this row to repeat as
header row when a table
flows across pages
n/a
RepeatAsHeaderRow
Allow this row to straddle a AllowBreakAcrossPages
page boundary
n/a
Format Table Columns
To format table columns, you can use mlreportgen.dom.TableColSpecGroup
objects, either alone or with mlreportgen.dom.TableColSpecGroup objects. Use a
TableColSpecGroup object to specify the format of a group of adjacent table columns.
Use a TableColSpec object to override, for some table columns, some or all of the
formats of a column group. In this example, the TableColSpecGroup property specifies
a column width of 0.2 inches and green text. The TableColSpec overrides those formats
for the first column, specifying a width of 0.5 inches and bold, red text.
import mlreportgen.dom.*
rpt = Document('test');
rank = 5;
11-68
Create and Format Tables
table = Table(magic(rank));
table.Border = 'single';
table.BorderWidth = '1px';
grps(1) = TableColSpecGroup;
grps(1).Span = rank;
grps(1).Style = {Width('0.2in'),Color('green')};
specs(1) = TableColSpec;
specs(1).Span = 1;
specs(1).Style = {Width('0.5in'),Bold,Color('red')};
grps(1).ColSpecs = specs;
table.ColSpecGroups = grps;
append(rpt,table);
close(rpt);
rptview('test','html');
To have columns resize to fit the widest content of the table entries in a column, include a
ResizeToFitContents object in the Style property of the table.
Create and Format Table Entries
If you need to build a table from scratch, you can use the
mlreportgen.dom.TableEntry constructor to create table entries. You can then
format the table entries and add them to table rows, which you can then add to the table
you are building. If you need to format entries in a table that you have created from a
cell array, you can use the TableEntry or TableRow function entry to gain access to an
entry, which you can then format.
Create a Table Entry
Use a TableEntry constructor to create a table entry. You can optionally use the
constructor to specify these kinds of entry content:
• Char array
• Any of these kinds of DOM objects:
• Paragraph
• Text
11-69
11
Create a Report Program
• Image
• Table
• OrderedList
• UnorderedList
• CustomElement
Format Table Entries Programmatically
You can use format objects or TableEntry format properties to format a table entry
programmatically.
Formatting
Format Object
Format Property
Create border around entry Border
Border
Color of border
Border
BorderColor
Thickness of border
Border
BorderWidth
Create left, right, top, or
bottom entry border
Border
n/a
Align entry content top,
bottom, middle
VAlign
VAlign
Space between entry
InnerMargin
boundary and entry content
InnerMargin
Space between entry
InnerMargin
content and its top, bottom,
right, or left boundaries
n/a
Cause entry to span
multiple columns
ColSpan
ColSpan
Cause entry to span
multiple rows
RowSpan
RowSpan
You can specify formatting for all table entries in a table, use the TableEntriesStyle
property of the Table or FormalTable object. For example, you can set border
formatting.
import mlreportgen.dom.*
t = Table(magic(5));
t.TableEntriesStyle(Border('solid','black','1 px'));
11-70
Create and Format Tables
Properties you set for a TableEntry object take precedence over TableEntriesStyle
format objects.
Format Table Entries Using Style Sheets
For HTML reports, you can use styles defined in an HTML template style sheet to format
table entries. When defining a table entry style, use a td element selector. For example:
td.TableEntryWithBorder {
border:5px solid red;
}
To apply a template-defined style to a table entry, set the TableEntry object
StyleName property to the name of the style or specify the style name as the second
argument to the TableEntry constructor. For example:
te = TableEntry('Hello World','TableEntryWithBorder');
See Also
Classes
mlreportgen.dom.AllowBreakAcrossPages | mlreportgen.dom.ColSep
| mlreportgen.dom.FlowDirection | mlreportgen.dom.FormalTable |
mlreportgen.dom.RepeatAsHeaderRow | mlreportgen.dom.ResizeToFitContents |
mlreportgen.dom.RowHeight | mlreportgen.dom.RowSep | mlreportgen.dom.Table
| mlreportgen.dom.TableBody | mlreportgen.dom.TableColSpec |
mlreportgen.dom.TableColSpecGroup | mlreportgen.dom.TableEntry
| mlreportgen.dom.TableFooter | mlreportgen.dom.TableHeader |
mlreportgen.dom.TableHeaderEntry | mlreportgen.dom.TableRow
Functions
mlreportgen.dom.FormalTable.appendFooterRow |
mlreportgen.dom.FormalTable.appendHeaderRow | mlreportgen.dom.TableRow.append
Related Examples
•
“Add Content to a Report” on page 11-11
More About
•
“Report Formatting Approaches” on page 11-20
11-71
11
Create a Report Program
Create Links
In this section...
“Links” on page 11-72
“Create a Link Target” on page 11-72
“Create an External Link” on page 11-73
“Create an Internal Link” on page 11-73
“Add Text or Images to Links” on page 11-73
Links
You can add these kinds of links to a report:
• External — Link to a location outside of the report, such as an HTML page or a PDF
file. Use an mlreportgen.dom.ExternalLink object.
• Internal — Link to locations in the report. Use an
mlreportgen.dom.InternalLink object.
Create a Link Target
To specify the link target for an InternalLink object, use value in the Name property
of an mlreportgen.dom.LinkTarget object. When you construct an ExternalLink
object, you can use an LinkTarget object Name value or a URL.
This example creates a link target called home, and uses home as the target for an
internal link.
import mlreportgen.dom.*
d = Document('mydoc');
append(d,LinkTarget('home'));
append(d,InternalLink('home','Go to Top'));
close(d);
rptview('mydoc', 'html');
11-72
Create Links
Create an External Link
Use an mlreportgen.dom.ExternalLink object to create an external link, specifying
the link target and the link text.
import mlreportgen.dom.*
d = Document('mydoc');
append(d,ExternalLink('http://www.mathworks.com/','MathWorks'));
close(d);
rptview('mydoc','html');
Create an Internal Link
To set up links to a location in a report, append an mlreportgen.dom.InternalLink
object to the document or document element. Use an mlreportgen.dom.LinkTarget
object with the document element to link to. For example, you can include an About the
Author link to a section that has the heading Author’s Biography.
import mlreportgen.dom.*
d = Document('mydoc');
append(d,InternalLink('bio','About the Author'));
h = Heading(1,LinkTarget('bio'));
append(h,'Author''s Biography');
append(d,h);
close(d);
rptview('mydoc','html');
Add Text or Images to Links
To add text or an image to an ExternalLink or InternalLink object, use the append
method with that object. Append a Text, Image, or CustomElement object.
See Also
mlreportgen.dom.ExternalLink | mlreportgen.dom.ExternalLink.append |
mlreportgen.dom.InternalLink | mlreportgen.dom.LinkTarget
11-73
11
Create a Report Program
Related Examples
•
“Create Image Maps” on page 11-84
•
“Add Content to a Report” on page 11-11
More About
•
11-74
“Report Formatting Approaches” on page 11-20
Create and Format Images
Create and Format Images
In this section...
“Create an Image” on page 11-75
“Resize an Image” on page 11-76
“Image Storage” on page 11-76
“Links from an Image” on page 11-76
Create an Image
To create an image to a report, create an mlreportgen.dom.Image object. You can
append it to one of these document element objects:
• Document
• Group
• Paragraph
• ListItem
• TableEntry
For example, you can create a MATLAB figure, save it as an image, and add the image to
a report.
import mlreportgen.dom.*
d = Document('imageArea','html');
p = Paragraph('Plot 1');
p.Bold = true;
append(d,p);
x = 0:pi/100:2*pi;
y = sin(x);
plot(x,y);
saveas(gcf,'myPlot_img.png');
plot1 = Image('myPlot_img.png');
append(d,plot1);
11-75
11
Create a Report Program
close(d);
rptview(d.OutputPath);
For a list of supported image formats, see mlreportgen.dom.Image.
Resize an Image
To resize an image object, you can:
• Set the Image.Height and Image.Width properties.
• Use an mlreportgen.dom.Height or mlreportgen.dom.Width object in an
Image.Style property definition.
For Microsoft Word reports, you can use an mlreportgen.dom.ScaleToFit object to
scale an image so that it fits within the page margins.
Image Storage
Keep the original file until it has been copied into the document. The DOM API copies
the contents of the source image file into the output document when you close the
document.
Links from an Image
You can specify an area in an image to be a link. Clicking a link area in an image in an
HTML browser opens the link. For details, see “Create Image Maps” on page 11-84.
See Also
mlreportgen.dom.Height | mlreportgen.dom.Image | mlreportgen.dom.ScaleToFit |
mlreportgen.dom.Width
Related Examples
•
“Add Content to a Report” on page 11-11
More About
•
11-76
“Report Formatting Approaches” on page 11-20
Create a Table of Contents
Create a Table of Contents
In this section...
“Create a Microsoft Word Table of Contents” on page 11-77
“Create an HTML Table of Contents” on page 11-79
“Set Outline Levels of Section Heads” on page 11-81
Create a Microsoft Word Table of Contents
The DOM API relies on an automatic table-of-contents (TOC) generation feature of Word
to generate a table of contents in a DOM Word report. With the Word TOC generation
feature, you create an item called a TOC reference in a Word document where you want
a TOC to appear. You create and set the outline line level of the paragraphs (typically
section heads) that you want to include in the generated TOC. Finally, you have Word
update the TOC to include the content of the paragraphs at the indicated outline level.
You use a very similar procedure for Word reports you create using the DOM API, except
that you create the section heads programmatically instead of interactively. To generate
a table of contents in a DOM Word report, perform these steps.
1
Create a table of contents reference in the Word template to specify where in the
report to generate the TOC. See “Create a Word Table of Contents Reference” on
page 11-77.
2
Set the outline levels of the section heads that you want to appear in the table of
contents. See “Set Outline Levels of Section Heads” on page 11-81.
3
Update the generated document. See “Update the TOC in a Word Report” on page
11-78.
Create a Word Table of Contents Reference
1
Open the template in Word.
2
Click where you want to create the table of contents.
3
In the Word ribbon, select the References pane.
4
Select the Table of Contents button.
11-77
11
Create a Report Program
5
Select a TOC format option to generate a table of contents. For example, select the
Built-In format option. The TOC appears.
6
Save the template.
Update the TOC in a Word Report
After you generate a Word report with the DOM API, open the report in Word and
update the document. Updating a document refers to the process of updating the parts of
a Word document that Word itself generates, such as a TOC, page numbers, and so on,
to reflect changes in the document content. The DOM rptview function causes Word to
update a report after opening it. If you use rptview to display your document in Word,
you do not need to do anything else to generate a TOC in your report.
11-78
Create a Table of Contents
However, if you open a newly generated report yourself in Word, without first using
rptview, perform these steps to get the TOC to appear.
1
In the Word template, select the TOC reference.
2
Open the Reference pane and click the Update Table button.
3
In the Update Table of Contents dialog box, select Update entire table and click
OK.
4
Save the report.
Create an HTML Table of Contents
The DOM API provides a JavaScript® script that you can include in an HTML report to
generate a table of contents when you open the report in an HTML browser. To use this
script to generate a TOC in an HTML report, perform these steps.
1
Create an HTML TOC placeholder element in the template. See “Create an HTML
TOC Placeholder” on page 11-80
2
Set the outline levels of the section heads that you want to appear in the table of
contents. See “Set Outline Levels of Section Heads” on page 11-81.
3
Open the generated report in a browser.
11-79
11
Create a Report Program
Create an HTML TOC Placeholder
An HTML TOC placeholder element is an HTML div element with an id attribute set to
toc.
<div id="toc"/>
You can create a TOC placeholder in any of the following ways.
• “Use a Template That Contains a Placeholder” on page 11-80
• “Insert a Placeholder Programmatically Using a Custom Element” on page 11-80
• “Insert a Placeholder Programmatically Using a Document Part” on page 11-81
Use a Template That Contains a Placeholder
1
Create a copy of the DOM default HTML template.
2
Unzip the template using the unzipTemplate command.
3
In a text or HTML editor, open the template main document (typically named
root.html).
4
In the root document, in the report location you want the TOC to appear, insert the
following HTML markup:
<div id="toc"></div>
5
Save the main document.
6
Zip the template, using the unzipTemplate command.
7
Set the outline levels of the section heads that you want to appear in the table of
contents. See “Set Outline Levels of Section Heads” on page 11-81 .
8
Use the template to generate the report.
Next,
Insert a Placeholder Programmatically Using a Custom Element
If you use the DOM default HTML template (or a template based on the default
template), you can create a placeholder programmatically in your report. For example:
import mlreportgen.dom.*;
d = Document('MyReport','html');
append(d,'My Report');
11-80
Create a Table of Contents
toc = CustomElement('div');
toc.CustomAttributes = {CustomAttribute('id','toc')};
append(toc,CustomText()); % Workaround for browser bug
append(d,toc);
append(d,Heading(1,'Chapter 1'));
append(d,Heading(2,'Section 1'));
close(d);
rptview(d.OutputPath);
Insert a Placeholder Programmatically Using a Document Part
The document part template library of the DOM default template contains a document
part for creating a TOC placeholder. If you use this template or a template based on it,
you can use the document part to insert a TOC placeholder in your report. For example:
import mlreportgen.dom.*;
d = Document('MyReport','html');
append(d,'My Report');
append(d,DocumentPart(d,'ReportTOC'));
append(d,Heading(1,'Chapter 1'));
append(d,Heading(2,'Section 1'));
close(d);
rptview(d.OutputPath);
Set Outline Levels of Section Heads
To generate a table of contents in a Word or HTML report, your program must set the
outline levels of the section heads that you want to appear in the table. An outline level
is a paragraph format property that specifies whether and at what level a paragraph’s
contents appear in a table of contents. For example, if a paragraph has an outline level of
1, its content appears at the top level of the generated table of contents. You can use up
to nine distinct outline levels.
To set the outline level of paragraphs, use one of these approaches.
• “Use Template-Defined Styles to Set Outline Levels” on page 11-82
• “Use Format Objects to Set Outline Levels” on page 11-82
• “Use Heading Objects to Set Outline Levels” on page 11-82
11-81
11
Create a Report Program
Use Template-Defined Styles to Set Outline Levels
You can use styles defined in the report’s template to set the outline level of a paragraph.
For example, by default Word documents include a set of styles, Heading 1, Heading 2,
and so on, that define outline levels for paragraphs you want to appear in a TOC. Your
program can use these built-in styles to specify that paragraphs that serve as section
heads appear in the TOC. The following example illustrates the use of template-defined
styles to set the outline levels of section heads. This example assumes that the template
MyTemplate includes a TOC reference.
import mlreportgen.dom.*;
d = Document('MyReport','docx','MyTemplate');
append(d,Paragraph('Chapter 1','Heading 1'));
append(d,Paragraph('Section 1','Heading 2'));
close(d);
rptview(d.OutputPath); % Updates the TOC
You can also use Word or an HTML editor to define your own heading styles and then
use them to generate a report.
Use Format Objects to Set Outline Levels
You can use format objects to set outline levels. This example assumes that the template
MyTemplate includes a TOC reference.
import mlreportgen.dom.*;
d = Document('MyReport','docx','MyTemplate');
h1 = {FontFamily('Arial'),FontSize('16pt'),OutlineLevel(1)};
h2 = {FontFamily('Arial'),FontSize('14pt'),OutlineLevel(2)};
p = append(d,Paragraph('Chapter 1'));
p.Style = h1;
p = append(d,Paragraph('Section 1'));
p.Style = h2;
close(d);
rptview(d.OutputPath); % Updates the TOC
Use Heading Objects to Set Outline Levels
You can use mlreportgen.dom.Heading objects to specify outline levels. A Heading
object is a paragraph whose constructor specifies its outline level. You can use a Heading
11-82
Create a Table of Contents
object alone or in combination with template-based styles or format object-based styles.
This example assumes that the template MyTemplate includes a TOC reference.
import mlreportgen.dom.*;
d = Document('MyReport','docx','MyTemplate');
h1 = {FontFamily('Arial'),FontSize('16pt')};
h2 = {FontFamily('Arial'),FontSize('14pt')};
h = append(d, Heading(1,'Chapter 1'));
h.Style = h1;
h = append(d, Heading(2,'Section 1'));
p.Style = h2;
close(d);
rptview(d.OutputPath); % Updates the TOC
The Heading objects generate HTML h1, h2 (and so on) elements. By using Heading
objects in an HTML report, you can ensure that your report uses the default styles for
headings implemented by the browser in which you display the report.
See Also
Functions
rptview | unzipTemplate | zipTemplate
Classes
mlreportgen.dom.Heading
Related Examples
•
“Create a Microsoft Word Template” on page 11-111
•
“Create an HTML Template” on page 11-122
11-83
11
Create a Report Program
Create Image Maps
You can specify areas of an image to be links. Clicking the link area in an image in an
HTML browser opens the target. You can map different areas in an image to different
link targets.
1
Create an mlreportgen.dom.ImageArea object for each image area that is to serve
as a link. You can specify text to display if the image is not visible.
You can specify an image area to have one of these shapes:
• Rectangle
• Circle
• Polygon
For details, see mlreportgen.dom.ImageArea.
2
Create an mlreportgen.dom.ImageMap object to associate the link areas with the
image. Append the ImageArea objects to the ImageMap object.
For example, you can create a link from a plot image to documentation about plotting.
import mlreportgen.dom.*
d = Document('imageArea','html');
x = 0:pi/100:2*pi;
y = sin(x);
plot(x,y);
annotation('textbox',[0.2,0.4,0.1,0.1],...
'String','Help for plot function');
saveas(gcf,'plot_img.png');
plot1 = Image('plot_img.png');
append(d,plot1);
area1 = ImageArea(...
['http://www.mathworks.com/help/matlab/ref/' ...
'plot.html?searchHighlight=plot'], ...
'plot function help',240,450,463,492);
map = ImageMap();
plot1.Map = map;
append(map,area1);
11-84
Create Image Maps
close(d);
rptview(d.OutputPath);
See Also
Classes
mlreportgen.dom.Image | mlreportgen.dom.ImageArea | mlreportgen.dom.ImageMap
Functions
Related Examples
•
“Add Content to a Report” on page 11-11
More About
•
“Report Formatting Approaches” on page 11-20
11-85
11
Create a Report Program
Automatically Number Document Content
In this section...
“Automatically Number Content Programmatically” on page 11-86
“Automatically Number Content Using Part Templates” on page 11-88
You can automatically number document content, such as chapter, section, table, and
figure headings. Append automatic numbering objects to the document where you want
numbers to appear. Each automatic number is associated with a numbering stream
that determines the value of each number in a sequence. Report generation replaces
an automatic numbering object with a number based on its position in the document
relative to other automatic numbers in the same stream. For example, the first automatic
numbering object in a stream can be replaced by 1, the second by 2, and so on. You can
use automatic numbering to create hierarchical numbering schemes such as Section 1.1.,
Section 1.2, and so on.
You can automatically number document content programmatically or by inserting
automatic numbering fields in a Word template or numbering properties in an HTML
template. For example, you can insert automatic numbering in a template for a document
part that is appended repeatedly to a report.
Automatically Number Content Programmatically
To automatically number document content programmatically, do the following at each
point in a document where you want an automatically generated number to appear.
1
Create an automatic numbering object, using the mlreportgen.dom.AutoNumber
constructor. Specify the name of the associated automatic numbering stream in the
constructor. For example, this line creates an automatic number belonging to the
stream named chapter.
chapterNumber = AutoNumber('chapter');
Note: If the specified automatic numbering stream does not exist, the AutoNumber
constructor creates a numbering stream having the specified name. The
implicitly constructed stream renders automatic numbers as Arabic numerals.
To use a stream with different properties, create the stream explicitly, using a
createAutoNumberStream function of a Document object.
11-86
Automatically Number Document Content
2
Append the AutoNumber to a Text, Paragraph, or Heading object that contains the
text that precedes the automatic number.
append(chapHead,chapterNumber);
3
Append an mlreportgen.dom.CounterInc format object to the Style property of
the content object that you want to automatically number. Appending a CounterInc
object increments the stream associated with the automatic number when the
paragraph or heading is output. The updated value replaces the AutoNumber object.
chapHead.Style = {CounterInc('chapter'), WhiteSpace('preserve')};
This script automatically numbers the chapter headings in a document.
import mlreportgen.dom.*;
d = Document('MyReport','html');
for rank = 3:5
chapHead = Heading(1,'Chapter ','Heading 1');
append(chapHead,AutoNumber('chapter'));
append(chapHead,sprintf('. Rank %i Magic Square',rank));
chapHead.Style = {CounterInc('chapter'), ...
WhiteSpace('preserve')};
append(d,chapHead);
table = append(d,magic(rank));
table.Width = '2in';
end
close(d);
rptview(d.OutputPath);
Create Hierarchical Automatic Numbering
You can create hierarchical numbering schemes, such as 1.1, 1.2, 1.3, 2.1, 2.2, and so
on. Use an mlreportgen.dom.CounterReset format object to reset a child automatic
number to its initial value when its parent number changes. For example, this script
uses a CounterReset format object to reset the chapter table number stream at the
beginning of each chapter.
import mlreportgen.dom.*;
d = Document('MyReport','html');
for rank = 3:2:9
chapHead = Heading(1,'Chapter ');
append(chapHead, AutoNumber('chapter'));
11-87
11
Create a Report Program
chapHead.Style = {CounterInc('chapter'), ...
CounterReset('table'), ...
WhiteSpace('preserve')};
append(d,chapHead);
for i = 0:1;
tableHead = Paragraph('Table ');
append(tableHead,AutoNumber('chapter'))
append(tableHead,'.');
append(tableHead, AutoNumber('table'));
append(tableHead, ...
sprintf('. Rank %i Magic Square',rank+i));
tableHead.Style = {CounterInc('table'), ...
Bold, ...
FontSize('11pt'), ...
WhiteSpace('preserve')};
append(d,tableHead);
table = append(d,magic(rank+i));
table.Width = '2in';
end
end
close(d);
rptview(d.OutputPath);
Automatically Number Content Using Part Templates
You can automatically number a document by creating document parts based on
templates containing Microsoft Word or HTML automatic numbering and repeatedly
appending the parts to a document.
For example, suppose that you add a chapter part template Chapter to the part
template library of the Word MyReportTemplate.dotx report template. This template
uses a Word sequence (SEQ) field to number the chapter heading. The template also
contains holes for the chapter title and the chapter content.
This script uses the chapter part template to create numbered chapters. The last
statement in this script opens the report in Word and updates it. Updating the report
causes Word to replace the SEQ fields with the chapter numbers.
11-88
Automatically Number Document Content
import mlreportgen.dom.*
d = Document('MyReport','docx','MyReportTemplate');
for rank = 3:5
chapterPart = DocumentPart(d,'Chapter');
while ~strcmp(chapterPart.CurrentHoleId,'#end#')
switch chapterPart.CurrentHoleId
case 'ChapterTitle'
append(chapterPart, ...
sprintf('Rank %i Magic Square',rank));
case 'ChapterContent'
table = append(chapterPart,magic(rank));
table.Width = '2in';
end
moveToNextHole(chapterPart);
end
append(d, chapterPart);
end
close(d);
rptview(d.OutputPath);
You can use a similar approach to automatically number HTML reports, using the CSS
counter-increment and content properties in the template for your report.
See Also
Functions
mlreportgen.dom.Document.createAutoNumberStream |
mlreportgen.dom.Document.getAutoNumberStream
Classes
mlreportgen.dom.AutoNumber | mlreportgen.dom.AutoNumberStream |
mlreportgen.dom.CounterInc | mlreportgen.dom.CounterReset
11-89
11
Create a Report Program
Appending HTML to DOM Reports
In this section...
“Why Append HTML to a DOM Report?” on page 11-90
“Workflow for Appending HTML” on page 11-90
Why Append HTML to a DOM Report?
You can append HTML markup or the entire contents of an HTML file to a programmatic
report written with the document object model (DOM) API. Append HTML to:
• Convert an existing HTML report to a Microsoft Word or PDF report.
You can append HTML markup for a report to a DOM report, which you can then
generate in Word or PDF format.
• Add content based on HTML markup.
You can append the HTML content to a DOM report. You can use the HTML content
as a building block in a DOM report that includes other report elements.
Workflow for Appending HTML
Appending HTML to a DOM report involves these tasks.
1
In a DOM report, append HTML content or an HTML file to a document or document
part.
For example, this DOM code creates a Word report that displays Hello World,
based on the HTML content that you append to the report.
import mlreportgen.com.*;
d = Document('MyReport','docx');
addHTML(d,'<p style="color:blue"><b>Hello World</b></p>');
An alternative approach is to create an mlreportgen.dom.HTML or
mlreportgen.dom.HTMLFile object and append it to a DOM report.
2
11-90
If you receive any MATLAB error messages, fix the source HTML markup and
append the HTML again.
Appending HTML to DOM Reports
The HTML content that you append must be XML parsable. For a summary of those
requirements and for a list of supported HTML elements and HTML CSS formats,
see “HTML Code Requirements for DOM Reports” on page 11-100.
See Also
mlreportgen.dom.Document.addHTML | mlreportgen.dom.Document.addHTMLFile |
mlreportgen.dom.HTML | mlreportgen.dom.HTMLFile
Related Examples
•
“Append HTML Content to DOM Reports” on page 11-92
•
“Append HTML File Contents to DOM Reports” on page 11-94
•
“Use an HTML Cleanup Program” on page 11-96
More About
•
“HTML Code Requirements for DOM Reports” on page 11-100
11-91
11
Create a Report Program
Append HTML Content to DOM Reports
In this section...
“Use an addHTML Method” on page 11-92
“Append an HTML Object” on page 11-93
“Address Errors” on page 11-93
You can append strings of HTML content to a DOM document or document part using
either of these approaches:
• Use the addHTML method with a Document or DocumentPart object.
• Create and append an HTML object.
If the HTML content that you append does not meet DOM requirements, the DOM API
generates error messages. You can use an HTML cleanup program such as HTML Tidy
on a file containing the source HTML content. HTML Tidy fixes many issues and also
identifies issues you need to address manually. After you clean up the source HTML
content, append it to a DOM report.
Use an addHTML Method
You can use the addHTML method with an mlreportgen.dom.Document or
mlreportgen.dom.DocumentPart object to add a string of HTML content to a DOM
report.
For example, you can use addHTML to create an HTML object that you append to a DOM
report that produces Word output.
import mlreportgen.dom.*;
rpt = Document('HTMLToWordReport','docx');
htmlObj = addHTML(rpt,...
'<p><b>Hello</b> <i style="color:green">World</i></p>');
close(rpt);
rptview(rpt.OutputPath);
11-92
Append HTML Content to DOM Reports
Append an HTML Object
You can create an mlreportgen.dom.HTML object and append it to a DOM report. To
append the content of an HTML object more than once in a report, use the clone method
with the HTML object. Then append the cloned copy to the report.
For example, you can create an HTML object from HTML markup to use for a Word report.
import mlreportgen.dom.*;
rpt = Document('MyRep1','docx');
html = HTML('<p><b>Hello</b> <i style="color:green">World</i></p>');
append(html,'<p>This is <u>me</u> speaking</p>');
append(rpt,html);
close(rpt);
rptview(rpt.OutputPath);
Address Errors
If you receive any MATLAB error messages, fix the source HTML markup and append
the HTML again. You can use an HTML cleanup program such as HTML Tidy on a file
containing the source HTML content. HTML Tidy fixes many issues and also identifies
issues you need to address manually. After you clean up the source HTML content,
append it to a DOM report. For details, see “Use an HTML Cleanup Program” on page
11-96.
See Also
mlreportgen.dom.Document.addHTML | mlreportgen.dom.HTML
Related Examples
•
“Append HTML File Contents to DOM Reports” on page 11-94
•
“Use an HTML Cleanup Program” on page 11-96
More About
•
“Appending HTML to DOM Reports” on page 11-90
•
“HTML Code Requirements for DOM Reports” on page 11-100
11-93
11
Create a Report Program
Append HTML File Contents to DOM Reports
In this section...
“Use an addHTMLFile Method” on page 11-94
“Append an HTMLFile Object” on page 11-94
“Address Errors” on page 11-95
You can append HTML files to a DOM document or document part using either of these
approaches:
• Use the addHTMLFile method with a Document or DocumentPart object.
• Create and append an HTMLFile object.
If the HTML file contents that you append do not meet DOM requirements, the DOM
API generates error messages. You can use an HTML parser and cleanup program such
as HTML Tidy to fix many issues and to identify issues you need to address manually.
Use an addHTMLFile Method
You can use the addHTMLFile method with an mlreportgen.dom.Document or
mlreportgen.dom.DocumentPart object to add the contents of an HTML file to a DOM
report.
For example, you can use addHTMLFile to create an HTMLFile object that you append to
a DOM report that produces Word output.
import mlreportgen.dom.*;
rpt = Document('HTMLToWordReport','docx');
htmlObj = addHTML(rpt,...
'<p><b>Hello</b> <i style="color:green">World</i></p>');
close(rpt);
rptview(rpt.OutputPath);
Append an HTMLFile Object
You can create an mlreportgen.dom.HTMLFile object and append it to a DOM report.
11-94
Append HTML File Contents to DOM Reports
For example, you can convert the contents of two HTML files to a DOM report in Word
format. This example assumes that there are HTML files called myHTMLfile1.html and
myHTMLfile2.htmlin the MATLAB current folder.
import mlreportgen.dom.*;
rpt = Document('MyHTMLReport','docx');
path = 'myHTMLfile1.html';
htmlFile1 = HTMLFile(path);
htmlFile2 = HTMLFile('myHTMLFile2.html');
append(htmlFile1,htmlFile2)
append(rpt,htmlFile1);
close(rpt);
rptview(rpt.OutputPath);
Address Errors
If you receive any MATLAB error messages, fix the source HTML markup and append
the HTML again. You can use an HTML cleanup program such as HTML Tidy on the
HTML file to fix many issues. HTML Tidy also identifies issues you need to address
manually. After you clean up the HTML content, append it to a DOM report. For details,
see “Use an HTML Cleanup Program” on page 11-96.
See Also
mlreportgen.dom.Document.addHTMLFile | mlreportgen.dom.HTMLFile
Related Examples
•
“Append HTML Content to DOM Reports” on page 11-92
•
“Use an HTML Cleanup Program” on page 11-96
More About
•
“Appending HTML to DOM Reports” on page 11-90
•
“HTML Code Requirements for DOM Reports” on page 11-100
11-95
11
Create a Report Program
Use an HTML Cleanup Program
You can use an HTML cleanup program such as HTML Tidy to fix many issues and
to identify issues you need to address manually. For a description of requirements for
HTML content that you can append, see “HTML Code Requirements for DOM Reports”
on page 11-100 .
Use HTML Tidy to Fix HTML Code
You can use the HTML Tidy program to fix HTML content so that it meets the
requirements for appending to a DOM report. This example uses a batch file to fix the
HTML content.
1
Copy the following HTML content into a text editor such as Wordpad.
<html>
<head>
<title>Hi there</title>
</head>
<body>
<p>This is a page
a simple page with a simple table
<style>
table, th, td {
border: 1px solid black;
}
</style>
<table style="width:50%">
<tr>
<td><b>Name</B></td>
<td><b>Age</b></td>
<td><b>Occupation</b></td>
</tr>
<tr>
<td>Joe Smith</td>
<td>40</td>
<td>Plumber</td>
</tr><tr>
<td>Sue Jones</td>
<td>33</td>
<td>Scientist</td>
</tr>
<tr>
11-96
Use an HTML Cleanup Program
<td>Carlos Martinez</td>
<td>38</td>
<td>Lawyer</td>
</tr>
</table>
</body>
</html>
This HTML content has elements that are not XML parsable, including:
• Lack of a closing tag:
<p>This is a page
a simple page with a simple table
• Inconsistent case for an element tag:
<td><b>Name</B></td>
2
In the current MATLAB folder, save the file using the file name
simple_html_example.html.
3
Display the file in an HTML browser. Although the HTML content contains elements
that are not XML parsable, it displays properly in most HTML browsers, such as
Internet Explorer.
4
In MATLAB, try appending the HTML file to a DOM report.
import mlreportgen.dom.*;
rpt = Document('html_report','docx');
htmlFile = HTMLFile('simple_html_example.html');
You receive this error.
Error using mlreportgen.dom.HTMLFile
11-97
11
Create a Report Program
Parsing HTML text:
"simple_html_example.html"
caused error:
"HTML error: "expected end of tag 'b'""
5
Download the HTML Tidy program. For example, to download Tidy for Windows,
go to http://www.paehl.com/open_source/?HTML_Tidy_for_Windows. Click the EXE
Version compiled 06 nov 2009 link.
Note: To download Tidy for other platforms, see http://tidy.sourceforge.net/#binaries.
6
In the tidy.zip file, right-click tidy.exe and select Extract. Extract tidy.exe to
the current MATLAB folder.
7
Create a batch file to use with Tidy. In Notepad, enter the following code.
tidy --doctype omit --input-xml no --output-xml yes --write-back yes -f errs.txt %1
Save the batch file in the Windows path. Save the file as tidyup.bat. You can use
this batch file with other HTML files that you want to append to a DOM report.
8
Make a backup copy of the simple_html_example.html file, which contains the
HTML to append to the DOM report.
9
Run Tidy on simple_html_example.html. In a Windows command window, enter:
tidyup simple_html_example.html
10 In the folder where you ran tidyup, check the errs.txt file. That file summarizes
the changes Tidy made, and lists as errors issues that Tidy could not fix. In this
example, there are no errors, but if errs.txt did report errors, manually edit the
HTML file to address those issues.
11 In MATLAB, append the simple_html_example.html file to a DOM report and
display the report.
import mlreportgen.dom.*;
rpt = Document('html_report','docx');
htmlFile = HTMLFile('simple_html_example.html');
append(rpt,htmlFile);
close(rpt);
rptview(rpt.OutputPath);
Related Examples
•
11-98
“Append HTML Content to DOM Reports” on page 11-92
Use an HTML Cleanup Program
•
“Append HTML File Contents to DOM Reports” on page 11-94
More About
•
“HTML Code Requirements for DOM Reports” on page 11-100
•
“Appending HTML to DOM Reports” on page 11-90
11-99
11
Create a Report Program
HTML Code Requirements for DOM Reports
In this section...
“XML-Parsable HTML Code” on page 11-100
“Supported HTML Elements and Attributes” on page 11-100
“Supported HTML CSS Style Attributes for All Elements” on page 11-102
“Support for HTML Character Entities” on page 11-103
“DOCTYPE Declaration” on page 11-104
XML-Parsable HTML Code
The HTML content that you append to a DOM report must be XML parsable. HTML
content that is XML parsable complies with the rules for properly formed XML, such as:
• Include a closing tag for all elements.
• Use the lower case for the opening and closing (start and end) tags of an element. For
example, use <p> and </p> for a paragraph element, not <P> and </p>.
• Nest elements properly. If you open an element inside of another element, close that
first element before you close the containing element.
• Enclose attribute values with quotation marks. For example, use <p
align="center"></p>.
For details, see the W3Schools summary of XML rules at www.w3schools.com/xml/
xml_syntax.asp.
Tip You can use the HTML Tidy program to ensure that your HTML file is XML
parsable. For details, see “Use an HTML Cleanup Program” on page 11-96.
Supported HTML Elements and Attributes
In HTML content that you append to a DOM report, you can use these HTML elements
and attributes.
11-100
HTML Element
Attributes
a
class, style, href, name
HTML Code Requirements for DOM Reports
HTML Element
Attributes
b
class, style
br
n/a
code
class, style
del
class, style
font
class, style, color, face, size
h1, h2, h3, h4, class, style, align
h5, h6
hr
class, style, align, size, width
i
class, style
ins
class, style
img
class, style, src, height, width, alt
li
class, style
ol
class, style
p
class, style, align
pre
class, style
s
class, style
span
class, style
strike
class, style
sub
class, style
sup
class, style
table
class, style, align, bgcolor, border, cellspacing,
cellpadding, frame, rules, width
tbody
class, style, align, valign
tfoot
class, style, align, valign
thead
class, style, align, valign
td
class, style, bgcolor, height, width, colspan,
rowspan, valign, nowrap
tr
class, style, bgcolor, valign
11-101
11
Create a Report Program
HTML Element
Attributes
tt
class, style
u
class, style
ul
class, style
For information about these elements, see the W3Schools tags documentation at
www.w3schools.com/tags.
Supported HTML CSS Style Attributes for All Elements
You can use HTML style attributes to format HTML content. A style attribute is a string
of CSS (cascading style sheets) formats. In HTML content that you append to a DOM
report, you can use these CSS style attributes.
• background-color
• border
• border-bottom
• border-bottom-color
• border-bottom-style
• boder-bottom-width
• border-color
• border-left
• border-left-color
• border-left-style
• boder-left-width
• border-right
• border-right-color
• border-rigtht-style
• border-right-width
• border-style
• border-top
• border-top-color
• border-top-style
11-102
HTML Code Requirements for DOM Reports
• border-top-width
• color
• display
• font-family
• font-size
• font-style
• font-weight
• height
• line-height
• margin
• margin-bottom
• margin-left
• margin-right
• margin-top
• padding
• padding-bottom
• padding-left
• padding-right
• padding-top
• text-align
• text-decoration
• text-indent
• vertical-align
• white-space
• width
For information about these CSS formats, see the W3Schools CSS documentation at
www.w3schools.com/cssref.
Support for HTML Character Entities
You can append HTML content that includes special characters, such as the British
pound sign, the U.S. dollar sign, or reserved XML markup characters. The XML markup
11-103
11
Create a Report Program
special characters are >, <, &, ", and '. To include special characters, use HTML named
or numeric character references. For example, to include the left bracket (<) in HTML
content that you want to append, use one of these character entity references:
• The named character entity reference <
• The numeric character entity reference &003c;
For more information, see http://en.wikipedia.org/wiki/
List_of_XML_and_HTML_character_entity_references.
DOCTYPE Declaration
The HTML content that you append to a DOM report does not need to include a
document type declaration (see http://www.w3schools.com/tags/tag_doctype.asp). If the
content does include a document type declaration, it must meet the following conditions:
• If the content includes character entity references (special characters), the document
type declaration must reference a document type definition (DTD) that defines the
referenced entities. For example, the following declaration specifies a DTD that
defines all HTML character entities:
<!DOCTYPE html SYSTEM "html.dtd">
The html.dtd is included in the MATLAB Report Generator software.
• If the document type declaration references a DTD, a valid DTD must exist at the
path specified by the declaration. Otherwise, appending the content causes a DTD
parse error. For example, the following declaration causes a parse error:
<!DOCTYPE html SYSTEM "foo.dtd">
• If the content to be appended does not include character entity references, the
document type declaration does not need to reference a DTD. For example, the
following declaration works for content that does not use special characters:
<!DOCTYPE html>
Tip To avoid document type declaration issues, remove declarations from existing HTML
content that you intend to append to DOM reports. If the content does not include
a declaration, the DOM prepends a valid declaration that defines the entire HTML
character entity set.
11-104
HTML Code Requirements for DOM Reports
Related Examples
•
“Use an HTML Cleanup Program” on page 11-96
•
“Append HTML Content to DOM Reports” on page 11-92
•
“Append HTML File Contents to DOM Reports” on page 11-94
More About
•
“Appending HTML to DOM Reports” on page 11-90
11-105
11
Create a Report Program
Display Report Generation Messages
In this section...
“Report Generation Messages” on page 11-106
“Display DOM Default Messages” on page 11-106
“Create and Display a Progress Message” on page 11-108
Report Generation Messages
The DOM API includes a set of messages that can display when you generate a report.
The messages are triggered every time a document element is created or appended
during report generation.
You can define additional messages to display during report generation. The DOM API
provides these classes for defining messages:
• ProgressMessage
• DebugMessage
• WarningMessage
• ErrorMessage
The DOM API provides additional classes for handling report message dispatching
and display. It uses MATLAB events and listeners to dispatch messages. A message is
dispatched based on event data for a specified DOM object. For an introduction to events
and listeners, see “Events and Listeners — Concepts”.
Note: When you create a message dispatcher, the DOM API keeps the dispatcher
until the end of the current MATLAB session. Delete message event listeners to avoid
duplicate reporting of message objects during a MATLAB session.
Display DOM Default Messages
This example shows how to display the default DOM debug messages. Use a similar
approach for displaying other kinds of DOM report messages.
11-106
Display Report Generation Messages
1
Create a message dispatcher, using the MessageDispatcher.getTheDispatcher
method. Use the same dispatcher for all messages.
dispatcher = MessageDispatcher.getTheDispatcher;
dispatcher.Filter.DebugMessagesPass = true;
2
Use the MessageDispatcher.Filter property to specify to display debug
messages.
dispatcher.Filter.DebugMessagesPass = true;
3
Add a listener using the MATLAB addlistener function. Specify the dispatcher
object, the source and event data, and a disp function that specifies the event data
and format to use for the message.
l = addlistener(dispatcher,'Message', ...
@(src, evtdata) disp(evtdata.Message.formatAsText));
4
Include a code to delete the listener. Place it after the code that generates the report.
delete(l);
This report displays debug messages.
import mlreportgen.dom.*;
d = Document('test','html');
dispatcher = MessageDispatcher.getTheDispatcher;
dispatcher.Filter.DebugMessagesPass = true;
l = addlistener(dispatcher,'Message', ...
@(src, evtdata) disp(evtdata.Message.formatAsText));
open(d);
p = Paragraph('Chapter ');
p.Tag = 'chapter title';
p.Style = { CounterInc('chapter'),...
CounterReset('table'),WhiteSpace('pre') };
append(p, AutoNumber('chapter'));
append(d,p);
close(d);
rptview('test','html');
delete(l);
11-107
11
Create a Report Program
Create and Display a Progress Message
This example shows how to create and dispatch a progress message. You can use a
similar approach for other kinds of messages, such as warnings.
1
Create a message dispatcher.
dispatcher = MessageDispatcher.getTheDispatcher;
2
Add a listener using the MATLAB addlistener function.
l = addlistener(dispatcher,'Message', ...
@(src, evtdata) disp(evtdata.Message.formatAsText));
3
Dispatch the message, using the Message.dispatch method. Specify the dispatcher
object and the message to dispatch. Here the message is a debug message called
starting chapter, and the Document object d is the source of the message.
dispatch(dispatcher,ProgressMessage('starting chapter',d));
4
Include code to delete the listener, after the code that generates the report.
delete(l);
This report uses this progress message.
import mlreportgen.dom.*;
d = Document('test','html');
dispatcher = MessageDispatcher.getTheDispatcher;
l = addlistener(dispatcher,'Message', ...
@(src, evtdata) disp(evtdata.Message.formatAsText));
open(d);
dispatch(dispatcher,ProgressMessage('starting chapter',d));
p = Paragraph('Chapter ');
p.Tag = 'chapter title';
p.Style = { CounterInc('chapter'),...
CounterReset('table'),WhiteSpace('pre') };
append(p, AutoNumber('chapter'));
append(d,p);
close(d);
rptview('test','html');
11-108
Display Report Generation Messages
delete(l);
The MATLAB Command Window displays progress messages, including the starting
chapter message, as well as the messages the DOM API dispatches by default.
See Also
Functions
mlreportgen.dom.MessageDispatcher.dispatch |
mlreportgen.dom.MessageDispatcher.getTheDispatcher
| mlreportgen.dom.ProgressMessage.formatAsHTML
| mlreportgen.dom.ProgressMessage.formatAsText |
mlreportgen.dom.ProgressMessage.passesFilter
Classes
mlreportgen.dom.DebugMessage | mlreportgen.dom.ErrorMessage |
mlreportgen.dom.MessageDispatcher | mlreportgen.dom.MessageEventData
| mlreportgen.dom.MessageFilter | mlreportgen.dom.ProgressMessage |
mlreportgen.dom.WarningMessage
11-109
11
Create a Report Program
Compile a Report Program
If the MATLAB Compiler™ product is installed on your system, you can use it to compile
your DOM-based report generation program. This allows you to share your report
generation program with others who do not have MATLAB installed on their systems.
To enable someone who does not have MATLAB installed to run your compiled program,
your program must execute the following statement before executing the first line of
DOM code that it executes to generate a report:
makeDOMCompilable();
11-110
Create a Microsoft Word Template
Create a Microsoft Word Template
Use one of these approaches to create a Word template for generating a report.
• Use mlreportgen.dom.Document.createTemplate to create a copy of the DOM
API default Word template that you can then customize. For example,
mlreportgen.dom.Document.createTemplate('mytemplate','docx');
• Use an existing Word template (for example, a report template for your organization)
and customize the template to use with the DOM API.
• Create a Word template from scratch.
If you copy an existing template that is not based on the DOM API default Word
template, apply any standard Word styles such as Title, Heading 1, TOC 1, List 1,
Emphasis, etc. to an element in the template. You can apply the styles to placeholder
content and then remove the content. That process creates instances of the standard
styles in the template style sheet.
See the Word documentation for information about how to create templates and to copy
styles from one template to another.
Related Examples
•
“Add Holes in a Microsoft Word Template” on page 11-112
•
“Modify Styles in a Microsoft Word Template” on page 11-117
•
“Create an HTML Template” on page 11-122
11-111
11
Create a Report Program
Add Holes in a Microsoft Word Template
In this section...
“Display the Developer Ribbon in Word” on page 11-112
“Inline and Block Holes” on page 11-112
“Create an Inline Hole” on page 11-112
“Create a Block-Level Hole” on page 11-113
“Set Default Text Style for a Hole” on page 11-114
Display the Developer Ribbon in Word
To work with holes in a Word template, use the Word Developer ribbon. If the
Developer tab is not showing in your Word ribbon, add it to the ribbon.
1
In Word, select File > Options.
2
In the Word Options dialog box, select Customize Ribbon.
3
In the Customize the Ribbon list, select the Developer check box and click OK.
Tip If you do not see Developer check box in the list, set Customize the Ribbon to
Main Tabs.
Inline and Block Holes
The DOM API supports two types of holes: inline and block.
• An inline hole is for document elements that a paragraph element can contain:
Text, Image, LinkTarget, ExternalLink, InternalLink, CharEntity, and
AutoNumber.
• A block hole can contain the same kinds of document elements as an inline hole, as
well as Paragraph, Table, OrderedList, UnorderedList, DocumentPart, and
Group document elements.
Create an Inline Hole
1
11-112
Open the template in Word.
Add Holes in a Microsoft Word Template
2
On the Word ribbon, select the Developer tab.
3
Click Design Mode to see the hole marks with the title tag after creating the hole.
4
Position the Word insertion mark at the point in the paragraph where you want to
create an inline hole.
Tip If the hole is the only hole in a paragraph or is at the end of a paragraph:
a
Add several blank spaces at the end of the paragraph.
b
Insert the hole before the spaces.
c
Delete the extra spaces.
5
Click the Rich Text Control button
insertion point.
6
Click the Properties button.
7
In the dialog box, in the Title field enter an ID for the hole and in Tag field enter
Hole. Click OK. The hole ID appears on the rich text control.
. Word inserts a rich text control at the
Create a Block-Level Hole
Creating a block-level hole in a Word document is essentially the same as creating an
inline hole. The main difference is that rich text content control must contain an (empty)
paragraph instead of residing in a paragraph.
1
Open the template in the Word editor.
2
On the Word tool ribbon, select the Developer ribbon.
3
Click Design Mode to see the hole marks with the title tag after creating the hole.
4
Create an empty paragraph at the point where you want to create a block-level hole.
If you are at the end of a document, create a second empty paragraph.
5
Select the empty paragraph.
6
Select the Rich Text Control button
insertion point.
7
Click the Properties button.
8
In the dialog box, in the Title field enter an ID for the hole and in Tag field enter
Hole. Click OK. The hole ID appears on the rich text control.
. Word inserts a rich text control at the
11-113
11
Create a Report Program
Set Default Text Style for a Hole
Your template can specify the name of a default style to use to format Text and
Paragraph objects appended to a hole. If such an object does not specify a style name,
the DOM API sets its StyleName property to the name of the default style, which must
be a character or linked character and paragraph style defined in the template. Defining
a default hole style eliminates the need to format hole content programmatically.
1
Open the template in Word.
2
In the Word ribbon, select the Developer tab.
3
Click the hole whose default style name you want to specify.
This step assumes that you have already created the hole. If have not create a hole,
see “Inline and Block Holes” on page 11-112.
4
In the Insert tab, select the Quick Parts
button.
5
In the Quick Parts Gallery, select the part template that contains the hole (for
example, rgChapter).
6
Right-click in the text area of the hole whose default text style you want to specify.
For example, in rgChapter, right-click in the rgChapterTitle hole.
7
Select Properties.
8
In the Content Control Properties dialog box, select the Use a style to format text
typed into the empty control check box.
9
From the Style list, select a style to use an existing style or select New Style to
create a new style to use as the default style and click OK.
10 Select the part template and click the Quick Parts button.
11 Click Save Selection to Quick Part Gallery.
11-114
Add Holes in a Microsoft Word Template
12 In the Create New Building Block dialog box, set Name to the part template name
(for example, rgChapter) and the Category to mlreportgen. Click OK.
13 Save and close the template.
11-115
11
Create a Report Program
Related Examples
11-116
•
“Modify Styles in a Microsoft Word Template” on page 11-117
•
“Create an HTML Template” on page 11-122
•
“Create and Format Tables” on page 11-58
Modify Styles in a Microsoft Word Template
Modify Styles in a Microsoft Word Template
In this section...
“Edit Styles in a Word Template” on page 11-117
“Add Styles to a Word Template” on page 11-118
Edit Styles in a Word Template
You can customize or add format styles in a custom Word template.
1
In Word, open the Styles dialog box.
2
In the Style dialog box, click the Manage Styles button.
11-117
11
Create a Report Program
3
In the Manage Styles dialog box, click Modify. The Modify Style dialog box appears.
4
In the Modify Style dialog box, change any of the style definitions. For example, you
could change the font family, font size, indentation, etc. To save your changes, click
OK and close the dialog box.
5
In Word, save and close the template.
For more information about using Word styles, see the Microsoft Word documentation.
Add Styles to a Word Template
To add a new style to a template:
1
11-118
In Word, open the Styles dialog box.
Modify Styles in a Microsoft Word Template
2
In the Style dialog box, click the Manage Styles button.
11-119
11
Create a Report Program
11-120
3
If applicable, select an existing style to use as a starting point for the new style.
4
Click the New Style button.
Modify Styles in a Microsoft Word Template
5
Specify a name for the new style and define the style characteristics. To save the new
style definition, click OK and close the dialog box.
6
In Word, save and close the template.
Related Examples
•
“Add Holes in a Microsoft Word Template” on page 11-112
•
“Create an HTML Template” on page 11-122
11-121
11
Create a Report Program
Create an HTML Template
Use one of these approaches to create an HTML template for generating a report.
• Use mlreportgen.dom.Document.createTemplate to create a copy of the DOM
API default HTML template that you can then customize. For example:
mlreportgen.dom.Document.createTemplate('mytemplate','html');
• Use an existing HTML template (for example, a report template for your
organization) and customize the template to use with the DOM API.
• Create an HTML template from scratch.
Edit a Zipped HTML Template
To edit a zipped HTML template, unzip it into a subfolder of the current folder, using the
unzipTemplate function. For example, to unzip files for a template called mytemplate:
unzipTemplate('mytemplate')
To repackage a template after you edit it, use the zipTemplate function. For example,
to package the mytemplate.htmx template in a subfolder called mytemplate, in the
current folder:
zipTemplate('mytemplate.htmtx')
If you do not want to use the current folder, you can specify a path with the
unzipTemplate and zipTemplate functions.
See Also
Functions
unzipTemplate | zipTemplate
Classes
mlreportgen.dom.Document
Related Examples
11-122
•
“Add Holes in an HTML Template” on page 11-124
•
“Modify Styles in an HTML Template” on page 11-127
Create an HTML Template
•
“Create a Microsoft Word Template” on page 11-111
11-123
11
Create a Report Program
Add Holes in an HTML Template
In this section...
“Inline and Block Holes” on page 11-124
“Create an Inline Hole” on page 11-124
“Create a Block Hole” on page 11-125
Template holes are places in a template that a report script fills with generated content,
supporting a forms-based report.
Inline and Block Holes
The DOM API supports two types of holes: inline and block.
• An inline hole is for document elements that a paragraph element can contain: Text,
Image, LinkTarget, ExternalLink, InternalLink, CharEntity, AutoNumber.
• A block hole can contain a Paragraph, Table, OrderedList, UnorderedList,
DocumentPart, and Group.
Create an Inline Hole
1
Unzip the template using the unzipTemplate command.
2
Open the root.html or report.html document of the template in an HTML or
text editor.
3
Place the insertion point in the paragraph where you want to create a hole.
4
Add code that uses this pattern:
<p>
<span>
<div class="Hole" data-default-hole-style-name="STYLE_NAME"
data-hole-id="HOLEID">
<span class="HoleId">HOLEID</span>
<span class="HoleDesc">HOLE_DESCRIPTION</span>
</div>
</span>
</p>
11-124
Add Holes in an HTML Template
Replace STYLE_NAME with the name of a default text (HTML span element) style to
use for formatting Text objects appended to this hole. If a Text object appended to
this hole does not specify a style name, the DOM API sets the text object StyleName
property to the default style name. The style must be defined in the style sheet of the
template. Defining in the template a default text style for hole content eliminates the
need to format hole content programmatically.
Set HOLEID to the ID of the hole, and use HOLE_DESCRIPTION to describe the hole.
5
Zip the template using the zipTemplate command.
Templates based on the DOM API default HTML template contain a style sheet for holes
that highlights the hole IDs when you display the template in a browser.
Create a Block Hole
1
Unzip the template using the unzipTemplate command.
2
Open the report.html document of the template in an HTML or text editor.
3
Position the insertion point at the desired location for the hole. You cannot set he
insertion point inside a paragraph.
4
Add code that uses this pattern:
<div>
<span>
<div class="Hole" data-default-hole-style-name="STYLE_NAME"
data-hole-id="HOLEID">
<span class="HoleId">HOLEID</span>
<span class="HoleDesc">HOLE_DESCRIPTION</span>
</div>
</span>
</div>
Replace STYLE with the name of a default paragraph (HTML p element) style to
use for formatting text content appended to this hole. If you do not specify a style
name for a Text object appended to this hole, the DOM API sets the text object
StyleName property to the default style name. The template style sheet must define
the default style. Defining a default paragraph style for hole content eliminates the
need to format hole content programmatically.
Set HOLEID to the ID of the hole, and use HOLE_DESCRIPTION to describe the hole.
11-125
11
Create a Report Program
5
Zip the template using the zipTemplate command.
See Also
Functions
unzipTemplate | zipTemplate
Related Examples
11-126
•
“Modify Styles in an HTML Template” on page 11-127
•
“Create a Microsoft Word Template” on page 11-111
Modify Styles in an HTML Template
Modify Styles in an HTML Template
You can customize or add format styles in a custom HTML template.
1
In a text or HTML editor, open the TEMPLATEROOT/Stylesheet/root.css file.
2
In the Properties pane, click Open stylesheet.
3
In a text or HTML editor, edit the cascading style sheet (CSS).
For information about editing a cascading style sheet, see documentation such as the
W3Schools.com CSS tutorial.
4
Save the style sheet.
Related Examples
•
“Add Holes in an HTML Template” on page 11-124
•
“Create a Microsoft Word Template” on page 11-111
11-127
11
Create a Report Program
Create Microsoft Word Page Layout Sections
In this section...
“Define Page Layouts in a Template” on page 11-128
“Navigate Template-Defined Sections” on page 11-128
“Create Sections Programmatically” on page 11-129
You can divide a Word document into one or more sections, each with its own page
layout. Page layout includes page margins, page orientation, and headers and footers.
Define Page Layouts in a Template
Every Word template has at least one page layout section. You can use Word to create as
many additional sections as you need. For example, you may want to create in the main
template of a report sections for your report's title page, table of contents, and chapters.
See the Word documentation for information on how to create page layout sections in a
Word template.
Navigate Template-Defined Sections
When you open a Document or DocumentPart object in a report program, the DOM API
creates a hole and an associated DOCXSection property object for each section defined in
the document or document part template. The hole ID for the first section is #start. The
hole ID for the second section is sect2, and so on.
You can use the moveToNextHole function to move from section to section and from hole
to hole within a section. At each section hole, the DOM API sets a document or document
part CurrentDOCXSection property to the DOCXSection object associated with that
object. The DOCXSection object reflects the properties of the current section, as defined
in the template. For example, if you have defined the page orientation of that section to
be portrait, the page orientation is set as portrait in the current DOCXSection object.
You can change the template-defined section properties programmatically. For example,
the page orientation of the DOM default Word template is portrait. This example shows
how to change the orientation to landscape to accommodate wide tables. The code swaps
the height and width of the page to reflect the new page orientation.
import mlreportgen.dom.*
11-128
Create Microsoft Word Page Layout Sections
rpt = Document('test','docx');
open(rpt);
sect = rpt.CurrentDOCXSection;
pageSize = sect.PageSize;
pageSize.Orientation = 'landscape';
saveHeight = pageSize.Height;
pageSize.Height = pageSize.Width;
pageSize.Width = saveHeight;
table = append(rpt,magic(22));
table.Border = 'solid';
table.ColSep = 'solid';
table.RowSep = 'solid';
close(rpt);
rptview(rpt.OutputPath);
Create Sections Programmatically
You can use the append function of a Document or DocumentPart to create sections
programmatically. To use the append function to add a section to a report, use this
append syntax:
paraObj = append(rptObj,paraObj,docxSectionObj)
This use of the append function appends a paragraph to the report as the last paragraph
of the current section and then starts a new section whose properties are defined by a
DOCXSection object. For example, this script adds a landscape section to a report to
accommodate a large magic square.
import mlreportgen.dom.*
rpt = Document('test','docx');
append(rpt,Heading(1,'Magic Square Report','Heading 1'));
sect = DOCXSection;
sect.PageSize.Orientation = 'landscape';
sect.PageSize.Height = '8.5in';
sect.PageSize.Width = '11in';
append(rpt,Paragraph('The next page shows magic square.'),sect);
11-129
11
Create a Report Program
table = append(rpt,magic(22));
table.Border = 'solid';
table.ColSep = 'solid';
table.RowSep = 'solid';
close(rpt);
rptview(rpt.OutputPath);
See Also
Classes
mlreportgen.dom.DOCXPageMargins | mlreportgen.dom.DOCXPageSize |
mlreportgen.dom.DOCXSection
Related Examples
•
11-130
“Create a Microsoft Word Template” on page 11-111
Create Page Footers and Headers
Create Page Footers and Headers
In this section...
“Create Page Headers and Footers in a Template” on page 11-131
“Create Page Headers and Footers Programmatically” on page 11-133
You can create as many as three page headers and three page footers for a Word report
section:
• One for the first page of the section
• One for even pages
• One for odd pages
You can create report page headers and footers programmatically or in the template used
to create a report or report part. You can append content to both template-defined and
programmatically defined headers and footers.
Create Page Headers and Footers in a Template
You can use Word to create page headers and footers in the main template of a report.
For information on creating headers and footers, see the Word documentation.
When you open a report, the DOM API:
1
Reads the headers and footers from the template and converts them to
DOCXPageHeader and DOCXPageFooter objects, respectively
2
Associates the headers and footer objects with the DOCXSection object that defines
the properties of the section that contains the headers and footers
3
Adds the headers and footers to your report as your code navigates the sections
defined by the template
As your report generation program navigates the sections, it can append content to the
template-defined headers and footers.
Access Template-Defined Headers and Footers
To append content to a template-defined header or footer, you need to access it. Use the
CurrentDOCXSection property of a Document or DocumentPart object to access the
11-131
11
Create a Report Program
template-defined headers and footers for the current section of a document or document
part.
The value of the CurrentDOCXSection property is a DOCXSection object whose
PageHeaders and PageFooters properties contain a cell array of DOCXPageHeader
and DOCXPageFooter objects corresponding to the template-defined headers and footers
of the current section. The header cell array can contain as many as three header objects,
depending on how many of the possible types of headers (first page, even page, odd page)
you define for the section. The footers cell array similarly can contain as many as three
footer objects. The objects can appear in any order in the cell array. Thus, to access a
header or footer of a particular type, search the cell array to find the one you want to
access.
Append Content to a Template-Defined Header or Footer
You can use the DOM API to append content to a template-defined header or footer
that appears on every page in a section. To append content to a header or footer in the
current section of a document or document part, first use the document or document part
CurrentDOCXSection property to access the DOCXPagerHeader or DOCXPageFooter
object. Then use the append method of a DOCXPageHeader or DOCXPageFooter object
to append content to the header or footer. Because header and footer objects are a kind
of document part object, you can append any kind of content to a page header or footer
that you can append to a document part, for example, images and tables as well as
paragraphs.
You can use holes in the header and footers of your main template to control the
positioning of content that you append to the headers and footers. For example, this
script appends today's date to a hole named Date on the first template-defined page
header of the first section of a report. This example assumes that the Word template
MyReportTemplate has one section that defines a first page, odd page, and even page
header and footer.
import mlreportgen.dom.*;
d = Document('MyReport','docx','MyReportTemplate');
open(d);
sect = d.CurrentDOCXSection;
for i = 1:numel(sect.PageHeaders)
if strcmpi(sect.PageHeaders(i).PageType,'first')
firstPageHeader = sect.PageHeaders(i);
while ~strcmp(firstPageHeader.CurrentHoleId,'#end#')
11-132
Create Page Footers and Headers
switch firstPageHeader.CurrentHoleId
case 'Date'
append(firstPageHeader,date);
end
moveToNextHole(firstPageHeader);
end
break;
end
end
close(d);
rptview(d.OutputPath);
Generate Header and Footer Content That Varies from Page to Page
You cannot programmatically append to headers and footers content that varies from
page to page, such as page numbers or running heads. To create content that varies, use
Word fields, which enable automatic content generation. For example, to include a page
number on each page of a section of your report, insert a page number field in the report
template in the page footer of a section. For more information, see the Microsoft Word
documentation.
Create Page Headers and Footers Programmatically
Perform these steps to create programmatically a page header or footer in the current
section of a report.
1
Use the DOCXPageHeader or DOCXPageFooter constructor to create a page header
or footer of the desired type (first page, odd page, even page, or odd and even page)
based on a template that defines template form (the fixed content and holes for
variable content).
2
Fill the holes in the header or footer with content.
3
Insert the header or footer in the array of page headers or footers of the current
DOCXSection object.
This script creates a first page header from a template stored in the document part
template library of a report.
import mlreportgen.dom.*;
d = Document('MyReport','docx','MyReportTemplate');
open(d);
11-133
11
Create a Report Program
pageHeaders(1) = DOCXPageHeader('first',d,'FirstPageHeader');
while ~strcmp(pageHeaders(1).CurrentHoleId,'#end#')
switch pageHeaders(1).CurrentHoleId
case 'Date'
append(pageHeaders(1),date);
end
moveToNextHole(pageHeaders(1));
end
d.CurrentDOCXSection.PageHeaders = pageHeaders;
close(d);
rptview(d.OutputPath);
See Also
Functions
mlreportgen.dom.Document.createTemplate
Classes
mlreportgen.dom.Document | mlreportgen.dom.DocumentPart |
mlreportgen.dom.DOCXPageFooter | mlreportgen.dom.DOCXPageHeader |
mlreportgen.dom.DOCXSection
Related Examples
11-134
•
“Create a Microsoft Word Template” on page 11-111
•
“Create an HTML Template” on page 11-122
12
Programmatic PowerPoint
Presentation Creation
• “Create a Presentation Program” on page 12-2
• “Create PPT Objects” on page 12-8
• “Import the PPT API Package” on page 12-11
• “Get and Set PPT Object Properties” on page 12-12
• “Create a Presentation Object to Hold Content” on page 12-14
• “Generate a Presentation” on page 12-15
• “Display Presentation Generation Messages” on page 12-16
• “Presentation Formatting Approaches” on page 12-20
• “Presentation Format Inheritance” on page 12-24
• “Set Up a PowerPoint Template” on page 12-26
• “Access PowerPoint Template Elements” on page 12-37
• “Define a Style Using Format Objects” on page 12-45
• “Use Format Properties” on page 12-47
• “Update Presentation Content Programmatically” on page 12-50
• “Create a Presentation Programmatically” on page 12-61
• “Add Slides” on page 12-73
• “Add and Replace Presentation Content” on page 12-76
• “Create and Format Text” on page 12-83
• “Create and Format Paragraphs” on page 12-86
• “Create and Format Tables” on page 12-89
• “Create and Format Pictures” on page 12-94
• “Create and Format Links” on page 12-96
12
Programmatic PowerPoint Presentation Creation
Create a Presentation Program
In this section...
“PPT API Programs” on page 12-3
“Two Ways to Use the PPT API” on page 12-4
“PPT API Applications and PowerPoint Templates” on page 12-5
“Template Elements” on page 12-5
You can use the MATLAB API for PowerPoint® (PPT API) to update and create
PowerPoint presentations programmatically. For example, this MATLAB script creates a
presentation that has a title page and one content slide with a bulleted list.
import mlreportgen.ppt.*;
slidesFile = 'mySlides.pptx';
slides = Presentation(slidesFile);
slide1 = add(slides,'Title Slide');
replace(slide1,'Title','My Presentation');
replace(slide1,'Subtitle','Create a Presentation Program');
slide2 = add(slides,'Title and Content');
para = Paragraph('First Content Slide');
para.FontColor = 'blue';
replace(slide2,'Title',para);
replace(slide2,'Content',{'First item','Second item','Third item'});
close(slides);
After you create the presentation, which his named MySlides.pptx, you can open it. On
a Windows platform, you can open the presentation in MATLAB:
if ispc
winopen(slidesFile);
end
The generated presentation MySlides.pptx includes these two slides.
12-2
Create a Presentation Program
PPT API Programs
PPT API programs generally include code that:
• Imports the mlreportgen.ppt API package. Include an import statement. To
avoid including the package name when you invoke PPT API object constructors and
method, import the package.
import mlreportgen.ppt.*;
• Creates a Presentation object to:
• Hold the presentation contents
12-3
12
Programmatic PowerPoint Presentation Creation
• Specify the output location for the generated presentation
• Indicate the PowerPoint template
slidesFile = 'mySlides.pptx';
slides = Presentation(slidesFile);
• Adds or replaces slide content.
contents = find(slide2,'Title');
replace(contents,Paragraph('First Content Slide'));
contents = find(slide2,'Content');
datePara = Paragraph('Today is ');
dateText = date;
append(datePara,dateText);
add(contents,datePara);
The PPT API replaces PowerPoint template placeholders with content defined in
the program. In the template, you can interactively add placeholders or rename
placeholders for your program to interact with.
• Closes the presentation, which generates the content and formatting of the
presentation.
close(slides);
You can include code to open the presentation on Windows platforms. Use winopen with
the name of the file, which in this case is stored in the slidesFile variable.
if ispc
winopen(slidesFile);
end
To see another example of a PPT API program in MATLAB, enter population_slides.
Two Ways to Use the PPT API
You can create a PPT API program that:
• Replaces content in, or adds content to, an existing PowerPoint presentation
• Generates a complete PowerPoint presentation
12-4
Create a Presentation Program
Add Content to an Existing Presentation
To add or update content to an existing presentation without manually updating the
presentation each time content changes, use the PPT API. This approach is useful when
you want to use most of the content and formatting in an existing presentation.
• You can use the PPT API and MATLAB functions to generate content for a
presentation from MATLAB code and Simulink models.
• You can update a presentation by overwriting the presentation file or create a
separate version of the presentation with a different presentation name.
Create a Complete Presentation
To create a complete presentation when you want to use the same content using multiple
PowerPoint templates, use the PPT API.
PPT API Applications and PowerPoint Templates
The PPT API uses PowerPoint presentations as templates to generate presentations. The
template can be an empty presentation or a presentation with slides.
You can use the following as templates for a PPT API presentation:
• The default PPT API PowerPoint template
• An existing PowerPoint presentation whose content you want to update
• A PowerPoint template
You can use templates to apply formatting:
• Across a whole presentation (for example, background color of slides)
• To specific kinds of elements in a presentation (for example, the titles of slides)
You can use the PowerPoint editor or the PPT API to specify formatting for elements
of an individual slide. That formatting overrides the template formatting, but does not
affect the template or other elements in the presentation.
Template Elements
PowerPoint templates include several elements that the PPT API uses to generate a
presentation. To customize formatting defined in a template, modify one or more of these
template elements.
12-5
12
Programmatic PowerPoint Presentation Creation
PowerPoint Template Element
How the PPT API Interacts with the Template
Element
Slide masters
Applies the slide master formatting
globally to the presentation.
To edit slide masters, use the PowerPoint
software.
You cannot use the PPT API to change
global presentation formatting. You can
use the API to customize formatting on
individual slides.
Slide layouts
Adds new slides based on a slide layout.
Replaces or adds content in the locations
specified by a slide layout.
To customize the layout of slides, use
PowerPoint.
Table styles
Applies a formatting style to a table you
create with the PPT API.
Placeholders
Replaces placeholders with content. The
content you use the PPT API to replace
the placeholder must match the kind
of placeholder. The content replaces
all placeholders with the same name
throughout the presentation. To replace a
specific placeholder on a specific slide, in
the template, use one of these approaches:
• Specify a unique placeholder name.
• Search in a slide for an object name.
To access a specific placeholder, use
an index number that represents the
location of the specific placeholder.
Related Examples
•
12-6
“Create PPT Objects”
Create a Presentation Program
•
“Create a Presentation Object to Hold Content” on page 12-14
•
“Update Presentation Content Programmatically” on page 12-50
•
“Create a Presentation Programmatically” on page 12-61
12-7
12
Programmatic PowerPoint Presentation Creation
Create PPT Objects
In this section...
“PPT Objects” on page 12-8
“Use a PPT Constructor” on page 12-8
“PPT Objects Created Without Constructors” on page 12-9
PPT Objects
The PPT API consists of a hierarchical set of data structures, known as objects, that
represent a presentation and its contents. The top of the hierarchy has an object
representing the presentation. The PPT API maintains a list of objects, called the
presentation children, that represent the presentation contents (slides, paragraphs,
tables, pictures, etc.). Each child object, in turn, maintains a list of its contents. For
example, the children of a table object are its row objects, the children of a row object are
its entry objects, and so on.
The PPT API contains functions (also known as methods) to create and assemble PPT
objects, such as paragraphs and tables, and add the objects to slides.
The PPT API includes format objects, such as bold and font color objects, that you can
use to define formatting for presentation elements.
To generate a PowerPoint presentation file, use the PPT API. You can open, view, and
edit the generated presentation as you do with any other PowerPoint presentation.
Use a PPT Constructor
The PPT API includes a set of MATLAB functions, called constructors, that you use to
create PPT objects of various types.
The name of an object constructor is the name of the MATLAB class from which
the PPT API creates an object. For example, the name of the constructor for a PPT
paragraph object is mlreportgen.ppt.Paragraph. Some constructors do not require
any arguments. Other constructors can take arguments that typically specify its initial
content and properties. For example, this line creates a paragraph object p, whose initial
content is Slide 1.
12-8
Create PPT Objects
p = mlreportgen.ppt.Paragraph('Slide 1');
A constructor returns a handle to the object it creates. Assigning the handle to a variable
allows you to append content to the object or set its properties. For example, this code
appends content to the paragraph object p created in the previous example.
append(p,'-- In the Beginning');
You can assign an object handle to multiple variables and hence access the same object
via multiple variables.
PPT Objects Created Without Constructors
You can use some PPT API functions to create PPT objects without your code including a
constructor. For example, to create a slide, you add a slide layout to a presentation. You
do not include an mlreportgen.ppt.Slide constructor. For example, this code uses an
add method for the mlreportgen.ppt.Presentation object slides. The add method
creates a slide1 object based on the Title Slide slide layout, which is in the default
PPT API PowerPoint template.
import mlreportgen.ppt.*;
slides = Presentation('MySlides');
slide1 = add(slides,'Title Slide')
slide1 =
Slide with properties:
Layout:
SlideMaster:
Name:
Style:
Children:
Parent:
Tag:
Id:
'Title Slide'
'Office Theme'
''
[]
[1x2 mlreportgen.ppt.TextBoxPlaceholder]
[1x1 mlreportgen.ppt.Presentation]
'ppt.Slide:16'
'16'
See Also
Functions
mlreportgen.ppt.Presentation.add
12-9
12
Programmatic PowerPoint Presentation Creation
Classes
mlreportgen.ppt.Presentation | mlreportgen.ppt.Slide
Related Examples
12-10
•
“Import the PPT API Package”
•
“Create a Presentation Object to Hold Content” on page 12-14
Import the PPT API Package
Import the PPT API Package
All PPT class names, and hence constructor names, include the prefix
mlreportgen.ppt. To avoid the need to include the prefix in your code, insert this
statement at the beginning of a PPT API program.
import mlreportgen.ppt.*;
Examples that refer to PPT API objects and functions without the mlreportgen.ppt
prefix assume that you have already imported the PPT API package.
Related Examples
•
“Create PPT Objects” on page 12-8
•
“Get and Set PPT Object Properties” on page 12-12
•
“Create a Presentation Program” on page 12-2
12-11
12
Programmatic PowerPoint Presentation Creation
Get and Set PPT Object Properties
Most PPT objects have properties that describe the object. For example, Paragraph
objects have properties such as Bold, FontColor, and Level. You can set the value of
most object properties.
To get or set the property of PPT object, use dot notation:
• Append a period to the name of a variable that references the object.
• Add the property name after the period.
For example, these lines set the font color of a paragraph referenced by p to green.
p = Paragraph('Hello World')
p =
Paragraph with properties:
Bold:
FontColor:
Italic:
Strike:
Subscript:
Superscript:
Underline:
Level:
Style:
Children:
Parent:
Tag:
Id:
[]
[]
[]
[]
[]
[]
[]
[]
[]
[1x1 mlreportgen.ppt.Text]
[]
'ppt.Paragraph:1534'
'1534'
p.FontColor = 'green';
This code displays the properties of a child object of paragraph p. The constructor for p
created a child text object from the string 'Hello World'.
p.Children
ans =
Text with properties:
12-12
Get and Set PPT Object Properties
Content:
Bold:
FontColor:
Italic:
Strike:
Subscript:
Superscript:
Underline:
Style:
Children:
Parent:
Tag:
Id:
'Hello World'
[]
[]
[]
[]
[]
[]
[]
[]
[]
[1x1 mlreportgen.ppt.Paragraph]
'ppt.Text:1535'
'1535'
Related Examples
•
“Use Format Properties” on page 12-47
•
“Create PPT Objects” on page 12-8
More About
•
“Presentation Formatting Approaches” on page 12-20
12-13
12
Programmatic PowerPoint Presentation Creation
Create a Presentation Object to Hold Content
Every PPT API program must create an mlreportgen.ppt.Presentation
object to hold presentation content. To create a presentation object, use the
mlreportgen.ppt.Presentation constructor.
If you use the constructor without arguments, the PPT API creates a presentation named
Untitled.pptx in the current folder. The presentation uses the default PPT API
PowerPoint template.
You can specify the file system path of the presentation as the first argument of the
constructor.
For the second argument of the constructor, you can specify a PowerPoint template to
use. This Presentation constructor creates a presentation called myPresentation in
the current folder, using a PowerPoint template called CompanyTemplate.pptx.
pres = Presentation('myPresentation','CompanyTemplate.pptx');
If the template you use is an existing presentation that includes content, the new
presentation that the PPT API generates includes the content in that presentation. You
can replace content from the template using the PPT API. To replace some of the content
in an existing presentation but maintain leave the rest, use the presentation as the
template for the Presentation object you create.
When you create a complete presentation using the PPT API, use an empty presentation
that has no slides or only a few slides.
See Also
mlreportgen.ppt.Presentation
Related Examples
•
“Create a Presentation Program” on page 12-2
•
“Create PPT Objects” on page 12-8
•
“Generate a Presentation” on page 12-15
More About
•
12-14
“Access PowerPoint Template Elements” on page 12-37
Generate a Presentation
Generate a Presentation
To generate a PowerPoint presentation from your PPT API program, use the API to close
the presentation. For example, to generate a presentation whose Presentation object is
slides:
close(slides);
When you generate a presentation, it overwrites the previous version of that presentation
file. Closing a presentation creates or overwrites a .pptx file in the path that you specify
in the Presentation object constructor. For example, closing this presentation creates a
MyPresentation.pptx file in the current folder:
import mlreportgen.ppt.*;
slides = Presentation('MyPresentation');
add(slides,'Title and Content');
close(slides);
Note: If the presentation (.pptx) file is already open in PowerPoint, interactively close
the PowerPoint presentation file before you generate the presentation using the PPT API
program.
Related Examples
•
“Display Presentation Generation Messages” on page 12-16
12-15
12
Programmatic PowerPoint Presentation Creation
Display Presentation Generation Messages
In this section...
“Presentation Generation Messages” on page 12-16
“Display PPT Default Messages” on page 12-16
“Create and Display a Progress Message” on page 12-18
Presentation Generation Messages
The PPT API includes a set of messages that can display when you generate a
PowerPoint presentation. The messages are triggered every time a presentation element
is created or appended during presentation generation.
You can define additional messages to display while presentation generates. The PPT
API provides these classes for defining messages:
• ProgressMessage
• DebugMessage
• WarningMessage
• ErrorMessage
The PPT API provides additional classes for handling presentation message dispatching
and display. It uses MATLAB events and listeners to dispatch messages. A message is
dispatched based on event data for a specified PPT object. For an introduction to events
and listeners, see “Events and Listeners — Concepts”.
Note: When you create a message dispatcher, the PPT API keeps the dispatcher until
the end of the current MATLAB session. To avoid duplicate reporting of message objects
during a MATLAB session, delete message event listeners.
Display PPT Default Messages
This example shows how to display the default PPT debug messages. Use a similar
approach for displaying other kinds of PPT presentation messages.
12-16
Display Presentation Generation Messages
1
Create a message dispatcher, using the MessageDispatcher.getTheDispatcher
method. Use the same dispatcher for all messages.
dispatcher = MessageDispatcher.getTheDispatcher;
dispatcher.Filter.DebugMessagesPass = true;
2
To specify to display debug messages, use the MessageDispatcher.Filter
property.
dispatcher.Filter.DebugMessagesPass = true;
3
Add a listener using the MATLAB addlistener function. Specify the dispatcher
object, the source and event data, and a disp function that specifies the event data
and format for the message.
l = addlistener(dispatcher,'Message', ...
@(src, evtdata) disp(evtdata.Message.formatAsText));
4
Place code that deletes the listener after the code that generates the presentation.
delete(l);
This presentation displays debug messages.
import mlreportgen.ppt.*;
dispatcher = MessageDispatcher.getTheDispatcher;
dispatcher.Filter.DebugMessagesPass = true;
l = addlistener(dispatcher,'Message', ...
@(src, evtdata) disp(evtdata.Message.formatAsText));
slides = Presentation('myMessagePresentation');
titleSlide = add(slides,'Title and Content');
p = Paragraph('Hello World:');
p.Style = {Bold(true)};
t = Text(' How are you?');
t.Bold = false;
append(p,t);
add(titleSlide,'Content',p);
close(slides);
12-17
12
Programmatic PowerPoint Presentation Creation
delete(l);
Create and Display a Progress Message
This example shows how to create and dispatch a progress message. You can use a
similar approach for other kinds of messages, such as warnings.
1
Create a message dispatcher.
dispatcher = MessageDispatcher.getTheDispatcher;
2
Add a listener using the MATLAB addlistener function.
l = addlistener(dispatcher,'Message', ...
@(src, evtdata) disp(evtdata.Message.formatAsText));
3
Dispatch the message, using the Message.dispatch method. Specify the dispatcher
object and the message to dispatch. Here the message is a debug message called
firstSlide, and the Presentation object slides is the source of the message.
dispatch(dispatcher,ProgressMessage('firstSlide',slides));
4
Place code that deletes the listener after the code that generates the presentation.
delete(l);
This presentation uses this progress message.
import mlreportgen.ppt.*;
pre = Presentation('myPresentation.pptx');
dispatcher = MessageDispatcher.getTheDispatcher;
l = addlistener(dispatcher,'Message', ...
@(src, evtdata) disp(evtdata.Message.formatAsText));
dispatch(dispatcher,ProgressMessage('starting presentation',pre));
open(pre);
titleText = Text('This is a Title');
titleText.Style = {Bold};
replace(pre,'Title',titleText);
close(pre);
12-18
Display Presentation Generation Messages
delete(l);
See Also
Functions
mlreportgen.ppt.MessageDispatcher.dispatch |
mlreportgen.ppt.MessageDispatcher.getTheDispatcher
| mlreportgen.ppt.ProgressMessage.formatAsHTML
| mlreportgen.ppt.ProgressMessage.formatAsText |
mlreportgen.ppt.ProgressMessage.passesFilter
Classes
mlreportgen.ppt.DebugMessage | mlreportgen.ppt.ErrorMessage |
mlreportgen.ppt.MessageDispatcher | mlreportgen.ppt.MessageEventData
| mlreportgen.ppt.MessageFilter | mlreportgen.ppt.ProgressMessage |
mlreportgen.ppt.WarningMessage
12-19
12
Programmatic PowerPoint Presentation Creation
Presentation Formatting Approaches
In this section...
“Template Formatting” on page 12-21
“Format Objects” on page 12-21
“Format Properties” on page 12-22
“Interactive Formatting of Slide Content” on page 12-22
With the PPT API, you can use a PowerPoint template and PPT API format objects and
properties to specify the appearance of an object. The PPT API supports four approaches
for formatting elements of a presentation.
Formatting Approach
Use
Define formatting in the PowerPoint
template.
• Applying formatting globally within a
presentation
• Maintaining consistency across presentations
• Extending formatting options that the PPT
API provides
Using the PPT API, specify format
objects to define a style for a
presentation object.
• Formatting a specific presentation element
• Specifying multiple format options in one
statement
• Specifying complicated values such as
hexadecimal color values that are used
repeatedly in a program
• Extending formatting options beyond the
ones that format properties of an object
provide
• Defining a style to use with multiple objects
Using the PPT API, set format
properties of a presentation object.
• Specifying one or two basic format options for
a specific presentation object
• Extending formatting options beyond those
options that format properties of an object
provide
12-20
Presentation Formatting Approaches
Formatting Approach
Use
Specifying one or two basic format options for a
specific presentation object
In the PowerPoint software, format a
generated PPT API.
• Customizing a specific version of a generated
presentation
• Extending formatting options beyond those
options that the format objects provide
Template Formatting
Use templates for applying formatting globally:
• Across a whole presentation (for example, background color of slides)
• To specific kinds of elements in a presentation (for example, slide titles)
Using a PowerPoint template with the PPT API involves creating and formatting
template elements such as:
• Slide masters
• Slide layouts
• Placeholders
• Table styles
Using the template to define formatting offers more formatting options than the PPT API
provides. Defining formatting in the template allows you to have consistent formatting in
any PPT API presentations that use that template.
To format specific content in a specific slide, consider using one of the other approaches.
Adding special-case formatting elements in a template can make the template overly
complex.
Format Objects
You can define PPT API format objects and use them to specify a formatting style for
presentation objects. After you create a presentation object, you can define the Style
property for that object, using a cell array of format objects. For example:
p = Paragraph('Model Highlights');
12-21
12
Programmatic PowerPoint Presentation Creation
p.Style = {FontColor('red'),Bold(true)};
For many presentation objects, using format objects provides more formatting options
than the format properties of the presentation objects. Using format objects can
streamline your code: you can combine multiple formatting options in one statement and
you can apply a defined style to multiple presentation objects.
Format Properties
Use format properties of a PPT API presentation element for basic formatting of a
specific presentation object.
After you define a presentation object, you can set values for its format properties, using
dot notation. For example:
p = Paragraph('My paragraph);
p.Bold = true;
The formatting applies only to the specific object. If you want to set just one option for a
presentation element, using a format property is the simplest approach.
Interactive Formatting of Slide Content
After you generate a PPT API presentation, you can use the PowerPoint software to finetune the formatting for the presentation.
In PowerPoint, you can use all PowerPoint formatting options, including options that
you cannot specify with the PPT API, such as animation. Interactive editing of slide
content of the generated presentation allows you to customize a specific version of the
presentation without impacting future versions of the presentation.
If you use PowerPoint to customize a presentation generated using the PPT API, you lose
those customizations when you regenerate the presentation. To preserve the interactive
formatting of content if the presentation is regenerated, save the customized version of
the presentation using a different file name.
Related Examples
12-22
•
“Set Up a PowerPoint Template” on page 12-26
•
“Define a Style Using Format Objects” on page 12-45
Presentation Formatting Approaches
•
“Use Format Properties” on page 12-47
More About
•
“Presentation Format Inheritance” on page 12-24
•
“Access PowerPoint Template Elements” on page 12-37
12-23
12
Programmatic PowerPoint Presentation Creation
Presentation Format Inheritance
The PPT API allows you to use a PowerPoint template and PPT API format objects and
properties to format presentation objects. You can combine formatting approaches.
The formatting you specify in a PowerPoint template specifies the default format of
presentation content.
You can use a PPT API to format a specific presentation object. You can:
• Define format objects that you can use with a presentation object Style property.
• Specify a value for a format property of a presentation object.
You can combine formatting with the Style property and formatting with format
properties. For example:
p = Paragraph('This is a paragraph');
p.Style = {Bold(true),Underline('wavy')};
p.FontColor = 'red';
If you define the same formatting characteristic using each approach, the PPT API uses
the specification that appears later in the code. For example, this code specifies blue as
the default color for text in a paragraph:
p = Paragraph('This is a paragraph');
p.Style = {FontColor('red')};
p.FontColor = 'blue';
Several PPT API objects are hierarchical. For example:
• You can append a Text object to a Paragraph object.
• You append TableEntry objects to a TableRow object, and you can append
TableRow objects to a Table object.
The formatting for a parent object applies to all its child objects, unless the child object
specifies formatting to override the formatting of the parent object. For example:
import mlreportgen.ppt.*;
slidesFile = 'myParagraphPresentation.pptx';
slides = Presentation(slidesFile);
12-24
Presentation Format Inheritance
slide1 = add(slides,'Title and Content');
p = Paragraph('Parent default red text -- ');
p.FontColor = 'red';
t = Text('Child text object blue text');
t.FontColor = 'blue';
append(p,t);
add(slide1,'Content',p);
close(slides);
12-25
12
Programmatic PowerPoint Presentation Creation
Set Up a PowerPoint Template
In this section...
“Use Existing Presentations as Templates” on page 12-26
“Customize a Copy of the Default Template” on page 12-26
“Global Presentation Formatting Using a Slide Master” on page 12-27
“Add a Slide Master” on page 12-28
“Format a Slide Layout” on page 12-30
“Add a Slide Layout” on page 12-31
“Add a Placeholder” on page 12-32
“Change the Style for a Table” on page 12-35
Use Existing Presentations as Templates
When you use an existing PowerPoint presentation as a template for a PPT API
presentation, the content from the existing presentation appears in the PPT API
presentation. You can use the PPT API to update content in the existing presentation.
You can also programmatically change some aspects of the formatting of the content that
you are updating.
To format a PPT API presentation that you create completely programmatically, specify
an empty PowerPoint presentation as a template when you create a Presentation
object.
Customize a Copy of the Default Template
You can use the default PPT API PowerPoint template as a starting point for a custom
template.
Note: You can use a similar approach to customize a PowerPoint template other than the
default PPT API template. To do so, when you create a Presentation object, specify the
template that you want to customize.
1
12-26
In a PPT API program, create an empty Presentation object, without specifying a
template. The PPT API uses its default PowerPoint template.
Set Up a PowerPoint Template
2
Generate the presentation.
3
Open the presentation and customize the template.
4
Save the presentation with a different name from the original presentation. Use
a different name so that if the PPT program runs again, it does not overwrite the
template presentation with the default template formatting.
5
Use the presentation with the customized template as the template for a new PPT
API presentation. For example, if the customized template presentation is called
myTemplate, then use myTemplate when you create a PPT API presentation:
newPresentation = Presentation('mySecondPresentation','myTemplate');
Global Presentation Formatting Using a Slide Master
To specify formatting to apply throughout a presentation, use a slide master. The
formatting in a slide master is the default formatting for all its child slide layouts.
1
In PowerPoint, open a template or a presentation that you want to use as a template.
2
In the View tab, in the Master Views section, click Slide Master. For example,
using the default PPT API template:
12-27
12
Programmatic PowerPoint Presentation Creation
3
In a slide master, click in a placeholder. For example, in the master title slide, click
in Click to edit Master title style text and select a formatting option, such
as changing the font color to red.
4
Save the template.
Add a Slide Master
You can add a slide master to a PowerPoint template. Adding a slide master is useful for
providing different formatting for different parts of a presentation.
12-28
1
In PowerPoint, open the template.
2
In the View tab, in the Master Views section, click Slide Master.
3
In the left pane that shows the slide master and slide layouts, click after the last
slide layout.
4
Right-click and select Insert Slide Master. A new slide master appears, with a copy
of the slide layouts under it.
Set Up a PowerPoint Template
5
Format the new slide master.
6
Save the template.
12-29
12
Programmatic PowerPoint Presentation Creation
Format a Slide Layout
To specify formatting to apply to a specific kind of slide, use a slide layout.
1
In PowerPoint, open a template or a presentation that you want to use as a template.
2
In the View tab, in the Master Views section, click Slide Master.
3
Select the slide layout whose formatting you want to change. For example, in the
default PPT API PowerPoint template, click the Title and Content slide layout.
Tip To see the name of a slide layout, hover over that layout. A tooltip appears with
the name of the slide layout and the number of slides that use that slide layout.
4
12-30
In a slide master, click in a placeholder whose formatting you want to change. For
example, in the default PPT API template, in the Title and Content slide layout,
click in Click to edit Master title style. Select a formatting option, such as
Set Up a PowerPoint Template
changing the font color to red. The change applies to the title of that slide layout, but
not to the title of other slide layouts.
5
Save the template.
Add a Slide Layout
You can add a slide layout to a PowerPoint template. Adding a slide layout is useful for
providing different layouts for slide content that does not fit well into an existing slide
layout. Also, add a slide layout for specifying different formatting for multiple slides in
the presentation, without affecting current slide layouts.
1
In PowerPoint, open the template that you want to modify.
2
In the View tab, in the Master Views section, click Slide Master.
3
In a slide layout, right-click and select Insert Slide Master. A new slide layout
appears, with a title placeholder.
12-31
12
Programmatic PowerPoint Presentation Creation
Tip To create a slide layout based on an existing slide layout, right-click in the slide
layout that you want to base the layout on. Then select Duplicate Layout.
4
Customize the layout. For example, you can change the font for an existing
placeholder or add a placeholder, such as a table placeholder. You can interactively
set the location and size of the table placeholder. To remove or add title and footers,
use the Title and Footers check boxes in the ribbon.
5
Save the template.
Add a Placeholder
You can add any type of placeholder to any slide layout. However, to replace placeholder
content using the PPT API, you can replace this subset of placeholders:
• Content
• Text
• Picture
• Table
12-32
Set Up a PowerPoint Template
Add a placeholder:
1
In PowerPoint, open the template that you want to modify.
2
In the View tab, in the Master Views section, click Slide Master.
3
Select the slide layout to add the placeholder to.
4
Click Insert Placeholder and then the type of placeholder. For example, in the
default PPT API template you can add a Table placeholder to the Blank slide
layout.
12-33
12
Programmatic PowerPoint Presentation Creation
12-34
5
In the slide layout, position and size the placeholder.
6
Name the placeholders that you want to use when you add or replace content with
the PPT API.
7
Save the template.
Set Up a PowerPoint Template
Change the Style for a Table
You can change the style used for a table in a slide layout.
1
In PowerPoint, open the template that you want to modify.
2
In the View tab, in the Master Views section, click Slide Master.
3
Find a slide layout that contains a table placeholder. For example, in the default
PPT API template, the Title and Table slide layout has a table placeholder.
If there is no slide with a table placeholder, you can add a table placeholder. For
details, see “Add a Placeholder” on page 12-32.
4
Click in the table placeholder. On the Insert tab, click Table. An empty table
appears.
5
Position the table in the slide layout. To move the table, hover the cursor over the top
left corner of the table until you see a cursor with intersecting arrows. Drag the table
to where you want it to appear.
6
In the Table Styles set of table styles, select a style. Then use PowerPoint table
formatting tools to customize the table.
12-35
12
Programmatic PowerPoint Presentation Creation
7
Save the template.
Related Examples
•
“Access PowerPoint Template Elements” on page 12-37
More About
•
12-36
“Presentation Formatting Approaches” on page 12-20
Access PowerPoint Template Elements
Access PowerPoint Template Elements
In this section...
“PPT API Applications and PowerPoint Templates” on page 12-5
“Template Elements” on page 12-5
“Get Slide Master Names” on page 12-39
“Get Slide Layout Names” on page 12-40
“Get Placeholder and Content Object Names” on page 12-41
“Get Table Style Names” on page 12-42
PPT API Applications and PowerPoint Templates
The PPT API uses PowerPoint presentations as templates to generate presentations. The
template can be an empty presentation or a presentation with slides.
You can use the following as templates for a PPT API presentation:
• The default PPT API PowerPoint template
• An existing PowerPoint presentation whose content you want to update
• A PowerPoint template
You can use templates to apply formatting:
• Across a whole presentation (for example, background color of slides)
• To specific kinds of elements in a presentation (for example, the titles of slides)
You can use the PowerPoint editor or the PPT API to specify formatting for elements
of an individual slide. That formatting overrides the template formatting, but does not
affect the template or other elements in the presentation.
Template Elements
PowerPoint templates include several elements that the PPT API uses to generate a
presentation. To customize formatting defined in a template, modify one or more of these
template elements.
12-37
12
Programmatic PowerPoint Presentation Creation
PowerPoint Template Element
How the PPT API Interacts with the Template
Element
Slide masters
Applies the slide master formatting
globally to the presentation.
To edit slide masters, use the PowerPoint
software.
You cannot use the PPT API to change
global presentation formatting. You can
use the API to customize formatting on
individual slides.
Slide layouts
Adds new slides based on a slide layout.
Replaces or adds content in the locations
specified by a slide layout.
To customize the layout of slides, use
PowerPoint.
Table styles
Applies a formatting style to a table you
create with the PPT API.
Placeholders
Replaces placeholders with content. The
content you use the PPT API to replace
the placeholder must match the kind
of placeholder. The content replaces
all placeholders with the same name
throughout the presentation. To replace a
specific placeholder on a specific slide, in
the template, use one of these approaches:
• Specify a unique placeholder name.
• Search in a slide for an object name.
To access a specific placeholder, use
an index number that represents the
location of the specific placeholder.
12-38
Access PowerPoint Template Elements
Get Slide Master Names
A PowerPoint template can have more than one slide master. A slide master can have a
child slide layout that has the same name as a child slide layout in another slide master.
When you use the PPT API, if the template has multiple slide masters, you need to know
the name of the slide master so that you can specify the correct slide layout.
View the names of slide masters in a template using PowerPoint:
1
Select View > Slide Master.
2
In the left slide layout pane, hover over the top slide. A tooltip appears with the
name of the slide master.
3
View any other slide masters by scrolling in the pane. Slide masters are numbered
and are at the top level in the tree view.
When you use the slide master name with the PPT API, omit the words Slide Master.
To see slide master names using the PPT API, use the getMasterNames method with
an mlreportgen.ppt.Presentation object. This example uses the default PPT API
PowerPoint template, which has one slide master.
import mlreportgen.ppt.*;
slides = Presentation('myPresentation');
getMasterNames(slides);
ans =
'Office Theme'
12-39
12
Programmatic PowerPoint Presentation Creation
Get Slide Layout Names
You need to know the name of slide layouts in a PowerPoint template to use the PPT API
to add a slide.
To see the names of slide layouts in a template using PowerPoint:
1
Select View > Slide Master.
2
In the left slide layout pane, hover over a slide layout under a slide master. A tooltip
appears with the name of the slide layout.
When you use the slide master name with the PPT API, omit the word Layout.
To see slide master names using the PPT API, use the
Presentation.getLayoutNames method. You need to get the slide master name
before you get the layout names. The PPT API returns slide masters as a cell array. This
example uses the default PPT API PowerPoint template.
import mlreportgen.ppt.*;
slides = Presentation('myPresentation');
masters = getMasterNames(slides);
layouts = getLayoutNames(slides,masters{1});
layouts
Columns 1 through 5
'Title Slide' 'Title and Vertica…'
12-40
'Vertical Title an…'
'Title and Table'
'Title
Access PowerPoint Template Elements
Columns 6 through 11
'Title and Content'
'Section Header'
'Two Content'
'Comparison'
'Title Only'
Columns 12 through 13
'Content with Capt…'
'Picture with Capt…'
Get Placeholder and Content Object Names
You need to know placeholder names to use the PPT API to replace placeholders with
content.
To see the names of a placeholder in a template using PowerPoint:
1
Select View > Slide Master.
2
In the Home tab, select Select > Selection Pane.
3
4
Click in a placeholder. For example, in the PPT API default template, you can see
that the name of the content placeholder the Title and Content slide layout is
Content.
If you update content in an existing PowerPoint presentation, to you can view the name
of content objects on that slide, also use the Selection Pane. For example:
1
Create and generate a presentation with a slide that has a table.
import mlreportgen.ppt.*
12-41
'
12
Programmatic PowerPoint Presentation Creation
slidesFile = 'myTablePresentation.pptx';
slides = Presentation(slidesFile);
slide1 = add(slides,'Blank');
add(slide1,Table(magic(5)));
close(slides);
if ispc
winopen(slidesFile);
end
2
In PowerPoint, select the Selection Pane. The name of the table is a generated
string of characters. You can rename that object and use that new name with the
PPT API.
Get Table Style Names
When you use the PPT API, to specify a table style other than the default, you need to
know the names of table styles in a PowerPoint template.
To see the names of table styles in a template using PowerPoint:
1
Select View > Slide Master.
2
In a slide layout that has a table, click Table (or anywhere in that placeholder). On
the Insert tab, click Table.
3
Create an empty table in the slide layout.
A panel of Table Styles appears. To see the name of a table style, hover over the
table style image.
12-42
Access PowerPoint Template Elements
To see table style names using the PPT API, use the getTableStyleNames method with
an mlreportgen.ppt.Presentation object. The output in this example shows just the
first two of many table styles in the default template.
import mlreportgen.ppt.*
slides = Presentation('myPlaceholderPresentation');
getTableStyleNames(slides)
12-43
12
Programmatic PowerPoint Presentation Creation
ans =
'Medium Style 2 - Accent 1'
'Light Style 1'
'{5C22544A-7EE6-4342-B048-85BDC9FD1C3A}'
'{9D7B26C5-4107-4FEC-AEDC-1716B250A1EF}'
To use a table style name with the PPT API, you can use either the name string or the
numeric identifier string.
Related Examples
•
“Set Up a PowerPoint Template” on page 12-26
More About
•
12-44
“Presentation Formatting Approaches” on page 12-20
Define a Style Using Format Objects
Define a Style Using Format Objects
A format object is a MATLAB program entity that defines the properties and functions of
a specific type of presentation format, such as the weight for text (bold or regular). The
PPT API provides a set of constructors for creating several format objects, including:
• mlreportgen.ppt.Bold objects
• mlreportgen.ppt.Italic objects
• mlreportgen.ppt.Strike objects
• mlreportgen.ppt.Underline objects
• mlreportgen.ppt.FontColor objects
Most PPT API presentation element objects, such as Text objects, include a Style
property that you can set to a cell array of format objects that defines the appearance of
the object. For example, to specify the default format for text in a paragraph is red bold
text.
p = Paragraph('Model Highlights');
p.Style = {FontColor('red'),Bold(true)};
You can assign the same array of format objects to more than one PPT API presentation
element object. This allows you to create a programmatic equivalent of a template style
sheet. For example:
import mlreportgen.ppt.*;
slides = Presentation('myParaPres');
add(slides,'Title and Content');
add(slides,'Title and Content');
caution = {FontColor('red'),Bold(true)};
p1 = Paragraph('Hardware Requirements');
p1.Style = caution;
p2 = Paragraph('Software Requirements');
p2.Style = caution;
titles = find(slides,'Title');
replace(titles(1),p1);
replace(titles(2),p2);
12-45
12
Programmatic PowerPoint Presentation Creation
close(slides);
The PPT API allows you to assign any format object to any presentation object,
regardless of whether the format is appropriate for that object type. Format that are not
appropriate are ignored.
Related Examples
•
“Use Format Properties” on page 12-47
•
“Define a Style Using Format Objects” on page 12-45
•
“Set Up a PowerPoint Template” on page 12-26
More About
•
12-46
“Presentation Formatting Approaches” on page 12-20
Use Format Properties
Use Format Properties
In this section...
“Dot Notation” on page 12-47
“Get the Properties of an Object” on page 12-47
“Set the Properties of an Object” on page 12-48
Most PPT API presentation objects (such as a Paragraph object) include properties that
you can use to set the format of the content of an object.
Dot Notation
To work with PPT API object properties, you use dot notation. Using dot notation
involves specifying an object (the variable representing the object) followed by a period
and then the property name. For example, suppose that you create a Paragraph object
para1.
par1 = Paragraph('My paragraph');
To specify the Bold property for the para1 object, use:
par1.Bold = true;
Get the Properties of an Object
To display all the properties of an object that you create, use one of these approaches in
MATLAB:
• Omit the semicolon when you create the object.
• Enter the name of the object.
For example, display the properties of the Paragraph object para1.
para1 = Paragraph('My paragraph')
para1 =
Paragraph with properties:
Bold: []
12-47
12
Programmatic PowerPoint Presentation Creation
FontColor:
Italic:
Strike:
Subscript:
Superscript:
Underline:
Level:
Style:
Children:
Parent:
Tag:
Id:
[]
[]
[]
[]
[]
[]
[]
[]
[1x1 mlreportgen.ppt.Text]
[]
'ppt.Paragraph:22'
'22'
To display the value of a specific property, such as the Bold property, use dot notation,
without a semicolon.
par1 = Paragraph('My paragraph');
para.Bold
ans =
[]
Set the Properties of an Object
You can set some PPT API object properties using the object constructor. The PPT API
sets other properties. For most PPT API objects, you can change the values of properties
that you specified in the constructor. Also, you can specify values for additional
properties.
To specify a value for an object property, use dot notation. For example, to set the default
for text in the para1 paragraph to bold:
par1 = Paragraph('My paragraph');
para1.Bold = true;
For some presentation objects, you can use the Style property to specify formatting
options that are not available in the other properties of the object. For example, a
TableEntry object does not have a Bold property. However, you can specify bold as
the default for text in the TableEntry by using the Style property of the TableEntry
object.
te = tableEntry();
12-48
Use Format Properties
te.Style = {Bold(true)};
Related Examples
•
“Define a Style Using Format Objects” on page 12-45
•
“Set Up a PowerPoint Template” on page 12-26
More About
•
“Presentation Formatting Approaches” on page 12-20
12-49
12
Programmatic PowerPoint Presentation Creation
Update Presentation Content Programmatically
In this section...
“Generate the Existing Presentation” on page 12-50
“Updates to the Presentation” on page 12-52
“Set Up the Existing Presentation” on page 12-54
“Import the PPT API Package” on page 12-55
“Create the Presentation Object” on page 12-55
“Replace a Picture” on page 12-55
“Replace Text with Links” on page 12-56
“Replace a Table” on page 12-56
“Insert a New Slide” on page 12-57
“Generate and Open the Presentation” on page 12-57
“Code for myUpdatedPresentation” on page 12-58
You can use the PPT API to update content programmatically in an existing PowerPoint
presentation.
Generate the Existing Presentation
This example updates content in the PowerPoint presentation myNewPPTPresentation.
Although you create the presentation programmatically, after you generate it, the
presentation is like any other PowerPoint presentation. To generate the presentation,
click myNewPPTPresentation program and execute the code in MATLAB. The
presentation includes four slides:
12-50
Update Presentation Content Programmatically
To use the PPT API to update content in an existing PowerPoint presentation
programmatically, you:
12-51
12
Programmatic PowerPoint Presentation Creation
• Set up the PowerPoint presentation by naming content objects that you want to
replace. If you want to add new content, insert placeholders in the presentation for
that content.
• In MATLAB, import the mlreportgen.ppt PPT API package.
• Create a Presentation object that uses the existing presentation as the template for
updated version.
• Replace any existing slide content that you want to update.
• Add slides any new slides.
• Generate the presentation.
Updates to the Presentation
In this example you use the PPT API to make these changes to the
myNewPPTPresentation presentation:
• Replace the picture on the second slide.
• Replace the text on the third slide.
• Replace the table on the fourth slide.
• Insert a new slide before the slide with the plot.
Here is the updated presentation.
12-52
Update Presentation Content Programmatically
12-53
12
Programmatic PowerPoint Presentation Creation
Set Up the Existing Presentation
A PPT API program uses a PowerPoint template to generate a presentation. When you
update an existing PowerPoint presentation programmatically, use that presentation as
the template for the updated presentation. To update content in the Slide objects, use
the PPT API.
1
Open the myNewPPTPresentation presentation. In PowerPoint, click View >
Normal.
2
View the names of content objects in the slides. In the Home tab, click Select >
Selection Pane. When you click content in a slide, the Selection pane highlights
the name of the content object.
3
Rename content objects. In the PowerPoint Selection pane, click in the content
name box and replace the current name with the name you want. Use these unique
names to update content objects.
• In the second slide, change the Title object name to HistBins and the Content
object name to Histogram.
• In the third slide, change Title to RelatedFuncs. Change Content to
FuncList.
12-54
Update Presentation Content Programmatically
• In the fourth slide, change Content to ParamTable.
Import the PPT API Package
All PPT API class names include the prefix mlreportgen.ppt. To avoid the need to
include the prefix in your code, insert this statement at the beginning of a PPT API
program.
import mlreportgen.ppt.*;
Note: The import line is the first line in the example program. This example creates a
PPT API program in sections and therefore does not show the import command. To view
the complete program, click myUpdatedPresentation program.
Create the Presentation Object
Create a Presentation object. Specify:
• myUpdatedPresentation.pptx as the output file for the generated presentation.
• myNewPPTPresentation.pptx as the PowerPoint template. Use the presentation
file that you want to update as the template file.
slidesFile = 'myUpdatedPresentation.pptx';
slides = Presentation(slidesFile,'myNewPPTPresentation.pptx');
Specifying a different name for the output file preserves the original presentation. If you
want to overwrite the existing presentation, you can use the template file name as the
file name for the output file.
Replace a Picture
Change the title of the second slide. Create a Picture object to replace the existing
picture. You can use a find method with the Presentation object to find content
objects named HistBins and Histogram (the unique names you specified using
PowerPoint).
histTitle = Paragraph('Histogram with Specified Bin Edges');
replace(slides,'Histogram',histTitle);
x = randn(1000,1);
12-55
12
Programmatic PowerPoint Presentation Creation
edges = [-10 -2:0.25:2 10];
h = histogram(x,edges);
saveas(gcf,'hist_plot.png');
plotEdges = Picture('hist_plot.png');
replace(slides,'HistBins',plotEdges)
Replace Text with Links
Change the title of the third slide. Create text to replace the existing text. The text
includes links to the MathWorks online documentation. Append ExternalLink objects
to Paragraph objects, and replace the slide content using a cell array of the Paragraph
objects.
funcsTitle = Paragraph('Related Functions');
replace(slides,'RelatedFuncs',funcsTitle);
histCounts = Paragraph();
histCountsLink = ExternalLink...
('http://www.mathworks.com/help/matlab/ref/histcounts.html','histcounts');
append(histCounts,histCountsLink);
fewerbins = Paragraph();
fewerbinsLink = ExternalLink...
('http://www.mathworks.com/help/matlab/ref/fewerbins.html','fewerbins');
append(fewerbins,fewerbinsLink);
replace(slides,'FuncList',{histCounts,fewerbins});
Replace a Table
To create a table, create a Table object. In the Table constructor, you can specify a cell
array of values for the table cells. To get bold text for the top row, include Paragraph
objects as the first three elements of the cell array. Then replace the table.
long = Paragraph('Long Name');
long.Bold = true;
short = Paragraph('Short Name');
short.Bold = true;
rgb = Paragraph('RGB triplet');
rgb.Bold = true;
12-56
Update Presentation Content Programmatically
table2 = Table({long,short,rgb;'yellow','y','[1 1 0]';'green','g','[1 0 1] '});
contents = find(slides,'ParamTable');
replace(slides,'ParamTable',table2);
Insert a New Slide
You can use the PPT API to insert a new slide in an existing presentation and you can
specify the numerical location of the slide. For example, this code makes a new slide the
fifth slide in a presentation.
newSlide = add(slides,'Title and Content',5);
However, to have a slide precede a specific slide, even if later you add or remove other
slides, you can specify a reference slide. To use this approach when updating an existing
PowerPoint presentation, use the PPT API to name the reference slide. Use the name of
the reference slide when you insert a new slide.
slides.Children(2).Name = 'ReferenceSlide';
refSlide = find(slides,'ReferenceSlide');
introSlide = add(slides,'Title and Content',refSlide);
contents = find(introSlide,'Title');
replace(contents(1),'Histogram Plots');
introText = Paragraph('You can use the ');
code = Text('histogram');
code.Font = 'Courier New';
append(introText,code);
append(introText,' function to create many types of plots.');
contents = find(introSlide,'Content');
replace(contents(1),introText);
Generate and Open the Presentation
Generate the PowerPoint presentation. Use a close method with a Presentation
object.
close(slides);
Open the presentation myUpdatedPresentation.pptx file. On a Windows platform,
you can open the presentation in MATLAB:
12-57
12
Programmatic PowerPoint Presentation Creation
if ispc
winopen(slidesFile);
end
Code for myUpdatedPresentation
Here is the complete PPT API program to create the myUpdatedPresentation
presentation.
Note: This code requires that the myNewPPTPresentation.pptx file be in your current
folder. To generate that presentation, click myNewPPTPresentation program and
execute the code in MATLAB. Before you run the code for myUpdatedPresentation,
be sure that the existing presentation includes the changes described in “Set Up the
Existing Presentation” on page 12-54.
import mlreportgen.ppt.*;
slidesFile = 'myUpdatedPresentation.pptx';
slides = Presentation(slidesFile,'myNewPPTPresentation.pptx');
histTitle = Paragraph('Histogram with Specified Bin Edges');
replace(slides,'Histogram',histTitle);
x = randn(1000,1);
edges = [-10 -2:0.25:2 10];
h = histogram(x,edges);
saveas(gcf,'hist_plot.png');
plotEdges = Picture('hist_plot.png');
replace(slides,'HistBins',plotEdges)
funcsTitle = Paragraph('Related Functions');
replace(slides,'RelatedFuncs',funcsTitle);
histCounts = Paragraph();
histCountsLink = ExternalLink...
('http://www.mathworks.com/help/matlab/ref/histcounts.html','histcounts');
append(histCounts,histCountsLink);
fewerbins = Paragraph();
12-58
Update Presentation Content Programmatically
fewerbinsLink = ExternalLink...
('http://www.mathworks.com/help/matlab/ref/fewerbins.html','fewerbins');
append(fewerbins,fewerbinsLink);
replace(slides,'FuncList',{histCounts,fewerbins});
long = Paragraph('Long Name');
long.Bold = true;
short = Paragraph('Short Name');
short.Bold = true;
rgb = Paragraph('RGB triplet');
rgb.Bold = true;
table2 = Table({long,short,rgb;'yellow','y','[1 1 0]'; 'green', 'g','[1 0 1] '});
contents = find(slides,'ParamTable');
replace(slides,'ParamTable',table2);
slides.Children(2).Name = 'ReferenceSlide';
refSlide = find(slides,'ReferenceSlide');
introSlide = add(slides,'Title and Content',refSlide(1));
contents = find(introSlide,'Title')
replace(contents(1),'Histogram Plots');
introText = Paragraph('You can use the ');
code = Text('histogram ');
code.Style = {FontFamily('Courier New')};
append(introText,code);
append(introText,'function to create many types of plots.');
contents = find(introSlide,'Content');
replace(contents(1),introText);
close(slides);
if ispc
winopen(slidesFile);
end
Related Examples
•
“Create a Presentation Programmatically” on page 12-61
12-59
12
Programmatic PowerPoint Presentation Creation
12-60
•
“Set Up a PowerPoint Template” on page 12-26
•
“Access PowerPoint Template Elements” on page 12-37
•
“Add Slides” on page 12-73
•
“Create and Format Text” on page 12-83
•
“Create and Format Paragraphs” on page 12-86
•
“Create and Format Tables” on page 12-89
•
“Create and Format Pictures” on page 12-94
•
“Create and Format Links” on page 12-96
Create a Presentation Programmatically
Create a Presentation Programmatically
In this section...
“Set Up a Template” on page 12-63
“Import the PPT API Package” on page 12-65
“Create the Presentation Object” on page 12-65
“Add a Presentation Title Slide” on page 12-66
“Add a Slide with a Picture” on page 12-67
“Add a Slide with Text” on page 12-67
“Add a Slide with a Table” on page 12-68
“Generate and Open the Presentation” on page 12-69
“Code for myNewPPTPresentation” on page 12-70
This presentation example shows some common tasks involved in creating a presentation
with the PPT API. This example produces these slides:
12-61
12
Programmatic PowerPoint Presentation Creation
To use the PPT API to create a complete PowerPoint presentation programmatically,
you:
12-62
Create a Presentation Programmatically
• Set up an empty PowerPoint presentation as a template for the presentation.
• In MATLAB, import the mlreportgen.ppt PPT API package.
• Create a Presentation object that contains the presentation code.
• Add slides based on slide layouts in the template.
• Add content to the slides.
• Generate the presentation.
Tip To see another example of a PPT API program in MATLAB, enter
population_slides.
Set Up a Template
A PPT API program uses a PowerPoint presentation as a template to generate a
presentation. When you create a complete presentation programmatically, use an empty
template. If slides in the template have content (such as text or tables), the content
appears in the presentation that the PPT API program generates.
The PPT API provides a default PowerPoint template. You can use the PPT API to make
a copy of the default template, which you then can customize to use with your PPT API
program. This code creates a template called myTemplate, which is a copy of the default
PPT API template.
import mlreportgen.ppt.*
slidesFile = 'myTemplate.pptx';
slides = Presentation('myTemplate');
open(slides);
close(slides);
Open the myTemplate.pptx file. On a Windows platform, you can open the presentation
in MATLAB:
if ispc
winopen(slidesFile);
end
To see template elements, such as the slide master and slide layouts, in PowerPoint
View pane, click Slide Master.
12-63
12
Programmatic PowerPoint Presentation Creation
Use PowerPoint interactively to customize the template. To set default formatting for the
whole presentation, customize a slide master. To set default formatting for a specific kind
of slide, customize a slide layout. For example, you can use the slide master to set up the
template to use bold text for slide titles.
12-64
1
In the slide layout, right-click in Click to edit Master title style box.
2
From the context menu, select B (bold). Also select the button to center the text.
Create a Presentation Programmatically
3
Save and close the template.
Import the PPT API Package
All PPT API class names include the prefix mlreportgen.ppt. To avoid including the
package name when you invoke PPT API object constructors and method, import the
package. Insert this statement at the beginning of a PPT API program.
import mlreportgen.ppt.*;
Note: The import line is the first line in this example program. This example creates a
PPT API program in sections, and so you use the import command only once. To view
the complete program, click myNewPPTPresentation program.
Create the Presentation Object
Create a Presentation object. Specify:
• myNewPPTPresentation.pptx as the output file for the generated presentation.
• myTemplate.pptx as the PowerPoint template.
slidesFile = 'myNewPPTPresentation.pptx';
slides = Presentation(slidesFile,'myTemplate');
12-65
12
Programmatic PowerPoint Presentation Creation
Add a Presentation Title Slide
To add a slide programmatically, specify a slide layout in the template. To see the names
of the slide layouts, in the PowerPoint Slide Master tab, hover over a slide layout.
The myTemplate template includes a Title Slide slide layout for the presentation
title slide. To add a slide using the Title Slide layout, use the add method with
slides, which is a Presentation object. In the slide layout name, do not include the
word Layout, which appears at the end of slide layout names when you hover over slide
layouts.
presentationTitleSlide = add(slides,'Title Slide');
To add content to the slide, first find out the names of the content objects in the slide
layout.
1
2
3
12-66
In PowerPoint, stay in the slide master view and select the Home tab.
Click Select > Selection Pane.
In the slide layout, click the slide layout content item whose name you want.
Create a Presentation Programmatically
Specify a title and a subtitle. Specify the slide, the name of the content objects you want
to replace, and the text for the title and subtitle. For the subtitle, to specify a different
font for the word histogram, use a Paragraph object for that text.
replace(presentationTitleSlide,'Title','Create Histogram Plots');
subtitleText = Paragraph('The ');
funcName = Text('histogram');
funcName.Font = 'Courier New';
append(subtitleText,funcName);
append(subtitleText,' Function');
replace(presentationTitleSlide,'Subtitle1',subtitleText);
Add a Slide with a Picture
To add a picture to a slide, create a Picture object, specifying an image file. This
example creates a MATLAB plot and saves the plot as an image file. You can add the
picture to a slide. Use a Title and Content slide layout and add a title and picture.
x = randn(10000,1);
h = histogram(x);
saveas(gcf,'myPlot_img.png');
plot1 = Picture('myPlot_img.png');
pictureSlide = add(slides,'Title and Content');
replace(slides,'Title','Histogram of Vector');
contents = find(pictureSlide,'Content');
replace(contents(1),plot1);
Add a Slide with Text
Depending on the slide layout, PowerPoint formats the text you add as a paragraph, a
bulleted list, or a numbered list. This example creates another instance of a Title and
Content slide, which formats the text as a bulleted list. You can use a nested cell array
to specify levels for bullets.
textSlide = add(slides,'Title and Content');
titleText2 = Paragraph('What You Can Do with ');
func = Text('histogram');
12-67
12
Programmatic PowerPoint Presentation Creation
func.Font = 'Courier New';
append(titleText2,func);
contents = find(textSlide,'Title');
replace(contents(1),titleText2);
contents = find(textSlide,'Content');
replace(contents(1),{'Create histogram plot of x',...
'Specify:',{'Number of bins','Edges of the bins'},...
'Plot into a specified axes'});
Add a Slide with a Table
You can use several approaches to add a table to a slide. This example shows how to
build a table row by row.
• Create a Table object.
• Create a TableRow object for each row of the table.
• Create TableEntry objects and append them to table rows.
• Add the table to a slide.
tableSlide = add(slides,'Title and Content');
contents = find(tableSlide,'Title');
titleText3 = Paragraph('Parameters');
replace(contents(1),titleText3);
paramTable = Table();
colSpecs(2) = ColSpec('6in');
colSpecs(1) = ColSpec('3in');
paramTable.ColSpecs = colSpecs;
tr1 = TableRow();
tr1.Style = {Bold(true)};
tr1te1Text = Paragraph('Value');
tr1te2Text = Paragraph('Description');
tr1te1 = TableEntry();
tr1te2 = TableEntry();
append(tr1te1,tr1te1Text);
append(tr1te2,tr1te2Text);
append(tr1,tr1te1);
append(tr1,tr1te2);
tr2 = TableRow();
12-68
Create a Presentation Programmatically
tr2te1Text = Paragraph('auto');
tr2te1Text.Font = 'Courier New';
tr2te2Text = Paragraph('The default auto algorithm chooses a bin width to ');
append(tr2te2Text,'cover the data range and reveal the shape of the underlying distribu
tr2te1 = TableEntry();
tr2te2 = TableEntry();
append(tr2te1,tr2te1Text);
append(tr2te2,tr2te2Text);
append(tr2,tr2te1);
append(tr2,tr2te2);
tr3 = TableRow();
tr3te1Text = Paragraph('scott');
tr3te1Text.Font = 'Courier New';
tr3te2Text = Paragraph(' is optimal if the data is close ');
append(tr3te2Text,'to being jointly normally distributed. This rule is ');
append(tr3te2Text,'appropriate for most other distributions, as well.');
tr3te1 = TableEntry();
tr3te2 = TableEntry();
append(tr3te1,tr3te1Text);
append(tr3te2,tr3te2Text);
append(tr3,tr3te1);
append(tr3,tr3te2);
append(paramTable,tr1);
append(paramTable,tr2);
append(paramTable,tr3);
contents = find(tableSlide,'Content');
replace(contents(1),paramTable);
Generate and Open the Presentation
Generate the PowerPoint presentation. Use a close method with a Presentation
object.
close(slides);
Open myNewPPTPresentation.pptx. On a Windows platform, you can open it in
MATLAB:
if ispc
winopen(slidesFile);
end
12-69
12
Programmatic PowerPoint Presentation Creation
Code for myNewPPTPresentation
Here is the complete PPT API program to create myNewPPTPresentation.
Note: The myTemplate.pptx file must be in the current folder. If it is not, see “Set Up a
Template” on page 12-63.
import mlreportgen.ppt.*;
slidesFile = 'myNewPPTPresentation.pptx';
slides = Presentation(slidesFile,'myTemplate');
%Add a title slide
presentationTitleSlide = add(slides,'Title Slide');
replace(presentationTitleSlide,'Title','Create Histograms Plots');
subtitleText = Paragraph('The ');
funcName = Text('histogram');
funcName.Font = 'Courier New';
>> append(subtitleText,funcName);
append(subtitleText,' Function');
replace(presentationTitleSlide,'Subtitle',subtitleText);
%Add a picture slide
x = randn(10000,1);
h = histogram(x);
saveas(gcf,'myPlot_img.png');
plot1 = Picture('myPlot_img.png');
pictureSlide = add(slides,'Title and Content');
replace(slides,'Title','Histogram of Vector');
contents = find(pictureSlide,'Content');
replace(contents(1),plot1);
%Add a text slide
textSlide = add(slides,'Title and Content');
titleText2 = Paragraph('What You Can Do with ');
func = Text('histogram');
func.Font = 'Courier New';
12-70
Create a Presentation Programmatically
append(titleText2,func);
contents = find(textSlide,'Title');
replace(contents(1),titleText2);
contents = find(textSlide,'Content');
replace(contents(1),{'Create histogram plot of x',...
'Specify:',{'Number of bins','Edges of the bins'},...
'Plot into a specified axes'});
%Add a table slide
tableSlide = add(slides,'Title and Content');
contents = find(tableSlide,'Title');
titleText3 = Paragraph('Parameters');
replace(contents(1),titleText3);
paramTable = Table();
paramTable = Table();
colSpecs(2) = ColSpec('6in');
colSpecs(1) = ColSpec('3in');
paramTable.ColSpecs = colSpecs;
tr1 = TableRow();
tr1.Style = {Bold(true)};
tr1te1Text = Paragraph('Value');
tr1te2Text = Paragraph('Description');
tr1te1 = TableEntry();
tr1te2 = TableEntry();
append(tr1te1,tr1te1Text);
append(tr1te2,tr1te2Text);
append(tr1,tr1te1);
append(tr1,tr1te2);
tr2 = TableRow();
tr2te1Text = Paragraph('auto');
tr2te1Text.Font = 'Courier New';
tr2te2Text = Paragraph('The default auto algorithm chooses a bin width to ');
append(tr2te2Text,'cover the data range and reveal the shape of the underlying distribu
tr2te1 = TableEntry();
tr2te2 = TableEntry();
append(tr2te1,tr2te1Text);
append(tr2te2,tr2te2Text);
append(tr2,tr2te1);
append(tr2,tr2te2);
12-71
12
Programmatic PowerPoint Presentation Creation
tr3 = TableRow();
tr3te1Text = Paragraph('scott');
tr3te1Text.Font = 'Courier New';
tr3te2Text = Paragraph('Scott''s rule is optimal if the data is close ');
append(tr3te2Text,'to being jointly normally distributed. This rule is ');
append(tr3te2Text,'appropriate for most other distributions, as well.');
tr3te1 = TableEntry();
tr3te2 = TableEntry();
append(tr3te1,tr3te1Text);
append(tr3te2,tr3te2Text);
append(tr3,tr3te1);
append(tr3,tr3te2);
append(paramTable,tr1);
append(paramTable,tr2);
append(paramTable,tr3);
contents = find(tableSlide,'Content');
replace(contents(1),paramTable);
%Generate and open the presentation
close(slides);
if ispc
winopen(slidesFile);
end
Related Examples
12-72
•
“Update Presentation Content Programmatically” on page 12-50
•
“Set Up a PowerPoint Template” on page 12-26
•
“Access PowerPoint Template Elements” on page 12-37
•
“Add Slides” on page 12-73
•
“Create and Format Text” on page 12-83
•
“Create and Format Paragraphs” on page 12-86
•
“Create and Format Tables” on page 12-89
•
“Create and Format Pictures” on page 12-94
•
“Create and Format Links” on page 12-96
Add Slides
Add Slides
In this section...
“Specify the Order of a Slide” on page 12-73
“Specify the Slide Master” on page 12-75
To add a slide to a presentation, use the PPT API to add slide based on a slide layout
defined in the PowerPoint presentation template. If the template does not include slide
layout that meets your requirements, you can add a slide layout. For details, see “Add a
Slide Layout” on page 12-31.
To add a slide, use the add method with an mlreportgen.ppt.Presentation object.
For example, using the default PPT API template, you can add a slide using the Title
and Content slide layout.
import mlreportgen.ppt.*;
slides = Presentation('myPresentation');
slide1 = add(slides,'Title and Content');
When you add a slide, the PPT API creates an mlreportgen.ppt.Slide object.
However, you cannot add a slide by using a Slide constructor.
Specify the Order of a Slide
By default, the order in which you add slides in a PPT API program determines the order
in which the slides appear. For example, this code makes the titleSlide slide the first
slide in the presentation. The contentSlide slide is the second slide.
slides = Presentation('myPresentation');
titleSlide = add(slides,'Title Slide');
contentSlide = add(slides,'Title and Content');
When you add a slide, to specify explicitly the order in which it appears, you can:
• Specify the slide the new slide precedes. This approach is useful to keep slides
together as you add or delete slides.
• Specify an index indicating the numerical position of the slide in the presentation.
This approach is useful when you want a slide to appear always in the same
numerical position.
12-73
12
Programmatic PowerPoint Presentation Creation
The first approach places the new slide immediately before slide you specify. If you
created the reference slide using the PPT API, you can specify the Slide object. For
example, using the default PPT API template, this code causes the pictureSlide to
appear immediately before the introSlide.
slides = Presentation('myPresentation');
titleSlide = add(slides,'Title Slide');
introSlide = add(slides,'Title Slide');
pictureSlide = add(slides,'Title and Picture',introSlide);
In a presentation created using PowerPoint, adding a slide immediately before a slide
that you created using PowerPoint requires a few steps.
1
In PowerPoint, identify the position of the reference slide you want the new slide to
precede.
2
Open the PPT API program and give a name to the reference slide you want to
position the new slide before. For example, assume that the reference slide is the
second slide in a PowerPoint presentation.
slides = Presentation('myPresentation','myPresentation');
open(slides);
slides.Children(2).Name = 'ReferenceSlide';
close(slides);
3
To identify the reference slide object, use the slide name. Add the new slide relative
to the reference slide.
slides = Presentation('myPresentation', 'myPresentation');
open(slides);
refSlide = find(slides, 'ReferenceSlide');
add(slides, 'Blank', refSlide);
close(slides);
To use the second approach, specify an index representing the numerical position for the
slide. For example, using the default PPT API template, this code makes pictureSlide
the second slide in the presentation.
slides = Presentation('myPresentation');
titleSlide = add(slides,'Title Slide');
introSlide = add(slides,'Title and Content');
12-74
Add Slides
pictureSlide = add(slides,'Title and Picture',2);
Specify the Slide Master
A template can have multiple slide masters. Two or more slide masters can have a child
slide layout with the same name. By default, when you specify the slide layout using PPT
API, the API uses the first slide layout that has the name you specify. If you specify a
slide master in an add method, specify the slide master argument immediately after the
slide layout argument. For example, this code uses the Title Slide slide layout that is
a child of the myCustomMaster slide master.
slides = Presentation('myPresentation');
titleSlide = add(slides,'Title Slide',myCustomMaster);
See Also
Functions
mlreportgen.ppt.Presentation.add | mlreportgen.ppt.Presentation.getLayoutNames |
mlreportgen.ppt.Presentation.getMasterNames
Related Examples
•
“Create a Presentation Object to Hold Content” on page 12-14
•
“Add and Replace Presentation Content” on page 12-76
12-75
12
Programmatic PowerPoint Presentation Creation
Add and Replace Presentation Content
In this section...
“Set Up the Template” on page 12-76
“Replace Content” on page 12-77
“Add and Replace Text” on page 12-77
“Add or Replace a Table” on page 12-80
“Add or Replace a Picture” on page 12-81
To use the PPT API to add, or replace, content in a PowerPoint presentation:
• Set up a PowerPoint template to hold the presentation content you want to add or
replace.
• Create PPT API content objects, such as Paragraph, Table, and Picture objects.
• Use PPT API content objects to add or replace presentation content.
You can add and replace content in several ways. For example, you can:
• Add or replace content globally in a presentation or locally in a specific slide.
• Add content to a text box.
• Replace a text box, table, or picture with content of the same type.
• Replace a placeholder with content corresponding to that placeholder.
You cannot replace part of a paragraph, table, or text box. Replace the whole content
object.
Set Up the Template
You can replace or add content to an existing PowerPoint presentation without modifying
the template. However, using the PPT API requires knowledge of template and slide
objects, including:
• Slide master names
• Slide layout names
• Slide placeholder and content object names
• Table style names
12-76
Add and Replace Presentation Content
You can use using PowerPoint to add placeholders to a presentation and then use the
PPT API to replace the placeholder with content. To replace a specific content object in a
presentation, you can use PowerPoint to give a unique name to the content object. Then
use that name with the PPT API.
For more information about using PowerPoint templates with a PPT API program, see:
• “Set Up a PowerPoint Template” on page 12-26
• “Access PowerPoint Template Elements” on page 12-37
Replace Content
You can replace content by specifying the content object name in a replace method with
a Slide object. For example, in the default PPT API template, the Title Slide layout
has a content object called Title.
titleSlide = add(slides,'Title Slide');
replace(titleSlide,'Title','This Is My Title');
To replace presentation content, you can use a find method with a Presentation or
Slide object. The find method searches for content objects whose Name property value
matches the search value you specify. Then you can use the index of the returned item
that you want to update.
slides = Presentation('myPresentation');
titleSlide = add(slides,'Title Slide');
contents = find(slides,'Title');
replace(contents(1),'This Is My Title');
Add and Replace Text
You can use these approaches to add or replace text for to a presentation.
Text Specification Technique
Associated PPT API Objects
Specify a string as part of
creating these objects.
• Text
• Paragraph
• ExternalLInk
12-77
12
Programmatic PowerPoint Presentation Creation
Text Specification Technique
Associated PPT API Objects
Append text to a paragraph or
external link.
Append text to these PPT API objects:
• Paragraph
• TableEntry
• ExternalLink
Replace a Paragraph object in a Specify a string, Paragraph object, or a cell array of
presentation or slide.
strings or Paragraph objects or a combination of both
kinds of objects, for the replace method with these
objects:
• Presentation
• Slide
Add to or replace text in a
placeholder object.
• Add to a ContentPlaceholder object a string,
Paragraph object, or with a cell array of strings or
Paragraph objects, or a combination of both.
• Replace a ContentPlaceholder object with a
Paragraph object.
• Add to a TextBoxPlaceholder object a string,
Paragraph object, or with a cell array of strings or
Paragraph objects or a combination of both.
• Replace a TextBoxPlaceholder object with a
Paragraph object.
See “Add and Replace Text in Placeholders” on page
12-78.
Add to, or replace, a text box.
Add to or replace a TextBox object with a string,
Paragraph object, or with a cell array of strings or
Paragraph objects, or a combination of both.
See “Add or Replace Text in a Text Box” on page
12-79.
Add and Replace Text in Placeholders
You can add or replace text in a ContentPlaceholder and a TextBoxPlaceholder,
specifying:
12-78
Add and Replace Presentation Content
• A string
• A Paragraph object
• A cell array of strings or Paragraph objects or a combination of strings and
Paragraph objects. An inner cell array specifies inner list (indented) items.
The slide layout specifies whether the text appears as paragraphs, a bulleted list, or a
numbered list.
import mlreportgen.ppt.*
name1 = 'before';
slides = Presentation(name1);
add(slides,'Comparison');
replace(slides, 'Left Content', 'dummy content');
replace(slides, 'Right Content', 'dummy content');
close(slides);
name2 = 'after';
slides = Presentation(name2, name1);
lefts = find(slides, 'Left Content');
rights = find(slides, 'Right Content');
para = replace(lefts(1), 'Left item in the list' );
para.Italic = true;
para.FontColor = 'green';
replace(rights(1), { ...
'Right List item', ...
{ 'Inner right list item', 'Other inner right list item' }...
'Right List item', ...
});
close(slides);
if ispc
winopen(slides.OutputPath);
end
Add or Replace Text in a Text Box
A text box in a slide is a box that you can add text to. You can programmatically add or
replace the content of a text box in a presentation.
12-79
12
Programmatic PowerPoint Presentation Creation
1
Create a TextBox object. Specify the location and width of the text box.
2
Add text by using the add method with the TextBox object.
3
Add the TextBox object to a presentation using the add method with a
Presentation object or the add method with a Slide object.
For example :
import mlreportgen.ppt.*;
slides = Presentation('myPresentation.pptx');
titleSlide = add(slides,'Title Slide');
tb = TextBox();
tb.X = '2in';
tb.Y = '2in';
tb.Width = '5in';
add(tb,'Text for text box');
add(titleSlide,tb);
close(slides);
Add or Replace a Table
To add or replace a table in a presentation, first create a Table object. You can add a
table by using an add method with a Slide object.
import mlreportgen.ppt.*;
slides = Presentation('myPresentation.pptx');
tableSlide = add(slides,'Blank');
magicTable = Table(magic(5));
magicTable.X = '3in';
MagicTable.Y = '5in';
add(tableSlide,magicTable);
close(slides);
To replace content in a table, replace the whole table. To replace a Table object, use the
replace method with the Table object, and specify another Table object. To replace a
table in a slide content placeholder, use the replace method with the Slide object and
specify a Table object.
slides = Presentation('myPresentation');
12-80
Add and Replace Presentation Content
tableSlide = add(slides,'Title and Table');
table1 = Table(magic(9));
contents = find(tableSlide,'Table');
replace(contents(1),table1);
close(slides);
Add or Replace a Picture
You can add a picture by using an add method or a replace method with a Slide
object.
import mlreportgen.ppt.*;
slides = Presentation('myPresentation.pptx');
pictureSlide = add(slides,'Blank');
plane = Picture(which('b747.jpg'));
plane.X = '2in';
plane.Y = '2in';
plane.Width = '5in';
plane.Height = '2in';
add(pictureSlide,plane);
close(slides);
You can use a replace method with a Picture or PicturePlaceholder object. For
example, the default template has a Title and Picture slide layout that has a picture
placeholder called Picture.
import mlreportgen.ppt.*;
slides = Presentation('myPresentation');
pictSlide = add(slides,'Title and Picture');
plane2 = Picture(which('b747.jpg'));
contents = find(pictSlide,'Picture');
replace(contents(1),plane2);
close(slides);
PowerPoint adjusts the picture dimensions to fit in the picture placeholder. If the picture
placeholder dimensions are bigger than the Picture object dimensions, the picture
stretches proportionally. If the dimensions are smaller, the picture is centered.
12-81
12
Programmatic PowerPoint Presentation Creation
Related Examples
•
“Create and Format Text” on page 12-83
•
“Create and Format Paragraphs” on page 12-86
•
“Create and Format Tables” on page 12-89
•
“Create and Format Pictures” on page 12-94
•
“Create and Format Links” on page 12-96
More About
•
12-82
“Presentation Formatting Approaches” on page 12-20
Create and Format Text
Create and Format Text
In this section...
“Create Text” on page 12-83
“Create a Subscript or Superscript” on page 12-83
“Format Text” on page 12-84
Create Text
You can create a Text object using an mlreportgen.ppt.Text constructor, specifying a
text string.
Also, you can create text by using a string with these kinds of PPT API objects:
• Paragraph
• ExternalLink
• TableEntry
• TextBox
• ContentPlaceholder
• TextBoxPlaceholder
For example:
import mlreportgen.ppt.*;
slides = Presentation('myPresentation.pptx');
slide1 = add(slides,'Title Slide');
contents = find(slide1,'Title');
titleText = replace(contents(1),'My Title');
For more information about creating and adding text, see “Add and Replace Text” on
page 12-77.
Create a Subscript or Superscript
You can enable the Subscript or Superscript property for a Text object. Enabling
these properties specifies that the text gets treated as a subscript or superscript when
2
you add it to a Paragraph object. For example, you can set up a paragraph to display x .
12-83
12
Programmatic PowerPoint Presentation Creation
super = Text('2');
super.Superscript = true;
para = Paragraph('x');
append(para,super);
Format Text
To format a Text object, use format objects with a Text object Style property or use
Text object properties. For example:
t = Text('green text');
t.Style = {Bold(true)};
t.FontColor = 'green';
Text Object Formatting
Format Object
Format Property
Font family
FontFamily
Font
Font family for complex
scripts to handle locales
FontFamily
ComplexScriptFont
Font size
FontSize
FontSize
Font color
FontColor
FontColor
Bold
Bold
Bold
Italic
Italic
Italic
Strike
Strike
Strike
Underline
Underline
Underline
Subscript
Subscript
Subscript
Superscript
Superscript
Superscript
See Also
Classes
mlreportgen.ppt.ExternalLink | mlreportgen.ppt.Paragraph | mlreportgen.ppt.Text |
mlreportgen.ppt.TextBox
Related Examples
•
12-84
“Add and Replace Text” on page 12-77
Create and Format Text
More About
•
“Presentation Formatting Approaches” on page 12-20
12-85
12
Programmatic PowerPoint Presentation Creation
Create and Format Paragraphs
In this section...
“Create a Paragraph” on page 12-86
“Format Paragraph Content” on page 12-86
Create a Paragraph
To create a Paragraph object, use the mlreportgen.ppt.Paragraph constructor. You
can:
• Create an empty Paragraph object.
• Specify a string for the paragraph text.
• Specify a Text or ExternalLink object as the paragraph text.
After you create a Paragraph object, you can append strings or Text objects to add text
to the paragraph. You can specify separate formatting for each Text and ExternalLink
object that you append.
Format Paragraph Content
You can specify the default formatting to apply to the text in a paragraph. The paragraph
formatting applies to text strings that you add. The paragraph formatting applies
to Text and ExternalLink objects in the paragraph, unless those objects specify
formatting that overrides the default paragraph formatting. For example, this code
produces alternating red and green text:
p = Paragraph('Default paragraph green text');
p.FontColor = 'green';
redText = Text(' red text');
redText.FontColor = 'red';
append(p,redText);
moreText = Text(' back to default green text');
append(p,moreText);
12-86
Create and Format Paragraphs
Paragraph Object
Formatting
Format Object
Format Property
Font family
FontFamily
Font
Font family for complex
scripts to handle locales
FontFamily
ComplexScriptFont
Font size
FontSize
FontSize
Bold
Bold
Bold
Font color
FontColor
FontColor
Italic
Italic
Italic
Strike
Strike
Strike
Underline
Underline
Underline
Subscript
Subscript
Subscript
Superscript
Superscript
Superscript
Horizontal alignment
HAlign
HAlign
Level of indentation
n/a
Level
Use the PowerPoint
template to specify
formatting for each level.
Tip Although you can specify that text in a Paragraph object is a subscript or
superscript, using Text objects with Subscript or Superscript property set gives you
greater formatting flexibility.
See Also
Classes
mlreportgen.ppt.ExternalLink | mlreportgen.ppt.Paragraph | mlreportgen.ppt.Text |
mlreportgen.ppt.TextBox
Classes
mlreportgen.ppt.TableEntry
12-87
12
Programmatic PowerPoint Presentation Creation
Related Examples
•
“Add and Replace Text” on page 12-77
More About
•
12-88
“Presentation Formatting Approaches” on page 12-20
Create and Format Tables
Create and Format Tables
In this section...
“Create a Table” on page 12-89
“Format a Table” on page 12-89
Create a Table
To create a table, you can:
• Create an empty Table object using the mlreportgen.ppt.Table constructor
without arguments. Then append TableRow objects to the Table object and append
TableEntry objects to the TableRow objects.
• Create an empty Table object using the mlreportgen.ppt.Table constructor,
specifying the number of columns.
• Create a Table object whose rows and columns are populated by the values you
specify in the constructor. You can specify a two-dimensional numeric array or a twodimensional cell array of numbers, strings, and Paragraph objects. You can also use
a combination of these kinds of values.
For an example of creating a table by appending table rows to an empty table, see
mlreportgen.ppt.TableRow. For an example of creating a table by specifying values
in the Table object constructor, see mlreportgen.ppt.Table.
Format a Table
You can specify a table style name for the overall look of a table, such as a table that
shades alternating rows. You can set the Style property of a Table object to the name
of a table style. The table style must be in the PowerPoint template that the PPT API
program uses.
You can specify the location (upper-left x and y coordinates), height, and width properties
of a table. When you add the table to a presentation programmatically, PowerPoint
uses those properties, if all of the table content fits in the table. When you replace a
TablePlaceholder or ContentPlaceholder with a table, PowerPoint fits the table in
the placeholder location and dimensions.
12-89
12
Programmatic PowerPoint Presentation Creation
You can specify default formatting for the contents of a table, a column, a table row, and
a table entry. Table entry formatting takes precedence over the formatting you specify for
a column or for a table row. Table row formatting takes precedence over table formatting.
You can specify these default formatting options for the contents of a Table object.
Table Object Formatting
Format Object
Format Property
Table style from template
n/a
StyleName
Background color
BackgroundColor
BackgroundColor
Column formatting
ColSpec
ColSpecs
Vertical alignment of table
cell content
VAlign
VAlign
Font family
FontFamily
Font
Font family for complex
scripts to handle locales
FontFamily
ComplexScriptFont
Font size
FontSize
FontSize
Font color
FontColor
FontColor
Upper-left x-coordinate of
the table
n/a
X
Upper-left y-coordinate of
the table
n/a
Y
Table width
n/a
Width
Table height
n/a
Height
Use the PowerPoint
template to specify table
style formatting.
To specify default formatting for the contents of a TableRow object, use the Style
property with these format objects.
12-90
TableRow Object Formatting Format Object
Format Property
Background color
BackgroundColor
n/a
Vertical alignment of table
cell content
VAlign
n/a
Create and Format Tables
TableRow Object Formatting Format Object
Format Property
Font family
FontColor
n/a
Font family for complex
scripts
FontFamily
n/a
Font size
FontSize
n/a
Text color
FontColor
n/a
Bold
Bold
n/a
Italic
Italic
n/a
Strike
Strike
n/a
Underline
Underline
n/a
Background color
BackgroundColor
n/a
To specify default formatting for the contents of a TableEntry object, use these
formatting options.
TableEntry Object
Formatting
Format Object
Format Property
Background color
BackgroundColor
BackgroundColor
Column width
ColWidth
n/a
Vertical alignment of table
cell content
VAlign
VAlign
Font family
FontFamily
Font
Font family for complex
scripts to handle locales
FontFamily
ComplexScriptFont
Text color
FontColor
FontColor
Font size
FontSize
FontSize
Bold
Bold
n/a
Italic
Italic
n/a
Strike
Strike
n/a
Underline
Underline
n/a
12-91
12
Programmatic PowerPoint Presentation Creation
Access a Table Row or Entry
To access a row in a table, use the mlreportgen.ppt.Table.row method. Specify the
Table object and the number of the row you want to access. For example, to access a
TableRow object for the second row of myTable, use:
myTable = Table(magic(5));
row2 = row(myTable,2);
To access an entry in a table, use the mlreportgen.ppt.Table.entry method. Specify
the Table object and the number of the row and the number of the column that you want
to access. For example, to access a TableEntry object for the third entry in the second
row of myTable, use:
myTable = Table(magic(5));
entry3row2 = entry(myTable,2,3);
Alternatively, you can access a table row by using the Children property of a Table
object. You can access a table entry by using the Children property of a TableRow
object. For example, to access the third entry in the second row of myTable:
myTable = Table(magic(5));
entry3row2 = myTable.Children(2).Children(3);
Format a Column
To format a column in a table, use one or more mlreportgen.ppt.ColSpec objects.
Create a ColSpec object for each column that you want to format and specify the
formatting for each ColSpec object. Then define an array of the ColSpec objects and use
that with the ColSpecs property of the Table object.
The format specification for a table row takes precedence over the format specification for
a column.
import mlreportgen.ppt.*
slidesFile = 'myColSpecs.pptx'
slides = Presentation(slidesFile);
add(slides,'Title and Content');
t = Table(magic(12));
t.Style = {HAlign('center')};
colSpecs(2) = ColSpec('1.5in');
colSpecs(1) = ColSpec('1.5in');
12-92
Create and Format Tables
colSpecs(1).BackgroundColor = 'red';
colSpecs(2).BackgroundColor = 'green';
t.ColSpecs = colSpecs;
t.row(2).Style = {VAlign('bottom')};
t.row(2).BackgroundColor = 'tan';
t.entry(2,3).FontColor = 'red';
t.entry(2,3).FontSize = '30pt';
replace(slides,'Content',t);
close(slides);
if ispc
winopen(slides.OutputPath);
end
When you create a ColSpec object, you can specify the column width in the constructor.
For example:
myColSpec = ColSpec('3in');
Also, you can specify the column width using the Width property of a ColSpec
object. You specify other formatting properties of the ColSpec object, such as
BackgroundColor.
See Also
Functions
mlreportgen.ppt.Table.entry | mlreportgen.ppt.Table.row
Classes
mlreportgen.ppt.ColSpec | mlreportgen.ppt.ColWidth | mlreportgen.ppt.Table
| mlreportgen.ppt.TableEntry | mlreportgen.ppt.TablePlaceholder |
mlreportgen.ppt.TableRow
Related Examples
•
“Add or Replace a Table” on page 12-80
More About
•
“Presentation Formatting Approaches” on page 12-20
12-93
12
Programmatic PowerPoint Presentation Creation
Create and Format Pictures
In this section...
“Create a Picture” on page 12-94
“Format a Picture” on page 12-95
Create a Picture
To create a picture for a presentation, use the mlreportgen.ppt.Picture constructor.
Specify the path to a picture file. The picture file must use one of these formats (you
cannot use .svg format):
• .bmp
• .emf
• .eps
• .gif
• .jpeg
• .jpg
• .png
• .tif
• .tiff
For example:
import mlreportgen.ppt.*
slides = Presentation('slides');
pictureSlide = add(slides,'Blank');
plane = Picture(which('b747.jpg'));
plane.Width = '5in';
plane.Height = '2in';
add(pictureSlide,plane);
close(slides);
12-94
Create and Format Pictures
Format a Picture
When you create a Picture object, you can specify the location, width, and height. The
specified formatting applies when you add a picture to a slide or replace a Picture
object. When you replace a PicturePlaceholder object with a Picture object,
PowerPoint adjusts the replacement picture to fit the location and dimensions of the
placeholder.
You can specify these format properties for a Picture object.
Picture Object Formatting
Format Object
Format Property
Upper-left x-coordinate of
picture
n/a
X
Upper-left y-coordinate of
picture
n/a
Y
Picture width
n/a
Width
Picture height
n/a
Height
See Also
Classes
mlreportgen.ppt.Picture | mlreportgen.ppt.PicturePlaceholder
Related Examples
•
“Add or Replace a Picture” on page 12-81
More About
•
“Presentation Formatting Approaches” on page 12-20
12-95
12
Programmatic PowerPoint Presentation Creation
Create and Format Links
In this section...
“Create an External Link” on page 12-96
“Format an External Link” on page 12-96
Create an External Link
To create a link to a location outside of a presentation, use the
mlreportgen.ppt.ExternalLink constructor. Specify the full URL of the link target
and specify the link text as a string. For example:
import mlreportgen.ppt.*
slidesFile = 'myExternalLinkPresentation.pptx';
slides = Presentation(slidesFile);
add(slides,'Title and Content');
p = Paragraph('This is a link to the ');
link = ExternalLink('http://www.mathworks.com','MathWorks site.');
append(p,link);
replace(slides,'Content',p);
close(slides);
if ispc
winopen(slidesFile);
end
Format an External Link
To specify default formatting for the link text, use the Style property with format
objects.
12-96
ExternalLink Object
Formatting
Format Object
Format Property
Font family
FontFamily
n/a
Create and Format Links
ExternalLink Object
Formatting
Format Object
Format Property
Font family for complex
scripts to handle locales
FontFamily
n/a
Text color
FontColor
n/a
Font size
FontSize
n/a
Bold
Bold
n/a
Italic
Italic
n/a
Strike
Strike
n/a
Underline
Underline
n/a
Background color
BackgroundColor
n/a
See Also
Classes
mlreportgen.ppt.ExternalLink
More About
•
“Presentation Formatting Approaches” on page 12-20
12-97