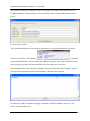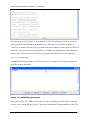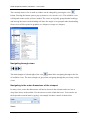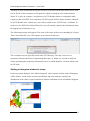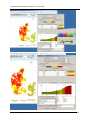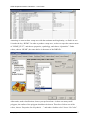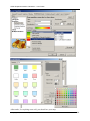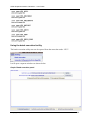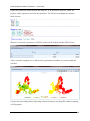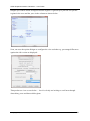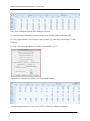
1
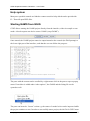
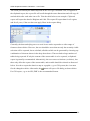
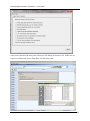
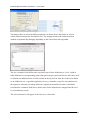
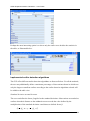
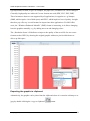
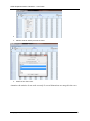
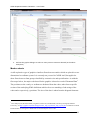
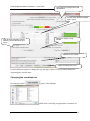
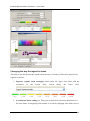
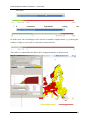
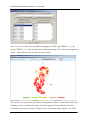
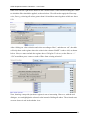
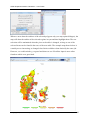
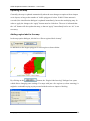
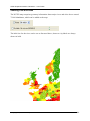
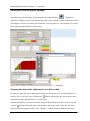
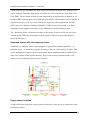
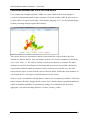
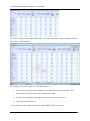
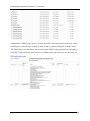
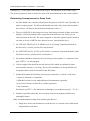
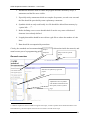
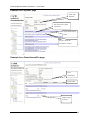
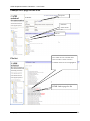
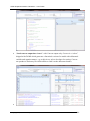
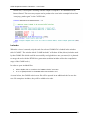
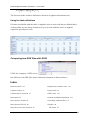
GGIG Graphical Interface Generator – User Guide
Assuming we want to draw a map now with the ruminant stocking density, we find it in row
10 under the key “RUMI”. In order to produce a map now, we have to open the context menu
of “HSMU_EU27”, and choose properties, symbology, and choose “Quantities”. Under
values, choose “RUMI”, the name before is the name of the DBF-file.
Afterwards, under classification, choose your preferred one. As there are many small
polygons, the outline of the polygons should not be drawn. Therefore click on one of the
colors, choose “Properties for all symbols …” and under “Outline color” chose “No Color”.
Wolfgang Britz, Version January 2015
97