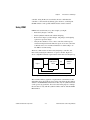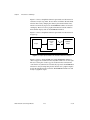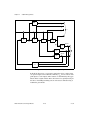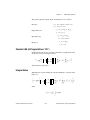
1
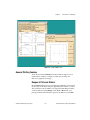
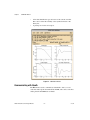
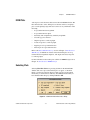
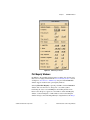
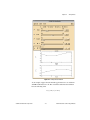
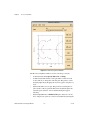
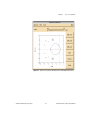
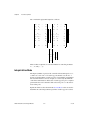
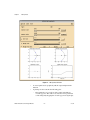
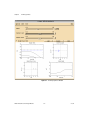
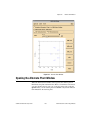
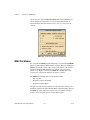
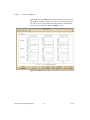
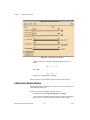
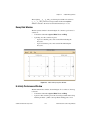
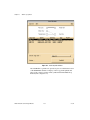
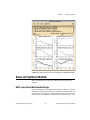
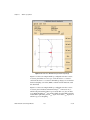
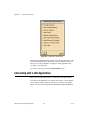
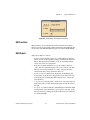
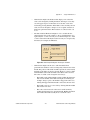
Chapter 3
ICDM Main Window
ICDM Plots
Various plots can be shown at the bottom of the main ICDM window. The
Plot menu is used to select which plots are shown, and also to magnify a
plot or set the plotting ranges. The user can choose any combination of the
following:
•
Loop transfer function magnitude
•
Loop transfer function phase
•
Sensitivity and complementary sensitivity magnitude
•
Closed-loop poles and zeros
•
Output response to a unit step input
•
Actuator response to a unit step input
•
Nyquist plot of loop transfer function
•
Nichols plot of loop transfer function
Refer to the Basic SISO Terminology section of Chapter 2, Introduction to
SISO Design, for definitions of these terms. The default plots are loop
transfer function magnitude and phase, and output and actuator response
to a unit step input.
For more information about other plots available for MIMO design, refer to
Chapter 11, Introduction to MIMO Design.
Selecting Plots
Selecting Plot»Plot Choices or pressing <Ctrl-P> in the main ICDM
window will cause a plot selection dialog box to appear, as shown in
Figure 3-2. The plot selection dialog box that appears is modal, which
means that you cannot interact with any other Xmath window until you
have dismissed this dialog by clicking Cancel or OK.
Figure 3-2. ICDM Main Window Plot Choices Dialog
© National Instruments Corporation
3-5
Xmath Interactive Control Design Module