1
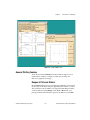
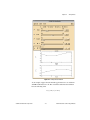
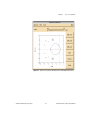
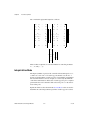
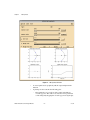
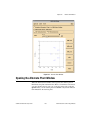
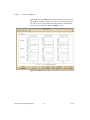
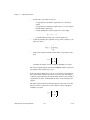
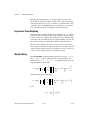
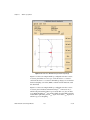
Chapter 5
Root Locus Synthesis
Phase Contours
For each of magnitude and phase contours, you can choose one of three
possible plotting styles.
•
180°
The plot shows the locus of points where the phase angle of the loop
transfer function is 180°. This yields a conventional root locus display.
This is the default phase contour plotting style. The plot shows the set
of all possible closed-loop pole locations as the gain is swept from
0 to ∞.
•
160°
200°
10°
The plot shows the loci of points where the phase angle of the loop
transfer function is 160°, 170°, 180°, 190°, or 200°. These plots show
the set of all possible closed-loop pole locations as the gain is swept
from 0 to and there is an additional phase shift of ±20°, ±10° in the
loop transfer function.
•
None
No phase contours are plotted.
Magnitude Contours
•
0 dB
The plot shows the locus of points where the magnitude of the loop
transfer function (including the delay, if applicable) is 0 dB.
•
–2:2 dB
The plot shows the loci of points where the magnitude of the loop
transfer function is –2, –1, 0, +1, and +2 dB, respectively.
•
None
No magnitude contours are plotted. This is the default magnitude
contour plotting style.
Notice that by selecting None for both phase and magnitude contours, the
plot shows only the controller and plant poles and zeros. This is useful for
graphically editing the controller poles and zeros.
If any phase contours are plotted, the closed-loop poles are shown (in blue
on a color display). They can be dragged along the 180° contour plot.
© National Instruments Corporation
5-5
Xmath Interactive Control Design Module