1
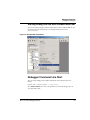
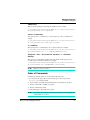
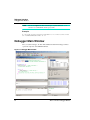
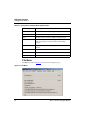
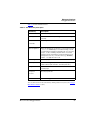
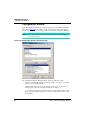
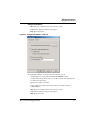
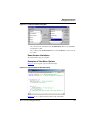
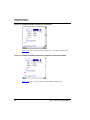
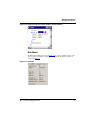
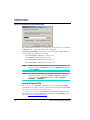
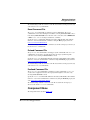
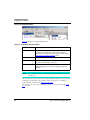
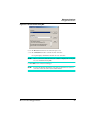
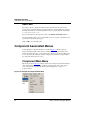
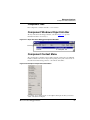
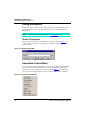
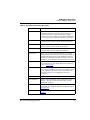
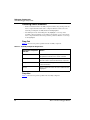
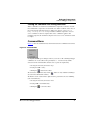
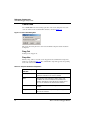
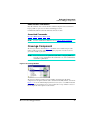
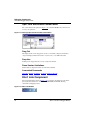
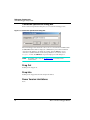
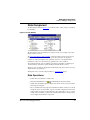
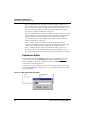
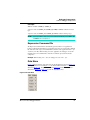
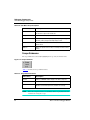
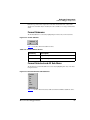
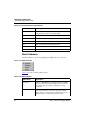
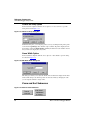
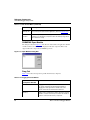
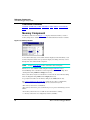
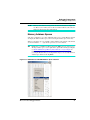
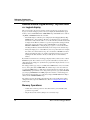
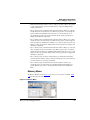
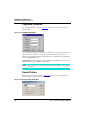
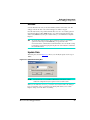
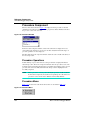
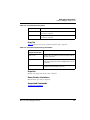
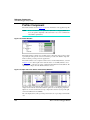
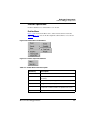
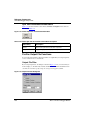
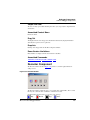
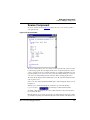
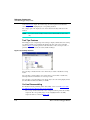
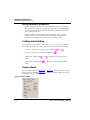
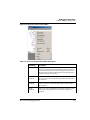
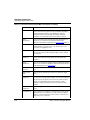
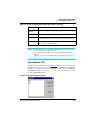
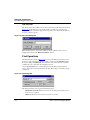
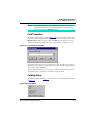
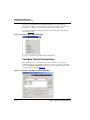
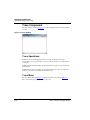
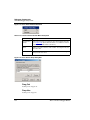
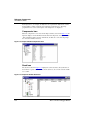
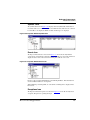
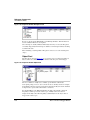
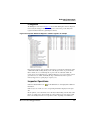
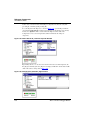
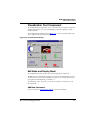
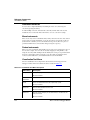
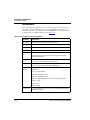
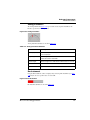
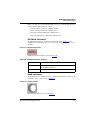
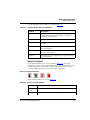
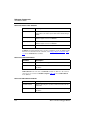
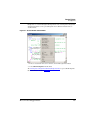
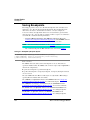
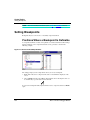
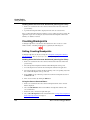
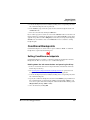
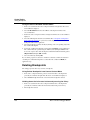
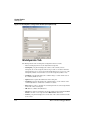
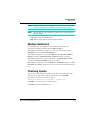
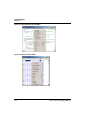
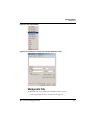
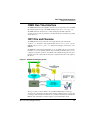
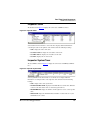
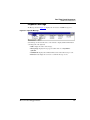
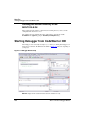
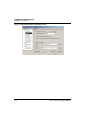
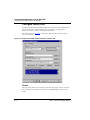
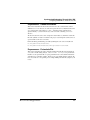
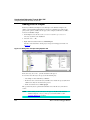
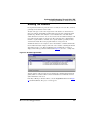
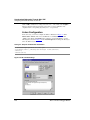
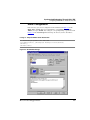
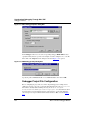
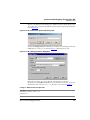
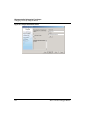
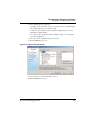
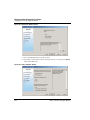
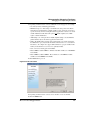
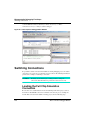
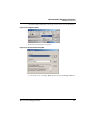
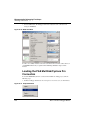
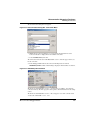
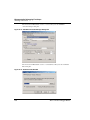
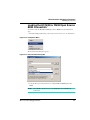
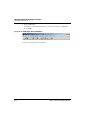
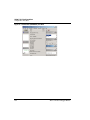
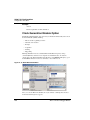
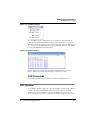
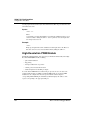
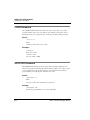
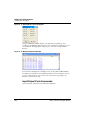
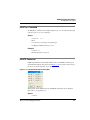
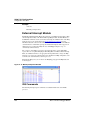
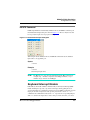
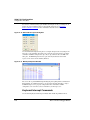
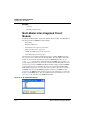
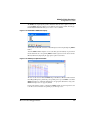
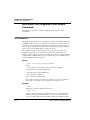
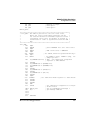
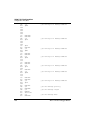
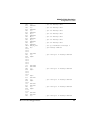
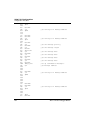
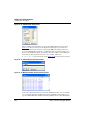
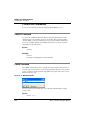
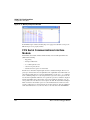
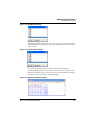
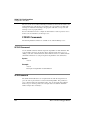
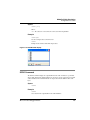
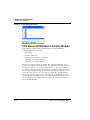
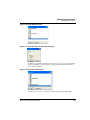
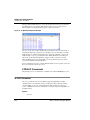
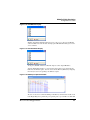
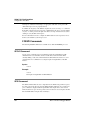
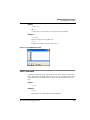
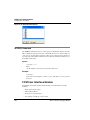
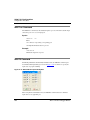
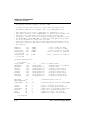
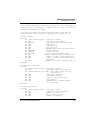
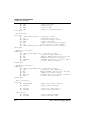
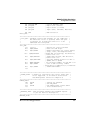
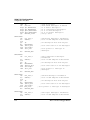
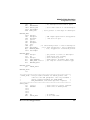
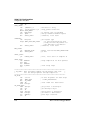
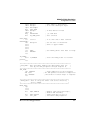
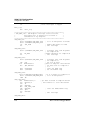
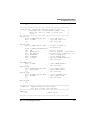
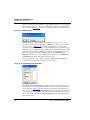
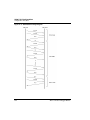
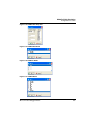
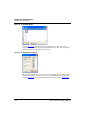
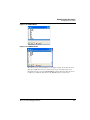
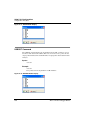
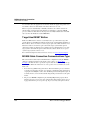
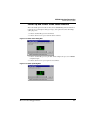
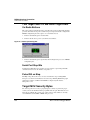
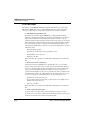
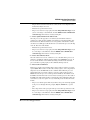
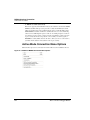
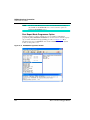
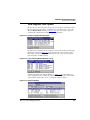
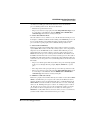
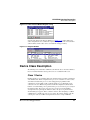
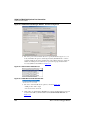
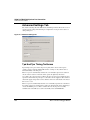
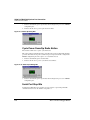
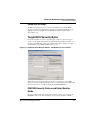
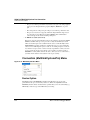
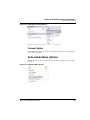
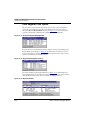
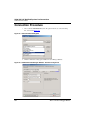
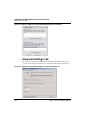
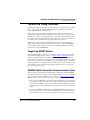
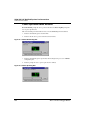
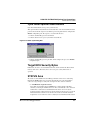
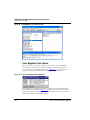
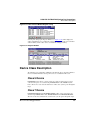
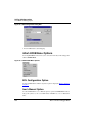
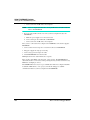
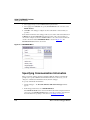
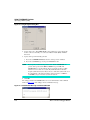
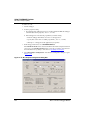
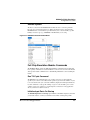
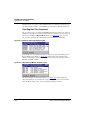
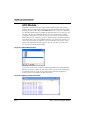
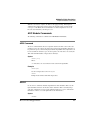
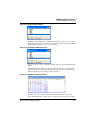
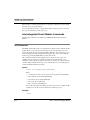
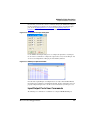
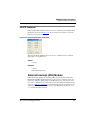
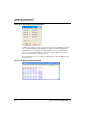
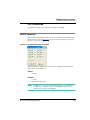
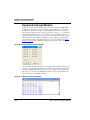
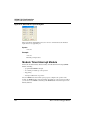
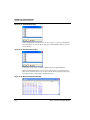
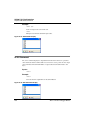
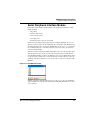
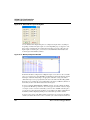
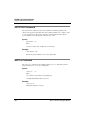
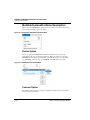
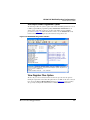
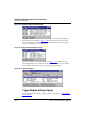
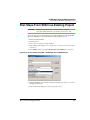
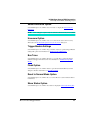
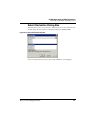
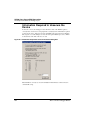
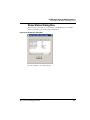
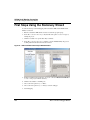
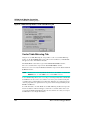
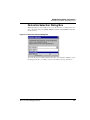
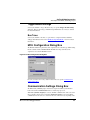
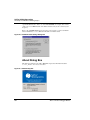
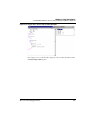
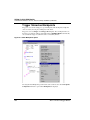
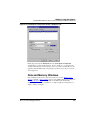
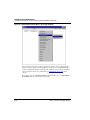
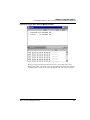
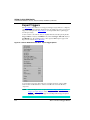
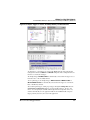
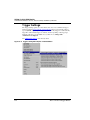
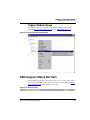
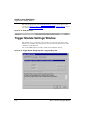
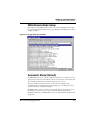
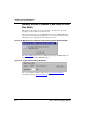
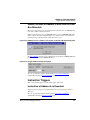
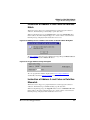
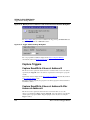
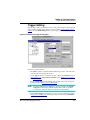
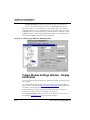
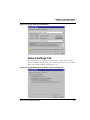
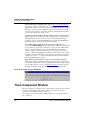
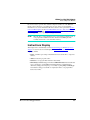
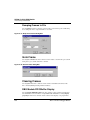
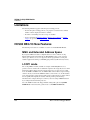
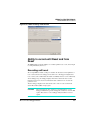
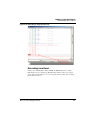
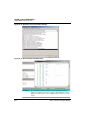
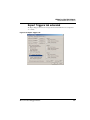
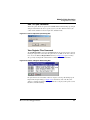
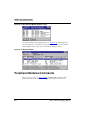
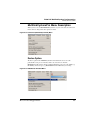
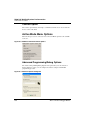
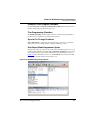
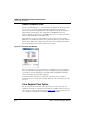
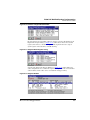
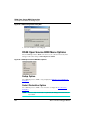
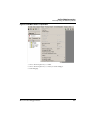
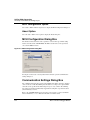
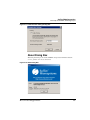
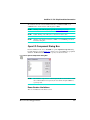
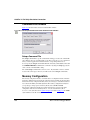
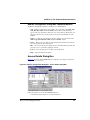
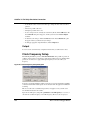
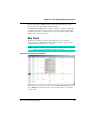
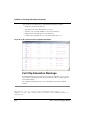
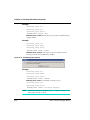
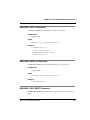
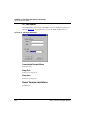
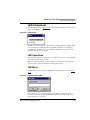
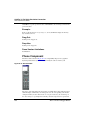
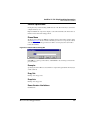
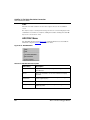
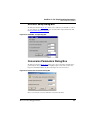
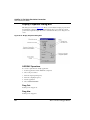
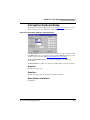
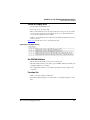
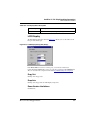
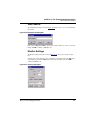
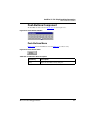
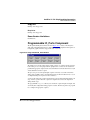
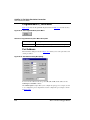
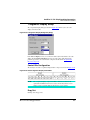
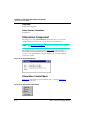
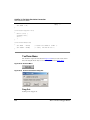
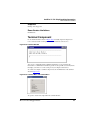
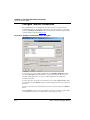
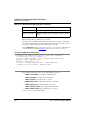
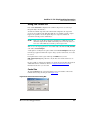
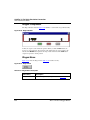
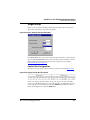
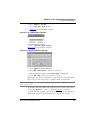
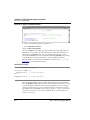
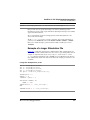
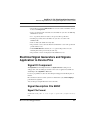
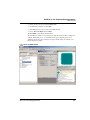
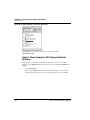
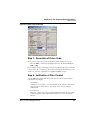
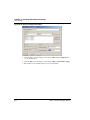
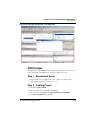
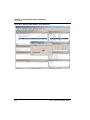
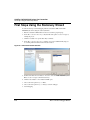
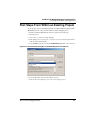
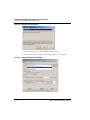
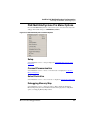
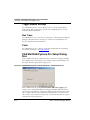
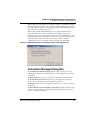
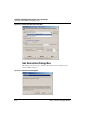
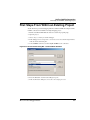
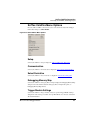
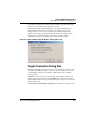
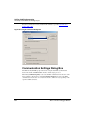
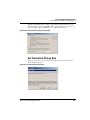
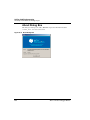
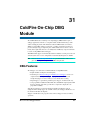
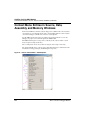
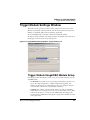
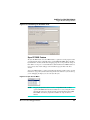
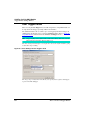
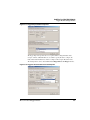
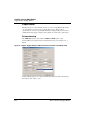
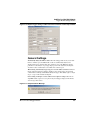
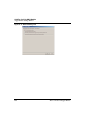
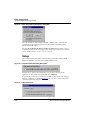
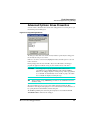
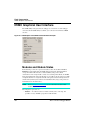
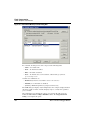
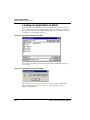
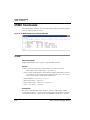
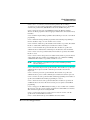
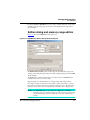
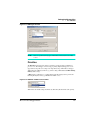
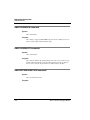
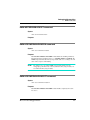
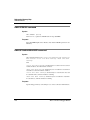
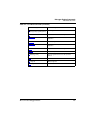
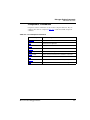
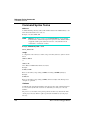
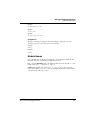
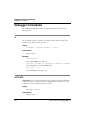
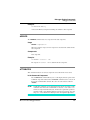
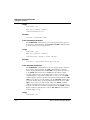
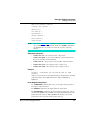
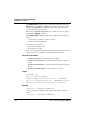
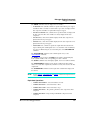
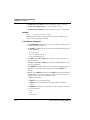
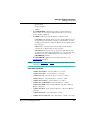
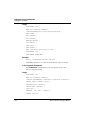
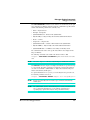
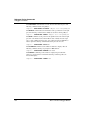
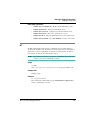
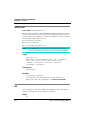
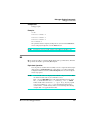
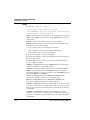
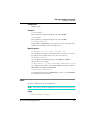
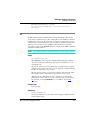
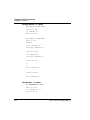
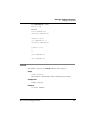
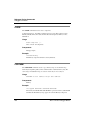
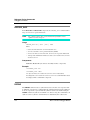
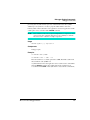
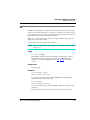
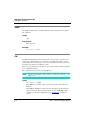
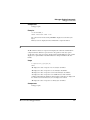
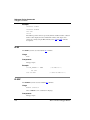
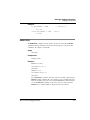
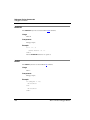
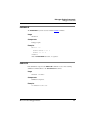
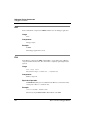
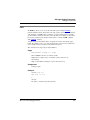
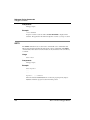
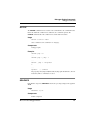
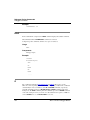
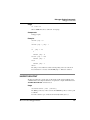
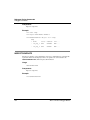
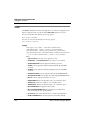
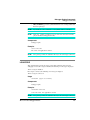
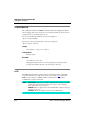
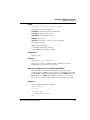
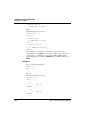
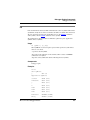
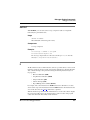
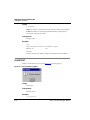
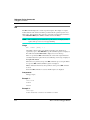
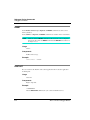
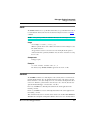
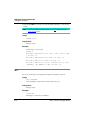
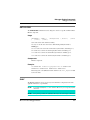
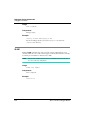
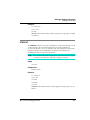
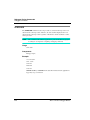
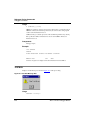
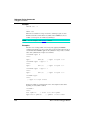
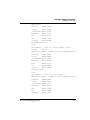
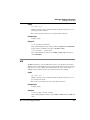
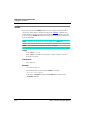
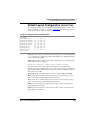
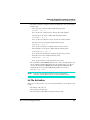
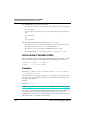
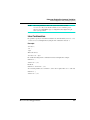
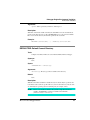
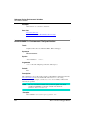
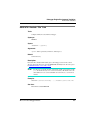
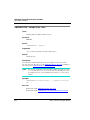
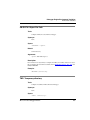
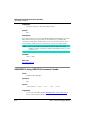
ColdFire On-Chip DBG Module
Trigger Module Settings Window
Figure 31.10 Expert Trigger Settings: CSR2 interactive translation of start/stop condition
General Settings
Automatically analyze the FIFO content: When the debugger halts for any reason with
the Trace window open, the DBG module results are automatically analyzed and
displayed in the Trace window. If the Trace window is closed, the DBG user interface
performs no result analysis except trigger flags reported in the status bar. Clearing this
check box restricts result analysis even with the Trace window open.
When starting, automatically step if a trigger is set at PC address (otherwise: warn): To
run the application again, the debugger usually needs to exit the trigger current match
condition and avoid being stuck/halted/locked by the trigger. This usually requires a single
step to “escape” from a hardware breakpoint.
Issue warning on attempt to execute with incorrect Sequencer settings: When the onchip DBG module sequencer is set up incorrectly, the debugger displays an informative
error message when started.
Figure 31.11 Sequencer Error Message
Microcontrollers Debugger Manual
695