1
Chapter 12 VMware ESX Server Resource Management
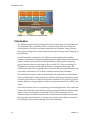
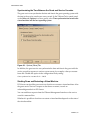
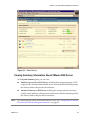
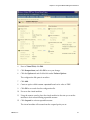
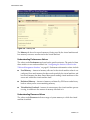
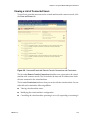
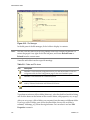
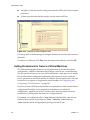
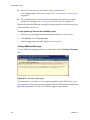
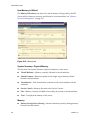
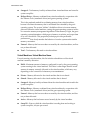
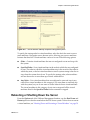
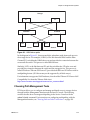
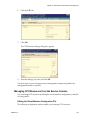
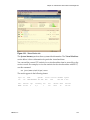
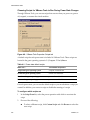
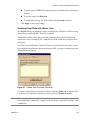
Figure 12-1. Status Monitor tab
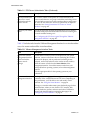
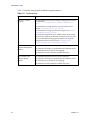
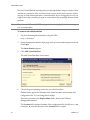
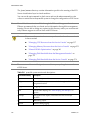
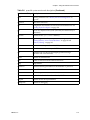
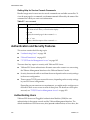
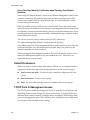
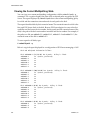
The System Summary section shows systemwide information. The Virtual Machines section below it shows information for particular virtual machines. You can read the current CPU statistics for a virtual machine from its status file on the service console. For example, to view the statistics for the virtual machine with ID 137, use this command:
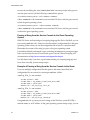
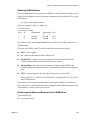
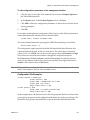
cat /proc/vmware/vm/137/cpu/status
The results appear in the following format:
vcpu
137
vm
137
wait
NONE
waitsec
51.783
VMware, Inc.
name
uptime
vmm0:Win2kAS 357.866
cpu
0
affinity
0,1
status costatus usedsec syssec
RUN
RUN
265.143 3.105
min
0
max
200
shares
2000
emin
72
extrasec
124.758
343