1
Dran-View 6.0
Professional / Enterprise
USER’S GUIDE
AC POWER ANALYSIS SOFTWARE
DRANETZ-BMI
1000 New Durham Road
Edison, NJ 08818-4019
Tel (732) 287-3680
Fax (732) 248-1834
Part Number OM-DRANVIEW
Contents:
Chapter 1. Introduction ............................................................................................................. 7
1.1.
What’s new in Dran-View 6? ..................................................................................... 8
Chapter 2. Getting Started ....................................................................................................... 10
2.1.
2.2.
2.3.
2.4.
2.5.
Requirements............................................................................................................ 10
Upgrading From Dran-View 5 ................................................................................. 10
Installing Dran-View ................................................................................................ 11
Registering the Software for Automatic Updates .................................................... 12
Unverified E- mail Error Dialog ............................................................................... 14
Chapter 3. The Main View ...................................................................................................... 15
Chapter 4. The Text Editor View............................................................................................ 17
Chapter 5. The Event List Bar................................................................................................. 20
5.1.
5.1.1.
5.2.
Event List Tab .......................................................................................................... 22
Event List Tab Toolbar Commands detailed information.................................... 23
Snapshot List Tab ..................................................................................................... 28
Chapter 6. The File Menu ....................................................................................................... 30
6.1.
6.1.1.
6.1.2.
6.2.
6.3.
6.4.
6.5.
6.6.
6.7.
6.8.
6.9.
6.10.
6.10.1.
6.11.
6.12.
6.13.
6.14.
6.15.
6.16.
6.16.1.
6.16.2.
6.16.3.
6.17.
6.18.
6.19.
Open ......................................................................................................................... 30
Reading COMTRADE files................................................................................... 31
Reading ASCII/Text Files..................................................................................... 35
Site New ................................................................................................................... 37
Site Append .............................................................................................................. 37
Site Rename .............................................................................................................. 38
Site Delete ................................................................................................................ 38
Import Dranetz 658 .................................................................................................. 39
Import Nodelink ....................................................................................................... 39
Close ......................................................................................................................... 39
Save .......................................................................................................................... 39
Save As..................................................................................................................... 40
ASCII Export ........................................................................................................ 41
Print .......................................................................................................................... 42
Print Preview............................................................................................................ 43
Print Setup ................................................................................................................ 44
Print Snapshots ......................................................................................................... 46
Print Preview Snapshots........................................................................................... 46
Report Writer............................................................................................................ 47
Automatic Report Writer ...................................................................................... 49
Custom Report Writer .......................................................................................... 50
Custom Report Writer Options............................................................................. 51
File Properties .......................................................................................................... 69
File MRU List .......................................................................................................... 70
Exit ........................................................................................................................... 70
Chapter 7. The Edit Menu....................................................................................................... 71
2
Dran-View 6 User Guide
7.1.
7.2.
7.3.
7.4.
7.5.
7.6.
Undo ......................................................................................................................... 71
Redo ......................................................................................................................... 72
Cut ............................................................................................................................ 73
Copy ......................................................................................................................... 74
Paste ......................................................................................................................... 75
Select All .................................................................................................................. 75
Chapter 8. The View Menu..................................................................................................... 76
8.1.
8.2.
8.3.
8.4.
8.4.1.
8.4.2.
8.5.
8.6.
8.6.1.
8.6.2.
8.6.3.
8.6.4.
8.6.5.
8.7.
8.8.
8.9.
8.10.
8.11.
Instrument Setup ...................................................................................................... 76
Personal Notes .......................................................................................................... 76
Data List ................................................................................................................... 77
Toolbars.................................................................................................................... 79
Dran-View Professional Toolbars ....................................................................... 79
Dran-View Enterprise Toolbars........................................................................... 80
Event List Bar........................................................................................................... 82
Customize – Enterprise Edition Only...................................................................... 82
Customize Dialog - Commands Page................................................................... 83
Customize Dialog - Toolbars Page ...................................................................... 84
Customize Dialog - Keyboard Page..................................................................... 85
Customize Dialog - Menu Page ........................................................................... 86
Customize Dialog - Options Page – Enterprise Edition Only ............................. 87
Status Bar - Main Status Bar.................................................................................... 88
Status Bar - Axis Status Bar ..................................................................................... 88
Status Bar - Used Physical RAM Meter................................................................... 88
Create Snapshot ........................................................................................................ 88
Goto commands........................................................................................................ 89
Chapter 9. The Insert Menu .................................................................................................... 90
9.1.
9.2.
9.3.
9.4.
9.5.
9.6.
9.7.
9.8.
Insert Text Label ...................................................................................................... 90
Insert Picture ............................................................................................................ 90
Insert Phasor ............................................................................................................. 91
Insert DFT Chart ...................................................................................................... 92
Insert Statistics Grid ................................................................................................. 92
Insert Timeplot Chart ............................................................................................... 93
Insert Waveforms/Details Chart ............................................................................... 93
Insert Magnitude/Duratio n Chart ............................................................................. 94
Chapter 10.The Tools Menu .................................................................................................... 95
10.1.
10.2.
10.3.
10.4.
10.5.
10.6.
10.7.
10.8.
10.9.
Active Tool Move .................................................................................................... 95
Active Tool Autoscale.............................................................................................. 95
Active Tool Zoom In................................................................................................ 96
Active Tool Unzoom................................................................................................ 96
Active Tool Unzoom All.......................................................................................... 97
Active Tool Expand/Contract................................................................................... 97
Active Tool Pan........................................................................................................ 98
Active Tool Autozoom To Event ............................................................................. 98
Active Tool Delta Measurement .............................................................................. 99
3
Dran-View 6 User Guide
10.10.
10.10.1.
10.10.2.
10.10.3.
10.10.4.
10.10.5.
10.11.
10.11.1.
10.11.2.
10.11.3.
10.11.4.
10.11.5.
10.12.
10.12.1.
10.13.
10.13.1.
10.13.2.
10.14.
10.14.1.
10.14.2.
10.14.3.
10.15.
10.16.
10.17.
10.18.
10.18.1.
10.18.2.
10.18.3.
10.18.4.
10.18.5.
10.18.6.
Active Tool Area Marker ................................................................................... 100
Moving/Resizing the Area Marker Selection.................................................. 101
Use for DFT Chart selection fine-tuning ....................................................... 102
Use for Phasor selection fine-tuning.............................................................. 102
Use for Statistics Table selection fine-tuning................................................. 102
Use for Data Removal.................................................................................... 103
Format Template ................................................................................................ 104
Introduction.................................................................................................... 104
Format Template On/Off................................................................................ 105
Format Template Load................................................................................... 105
Format Template Save As .............................................................................. 105
Format Template Refresh............................................................................... 105
Harmonics/Timeplot Calculator ......................................................................... 106
Harmonics/Timeplot Calculator - Welcome Page ......................................... 108
Harmonic Scaling ............................................................................................... 115
Harmonics Setup Page ................................................................................... 116
Symmetric Components Page......................................................................... 119
Rescue Kit .......................................................................................................... 120
Probe Connections Dialog ............................................................................. 121
Scale Factors Dialog...................................................................................... 121
Time Dialog .................................................................................................... 122
Event Removal................................................................................................... 123
Harmonic Demo Tool......................................................................................... 124
Personal Information.......................................................................................... 125
Options ............................................................................................................... 126
Event List Page............................................................................................... 127
Restore Settings Page..................................................................................... 128
Clipboard Page .............................................................................................. 128
File Extensions Page...................................................................................... 129
Settings Page.................................................................................................. 130
Used HASPs Page .......................................................................................... 132
Chapter 11.Windows Menu ................................................................................................... 133
11.1.
11.2.
11.3.
11.4.
11.5.
11.6.
11.7.
Duplicate ................................................................................................................ 133
Cascade................................................................................................................... 133
Tile ......................................................................................................................... 133
Arrange Icons ......................................................................................................... 134
Close All................................................................................................................. 134
Window List ........................................................................................................... 134
Window .................................................................................................................. 135
Chapter 12.Help Menu ........................................................................................................... 136
12.1.
12.2.
12.3.
12.4.
Help Topics ............................................................................................................ 136
Context Help .......................................................................................................... 136
Dran-View Update ................................................................................................. 137
About DV6 ............................................................................................................. 138
4
Dran-View 6 User Guide
Chapter 13.Charts................................................................................................................... 139
13.1. Introduction............................................................................................................ 139
13.2. Axes........................................................................................................................ 141
13.2.1.
Introduction to Axes ........................................................................................... 141
13.2.2.
Chart Properties Dialog – Axis Page ................................................................ 144
13.2.3.
Axis Properties Dialog – General Page............................................................. 146
13.2.4.
Axis Properties Dialog – Options Page ............................................................. 147
13.3. Delta Measurement ................................................................................................ 148
13.3.1.
Chart Properties – Delta Page........................................................................... 148
13.4. Grid......................................................................................................................... 149
13.5. Event Rulers ........................................................................................................... 150
13.5.1.
Introduction to Event Rulers .............................................................................. 150
13.6. Legends .................................................................................................................. 151
13.6.1.
Introduction to Legends ..................................................................................... 151
13.6.2.
Chart Properties Dialog – Legend/Rulers Page ................................................ 152
13.7. Crosshair ................................................................................................................. 153
13.7.1.
Chart Properties Dialog – Crosshair Page ....................................................... 153
13.8. Markers................................................................................................................... 154
13.8.1.
Event Marker...................................................................................................... 154
13.8.2.
Area Marker ....................................................................................................... 154
13.8.3.
Chart Properties – Markers Page...................................................................... 155
13.9. Channels ................................................................................................................. 156
13.9.1.
Introduction to Channels.................................................................................... 156
13.9.2.
Chart Properties - Channel Colors Page........................................................... 160
13.9.3.
Chart Properties - Channel Plotting Page......................................................... 162
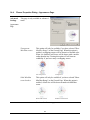
13.9.4.
Channel Properties Dialog – General Page ...................................................... 164
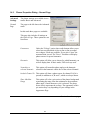
13.9.5.
Channel Properties Dialog – Appearance Page................................................ 165
13.9.6.
Channel Data Annotations (“Bubbles”)............................................................ 167
13.10.
Math Channels .................................................................................................... 169
13.10.1.
Math Channel Formula Editor....................................................................... 172
13.11.
Timeplot and Event Details/Waveform Chart Specific Information ................. 176
13.12.
DFT Chart Specific Information........................................................................ 177
13.13.
Magnitude/Duration Chart Specific Information............................................... 178
13.14.
Magnitude/Duration Limit Curve Page.............................................................. 179
Chapter 14.Phasors................................................................................................................. 180
14.1.
14.2.
14.3.
14.4.
14.5.
Introduction............................................................................................................ 180
Phasor Properties Dialog – Basic Page .................................................................. 182
Phasor Properties Dialog – General Page .............................................................. 183
Phasor Properties Dialog – Appearance Page ........................................................ 185
Phasor Properties Dialog – Harmonic Setup Page ................................................. 186
Chapter 15.Pictures ................................................................................................................ 187
15.1.
15.2.
Introduction............................................................................................................ 187
Picture Properties Dialog ....................................................................................... 188
Chapter 16.Statistics Table ..................................................................................................... 189
5
Dran-View 6 User Guide
16.1.
16.2.
16.3.
Introduction............................................................................................................ 189
Statistics Table Properties Dialog – General Page................................................. 190
Statistics Table Properties Dialog – Appearance Page .......................................... 191
Chapter 17.Text Boxes ........................................................................................................... 192
17.1.
17.2.
17.3.
Introduction............................................................................................................ 192
Text Box Properties Dialog – General Page .......................................................... 193
Text Box Properties Dialog – Appearance Page .................................................... 200
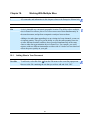
Chapter 18.Working With Multiple Sites .............................................................................. 201
18.1.
18.2.
18.3.
18.4.
18.5.
Adding Sites to Your Document ............................................................................ 201
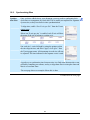
Synchronizing Sites................................................................................................ 202
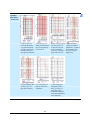
How Items Display Data From Many Sites ........................................................... 205
Multiple Sites in the Event List.............................................................................. 206
Multiple Sites and Tools ........................................................................................ 207
Chapter 19.Notes and Appendices ......................................................................................... 208
19.1. Notes on Harmonics............................................................................................... 208
19.1.1.
Harmonic Analysis -A Brief Overview............................................................... 208
19.1.2.
A word about conventions.................................................................................. 209
19.1.3.
Harmonic Series Expansion Equations.............................................................. 209
19.1.4.
Phase angles and Normalization........................................................................ 211
19.1.5.
Equations to recompute waveforms from Normalized Transforms.................... 214
19.1.6.
Power Dissipation Watts.................................................................................... 214
19.1.7.
Important Notes about θ: ................................................................................... 215
19.1.8.
Statement of Power Convention......................................................................... 215
19.1.9.
Harmonic Watts.................................................................................................. 217
19.2. Weighted Statistics ................................................................................................. 218
6
Dran-View 6 User Guide
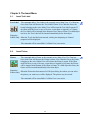
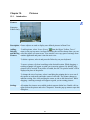
Chapter 1. Introduction
This manual contains information about the contents, installation and operation
of the Dran-View family of software packages.
Dran-View is available in two editions:
Dran-View Professional Focused on simplicity.
Dran-View Enterprise
Focused on flexibility and advanced possibilities.
Reads tabulated ASCII-files and COMTRADE IEEE
C37.111-1991/1999 compatible files.
This manual describes Dran-View features in both editions. A described feature
or functionality applies to both editions, unless otherwise stated. Sections marked
with
apply to Dran-View Enterprise Edition only.
When purchasing Dran-View, a set of software drivers are included to support
the features in the package. To find out about the Dranetz-BMI instrument(s)
compatible with your installation, use the Help-About command from the main
menu.
Dran-View views power quality data from the following Dranetz-BMI
instruments and TASKCards:
Legacy Package
PowerXplorer
Package
PQDIF/Signature
System Package
PQDIF Writer
TASKCard PQLite™, TASKCard 808
TASKCard® PQPlus™, TASKCard Flicker
TASKCard Motor Inrush, TASKCard 8000, 658 PQ
Power Analyzer
PowerXplorer® PX5, PX5-400, PowerGuide® 4400
Signature System InfoNode®, NodeLink®, other
PQDIF IEEE 1159-3 compatible data sources
Saves data in the PQDIF IEEE 1159-3 file format.
7
Dran-View 6 User Guide
1.1.
What’s new in Dran-View 6?
Enhancements for Professional and Enterprise edition:
Speed
Significantly faster waveform calculations and file loading.
Memory
Support for large data files and file-compression (half-size of original data) when
saving DV6 documents.
New User
Interface
Improved zoom and pan functions, drag-and-drop charts, insert pictures and
photos, customize toolbars, and more.
Flexibility
Customizable report presentations and math functions in a wide variety of
situations.
Undo/Redo
Unlimited Undo/Redo queue.
Built-in
Word
Processor
Features an internal word processor. Edit reports as they are generated, embed
text documents within Dran-View files, and more.
Improved
Scaling of
Harmonics
Use separate harmonic scaling for voltage, current, and power parameters. For
your convenience, there’s only one setting across the document. Re-scales
instrument generated as well as calculated harmonics.
Improved
Format
Templates
Format templates provide consistent layout and formatting.
Web Updates Automatic updates available via Internet.
Continued on the next page
8
Dran-View 6 User Guide
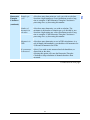
Enhancements for the Enterprise edition only:
Multiple Sites Presentation of up to 16 simultaneous data sets emanating from different
instrument models. This allows comparison of data from different sources in the
same chart. Performs mathematical calculations across sites.
Object
Oriented
Design
Supports an unlimited number of presentation aides such as charts, statistical
tables, and phasors in each window.
Drag-andDrop
Use simple, intuitive drag-and-drop function to manipulate screen items.
Waveform
Calculations
Supports a Harmonics/Timeplots Calculator for all file types resulting in more
accurate harmonic calculations, more calculated parameter, etc.
Snapshots
Allows fast and painless creation of print-queues or the restoration program
states.
Math
Channels
Features an improved point-and-click formula editor.
COMTRADE Reads IEEE C37.111-1991/1999 COMTRADE and TXT/CSV data files.
9
Dran-View 6 User Guide
Chapter 2. Getting Started
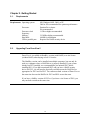
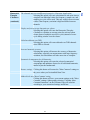
2.1.
Requirements
Requirements Operating system:
Processor:
Processor clock
frequency:
Memory:
Hard disk:
USB or parallel port:
2.2.
MS-Windows 98SE, 2000, or XP
2000 or XP recommended for optimum performance.
Pentium Pro or better.
P4 recommended.
1 GHz or higher recommended
512 MB or higher recommended
40 MB for installation
Required for HASP security device
Upgrading From Dran-View 5
Dran-View 6 is available in HardKey version (with HASP) or as site license
(without HASP) when buying at leas 11 licenses.
The HardKey version can be installed on multiple computers, but can only be
used on a computer where a HASP driver is properly installed. If your system
already has DV5 installed, we recommend that you uninstall DV5 before
installing DV6. If you did not uninstall DV5 and you have a HASP security
device for DV5, you will need to physically switch between the HASP device
appropriate for DV5 and for DV6. You cannot run both versions of Dran-View at
the same time because the HASPs for DV5 and DV6 are not the same.
If you have a SoftKey version of DV5 or if you have a site license of DV6, you
may run both versions at the same time.
10
Dran-View 6 User Guide
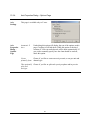
2.3.
Installing Dran-View
!
As with most USB devices, the HASP key should not be inserted until the
installation of Dran-View is complete! Keep the HASP keyed to the USB port
while using Dran-View!
Insert CD
Dran-View is delivered on a CD. Insert the CD into your CD-ROM player. If the
installation does not start automatically, select the disc drive where the DranView CD is inserted, and run the Setup.exe program.
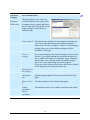
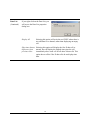
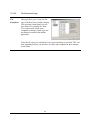
Welcome
Page
Select the language you wish to use
when installing Dran-View, and click
the “Next” button.
The selected language will also be the
default start-up language for DranView.
License
Agreement
Page
Please read the license agreement.
Once you have read and approved of its
terms, select the “I accept the terms of
the license agreement” option and click
the “Next” button.
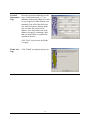
Wizard
Completed
Page
Please wait while the program installs.
Once this process is completed, you
will be shown this page. Click “Finish”,
insert your HASP key into a USB port,
and launch Dran-View 6 from the
program group “Dranetz-BMI Power
Suite” in the Start menu.
11
Dran-View 6 User Guide
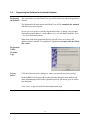
2.4.
Registering the Software for Automatic Updates
Registering
the Software
The second time you start Dran-View, you will be advised to run the Registration
Wizard.
The Registration Wizard ensures that Dran-View will be automatically updated
with the newest service packs.
In case you ever need to re-run the Registration Guide, or change your personal
information (postal address, e- mail address, etc.), you will find it under the Tools
> Personal Information menu.
When done with the Registration Wizard, you will receive an e- mail to the
address you have entered. To complete the registration you must click the link in
this e-mail.
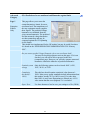
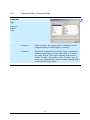
Registration
Guide Welcome
Page
Privacy
policy...
Click this button to open a dialog box where you can read our privacy policy.
Dranetz-BMI USA/Trinergi AB Sweden guarantee that your email address and
other information provided in the registration process will not be given or sold to
any third party.
Click "Next" to proceed to the Personal Information page.
Continued on the next page
12
Dran-View 6 User Guide
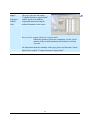
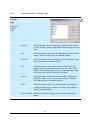
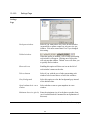
Personal
Information
Page
Enter the requested information on this
page. Fields marked with a "*" are
mandatory and must be filled in in order
for you to proceed. Other fields are not
mandatory, but will be help ful in case
you contact Customer Support. Make
sure you enter the correct e- mail
address. An e-mail will be sent to the
address you specify containing a link
that you must follow to complete the
registration process.
Click "Next" to proceed to the Thank
You page.
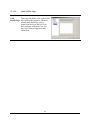
Thank You
Page
Click "Finish" to complete the process.
13
Dran-View 6 User Guide
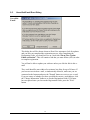
2.5.
Unverified E-mail Error Dialog
Unverified
E-mail
This dialog box will be shown whenever Dran-View attempts to look for updates
and you have not completed the registration process. After completing the
Registration Guide, you should receive an e-mail titled "Dran-View Update
Email verification". This will contain a link that you must follow (click) in order
to complete registration.
You will not be able to update your software unless you click the link in this email!
The e- mail should be sent within a few minutes, but allow for up to 24 hours. If
you have not received an e- mail, or inadvertently deleted it, make sure you are
connected to the Internet and press the "Resend" button to receive a new e- mail.
If you are unsure of whether you have specified the correct e- mail address, click
the "Change Information" button to re-run the Registration Guide. If 24 hours
have not passed since you last ran the Registration Guide, press the "Wait"
button.
14
Dran-View 6 User Guide
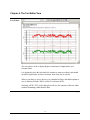
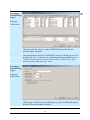
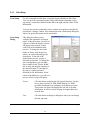
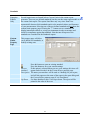
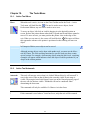
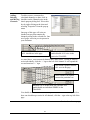
Chapter 3. The Main View
Left pane:
Timeplot chart
Two Panes
Event
List
Splitter
control
Right pane:
Waveform/
Event details.
Event ruler
To fully understand how to operate this program, it is important to know how the
items on the screen are tied together and how to manipulate them.
The document view (window) is divided into two panes. These panes are divided
by the splitter control (a vertical line between the panes).
The position of the splitter control can be changed, either by clicking and
dragging the splitter control to the left or right with the pointing device, or by
selecting one of the three split functions in the toolbar
.
The left pane shows the timeplot chart, and the right pane shows the waveform
chart or event details (in text), if available.
Continued on the next page
15
Dran-View 6 User Guide
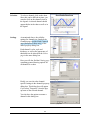
Events
At any time, only one event can be active (selected) in a document. To select a
particular event, pull down the event list (located in the toolbar). If you wish to
step back and fo rth between adjacent events, it is often easier to use the toolbar
buttons
.
Another way is to click on one of the triangles (each triangle indicates an event)
in the event ruler located above each chart.
The currently selected event is always marked in the charts with a vertical line. If
zoomed, the selected event is shown as a rectangle with shaded (Event Marker)
background.
Cross Hair
and
Coordinates
When you place the pointing device over a chart, it will show as a cross hair. The
coordinates for the cross hair are shown in the axis status bar indicators below
the chart in the lower right of the screen. The keyboard arrow keys may also
move the cross hair. The zoom functions and the delta measurement feature also
use the cross hair.
Axis Status
Bar
The status bar is displayed at the bottom of the Dran-View window. To display or
hide the status bar, see the View Main Status Bar command.
This status bar displays the value of each axis at the point where the cursor is, and
if it is visible, the Used Physical RAM meter as the rightmost indicator.
Main Status
Bar
The status bar is displayed at the bottom of the Dran-View window. To display or
hide the status bar, see the View Main Status Bar command.
This status bar displays, from left to right, explanations of various objects such as
toolbar buttons when you place the pointing device over them, the format
template in use (click this indicator to bring up the format template pop-up
menu), and the current states of the Caps-Lock, Num- Lock and Scroll-Lock keys
(click these indicators to toggle the states of these keys).
16
Dran-View 6 User Guide
Chapter 4. The Text Editor View
Text Editor
The text editor is used to display Reports, Instrument Configurations, and
Personal Notes.
It is designed to have the look-and- feel common to most text editors, and should
not differ significantly in form or function from what you are used to.
When a text editor is active, the Save As command will have the added options to
save in Microsoft Word (.DOC) or Rich Text Format (.RTF).
Selecting ASCII (.TXT) in the dialog box will save the contents of the text editor
(without formatting) rather than the data.
Continued on the next page
17
Dran-View 6 User Guide
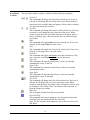
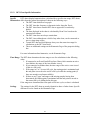
Text Editor
Toolbar
The top of this window contains a toolbar with the following commands.
Font Face
This command will change the font of the selected text. If no text is
selected, it will change the active font at the cursor. When clicked, a
drop-down list of available fonts will appear. Select a font by clicking
it, or press the Escape key to abort.
Font Size
This command will change the font size of the selected text. If no text
is selected, it will change the active font size at the cursor. When
clicked, a drop-down list of available font sizes will appear. Select a
font by clicking it, type a font size into the box, or press the Escape
key to abort.
Bold
This command will toggle bold text for the selected text. If no text is
selected, it will toggle bold text at the cursor.
Italic
This command will toggle italic text for the selected text. If no text is
selected, it will toggle italic text at the cursor.
Underline
This command will toggle underlined text for the selected text. If no
text is selected, it will toggle underlined text at the cursor.
Align Left
This command will align the selected rows, or the row currently
containing the cursor, to the left.
Align Center
This command will center the selected rows, or the row currently
containing the cursor.
Align Right
This command will align the selected rows, or the row currently
containing the cursor, to the right.
Text Color
This command will change the color of the selected text. If no text is
selected, it will change the active text color at the cursor. When
clicked, a drop-down list of available colors will appear. Select a color
by clicking it, click "More Colors" for advanced color selection, or
press the Escape key to abort.
Bullet List
This will toggle a bullet list at the cursor position.
Start MS-Word
This command will create a temporary .doc document and open the
word processor associated with the .doc extension.
Note: The file created is only temporary; you need to use Save-As in
MS-Word.
Continued on the next page
18
Dran-View 6 User Guide
Text Editor
Toolbar
(continued)
Tab Control
Under this toolbar you will find the tab control. This contains one triangular icon
at the top of the control , two at the bottom , and a number of icons
representing the tab positions . The topmost triangular icon represents the left
margin for the current paragraph. When you hit "Enter", the new line will start at
this position. The leftmost of the bottom triangular icons represents the
paragraph indent. This is where lines caused by soft line breaks will begin, i.e.
when the text gets too long and the editor automatically creates a new line. The
rightmost bottom triangular icon represents the right margin. The tab markers
are the positions of the tabs. When you press the "Tab" key on your keyboard, the
cursor will move to the next tab marker. To move the paragraph indent marker,
any tab marker, or the left or right margin markers, click their icons and drag
them to the desired position. To create a new tab marker, click the bar where you
want it to appear. To remove a tab marker, drag it off the bar.
19
Dran-View 6 User Guide
Chapter 5. The Event List Bar
Tabs
Event List
Bar
Event List Bar
The Event List Bar is positioned on the left hand side of the Dran-View window by
default. To make it visible you need to enable the Event List Bar toolbar button
,
or use the menu command View > Toolbars > Event List (Enterprise Edition Only).
The Event List Bar contains an Event List, and a Snapshot list for Dran-View
Enterprise Edition. To switch between these two lists, use the tabs located
underneath the Event List bar.
This window is a docking window, i.e. you may move it and attach it to any side of
the main Dran-View window.
Continued on the next page
20
Dran-View 6 User Guide
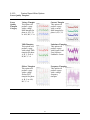
Event Types The Event List displays icons for different kinds of triggered events.
Icon
/
Event Type
Misc. waveform events
Sag (Low threshold crossed downwards)
Sag end (Low threshold crossed upwards)
Swell (High threshold crossed upwards)
Swell end (High threshold crossed downwards)
Swell-to-Sag (High and Low thresholds crossed downwards)
Sag-to-Swell (Low and High thresholds crossed upwards)
Swell-to-Severe Swell (High- High thresholds crossed upwards)
Severe Swell- to-Swell (High- High thresholds crossed downwards)
Sag-to-Interruption (Low-Low thresholds crossed downwards)
Interruption-to-Sag (Low-Low thresholds crossed upwards)
Interruption (Low and Low-Low thresholds crossed downwards)
Interruption end (Low-Low and Low thresholds crossed upwards)
Swell-to-Interruption (High, Low and Low-Low thresholds crossed
downwards)
Interruption-to-Swell (Low-Low, Low and High thresholds crossed
upwards)
Transient
Crest limit crossed
Unknown event
Aggregate (multi-phase) event of any type
Sags, Swells and Interruptions are usually further subdivided by duration
(Instantaneous (0.5 - 30 cycles according to IEEE 1159), Momentary (0.5 s/30
cycles depending on disturbance - 3 s according to IEEE 1159), Temporary (3 s 1 min according to IEEE 1159), and Sustained (more than 1 min according to
IEEE 1159)). Transients may be subdivided (examples are taken from
PowerXplorer) by direction (Upstream or Downstream), severity (Mild,
Moderate, Severe), duration (Impulsive, Notch, Multiple Notch, 1/8 Cycle,
Multiple 1/8 Cycle, 1/4 Cycle, Multiple 1/4 Cycle, Half Cycle, Full Cycle), or
type (Unipolar, Bipolar, Oscillating, Arcing, Multiple Z Crossings, Notching,
Dropout, Switch On, Switch Off, Phase Shift, DC, Capswitch, Flat Top, Peak
Limit, Amplitude Change or Miscellaneous). Other event types may have other
subdivisions.
Continued on the next page
21
Dran-View 6 User Guide
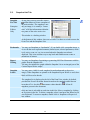
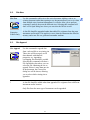
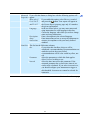
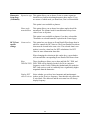
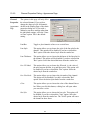
5.1.
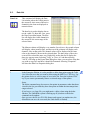
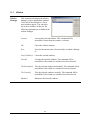
Event List Tab
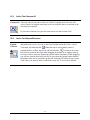
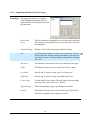
Event This tab contains an event list,
List
with the same contents as the pullTab
down version in the toolbar. This
event list has the benefit of being
visible all the time, and allows for
a number of customizations. Click
any event in the tree to make it the
active event.
The top of this window contains a
toolbar with the following
commands.
Event Removal On/Off
Use this command to remove events and the data associated with the particular
event(s). On each of the events in the Event List Tree, there will be a checkbox
indicating if the event is removed or not. When you have enabled or disabled the
particular events of your choice, press this toolbar button again to activate the event
removal. Any removal can be undone or changed by entering this mode again and
enabling events or disabling events from the list.
Event Subset
Use this command to only show the event types of interest in the Event List. This
filter does not remove any data; it’s a way to clean up the event list from events that
are of no concern to you at the moment.
In Dran-View Enterprise Edition, this command allows for finding and showing
Multi-Site events, i.e. events coinciding in two or more measurement points (sites).
Sort
Use this command to sort the Event List by Date or by Type. Sorting by Type
(actually the names of the events) is a useful way to see how many events of a
certain type exists.
Group By
Use this command to include branches in the tree. You may include tree branches
for every day, every event type, etc. Each branch is provided an icon to increase
readability.
View Information
Use this command to include/exclude details in events, i.e. the date for each event,
event characterization details, etc.
Search
Use this command to search for a certain string within the Event List.
!
Any customizations will also affect the pull-down Event List in the toolbar.
22
Dran-View 6 User Guide
5.1.1.
Event
Removal
Event List Tab Toolbar Commands detailed information
This command will toggle removal mode for the Event List. While in removal
mode, this toolbar button will look like this
. Checkboxes ( , or ) will
appear to the left of each item in the tree. The first time you enter removal mode,
it may take Dran-View some time to generate additional events. This is done so
that all samples will belong to an event.
While in removal mode, you may notice some events not otherwise visible, called
"Trend" and "Pre/Post Event". These are the generated events mentioned above.
Clicking a checkbox ( or ) next to an event will toggle the visibility of that
event and all samples belonging to it. Clicking the checkbox next to a branch of
any kind will toggle the visibility of all events and all samples descendant of that
branch. In addition to "On" ( ) and "Off" ( ), checkboxes next to branches may
have a third state, called "Tristate" ( ). This state indicates that some (not all)
descendants of that branch are visible.
Changes in event visibility will not take effect until you exit removal mode by
again pressing the Event Removal On/Off
toolbar button. The checkboxes
should now disappear, and the toolbar button should revert to this
appearance.
When disabling an event, that event will also disappear from the Event List, the
Event Box, each chart's event ruler, etc. If you wish to re-enable an event, simply
turn on the event removal again and click that event's checkbox.
To use an event removal more similar to that in Dran-View 5.x, right-click on the
Event List and select properties from the pop-up menu, then click the Event
Removal or Classic Event Removal tab. If the Event Removal appears, click the
Classic Mode checkbox at the bottom of the property page to view the classic
event removal.
Continued on the next page
23
Dran-View 6 User Guide
Event
Subset
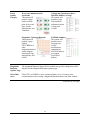
This command allows you to choose which events should be visible. Unlike the
event removal, this does not alter the data in your document. You will be
presented with the following options in a menu:
All Events
All Triggered Fault
Events
Sags/Swells/Interruptions
Transient Events
All events will be shown.
All events that resulted from anomalies are shown.
Multi-Site Events
Only events occurring in at least two sites at once are
shown.
Custom Selections...
This option will open the "Select subset of events"
dialog box with the following options:
Only sags, swells and interruptions are shown.
Only transients are shown.
Continued on the next page
24
Dran-View 6 User Guide
Event
Subset
Customize
Dialog
Sags/Swells/Interruptions This option will include sags, swells, and interruptions
in the event subset.
Transients
This option will include transients in the event subset.
Any other fault events
This option will include triggered events that are not
sags, swells, interruptions, or transients in the event
subset.
Events without trigger
This option will include events without trigger, such as
timed events and pre- or post-triggers.
Journal Triggers
This option will include the PowerXplorer family
instrument journal triggered events.
Any site
This option will show all selected events.
Two or more sites at the
same time (Multi-Site
Events)
This option will show only events occurring in at least
two sites simultaneously.
In one site only (not
This option will show only events occurring in one site
coinciding with events in but not any other.
any other site)
The event TYPE must be
exactly the same
If this option is selected, two events must have exactly
the same type to be considered coincident.
The triggered PHASE
If this option is selected, two events must be triggered
must be exactly the same on exactly the same phase to be considered coincident.
The triggering time must This option sets the time difference tolerance for two
not differ more than
events to be considered coincident.
25
Dran-View 6 User Guide
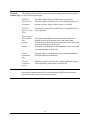
Sort
A dot
will appear next to the selected sort mode in the Event List Toolbar Sort
menu.
Sort Date/Time
This command will sort the Event List and Event Box in
Ascending
ascending date/time order.
Sort Date/Time
This command will sort the Event List and Event Box in
Descending
descending date/time order.
Sort by Event Type
This command will sort the Event List and Event Box in
alphabetical order.
Only one of the Sort Ascending, Sort Descending, and Sort Alphabetically options
can be used at a time.
Group By
These commands will toggle grouping for the Event List and the Event Box.
While a group mode is active, a checkmark
will appear to the left of the menu
item.
You can have three different kinds of grouping in the Event List and Event Box;
Group By Site, Group By Type, and Group By Day. The trees will branch in this
order. If you have selected all three options, the trees will branch primarily by site
(the
nodes will be the roots of each tree), secondarily by type (the nodes will
be children of the
nodes), and tertiary by day (the
nodes will be children of
the nodes).
Group By Site
When this mode is active, a site icon ( ) will appear as a root
node for each site in the Event List and the Event Box. The
nodes of all events pertaining to a site are now descendants of
the root representing that site. To remove the site nodes, select
this option again.
Group By Type This command will toggle type grouping for the Event List and
the Event Box. While this mode is active, a type icon ( ) will
appear as a parent node for each event type in the Event List and
the Event Box. The nodes of all events pertaining to a type are
now descendants of the parent representing that type. To remove
the type nodes, select this option again.
Group By Day This command will toggle day grouping for the Event List and
the Event Box. While this mode is active, a day icon ( ) will
appear as a parent node for each day in the Event List and the
Event Box. The nodes of all events pertaining to a day are now
descendants of the parent representing that day. To remove the
day nodes, select this option again.
Continued on the next page
26
Dran-View 6 User Guide
View
This command will show and hide the information about each event in the Event
Information List and the Event Box. While an option is active, a checkmark
will appear to
the left of the menu item. To remove the information, select the option again. The
checkmark
and the information should disappear.
View Event Number
View Date
View Time
View Extra
Information
Search
This command will show and hide the event number for
each event. While it is active, a # symbol followed by a
number will appear to the left of each event in the Event
List.
This command will show and hide the date of each event.
While it is active, a date will appear to the left of each
event in the Event List and the Event Box.
This command will show and hide the time of each event
in the Event List and the Event Box. While it is active, a
time stamp will appear to the left of each event in the Event
List and the Event Box.
This command will show and hide additional information
for each event in the Event List and the Event Box. While
it is active, additional information will appear to the right
of each event in the Event List and the Event Box.
This command will show and hide the
search dialog window.
From left to right, there are three controls in the search dialog:
To search for an event, select a previous search string from the
combo box or type a new search, and then press one of the
search buttons.
The string you enter is literally interpreted, though search
function is case insensitive. Any event that has a description,
including event number, date, time, and characterization
information visible in the Event List and the Event Box that is
partly or fully equal to the search string is considered a match. If
you wish to search for event number, day, time or
characterization information, and this information is not visible,
see View Event Number, View Date, View Time, and View Extra
Info, respectively.
Search backwards relative to the current active event.
Search forwards relative to the current active event.
27
Dran-View 6 User Guide
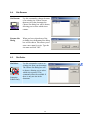
5.2.
Snapshot List Tab
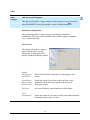
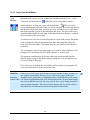
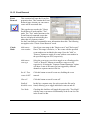
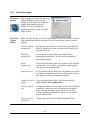
Snapshot
List Tab
Enterprise
Edition
Only
At any time you may press the camera
toolbar button to create a snapshot of
the main window. The snapshot is not
only an image; it is actually a “frozen
state” of all the information within the
two panes of the active main view.
This window is a docking window.
At the bottom of this window, there are two tabs. Use these to switch between the
Event Tree and the Snapshots List.
Bookmarks
You may use Snapshots as “bookmarks”. If you double-click a snapshot image, a
view with the exact replicated contents (charts layout, selected parameters, zoom
level, active event, etc.) as it was stored when the Snapshot was taken is
displayed. This is an excellent way to step back and forth between events or
parameters of interest.
Report
Writing
You may use Snapshots for printing or generating MS-Word documents with the
graphs from the Snapshot list.
You may also include the graph within the Snapshot List as an integral part of the
Custom Report Writer output.
Snapshot
Labels
You may enter a label for each snapshot (located underneath each preview
image). When Snapshots are printed or the Snapshots Report Writer is used, these
labels will be used as header.
The snapshot list is displayed to the left of the Dran-View window by default,
provided the Event List toolbar button located on the standard toolbar has not
been shut off (i.e. has this
appearance rather than this
). It lists all
snapshots present in the document.
Only one item is selectable at each time in this list. Select a snapshot by clicking
on its picture in the list. To delete a snapshot, select it and press the Delete key on
your keyboard. To restore a snapshot, double-click it. Snapshots will open in a
new window.
Continued on the next page
28
Dran-View 6 User Guide
Snapshot
List Tab
(continued)
The top of this window contains a toolbar with the following commands:
Print Snapshots
This command will show the Printer Selection dialog box.
Print Preview Snapshots
Preview the snapshots as they will be printed.
Create Document
This command will create an .rtf document containing all snapshots in the
snapshot list and open it in a Dran-View text editor window.
Word Processor
This command will create a .doc document containing all snapshots in the
snapshot list and open the word processor associated with the .doc
extension.
Note: The file created is only temporary; you need to use Save-As in MSWord.
Edit Snapshot Label
This command will allow you to edit the label of the snapshot selected in
the snapshot list. You can also do this by clicking the label area below the
selected snapshot.
Move Down
This command will move the selected snapshot down one step in the
snapshot list.
Move Up
This command will move the selected snapshot up one step in the snapshot
list.
Delete Snapshot
This command will delete the snapshot selected in the snapshot list.
Create Snapshot
This command will create a snapshot from the currently active main vie w of
the document.
The new snapshot is added last to the snapshot list.
29
Dran-View 6 User Guide
Chapter 6. The File Menu
6.1.
Open
Open
Selecting this command will show a File-Open dialog box where you can select
the file(s) to open. Opening a file will create a new document.
Dran-View can open files created by many different instruments. Dran-View
converts the file to a Dran-View 6 format while reading/opening the file. To open
a file, select the filename and press OK to start the conversion process.
Depending on what instrument drivers you have installed and what Dran-View 6
edition you have purchased (Professional or Enterprise), Dran-View will read one
or more of the following file formats:
•
•
•
•
•
•
•
•
•
•
•
•
••
Dran-View 6 files with the extension .DV6
Dran-View 5.x files with the extension .DNV
PQLite TASKCard files with the extension .MDB or .EVT
PowerXplorer files with the extension .DDB
PowerGuide files with the extension .DDB
PQPlus TASKCard files with the extension .MDB or .EVT
Flicker TASKCard files with the extension .MDB or .EVT
Task808 TASKCard files with the extension .MDB or .EVT
PQPlus TASKCard remote files, downloaded by serial link or modem with the extension
.DAT (with some restrictions)
658 PQ ANALYZER files with the extension .658 or .$$$
TASKCard Inrush with the extensions .INR or .MIR
Dranetz 808, 8000, 8000-2 or TASKCard 8000 files with the extensions .TXT, .21, .28,
.29B
COMTRADE files with the extension .CFG (Enterprise Edition only)
TEXT files with the extension *.TXT, *.SKV, *.CSV (Enterprise Edition only)
•
Note:
When opening a file, the Calculate Harmonics/Timeplot progress indicator and/or
the Harmonic Rescaling progress indicator may appear, depending on your
settings in the Calculate Harmonics/Timeplot Welcome page and the ChartHarmonics-Setup page/Symmetrical Components page, respectively.
Open
Command
Multiple files can be opened if you hold down the SHIFT or CTRL keys and click
on another filename(s). Click OK to load the file selections automatically.
30
Dran-View 6 User Guide
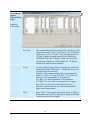
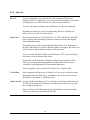
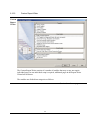
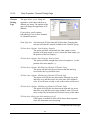
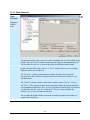
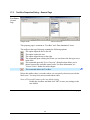
6.1.1.
Reading COMTRADE files
COMTRADE When opening a COMTRADE (.CFG) file, the COMTRADE Text Import
Wizard will help you define the data.
Enterprise
Edition Only COMTRADE is commonly used to store waveshapes from relay protection
systems.
A COMTRADE “file” is actually a pair of two files (.CFG and .DAT). The
leading file name must be identical for the two files and both must reside in the
same folder.
The flexibility offered in the COMTRADE file format generates some problems
for Dran-View and the user since Dran-View wants to have all data thoroughly
defined. Once you have gone through the import wizard, the setup you have
made will be stored for future use. In the future, when a COMTRADE file
contains a channel with the same name as you have previously defined, it will
suggest that particular setup. When setting up the grid, you should adjust the
combo boxes left to right, because adjustments may be made on any settings to
the right of the one you are modifying on the fly.
The options in the grid are derived from the specification of PQDIF (IEEE11593), which is the way Dran-View internally defines channels when reading an
instrument file.
The first column contains a checkbox. If this checkbox is disabled, the data will
not be imported.
Continued on next page
31
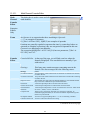
Dran-View 6 User Guide
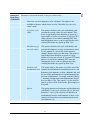
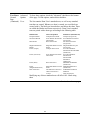
COMTRADE
Import
Wizard Dialog
Page 1
Enterprise
Edition Only
Data Type
This column defines the basic nature of the sampling rate. For
a waveform channel, select “Y-Waveform”, for a Trend (like
a RMS value), select “Y-Trend”. The remaining options are
“X-Time” which you should not use for any channel in a
COMTRADE file and “Y-Digital” which is used to denote
Digital status channels in a COMTRADE file. “Y-Digital”
should not be used for analog channels.
Group
Use this setting to group parameters together into individual
measurement points. The number “1” should always be used
for single-point measurements.
Example: A file contains voltages from two measurement
points: AV1, BV1, CV1 and AV2, BV2, CV2. In this case,
you need to set Group number=1 for parameters
AV1,BV1,CV1 and Group number=2 for parameters
AV2,BV2,CV2. As a result of using more the one group,
there will be several sites created in the Dran-View 6
document, wherein each site will contain an individual 3phase system measurement.
Prefix
Select “None” if the channel is not scaled. Select ‘k’ (kilo) if
the data has been divided by 1000 prior to being stored (other
Greek prefixes are also available).
Continued on the next page
32
Dran-View 6 User Guide
COMTRADE Unit
Import
Wizard Dialog
Page 1
Characteristics
(Continued)
Select the basic quantity UNIT of the channel (Volts, Amps,
Watts, etc.)
This column defines the characteristics of the channel.
Waveform channels should always be set to “Instantaneous”.
Trend channel should always be set to anything else from the
list, i.e. “RMS”, etc.
Enterprise
Edition Only
Phase
This column defines the phase of the channel.
“A”, “B”, “C”
“AB”, “BC”, “CA”
“RES”
.
“TOT”
“NET”
“LN-Ave”
“LL-Ave”
“Worst”
“1”- “64”
Signal measured between
phase and neutral
Signal measured between two
phases
Residual (normally used for
residual current)
Total
Net (normally used for net
current)
Line-Neutral Average
Line-Line Average
Typically denotes the “Worst”
phase
64 arbitrary phases you may
use if the above is not
covering your needs
Measured
This column should answer the questio n “What is
measured?”.
Typically this is “Voltage” or “Current”.
Value Type
Choose value type. If you are unsure of what to choose,
“value” is recommended.
33
Dran-View 6 User Guide
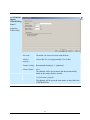
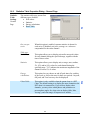
COMTRADE
Import
Wizard Dialog
Page 2
Enterprise
Edition Only
Site name
The name you want to associate with the data.
Nominal
frequency
Correct this if it is wrong (normally 50 or 60 Hz).
Nominal voltage
Recommended setting is –1 (unknown).
Channel Names
Auto
The channels will be give n names and units automatically
based on the setups you have entered.
Use field names from file
The channels will be given the same names as they had in the
COMTRADE file.
34
Dran-View 6 User Guide
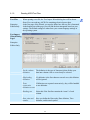
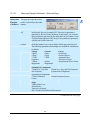
6.1.2.
Reading ASCII/Text Files
Text Files
Enterprise
Edition Only
When opening a text file, the Text Import Wizard dialog box will be shown.
Dran-View can read any ASCII file containing electrical power data.
In the first page of the Wizard, you need to define how the text file is formatted.
In the bottom part of the page you will find the data interpreted based on your
settings. The default settings are taken from your current language settings in
the operating system.
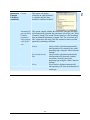
Text Import
Wizard Dialog
Page1
Enterprise
Edition Only
Set the column
delimiters
The delimiter is the type of character(s) that divides your
data into columns. One or several may be selected.
Skip leading
delimiters
If a delimiter is the first character on each row, this delimiter
will be ignored.
Treat
If delimiters are repeated consecutively, they will be handled
consecutive
as one delimiter.
delimiters as one
Heading row
Select this if the first line contains the “name” of each
column.
Date, time and
number
Here you define the Date order, Date delimiter, Time
delimiter, and decimal symbol.
35
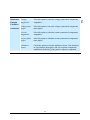
Dran-View 6 User Guide
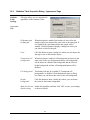
Text Import
Wizard Dialog
Page 2
Enterprise
Edition Only
This page works the same way as the COMTRADE Import Wizard. See
previous chapter for details.
!
The major difference from the COMTRADE version you should be aware of is
that the “Data Type” of the first row (containing timestamps) should be set to
“X-Time”, Prefix=None, Unit=None, Characteristics=None, Phase=None,
Measured=None, and Value Type=Value.
Text Import
Wizard Dialog
Page 3
Enterprise
Edition Only
This last page of the Wizard works the same way as the COMTRADE Import
Wizard. See previous chapter for details.
36
Dran-View 6 User Guide
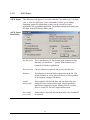
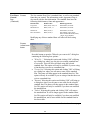
6.2.
Site New
Site New
Enterprise
Edition Only
6.3.
Use this command to add a site to the active document. Adding a site to an
existing document rather than opening a new document allows you to view data
from multiple sites (locations/instruments). It will also allow you to perform
comparative analysis between the different sites. Selecting this command will
show a File Open dialog box where you can select the file/site to add.
A data file should be appended rather than added if it originates from the same
instrument and location. This applies in cases when the instrument has filled its
memory and a new file was generated on another medium.
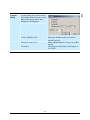
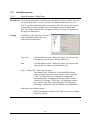
Site Append
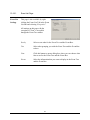
Site Append
Use this command to append data
from a selected file to an existing site.
These sites will be merged, as will
data channels with identical
properties, etc. Appending
overlapping files should be avoided.
Selecting this command will show a
File Open dialog box where you can
select the file containing the site to
append. If there is more than one site
in the document, the Choose Site
dialog box will be shown, allowing
you to select which existing site to
append to.
!
A data file should be added rather than appended if it originates from a different
instrument and/or location.
Only files from the same type of instrument can be appended.
37
Dran-View 6 User Guide
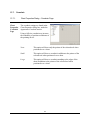
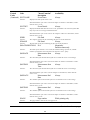
6.4.
Site Rename
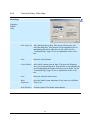
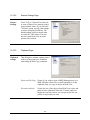
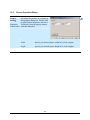
Site Rename
Use this command to change the name
of an existing site. If there is more
than one site in the document, the
Choose Site dialog box will be shown,
allowing you to select which site to
rename.
Rename Site
Dialog
When you have selected one of the
available sites, the Rename Site dialog
box will be shown. This allows you to
enter a new name for a site. Type the
site name and click "OK".
6.5.
Site Delete
Site Delete
Enterprise
Edition Only
Use this command to remove an
existing site from your document.
The Choose Site dialog box will
be shown, allowing you to select
which site to remove. This
command will not be available if
there is only one site in the
document.
38
Dran-View 6 User Guide
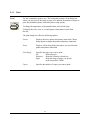
6.6.
Import Dranetz 658
Import
Dranetz 658
Legacy Driver
Required
6.7.
Import Nodelink
Import Node Link
Signature
System Driver
Required
6.8.
Selecting this command will open a dialog box where you can choose to import
data from a 658 diskette or 658GHA database. Insert the diskette into the
selected disc drive and click "OK" on the first page, or select the database you
wish to use on the second page and click "OK". If the database is not located on
the selected drive, select the correct drive and click "Search".
Selecting this command will open a dialog box where you can choose to import
data from a NodeLink site. Select the file in the tree directory, and click
"Download History". Select the file to open and click "OK". You must have
Nodelink installed in your computer to use this command.
Close
Close
Use this command to close all windows containing the active document. DranView 6 suggests that you save changes to your document before you close it. If
you close a document without saving, you lose all changes made since the last
time you saved.
See also
Window – Close All
6.9.
Save
Save
Use this command to save the active document to its current name and
directory. When you save a document for the first time, Dran-View 6 displays
the Save As dialog box so you can name the file. If you want to change the
name and directory of an existing file before you save it, choose the Save As
command.
39
Dran-View 6 User Guide
6.10.
Save As
Save As
Use this command to save and name the active document. Dran-View 6
displays the Save As dialog box so you can name your document. If you select
an existing file, you will be asked if you wish to overwrite that file.
To save a file with its existing name and directory, use the Save command.
Depending on what view you are currently using, the Save As dialog box
allows you to save files in various format:
Main View
Dran-View 6 can save in .DV6 (Dran-View 6), .TXT (ASCII text), and .PQD
(Power Quality Data Interchange) format. It cannot save data in the original
native instrument format.
Documents saved as .DV6 retain information about their views in addition to
the data. When the file is opened, identical windows will appear, the same event
will be selected, and the topmost window will be the same.
If you save data in PQDIF (.PQD) or ASCII format (.TXT), some data may be
lost such as event descriptions and details.
Saving data in ASCII format will display the Data Export dialog box. This
allows you to cha nge formatting options for tabular data so that it can be
viewed by certain applications like spreadsheet application.
Format templates can be saved as .DVT (Dran-View Template) files.
Text Editor
In the integrated word processor of Dran-View 6, you may save the text in the
file formats offered by Main View. In addition, you can also save the text as
RTF (Rich Text Format) or MS-Word (.doc).
Data List View Saving a file from the Data List View will only save the data visible in the list.
The file will be saved in ASCII format. You also have the option to save only
the currently selected rows.
Once you have selected the proper file type and filename, select the location
where you wish to save your file and click OK.
40
Dran-View 6 User Guide
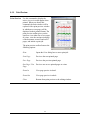
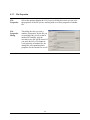
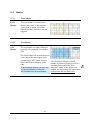
6.10.1.
ASCII Export
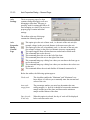
ASCII Export
This dialog box will appear if you select either the Copy (Data List), Cut (Data
List), or Save As ASCII (any views) commands. It allows you to change
formatting options for tabular data so that it can be viewed by certain
applications like spreadsheet application. The default settings in this dialog box
are taken from the Windows control panel.
ASCII Export
Data Dialog
Decimal point
This is the character for the decimal point in numerical data.
Normally you should use "." (point). Some countries use ","
(comma) in Windows applications.
Data selection Choose whether to export all data or only selected rows.
Delimiter
This character is inserted between data items in the file. The
default delimiter in use by Microsoft Excel is TAB regardless
of the language settings of Windows.
Include
milliseconds
If this option is checked, the date and time format for time
stamps will also contain milliseconds. Not all spreadsheet
applications support this format. Microsoft Excel versions,
prior to version 5.0, do NOT support milliseconds.
One sample
per second
If this option is selected, only one data point every second will
be exported.
41
Dran-View 6 User Guide
6.11.
Print
Print
Use this command to print a view. This command presents a Print dialog box,
where you may specify the range of pages to be printed, the number of copies to
print, the destination printer, and other printer setup options.
To change the appearance of the printed header, select Print Setup.
To display the active view as it would appear when printed, select Print
Preview.
The print dialog box offers the following options:
Printer
Displays the active printer and printer connection. Choose
Setup option to change the printer and printer connection.
Setup
Displays a Print Setup dialog box where you can select the
printer and printer connection.
Print Range
Specifies the pages you want to print:
All
Prints all pages.
Selection
Prints the currently selected text.
Pages
Prints the range of pages you specify
in the From and To fields.
Copies
Specifies the number of copies you want to print.
42
Dran-View 6 User Guide
6.12.
Print Preview
Print Preview
Use this command to display the
active view as it would appear when
printed. When you choose this
command, the main window will be
replaced with a print preview window
in which one or two pages will be
displayed in their printed format. The
print preview toolbar gives you the
option to view either one or two pages
at a time, view the next/previous page
of the document, zoom in and out of
pages, and initiate a print job.
The print preview toolbar features the
following options.
Print
Opens the Print dialog box to start a print job.
Next Page
Previews the next printed page.
Prev Page
Previews the previous printed page.
One Page / Two
Page
Previews one or two printed pages at a time.
Zoom In
View page preview in detail.
Zoom Out
View page preview in whole.
Close
Returns from print preview to the editing window.
43
Dran-View 6 User Guide
6.13.
Print Setup
Print Setup
Use this command to define how your printed pages should look like. DranView can provide a rectangular frame along with a header containing a logotype image, a multi- line centered header and to the right, and three lines of file
information.
You may also use this command to select a printer and a printer connection by
pressing the “Settings” button. This command presents a Print Setup dialog box,
where you specify the printer and its connection.
Print Setup
Dialog
This dialog box allows you to
configure the appearance of printed
pages. At the top section, you will see
a preview of how the header or footer
will appear once printed. Control
codes will not be translated in the
preview. To change the text in the
header or footer, click the preview
where you wish to edit and type the
desired text. To the left of the
header/footer preview, a space is
allocated for a picture. To change this
space configuration, you can either
type a number in the "Picture Width"
box or click and drag the separator to
the desired location. To the right of
this space, a similar portion is
allocated for file information. At the
center of the dialog box, you will see a
preview of how a page will appear.
Picture
Click this button to display the File Open dialog box. Use this
box to select a picture in .DIB, .BMP (bitmap), or .WMF
(metafile) format that you can display in the header or footer.
This picture will always be displayed to the left of all other
information. It will be resized, keeping its height/width ratio,
to fit the box.
Font
Click this button to display a dialog box where you can change
the font type used.
Continued on the next page
44
Dran-View 6 User Guide
Print Setup
Dialog
Code
Click this button to display a dialog box containing a list of
control codes. Select a control code and click "OK" to insert
that code at the cursor's position.
Picture Width
This option allows you to change the width of the picture to the
left of the header/footer. You can also change the width by
clicking and dragging the separator to the desired location.
Margins
These input boxes allow you to change the top, bottom, left,
and right margins on the print-out.
Unit
Specify the picture width and margins in centimeters or inches.
Unit selection will automatically convert the values.
Information
Width
This option allows you to change the width of the information
area to the right of the header/footer. You can also change the
width by clicking and dragging the separator to the desired
location.
Orientation
Choose between landscape or portrait page orientation.
Show page
header
Disabling this option will hide the header/footer.
Header at
bottom
Selecting this option will display a footer instead of a header.
Show frame
lines
Disabling this option will hide the borders surrounding each
box in the header/footer and the page itself.
Settings
Click this button to display the standard “Printer Settings"
dialog box.
Store as
default
Click this button to save your current print settings as the new
default.
Load default
Click this button to restore the default print settings.
(Continued)
Restore factory Click this button to restore all settings to the default values
settings
when Dran-View was first installed.
45
Dran-View 6 User Guide
6.14.
Print Snapshots
Print
Snapshots
Enterprise
Edition Only
Use this command to print all your snapshots on one page each. This command
presents a Print dialog box where you can specify the range of pages to be
printed, the number of copies to print, the destination printer, and other printer
setup options.
To change the appearance of the printed header, select Print Setup.
To see the snapshots as they would appear when printed, select Bookmark Print
Preview.
6.15.
Print Preview Snapshots
Print Preview
Snapshots
Use this command to display your snapshots as they would appear when
printed. When you choose this command, the main window will be replaced
with a print preview window in which one or two pages will be displayed in
their printed format. The print preview toolbar offers you options to view either
one or two pages at a time, view the next/previous page in the document, zoom
in and out of pages, and initiate a print job.
Enterprise
Edition Only
46
Dran-View 6 User Guide
6.16.
Report Writer
Report
Writer
This command will show
the Report Writer Selection
dialog box, where you can
choose the kind of report to
generate. To run Report
Writer, you will step
through the Report Writer
Wizard. Different pages will
appear depending on the
options you select.
The selections that you enter
in the Report Writer Wizard
will be stored in the
document until the next time
you run the wizard.
When you save your document as a DV6 file, all your Report Writer settings will
be stored.
When done with the wizard setup, an RTF (Rich Text Format) document will be
created and the contents of the document will be displayed in the built- in text
editor.
Report
Writer
Selection
Dialog
Select method of report
generation:
Select the Report Writer you want to use (Automatic
or Custom)
Start date/time
End date/time
Default to the current time boundaries of the zoom in
the TIME-PLOT chart of Dran-View when the
Report Writer was started. You may change these
values to set an exact time-range of data for the
Report Writer to Process.
Other settings:
Create report for: All sites In Dran-View Enterprise Edition, you can have
/specific site
several Sites (measurements) within the same
document. This option lets you decide whether to
produce output pages for all sites or one specific site
within the document.
Continued on the next page
47
Dran-View 6 User Guide
Report
Writer
Selection
Dialog
(Continued)
First page number
Sets the first page number of the printouts. This is useful if
you plan to use Report Writer printouts as an appendix to
other documentation. This page number will be inserted
whenever the “$PAGE” control code is found in the
DRAN-VIEW Print Setup. For example, if you wish to
label your first page “APPENDIX A:1” , manually edit the
Print Setup dialog box and insert “APPENDIX A: $PAGE”
in the page header field.
Allow colored text
If you select this option, you can specify certain text in
color. If not selected, all text will be black. This setting
does not affect the color of generated charts or other
pictures.
Report Writer
settings:
Open…
This button allows you to load a previously stored report
settings file (.REP).
Save…
This button allows you to save the current settings into a
report settings file (.REP).
Site
Select which site to modify using the controls below.
Nominal Voltage
Use to change the nominal voltage value.
Nominal Frequency Use to change the nominal frequency value.
48
Dran-View 6 User Guide
6.16.1.
Automatic Report Writer
Automatic
Report
Writer
The automatic Report Writer will analyze the instrument configuration and
suggest a suitable report mode for your measurement. You have the option to
change the report mode. The report mode will affect the type of pages produced
by the Automatic Report Writer.
Pressing “Done” will produce a report in the integrated text editor. From there,
you may choose to edit, print, or save the report.
49
Dran-View 6 User Guide
6.16.2.
Custom Report Writer
Custom
Report
Writer
The Custom Report Writer consists of a number of modules that may or may not require
individual setup. In case individual setup is required, additional pages in the Report Writer
Wizard will be shown.
The modules are divided into categories as follows:
Continued on the next page:
50
Dran-View 6 User Guide
6.16.3.
Custom Report Writer Options
Power Quality Timeplots
Power
Quality
Timeplot
Category
Voltage Timeplot
This option will
produce a page
with a voltage
RMS timeplot for
phase A, B, C, D
or A-B, B-C, C-A.
Current Timeplot
This option will
produce a page
with a current
RMS timeplot for
phase A, B, C, D.
THD Timeplots
This options will
produce a page
with voltage THD
timeplot for phase
A, B, C, D or AB, B-C, C-A.
Unbalance Timeplots
This option will
produce a page
with Negative and
Zero Sequence
Unbalance factors.
Flicker Timeplots
This option will
produce a page
with a voltage
flicker (PLT)
timeplot for phase
A, B, C or A-B,
B-C, C-A.
Frequency Timeplots
This option will
produce a page
with a voltage
frequency
timeplot.
51
Dran-View 6 User Guide
Power Quality
Power
Quality
Category
Quality of supply histograms
This option will
produce a page
with 5%, 95%, and
99% probability
values for the
following
parameters:
Voltage, VTHD,
ITHD, Voltage
Unbalance Factors,
and Frequency.
Activity charts for Sags, Swells,
Interruptions and Transients
This option will
produce a page
with all Sags,
Swells,
Interruptions, and
Transients
presented in counts
(Y), along a 24
hour X-axis.
THD Timeplots for Voltage and
Current, with worst case spectra
This option will
produce one
page/phase with
timeplots of
VTHD and ITHD
plus harmonic
spectra bar charts,
showing the
harmonic contents
at the point in time
where VTHD and
ITHD respectively,
have the highest
magnitude.
Worst case summaries without
waveforms
This option will
produce a page
consisting of tables
with the four worst
Sags, Swells,
Interruptions, and
Transients. The
tables are sorted
according to
severity of event.
The tables also
contain
information about
magnitude,
duration, and when
the events
occurred.
Continued on next page
52
Dran-View 6 User Guide
Power
Quality
Category
Worst case summaries with
waveforms
This option will
produce a page
with waveform
plots of the worst
Sags, Swells,
Interruptions, and
Transients.
Voltage and Current per phase:
Min,Max,Median, Average
This option will
produce a page
with statistical
information about
Voltage and
Current.
Magnitude / Duration Diagram
This option will
produce a page
with an
ITIC/CBEMA or
other
magnitude/duration
scatter diagram,
showing all Sags,
Interruptions, and
Swells.
EN50160 Summary
This option will
produce one or
two pages per
weekly
measurement,
containing an
EN50160 analysis
in a simple
PASS/FAIL
fashion.
Magnitude/
The Magnitude/Duration Report Writer module has specific settings that will be
Duration
displayed in the Magnitude/Duration options page.
Options Page
Select limit
curve
Select ITIC or CBEMA or your customized limit curves. You may create
customized limit curves using a Magnitude/Duration chart in the main window.
Continued on next page
53
Dran-View 6 User Guide
EN50160
The EN50160 Report Writer module has specific settings that will be displayed
Options Page in the EN50160 options page.
EN50160
Report by the
Instrument
The PowerXplorer family of instruments can generate
EN50160 reports if properly set up. Selecting this option will
print the overview pages of these reports, if available
EN50160
Selecting this option will run Dran-View’s internal EN50160
Report by Dran- report generator.
View)
Weeks begin at:
Measurement
This option will subdivide the measurement in full weeks,
start
starting from the selected start time of the report range.
Monday
This option will divide the measurement into weeks, were each
week starts Mondays at 00:00 (am).
Sunday
This option will divide the measurement into weeks, were each
week starts Sunday at 00:00 (am).
!
Include
information
page
You may enable a second printed page containing additional
EN50160 indicative information.
Exclude
incomplete
weeks
When this option is selected, only complete EN50160 reports
will be generated. Partial weeks are discarded
Note that the instrument must be set up according to EN50160 measurement
intervals in order to arrive at the correct analysis.
54
Dran-View 6 User Guide
Power Quantity
Power
Quantity
Demand and Energy Timeplots
This option will
produce a page
with Demand and
Energy timeplots.
Phase and Total values for Power,
Demand and Energy
This option will
produce a page
containing a table
with statistical
information
related to Power,
Demand, and
Energy
parameters.
55
Dran-View 6 User Guide
Other
Other
Category
Add user-created Snapshot
This option will produce a range of pages with the contents of your previously
stored SNAPSHOTS (using the snapshot “camera” toolbar button
).
Instrument configuration
This option will produce a range of pages containing the instrument
configuration. This is the same information shown when using the command
View > Instrument Setup
List of events
This option will produce a range of
pages containing the event list
information. A setup page will be
displayed with the following content.
Include:
All triggered
fault events
This will only include events that are fault-triggered (not
timed).
Actual Event
Subset used in
the Event List
Enable this option if you want to show only the events
included by the Event Subset option in the Event List
Workspace toolbar.
All events
All events within the report timeframe will be shown.
View:
Event Details
Enable this option if you want to include event characterization
information in the report of events.
56
Dran-View 6 User Guide
Advanced
Advanced
Category
Enterprise
Edition only
User Selected Timeplots
This option allows you to plot any timeplot parameter in your Report. The setup
page is virtually the same as the Channel Selection page of a timeplot chart, but
may contain some of the additional options described below.
Page per phase
This additional checkbox allows you to choose how to
generate the pages in terms of rows or columns. If the
checkbox is unchecked, there will be one page generated for
each parameter row. If checked, there will be one page
generated per column.
In this case (page per phase is off)
there will be five pages generated. The
first page will contain timeplots for
phase A, B and C for parameter
VHG03. The second page will contain
timeplots for phase A, B and C for
parameter VH05 etc.
In this case (page per phase is on) there
will be three pages generated. The first
page will contain timeplots for phase A
showing parameters VH03, VHG05,
VHG07, VH09, and VHG11. The
second page will contain timeplots for
phase B showing parame ters VH03,
HG05, VHG07, VH09, and VHG11.
The third page will contain timeplots
for phase C showing parameters VH03,
VHG05, VHG07, VH09, and VHG11.
Continued on next page
57
Dran-View 6 User Guide
Advanced
Category
User Selected Timeplots (continued)
Enterprise
Edition only
Stack
This checkbox (one per row or one per column) specifies if
the parameters should be plotted in STACKED or
OVERLAID mode for the particular page.
Lim1, Lim2
These edit-boxes allow you to include your own
threshold/limit lines within each page. These limit lines are
drawn from left to right in the chart at the numerical
magnitude you specify in each edit box. If you leave the editboxes blank, no limit line will be drawn.
58
Dran-View 6 User Guide
Advanced
Category
Enterprise
Edition only
User Selected Events
This option allows you to select any
event for inclusion in the report writer.
It contains a preview image that shows
how the final chart will look like as you
change settings or switch between
different events.
Event categories This list-box has a number of event categories (contents may
vary). The events that belongs to the selected category is
shown in the “Events in category” list-box. For each category,
the page allows you to have different settings of all the
checkboxes in the page.
Events in
category
The events belonging to the selected category is shown in this
list-box. If you want to include any event into the report, be
sure to enable its checkbox. If a checkbox is gray it indicates
that the same event is already enabled in another category,
since some events may belong in several categories.
If you move the selection in this list-box, the Preview window
will be updated to show that particular event.
Plot options for
this category:
Fault phases
only
Only the triggered phases of the event will be shown in the
graph.
Phases A, B, C,
D
The selected phases will be shown in the graph.
Voltage
waveforms /
Current
waveforms
This checkbox allows you to enable waveforms in the graph.
Continued on next page
59
Dran-View 6 User Guide
Advanced
Category
User Selected Events (continued)
Voltage RMS / Current RMS
Voltage Peak (Crest) / Current Peak (Crest)
Voltage RMS Deviation / Current RMS Deviation
These options allow you to include half-cycle values generated
by the instrument (Multi-DAQ Taskcard, PX5, PG4400, and
Signature System range of products). If your instrument does
not deliver half-cycle RMS values, Dran-View can generate
these parameters using the command “Tools-Harmonics/
Timeplot Calculator” for any eve nt that contains waveforms.
Stack by phase
This option allows you to increase the stacking for the
parameters by subdividing into phases.
Show thresholds If this option is enabled, the instrument thresholds will be
shown in the graph.
60
Dran-View 6 User Guide
Advanced
Category
Enterprise
Edition
Only
Compare harmonics against limits
This option allows you to compare
harmonics against your own or predefined limits. A set of pre-defined
limits is available when installing DranView. These files have the extension
.DLM and can be loaded using the
“Open” button. The current settings can
be saved using the “Save” button.
The Report Writer will create a
PASS/FAIL report for the selected
harmonics.
Description
This exit-box should contain a brief description of the limits
entered. The description will be included in the final page.
Cumulative
threshold (1100%)
This edit-box should contain a statistical value between 1100%. Most power quality standards include information about
this number; usually 95% or 100% is used. If a value other
than 100% is used, some fluctuations are filtered out. A 95%
value means that the worst (highest) 5% is excluded.
Planning level
(1-500%)
This edit-box allows you to scale the limits by the percentage
given. Typically this value is set to 100%, which means that
the limits are not modified before comparison.
Unit
This combo-box contains the selection of “I” (current
harmonic) or “V” (voltage harmonic).
Harm
This combo-box allows you to select what harmonic number to
analyze. Available selections include THD, DC, FND, H02H50.
Limit
This edit-box contains the limit to compare against. If this field
is blank or 0.0, the row will not be part of the comparison.
Scale
This combo-box allows you to select if the harmonic is in
“Abs” (volts or amps unit) or “%FND” (normalized to
fundamental).
61
Dran-View 6 User Guide
Advanced
Category
G5/4 Prediction of a new nonlinear load/Harmonics against limits
Page 1
This page allows you to enter the
current harmonics (Amps) for a new
non- linear load. The manufacturer of
the new equipment usually supplies
these figures. The predicted voltage
harmonics are calculated from the
given current harmonics. The predicted
and the measured voltage harmonics
are then summed up and may be
compared against the G5/4 planning
levels (limits).
This module was implemented for the UK market, but may be useful for others.
It is based on the “ENGINEERING RECOMMENDATION G5/4 February
2001”.
Enterprise
Edition
Only
Do you want to predict Voltage Harmonics for a new non-linear load?
You need to check this option to activate this page. If it is not
checked, you will still be able to proceed to the next
(comparison) page. However you will only compare measured
harmonics without the influence of predicted harmonics.
Nominal system Only the following options can be selected: 400V, 6.6kV,
voltage
11kV, 20 kV, or 22 kV.
Cumulative
threshold(1100%)
This edit-box should contain a statistical value between 1100%. Most power quality standards include information about
this number; usually 95% or 100% is used. If a value other
than 100% is used, some fluctuations are filtered out. A 95%
value means that the worst (highest) 5% is excluded.
Open / Save
Use these buttons to load or save you settings to a file (.DLM).
Continued on the next page
62
Dran-View 6 User Guide
Page 2
Enterprise
Edition
Only
This page works like the module
“Compare Harmonics against limits”,
with the option to exclude the
comparison and present only the
predicted harmonics in the report.
Do you wish to compare Harmonics against limits?
Enable this option to activate the comparison. Use the “Open”
button to load pre-defined planning levels (limits), or design
your own.
For information about the remainder of the page, please read about the Custom
Report Writer module “Compare Harmonics against limits”.
63
Dran-View 6 User Guide
Standards
Enterprise
Edition
Only
Several report items are located below Custom Limits in the custom report
generator. These are pre-defined standards, but they use the same report module as
the custom limit report. The reports listed here may vary since Dran-View
automatically detects which standards apply to the nominal voltage and frequency
of your measurement. Selecting one of the pre-defined standards will not show the
custom limits property page. Pressing the "?" button next to a standard will
display instructions on how to set up your instrument in order to measure and
check for compliance against that standard. Note that not all aspects of the
standards are considered in the Standards reports.
Custom
Limits
Property
Page
This property page will allow
you to define new standards, or
modify existing ones.
Press this button to open an existing standard.
Press this button to save your current settings.
Show as
If this option is selected when you save your settings, this item will
standard
appear under Standards in the Custom Report property page.
Description The name you enter here will be used as a heading for your report,
and will also appear as the name of the report in the open dialog and
the Custom Report property page (if it is listed there).
Up/Down
Use these buttons to move a row up or down. The report will be
printed in the order of the rows.
Continued on the next page
64
Dran-View 6 User Guide
Advanced If you click this button, a dialog box with the following options will
Properties appear:
Show only if
If you enable this option, select Show as standard
Un is X to Y
and press the
button. Your report will appear in
and Fn is Z
the Custom Report property page only if it matches
the given requirements.
Language
In the two boxes below, you may enter names and
setup instructions for each language in this box.
Choose the language with which you wish to change
name and setup instructions.
Description
Enter a description in the selected language.
Setup
Enter instructions on how to set up the instrument to
Instructions
measure in compliance with your newly defined
standard.
Limit List This list has the following columns:
Rec.
If you select this checkbox, this row will be
considered a recommendation. Recommendations are
marked as such in the report. Failed
recommendations will be color coded in yellow, not
red.
Parameter
Select the parameter to which this limit applies.
Select Not used to delete a row.
Interval
Select the time interval for this parameter. If the
measured parameter has a slower time interval, no
result can be calculated. If you select instantaneous,
you should configure your instrument to trigger at
this threshold. Instantaneous cannot be selected for
harmonics.
Continued on the next page
65
Dran-View 6 User Guide
Cum Thres.(%) If you did not select the instantaneous time interval,
this option will be enabled. This number indicates
how many % of the time the parameter must be
within limits to pass.
Max Dur. (s)
If you select the instantaneous time interval, this
option will be enabled. It indicates how many
seconds the parameter may pass out of bounds
without failing.
% lim
If you select this option, the limits are entered in
percentage deviation from the parameter’s nominal
value, as opposed to absolute min and max values.
Nominal
If you selected the % lim option, enter the nominal
value here. For Vrms and frequency, the nominal is
known and does not need to be given.
High/Low
Enter the low and high limits, or leave one at 0 to
Limit
disable it. Limits are given as absolute values, unless
you selected the % lim option, in which case they are
percentage deviations from the nominal value. Note
that a - sign should precede the low limit. For
harmonic parameters, a Set Limits button will replace
these fields. Click this button to display the
Harmonics limits dialog box, where you can enter
limits for harmonics.
Continued on the next page
66
Dran-View 6 User Guide
Harmonics
Limits
Dialog
Use this dialog to set limits for
individual harmonics.
Limit List
Use this list to enter limits for individual harmonics. This list contains
the following columns:
Row Number Click the row number button to select the entire row.
Click the topmost button to select the entire list. This
allows you to easily copy and paste data in the list
(right-click to bring up a menu where you can select
these options).
Harm
Select the harmonic, THD, FND or DC to which this
limit applies.
Limit
Enter the limit for the selected harmonic in the selected
scale.
Scale
Choose if the limit should be absolute (Volts/Amps) or
in % of FND.
Planning You can automatically decrease the tolerance in your report by this
Level
value.
Import… Click this button to open Dran-View 5 limit files or G5/4 limits, and
import settings from them.
Populate… Click this button to auto-format the limit list. The Populate dialog box
will be shown.
Continued on next page
67
Dran-View 6 User Guide
Populate
Dialog
Use this dialog box to auto- format
the limit list in the Harmonic Limits
dialog. The current data in that
dialog box will disappear.
Include THD/DC/FND
Harmonics from X to Y
All limits in
Select the checkboxes that you want to
include limits for.
Select which harmonics, if any, you wish to
include.
Choose between absolute (Volts/Amps) or
% of FND.
68
Dran-View 6 User Guide
6.17.
File Properties
File
Properties
Select this option to display the File Properties dialog box where you can view
the properties of the file you are working with or to select properties of another
file.
File
Properties
Dialog
This dialog box lets you view a
number of properties for the file you
are working with, as well as that of
another file. Initially, only the
currently active file will be shown. If
you press the Select File button to
view properties of another file, the
dialog box will expand and show
properties for the current file as well.
69
Dran-View 6 User Guide
6.18.
File MRU List
Most
Recently
Used Files
6.19.
Exit
Use the numbers and filenames listed at the bottom of the File menu to open the
last five files recently used. All files opened by Dran-View will be added to the
top of this list, displacing the other files in the list and removing the last. Only
one instance of each file will exist in the list.
Exit
Use this command to end your Dran-View session. You can also use the Close
command on the application system menu. Dran-View prompts you to save
documents with unsaved changes.
70
Dran-View 6 User Guide
Chapter 7. The Edit Menu
7.1.
Undo
Undo
Use this command to reverse your last action, whenever possible. Click the down
arrow immediately to the right of the Undo button to display a menu containing
the last 10 undo actions. Selecting one action from the menu will undo that action
and all actions above it. If there is more than 10 undo actions, the option “More
Undo...” will appear last in the list. Selecting this option will display the More
Undo dialog box, where all available undo actions will appear. Undoing one or
more actions will cause them to appear in the Redo queue instead.
More Undo /
More Redo
Dialog
This dialog box will appear if you select the More
Undo/Redo option in the Undo or Redo drop-down
menus. Click an item to undo/redo this action and all
actions above it in the list.
If there are many undo/redo actions in the list, a
scrollbar will appear on the right side of the list. Click
Cancel to abort.
Undoing a document- global action will affect all views attached to the active
document. Such action will appear in the undo queues for all the document's
views.
The undo queue will not be available for Text Editor actions. While viewing the
Text Editor, only Text Editor actions can be undone. The undo command will not
be available in the Data List.
The undo queue will not be saved with the document.
!
Enterprise Edition:
Most drag and drop actions will appear as two items in the undo queue, one cut
and one paste action.
71
Dran-View 6 User Guide
7.2.
Redo
Redo
Use this command to redo your last undone action, whenever possible. Click the
down arrow immediately to the right of the Redo button to display a menu
containing the last 10 undone actions. Selecting one action from the menu will
redo that action and all actions above it.
If there are more than 10 undone actions, the option “More Redo…” will appear
last in the list. Selecting this option will display the More Redo dialog box,
where all available undone actions will appear. Redoing one or more actions will
cause them to appear in the Undo queue instead.
More Undo /
More Redo
Dialog
This dialog box will appear if you select the More
Undo/Redo option in the Undo or Redo drop-down
menus. Click an item to undo/redo this action and all
actions above it in the list.
If there are many undo/redo actions in the list, a
scrollbar will appear on the right side of the list. Click
Cancel to abort.
If any action has been placed in the undo queue after other actions were undone,
the redo queue will be cleared. Such undone actions cannot be redone.
Redoing a document- global action will affect all views attached to the active
document, and such actions will appear in the redo queues for all the document's
views.
The redo queue will not be available for Text Editor actions. While viewing the
Text Editor, only Text Editor actions can be redone. The redo command will not
be available in the Data List.
The redo queue will not be saved with the document.
!
Enterprise Edition
Most drag and drop actions will appear as two items in the undo queue, one cut
and one paste action
72
Dran-View 6 User Guide
7.3.
Cut
Cut
Cutting data to the clipboard replaces the contents previously stored there.
Main View
Use this command to remove the currently selected object from the view and put
it on the clipboard. Dran-View objects can be pasted into other views or
documents. Depending on the settings in the Clipboard Options page, a bitmap or
Windows Meta File picture may also be placed on the clipboard. Cutting a Text
Label or Data Annotation will also place the text information on the clipboard,
but will not include text format such as font or color.
Enterprise
Edition
Only
Text Editor
Use this command to remove the currently selected text from the Text Editor and
put it on the clipboard. If no text is selected, this command will be unavailable.
Data List
The Cut command will be unavailable in a Data List.
73
Dran-View 6 User Guide
7.4.
Copy
Copy
Copying data to the clipboard replaces the contents previously stored there.
Main view
Use this command to create a copy of the currently selected object and put it on
the clipboard. Dran-View objects can be pasted into other views or documents.
Depending on the settings in the Clipboard Options page, a bitmap or Windows
Meta File picture may also be placed on the clipboard. Copying a Text Label or
Data Annotation will also place the text information on the clipboard, but will
not include text format such as font or color.
Text Editor
Use this command to create a copy of the currently selected text and put it on the
clipboard. If no text is selected, this command will be unavailable.
Data List
Selecting the Copy command in a Data List will cause the Export Data dialog
box to appear. This allows you to change formatting options for tabular data so
that it can be pasted into certain applications like spreadsheet application. You
also have the option to copy only the currently selected rows.
74
Dran-View 6 User Guide
7.5.
Paste
Paste
Use this command to insert a copy of the clipboard contents at the insertion
point. This command is unavailable if the clipboard is empty. The following data
types can be pasted into the Dran-View text editor:
• Bitmap pictures
• Windows Meta Files
• RTF text
• ASCII text (also in input boxes)
You cannot paste anything into the Data List.
Enterprise
Edition Only
In Enterprise Edition, you can also paste into the main view. In addition to DranView objects such as charts, tables, etc, which will appear as they were when cut
or copied, you can also paste BMP, DIB and WMF images, (which will appear as
picture objects), and ASCII text (which will appear as text objects).
Pasting Dran-View objects, pictures or text into the main view will create objects
belonging to the currently active chart, or if no chart is active, the active frame.
7.6.
Select All
Select All
This command is only available in the text editor. Selecting this command will
select all text in the editor.
75
Dran-View 6 User Guide
Chapter 8. The View Menu
8.1.
Instrument Setup
Instrument
Setup
8.2.
This command will display a report of
the instrument configuration that is
active, while the currently selected is
displayed in a Text Editor window. The
appearance of this report will vary
depending on what instrument the file
originated from. Note that the
configuration may vary if the
instrument settings were modified
during measuring. If there is more than
one setup in a site, the setup used at the
currently active event timestamp will
be used. If the document contains
multiple sites, there will be one setup
per site shown.
Personal Notes
Personal
Notes
This command will display the Text
Editor window where you can enter
notes attached to this document. The
text will be saved with the document
and will appear the next time you select
this command.
If the Personal Notes Text Editor
window is already open when you
select this command, Dran-View will
activate this window instead of creating
another.
76
Dran-View 6 User Guide
8.3.
Data List
Data List
This command will display the Data
List window where the visible parts in
the current X-Axis zoom of the active
channels in the chart are displayed as
numerical data.
The data list is used to display data as
text in a table. To show this view, press
the Data List toolbar button. The data
list will display the visible channels in
the current X-axis zoom range of the
selected chart.
The leftmost column will display a row number for each row, the second column
will display x-data (usually time), and the rest of the columns will display each
channel's value at that point. The channel values will be displayed in the same
color as the channel is drawn in the selected chart. The time range of the active
event will be colored the same way. Right-click on the data list to display the
data view pop-up menu. Selecting "Copy" or "Save As" and then selecting
"ASCII" will bring up the Export Data dialog box where you can select what data
you wish to copy/save and how it should be formatted. Selecting "Properties"
will show the Data List Properties dialog box.
!
In the Enterprise Edition, it is also possible to delete data points using the Table
List. Select the rows that you want to delete using the SHIFT or CTRL key. Use
the pointer device to select a range of rows in the list. Press the keyboard “Del”
key if you want to permanently remove a selected range of data points.
Notes:
The delete command may also remove data points in parameters other than those
viewed in the list, provided they have data points at/within the timestamps/timeranges selected.
If you have a very large file, you might notice a delay when using the delete
function. The Undo/Redo system is backing up all your data so the delete
command can be undone.
Once you save the file in a DV6 file format, and reopen it at another time, the
deleted data can never be recovered (the Undo buffer is flushed).
Continued on next page
77
Dran-View 6 User Guide
Data List
(Continued)
If you right-click on the Data List, you
will access the Data List properties
dialog box:
Display All
Selecting this option will write the text "HID" where there is
no valid data for a channel, rather than displaying an empty
cell.
Show time data as Selecting this option will display the first X-data cell as
difference from
normal, but will display the elapsed time since the cell
previous value
immediately above each cell for all other X-data cells. This
option has no effect if the X-data cells do not display time
data.
78
Dran-View 6 User Guide
8.4.
8.4.1.
Toolbars
Dran-View Professional Toolbars
Dran-View In Dran-View Professional, only two static toolbars are available. The toolbars
Professional cannot be moved and cannot be customized.
Toolbars
The following commands are available from the Dran-View Professional Toolbar:
Open
Show/Hide Statistics Grid
Save
Show/Hide Phasor
Copy
Show/Hide DFT Chart
Print
Show/Hide Magnitude/Duration
Chart
Toggle Timeplot Chart
Toggle Waveform Chart
Toggle Event List
Stacked/Overlaid chart
Undo
Less Y-Axes
Redo
More Y-Axes
Move Tool
Data List
Zoom In Tool
Splitter Right
Zoom Out
Splitter Middle
Delta Tool
Splitter Left
Area Marker Tool
Context Help
First Event
Previous Waveform Event
Previous Event
Event Box
79
Dran-View 6 User Guide
Next Event
Next Waveform Event
Last Event
8.4.2.
Dran-View Enterprise Toolbars
Dran-View
Enterprise
Toolbars
The Enterprise Edition of Dran-View contains a wide
range of options to enable pre-defined toolbars, modify
existing toolbars, or define your own toolbars. Toolbar
buttons may be moved or deleted with a simple drag-anddrop action while holding down the ALT-button. You may
also define your own keyboard short-cut commands to
simplify your work.
The pop-up menu shows checkboxes for the toolbars that
are currently enabled. If you want to enable or disable a
toolbar, simply check or uncheck it
The following commands are available from the Standard Toolbar in its default configuration:
Open
Save
Cut
Copy
Paste
Print
Report Writer
Create Snapshot
Toggle Event List
Undo
Redo
Splitter Right
Splitter Middle
Splitter Left
The following commands are available from the Classic Toolbar in its default configuration:
Open
Save
Copy
Print
Toggle Event List
Undo
Redo
Move Tool
Zoom In Tool
Zoom Out
Delta Tool
Area Marker Tool
Insert Statistics Grid
Insert Phasor
Insert DFT Chart
Insert Magnitude/Duration Chart
Stacked
Less Y-Axes
More Y-Axes
Data List
Splitter Right
Splitter Middle
Splitter Left
Context Help
80
Dran-View 6 User Guide
The following commands are available from the Event Toolbar in its default configuration:
Event Box
First Event
Previous Waveform Event
Previous Event
Next Event
Next Waveform Event
Last Event
The following commands are available from the Chart Toolbar in its default configuration:
Move Tool
Zoom In Tool
Zoom Out
Pan Tool
Expand/Contract Tool
Autoscale
Unzoom All
Autozoom to Event
Delta Tool
Area Marker Tool
Stacked
Less Y-Axes
More Y-Axes
Data List
The following commands are available from the Object Toolbar in its default configuration:
Insert Text Label
Insert Picture
Insert Phasor
Insert DFT Chart
Insert Statistics Grid
Insert Timeplot Chart
Insert Waveforms/Details Chart
Insert Magnitude/Duration Chart
Insert Data Annotation
Delete object
The following commands are available from the Area Marker Toolbar in its default
configuration:
Area Marker Tool
Move Area Marker Left
Move Area Marker Right
Expand Area Marker
Contract Area Marker
The following commands are available from the Site Toolbar in its default configuration:
Add Site
Remove Site
Append Site
Rename Site
The following commands are available from the Additional Tools Toolbar in its default
configuration:
Event Tree Properties
Properties
View Instrument Configuration
View Personal Notes
Calculate Harmonics/Timeplots
Harmonic Scaling
Rescue Kit
Event Removal
Change Personal Information
Options
Duplicate Window
Cascade Windows
Tile Windows
Close All Windows
Dran-View Update
Help Topics
81
Dran-View 6 User Guide
8.5.
Event List Bar
Event List
Bar
8.6.
This command toggles the Event List Bar to switch between Event List Tab and
Snapshot List Tab windows visible/invisible.
Customize – Enterprise Edition Only
Customize
This command displays the Toolbar Customize dialog box containing five tabs.
Enterprise
Edition
Only
82
Dran-View 6 User Guide
8.6.1.
Customize Dialog - Commands Page
Commands
Page
Enterprise
Edition
Only
Categories
Select a category. The contents of the "Commands" list will
change depending on which category is selected.
Commands
This lists all commands in the category. Drag a command to a
toolbar or menu where you want to place/drop it. To create a
new menu, drag the "New menu" command to the menu or
toolbar. To create a new toolbar, see the "Toolbars" page. To
remove any command from a menu or toolbar, drag and drop it
outside all toolbars and menus.
83
Dran-View 6 User Guide
8.6.2.
Customize Dialog - Toolbars Page
Toolbars
Page
Enterprise
Edition
Only
Toolbars
The checkboxes in this list control the visibility of each toolbar.
To show or hide a toolbar, enable/disable the checkbox next to its
name.
Reset
Click this button to restore the selected toolbar to factory default
settings. This can only be done for standard toolbars.
Reset All
Click this button to restore all toolbars to factory default settings.
This is only done for standard toolbars.
New...
Click this button to create a new toolbar. A dialog box will
appear where you can enter the name of the new toolbar. This
toolbar will be initially empty. See the "Commands Page" (page
83) to learn how to place commands on toolbars.
Rename...
Click this button to rename the selected toolbar. A dialog box
will appear where you can enter the name of the new toolbar.
This cannot be done for standard toolbars.
Delete
Click this button to remove the selected toolbar. A dialog box
will appear asking you to confirm the deletion. This cannot be
done for standard toolbars.
Show text labels Enable this checkbox to display the tool tip for each toolbar
button.
84
Dran-View 6 User Guide
8.6.3.
Customize Dialog - Keyboard Page
Keyboard
Page
Enterprise
Edition
Only
Category
Select a category. The contents of the "Commands" list will
change depending on which category is selected.
Commands
This lists all commands in the category. Select a command in this
combo box if you want to edit its keyboard shortcut.
Set Accelerator
for
Choose to set keyboard shortcuts for when a file is open (DV6) or
when no file is open (Default).
Current keys
This is a list of keyboard shortcuts currently assigned to the
command selected in the "Commands" list.
Press new
shortcut key
Press the keyboard combination that you wish to assign to the
selected command. Below this box, you will see which
command, if any, the selected keyboard combination is currently
assigned to.
Assign
This button will be enabled if you entered a keyboard
combination in the "Press new shortcut key". Press this button to
assign the selected keyboard combination as a shortcut to the
selected command.
Remove
This button will be enabled if you selected a keyboard
combination in the "Current keys" list. Press this button to
remove the selected keyboard combination as a shortcut to the
selected command.
Reset All
Press this button to restore all keyboard shortcuts to factory
default settings.
85
Dran-View 6 User Guide
8.6.4.
Customize Dialog - Menu Page
Menu Page
Enterprise
Edition
Only
Show menus for Select which menus to show. The menus will reset once you
close this dialog box. This selection is only intended for use in
manipulating the menus while they are not visible. See the
"Commands Page" (page 83) for an explanation of how to do
this.
Reset
Resets the selected menu.
Context Menus
Select whic h context menu to show. The menu will disappear
once you close this dialog box. This selection is only intended for
use in manipulating the menus while they are not visible. See the
"Commands Page" (page 83) for an explanation of how to do
this.
Reset
Resets the selected context menu.
Menu
Animations
Select the kind of menu animations, if any, that you wish DranView to use.
Menu Shadows
Turn this option off to disable menu shadows.
86
Dran-View 6 User Guide
8.6.5.
Customize Dialog - Options Page – Enterprise Edition Only
Options
Page
Enterprise
Edition
Only
Show
ScreenTips on
toolbars
Disable this checkbox to hide the tool tips when the pointer is
placed over toolbar buttons.
Show shortcut
keys in
ScreenTips
Disable this checkbox to hide keyboard shortcuts in tool tips.
This option will be disabled if “Show ScreenTips on toolbars” is
not selected.
Large Icons
Select this checkbox to display larger toolbar buttons.
87
Dran-View 6 User Guide
8.7.
Status Bar - Main Status Bar
Status Bar
8.8.
Use this command to display and hide the Main Status Bar. A checkmark appears
next to the menu item when the status bar is visible.
Status Bar - Axis Status Bar
Axis Status Use this command to display and hide the Axis Status Bar. A checkmark appears
Bar
next to the menu item when the status bar is visible.
8.9.
Status Bar - Used Physical RAM Meter
Used RAM This toggles the Used Physical RAM Meter on the Axis Status Bar. This command
meter
will be unavailable if the Axis Status Bar is hidden (to show or hide the Axis Status
Bar, use the Axis Status Bar command on the View > Status Bar menu).
The meter shows the total (by all applications, not just Dran-View) amount of used
physical (i.e. swap file is not considered) RAM.
8.10.
Create Snapshot
Create
Snapshot
This command creates a new snapshot. When you use this command, the Snapshot
List will become active, with your newly created snapshot selected. New snapshots
are placed last in the Snapshot List.
Enterprise
Edition Only
88
Dran-View 6 User Guide
8.11.
Goto
Goto commands
In this pop- up menu, the following commands are available.
Goto First Event
This command sets the first event in the current site as the active event.
Events are arranged according to the sort order in use.
Goto Previous Waveform Event
This command sets the previous event containing waveform data as the
new active event. Events are arranged according to the sort order in use.
Goto Previous Event
This command sets the previous in the current site as the new active event.
Events are arranged according to the sort order in use.
Goto Next Event
This command sets the next event in the current site as the new active
event. Events are arranged according to the sort order in use.
Goto Next Waveform Event
This command sets the next event containing waveform data as the new
active event. Events are arranged according to the sort order in use.
Goto Last Event
This command sets the last event in the current site as the active event.
Events are arranged according to the sort order in use.
89
Dran-View 6 User Guide
Chapter 9. The Insert Menu
9.1.
Insert Text Label
Text Label
This command adds a Text Label to the currently active Main View. If a Chart has
focus, that Chart will become the Text Label's Parent. If no Chart has focus, the
Frame belonging to the active Main View will become the Text Label's parent. If
the Chart itself has focus (or any of its axes, event rulers or legends), or a Frame,
the Text Label will be inserted at the bottom of the Chart or Frame. If a child object
has focus, the Text Label will be inserted immediately below that object.
Enterprise
Edition Only When the Text Label has been inserted, a dialog box displaying its General
properties will be displayed.
This command will be unavailable if a Main View is not active.
9.2.
Picture
Insert Picture
This command adds a Picture to the currently active Main View. If a Chart has
focus, that Chart will become the Picture's parent. If no Chart has focus, the Frame
belonging to the active Main View will become the Picture's parent. If the Chart
itself has focus (or any of its axes, event rulers or legends) or a Frame, the Picture
will be inserted at the bottom of the Chart or Frame. If a child object has focus, the
Picture will be inserted immediately below that object.
Enterprise
Edition Only When the Picture has been inserted, a File Open dialo g box where you can select
the picture you want to use will be displayed. The picture may be resized.
This command will be unavailable if a Main View is not active.
90
Dran-View 6 User Guide
9.3.
Insert Phasor
Phasor
This command behaves differently in Dran-View Professional and Dran-View
Enterprise.
This command will be unavailable if a Main View is not active.
Professional Toggles the phasor to the left of the waveform chart.
Edition
Enterprise
Edition
This command adds a Phasor to the currently active Main View. If a Chart has
focus, that Chart will become the Phasor's parent. If no Chart has focus, the Frame
belonging to the active Main View will become the Phasor's parent. If the Chart
itself has focus (or any of its axes, event rule rs or legends) or a Frame, the Phasor
will be inserted at the bottom of the Chart or Frame. If a child object has focus, the
Phasor will be inserted immediately below that object.
91
Dran-View 6 User Guide
9.4.
Insert DFT Chart
DFT Chart
This command behaves differently in Dran-View Professional and Dran-View
Enterprise.
This command will be unavailable if a Main View is not active.
Professional Toggles the DFT chart below the waveform chart.
Edition
Enterprise
Edition
9.5.
This command adds a DFT Chart to the bottom of the Frame that has focus (or
contains the object that has focus). If a Waveform/Details Chart has focus, the DFT
Chart will be connected to that Waveform/Details Chart.
Insert Statistics Grid
Grid
This command behaves differently in Dran-View Professional and Dran-View
Enterprise.
This command will be unavailable if a Main View is not active.
Professional Toggles the statistics table below the timeplot chart.
Edition
Enterprise
Edition
This command adds a Statistics Grid to the currently active Main View. If a Chart
has focus, that Chart will become the Statistics Grid's parent. If no Chart has focus,
the Frame belonging to the active Main View will become the Statistics Grid's
parent. If the Chart itself has focus (or any of its axes, event rulers or legends) or a
Frame, the Statistics Grid will be inserted at the bottom of the Chart or Frame. If a
child object has focus, the Statistics Grid will be inserted immediately below that
object.
92
Dran-View 6 User Guide
9.6.
Insert Timeplot Chart
Time-plot
chart
This command behaves differently in Dran-View Professional and Dran-View
Enterprise.
This command will be unavailable if a Main View is not active.
Professional Toggles the timeplot chart.
Edition
Enterprise
Edition
9.7.
This command adds a Timeplot Chart to the bottom of the Frame that has focus (or
contains the object that has focus).
Insert Waveforms/Details Chart
Waveform
chart
This command behaves differently in Dran-View Professional and Dran-View
Enterprise.
This command will be unavailable if a Main View is not active.
Professional Toggles the waveform chart.
Edition
Enterprise
Edition
This command adds a Waveforms/Details Chart to the bottom of the Frame that has
focus (or contains the object that has focus).
93
Dran-View 6 User Guide
9.8.
Insert Magnitude/Duration Chart
Magnitude/ This command behaves differently in Dran-View Professional and Dran-View
Duration
Enterprise.
chart
This command will be unavailable if a Main View is not active.
Professional Toggles the magnitude/duration chart below the timeplot chart.
Edition
Enterprise
Edition
This command adds a Magnitude/Duration Chart to the bottom of the Frame that
has focus (or contains the object that has focus).
94
Dran-View 6 User Guide
Chapter 10.
10.1.
The Tools Menu
Active Tool Move
Move
When this tool is active, its icon on the Chart Toolbar and in the Tools > Active
Tool menu will look like this:
. This tool is used to move objects, but in
Professional Edition, any tool can be used to move axes.
To move an object, left-click on it while dragging it to the desired location on
screen. Release the pointer button when done. Legends and Event Rulers cannot be
moved. To move an axis, you must position the pointer close to the edge of the
axis. When you can move it, the cursor will look like this:
. The cursor will have
this appearance whenever the pointer is positioned so that clicking will move an
object.
In Enterprise Edition, most objects can be moved.
Although moving objects can be done with another tool, you must use the Move
tool for Charts. The click and drag functions for specific tools may have certain
special actions. For example, when moving objects using the Move tool, a tracking
rectangle will appear which indicates where the object would be positioned if you
drop it at the current position.
10.2.
Active Tool Autoscale
Autoscale
This tool will not stay active when it is clicked. When clicked, it will zoom all Yaxes in the active Chart so that all data in the currently visible X-axis range is
visible. The margin (Auto Scale Range Factor) set on the General property page of
the axis will also become visible. Thresholds will not be considered when
determining the best zoom.
This command will only be available if a Chart or Axis has focus.
!
If this command is used when a Y-axis has focus, only that axis will be zoomed.
95
Dran-View 6 User Guide
10.3.
Active Tool Zoom In
Zoom In
When this tool is active, its icon on the Chart, Classic Toolbar, and in the Tools >
Active Tool menu will look like this:
. When this tool is active and the cursor is
positioned above a Chart, the cursor will look like this:
. To zoom in on an
area, left-click on a point in the Chart while dragging the pointer to the desired area
that you want to zoom in. A tracking rectangle will appear which indicates the area
that will be magnified once you release the pointer button. All axes should now
have zoomed in to the selected square. Zooming will only affect one Y-Axis if the
Chart is in stacked mode.
If you select a very small area, no zoom will occur. This allows you to cancel a
zoom by moving the pointer back to where you started and releasing the pointer
button there. It also avoids accidental zooms.
!
You can also zoom (in or out) by clicking and dragging an axis while holding the
SHIFT or CTRL keys. Holding the SHIFT key will maintain the axis' bottom/left
point, while holding the CTRL key will maintain its top/right point. This will zoom
the clicked axis only. When doing this, the cursor will look like this:
, ,
or , depending on which key you are holding and whether it's a Y- or X-axis.
Move the pointer in the direction of the arrow to zoom in, or in the opposite
direction to zoom out. Another way to zoom is to position the pointer over an axis
and move the scroll wheel on your pointing device (some device do not have scroll
wheels) while holding the SHIFT or CTRL keys. Scroll up to zoom out and scroll
down to zoom in.
10.4.
Active Tool Unzoom
Unzoom
This tool will not stay active when it is clicked. Using this tool will restore the
active Chart to the zoom state it had before the last zoom in/pan operation.
If you want to unzoom all zoom actions, use the Unzoom All Tool.
96
Dran-View 6 User Guide
10.5.
Active Tool Unzoom All
Unzoom All This tool will not stay active when it is clicked. Using this tool will restore the
active Chart to its original zoom state (as it was when the chart was inserted or the
document was opened).
If you want to unzoom just your last zoom action, use the Unzoom Tool.
10.6.
Active Tool Expand/Contract
Expand /
Contract
When this tool is active, its icon on the Chart Toolbar and in the Tools > Active
Tool menu will look like this:
. When this tool is active and the cursor is
positioned above a Chart, the cursor will look like this:
. To zoom in on an area,
left-click on a point in the Chart while dragging the pointer up or right to zoom in
or down or left to zoom out. Release the pointer button when done. While dragging,
you will see what the chart will look like if you release the pointer button. Release
the button when you are satisfied with the pan. Zooming will affect all axes except
if the Chart is in stacked mode, in which case only one Y-Axis will be affected.
97
Dran-View 6 User Guide
10.7.
Active Tool Pan
Pan
When this tool is active, its icon on the Chart Toolbar and in the Tools > Active
Tool menu will look like this:
. When this tool is active and the cursor is
positioned above a Chart, the cursor will look like this:
. To pan the Chart, leftclick on a point in the Chart while dragging the pointer in the direction you wish to
pan. While dragging, you will see what the chart will look like if you release the
pointer button. Release the button when you are satisfied with the pan. All axes are
panned except if the Chart is in stacked mode, in which case only one Y-Axis is
affected.
You can also pan by clicking and dragging an axis. This will pan the clicked axis
only. When doing this, the mouse cursor will look like this
or like this ,
depending on whether it's a Y- or X- axis. Drag the mouse up or down/left or right
to pan. Another way to pan is to position the pointer over an axis and move the
scroll wheel on your pointing device (some device do not have scroll wheels).
10.8.
Active Tool Autozoom To Event
Autozoom
to Event
When this tool is active, its icon on the Chart Toolbar and in the Tools > Active
Tool menu will look like this:
. This tool can be active simultaneously with
other tools, and does not affect their operation. The state of this tool is maintained
individually for each chart. Select the tool again to disable it.
Changing the active event will cause all X-axes belonging to the chart to zoom to
the time-span of the event, including the margin (Auto Scale Range Factor) set on
the General property page of the axis.
98
Dran-View 6 User Guide
10.9.
Active Tool Delta Measurement
Delta
Measure ments
When this tool is active, its icon on the Chart Toolbar and in the Tools > Active
Tool menu will look like this:
. When this tool is active and the cursor is
positioned above a Chart, the cursor will look like this:
. This tool can be
active simultaneously with other tools. An active state does not necessarily indicate
that the tool will be used when you click in a chart. Instead, an active state shows
that a delta measurement is active in the chart which has focus. The state of this
tool is maintained individually for each chart. Select the tool again to disable it and
hide all delta measurements in the active chart.
To measure the distance between two points, left-click over the first point in a chart
while moving the pointer to the second point. Release the mouse button. The
distance between the two points will now be displayed in the chart as a delta
marker:
Repeating this action will remove the first delta marker. This means only one delta
marker can be shown in each chart.
The appearance and behavior of the delta tool can be modified on the Delta
property page using the chart's property dialog box.
99
Dran-View 6 User Guide
10.10. Active Tool Area Marker
Area
Marker
When this tool is active, its icon on the Chart Toolbar and in the Tools > Active
Tool menu will look like this:
. When this tool is active and the cursor is
positioned above a Chart, the cursor will look like this:
. This tool can be
active simultaneously with other tools. An active state does not necessarily indicate
that the tool will be used when you click in a chart. Instead, an active state shows
that an area marker is active in the chart which has focus. The state of this tool is
maintained individually for each chart. Select the tool again to disable it and hide
all area markers in the active chart.
To select an area, left-click over the first point in a chart while moving the pointer
to the second point. Release the button when done. Repeating this action will
remove the first area marker. This means only one area marker can be shown in
each chart.
The area marker is used to select the ranges to be used for math calculations. For
example, DFT calculations for DFT charts, phasors, or statistic grids.
The appearance and behavior of the area marker tool can be modified on the
Markers property page in the chart's property dialog box. You will find the Free
Selection setting on this page.
!
If Free Selection is enabled, the Area Marker will not analyze for automatic fullcycle waveform selection in the Waveform Chart.
Multi-Site
If there are several X-axes, and you pan or zoom in on one of them, you may see
two separate area markers. However, if you select a new range, all this will
Enterprise
disappear and be replaced by overlapping markers extending between the points
Edition Only you selected, independent of the axes zoom and pan states. As waveform samples
may exist at different intervals, this may result in fewer cycles being selected for
some axes than for others. This may be hard to discern, but if you look closely, a
thin, black line will indicate the start and end points of each marker.
100
Dran-View 6 User Guide
10.10.1.
Moving/Resizing the Area Marker Selection
Move
Use the mouse pointer to adjust a range once it has been selected.
To move the area, bring the pointer above the center of the range, where the cursor
will change to this:
. Click and drag the area to a new location and release the
pointer button.
You will see a preview of the area while dragging. The range will again be adjusted
to whole cycles in Waveforms/Details charts (unless you have selected the Free
Selection option described below).
In Enterprise Edition, you can also use the Area Left
on the Area Marker Toolbar.
Resize
or Area Right
buttons
To adjust the size of the range, bring the pointer on either edge of the area, where
the cursor will change to this:
. Click and drag the edge to a new location and
release the pointer button. You will see a preview of the area while dragging. The
range will again be adjusted to whole cycles in Waveforms/Details charts (unless
you have selected the Free Selection option described below).
In Enterprise Edition, you can also use the Expand Area
buttons on the Area Marker Toolbar.
or Contract Area
The Area Marker Toolbar buttons in Enterprise Edition will move/resize the range
one sample. However, clicking and holding these buttons will repeat this action
progressively faster.
101
Dran-View 6 User Guide
10.10.2.
Use for DFT Chart selection fine-tuning
Use for
DFT fine
tuning
Select a Waveform chart with a waveform eve nt visible, and select the command
Insert > DFT Chart from the toolbar or from the menu (or right-click on the chart
and select Insert DFT Chart). The newly created DFT is now connected to the
waveform chart and will display the DFT analysis for the current event range.
Now activate the Area Marker Tool and select a range of waveform cycles. When
you release the pointer button, you will see the DFT-Chart updates. It will also
show the DFT contents of the selected waveform range. The Area Marker selection
in the waveform chart overrides the current event range for DFT calculations.
When selecting an area in a Waveforms/Details chart, the area marker will adjust
itself to the nearest full waveform cycle(s), unless you have selected the Free
Selection option (described below). This is done so you can see the true range used
for DFT calculations. This checkbox is also available in the upper right corner of
the waveform chart along with information about selected waveform sample points.
10.10.3.
Use for Phasor selection fine-tuning
Use for
If you have a Phasor located within a frame of Waveform chart, the phasor is
Phasor fine connected to that chart. Normally the phasor shows the phase angles for the
tuning
selected event, but with an Area Marker selection in that Waveform Chart, this
behavior is overridden and the Area Marker rules the calculation of the Phasor.
10.10.4.
Use for Statistics Table selection fine-tuning
Use for
statistics
tables fine
tuning
If you add a Statistics table to the Timeplot Chart (locate it within the frame of the
chart), it normally displays information gathered within the borders of the current
X-axis zoom. However with an Area Marker selection in that Timeplot Chart, this
behavior is overridden and the Area Marker rules the calculation of the Statistics
table.
102
Dran-View 6 User Guide
10.10.5.
Use for Data Removal
Use for data If you select a range of waveform in the Waveform or Timeplot chart, and hit the
Removal
keyboard “Del” key, it is possible to permanently delete this range of data from the
measurement. Use this feature with care. This command is only available in the
Enterprise
Enterprise Edition.
Edition
Only
Another kind of data removal is also possible within the Table List View. Use the
Event Removal command in the Event List in the Event Lis t Bar, or use the Tools >
Data Removal command.
103
Dran-View 6 User Guide
10.11. Format Template
10.11.1.
Introduction
Introduction Format Templates allow you to use pre-set graphical attributes i.e. font type,
to Format
colors, channel colors, etc., while presenting your measured data in different
Templates
scenarios.
Format Templates may be useful when:
• Displaying Dran-View live in a presentation using a projector.
• Creating documents to fit a particular publication.
• Having customer demands for different layouts.
Dran-View typically uses the graphical attributes stored in the Windows Registry.
This is normally your default settings when you open a new data file. Once you
activate a template file, the default settings are taken from the template file
currently in use.
Templates are stored in .DVT file format. When you save to a template file, it will
take the current Registry settings and copy them into the template file.
The Main Status Bar will contain the name of the template file currently in use (if
the Main Status Bar is visible).
The following information can be stored in Format Template:
•
•
•
•
•
•
•
•
•
•
•
•
Channel color mode
Channel colors (all modes)
Print setup
Plot modes
Text styles and contents
Harmonic scaling settings
Report settings
Mouse pointer mode
Minimum chart size
Event color
Area marker appearance
Delta tool color, font and unit
(time, frequency or cycles)
104
Dran-View 6 User Guide
•
•
•
•
•
•
•
•
•
•
View type (single or dual pane)
View background color
Tabbed window settings
Event list font, sort mode and
information display settings
Axis color, font and information
display settings
DFT calculations mode
Chart grid settings
Legend on/off
Phasor settings and appearance
Statistics grid settings and
appearance
10.11.2.
Format Template On/Off
Template
On/off
If you are using format templates, a checkmark
will appear to the right of this
menu option. The format template indicator on the Main Status Bar will contain the
name of the template file currently in use (if the Main Status Bar is visible).
10.11.3.
Format Template Load
Template
Load
When you select this command, a File Open dialog box will appear to let you select
the template file that you want to use. Once a selection has been made and the
dialog box closes, the format template will be applied to all open documents.
This command will be unavailable if you have not selected Use Format Template.
10.11.4.
Format Template Save As
Template
Save As
Use this command to save your current default settings as a Format Template file.
You can later restore these settings by selecting Load Format Template.
Selecting this command will display a Save As dialog box where you can select
what file to save the current settings to.
10.11.5.
Format Template Refresh
Template
Refresh
This command refreshes the currently active format template, i.e. writes any
changes of your settings into the active Format Template file.
105
Dran-View 6 User Guide
10.12. Harmonics/Timeplot Calculator
Harmonics / When you select this command, the Harmonics/Timeplot Calculations dialog box
Timeplot
will be shown. Once you have selected the parameters that you wish to calculate,
Calculator click OK.
Introduction You may want to view parameters like half-cycle RMS values and the harmonic
contents of input waveforms. This command is useful since not all data sources
loaded into Dran-View contains this type of information.
Depending on the instrument that you are using, the following guide may assist in
determining how you should use this tool.
Dranetz-BMI
PowerXplorer PX5,
PowerGuide 4400,
Signature System
Creates RMS values on a one-cycle basis, slides the onecycle window so two RMS points are created per
waveform cycle. 10-cycle Harmonic Groups and 10-cycle
Interharmonic Groups may also be created.
Tech Note:
A 10-cycle harmonic analysis will produce a frequency spectra with
a resolution of 5Hz / band.
A Harmonic Group is the Harmonic frequency component weighted
together with its two 5 Hz band neighbors.
An Interharmonic group is the “sum” of the remaining 5Hz bands
between each Harmonic Group.
When to use this tool:
In Inrush measurement, you may want to see a sliding
one-cycle window of V,I,P,Q,S, Symmetrical
Components, Unbalance factors, and Frequency as they
change during the Inrush Waveshape. This high-density
information is not provided by the instrument.
When not to not use this tool:
The instrument 10-cycle harmonic groups are more
“steady-state”, conforms to the new standards, and should
normally be used instead of the sliding once-cycle
harmonics created by this tool.
Continued on the next page
106
Dran-View 6 User Guide
Introduction PP4300 with Multi(Continued) DAQ TaskCard
Creates RMS values on a one-cycle basis, slides the onecycle window so two RMS points are created per
waveform cycle. Does not produce any Harmonics.
When to use this tool:
In Inrush measurement, you may want to see a sliding
one-cycle window of V,I,P,Q,S, Symmetrical
Components, Unbalance factors, and Frequency as they
change during the Inrush Waveshape. This high-density
information is not provided by the instrument.
If you want to create Harmonic timeplots, make sure you
have measured the proper waveforms. This tool will
provide Harmonic timeplot, containing one-cycle sliding
window values.
PP4300 with PQLite or Creates one RMS-value/cycle. Creates only one userPP1 with PQPlus
specified harmonic number.
TaskCard
When to use this tool:
Anytime you want to see a parameter with higher
resolution than one cycle.
Anytime you want to create Harmonic Timeplots or
Symmetrical Components/Unbalance Factors.
PP1 with Inrush
TaskCard
When to use this tool:
This is the only way to create timeplot parameters /
harmonics, etc.
COMTRADE/ASCII
files
When to use this tool:
If the measurement only contains waveshapes, this is the
only way to create timeplot parameters / harmonics, etc.
107
Dran-View 6 User Guide
10.12.1.
Harmonics/Timeplot Calculator - Welcome Page
Harmonics/ This page provides three basic
Timeplot
modes, selected from the radio
Calculator buttons.
Off
In this mode, the tool is turned OFF. There are no parameters
generated by this tool in the document. In this mode, you can only
show parameters generated by the instrument in your charts. If you
click this button and press OK, the previous parameters generated
with this tool will be removed
Default
Click this button if you want to load a default setup into the tool.
The following parameters and settings are enabled for calculations
by default.
Voltage
Current
Power
V Rms,
I Rms
Real Power
V Peak
I Peak
Reactive Power
V THD
I THD
Apparent Power
Frequency
True Power Factor
V Harm.
I Harm.
Displacement Power Factor
Magnitudes
Magnitudes
Symmetrical Components
V Fund. Pos., Neg. and
I Fund. Pos., Neg. and Zero Sequence
Zero Sequence
Symmetrical Components
Symmetrical Components
V Fund. Unbalance
I Fund.Unbalance Factors
Factors
Setup:
2 Data points/Cycle
50 Harmonics
Totals are calculated
Mix Calculated and Measured Parameters
Continued on the next page
108
Dran-View 6 User Guide
Harmonics/ Custom
Timeplot
Calculator
(continued)
Automatically
generate Most
Common
parameters
when opening
a file of this
type
This option will display
selections on what parameters
to calculate and how they
should be calculated in detail.
This option controls whether the Harmonics/Timeplot calculator
will automatically calculate the parameters selected in your "Most
Common" setting. This action is done whenever a file emanating
from an identical instrument is opened. The "For waveform only
files" option does this only if the file contains no non-waveform
parameters containing valid data.
Always
For waveform only
files
Never
Always run the calculator automatically
when opening a file created by the actual
instrument type, using the “Most Common
Settings.”
Always run the calculator automatically
when opening a file that only contains
waveforms, created by the actual
instrument type using the “Most Common
Settings.”
Never run the calculator automatically
when opening a file from an instrument of
actual type.
Continued on the next page
109
Dran-View 6 User Guide
Harmonics/ RMS
Timeplot
Calculator
Check these options to calculate voltage and current RMS values.
(continued)
Peak (Crest)
Check these options to calculate voltage and current peak values.
Peak values will be calculated once per cycle regardless of your
settings on the Output Options page.
THD
Check these options to calculate voltage and current total
harmonic distortion. The Output Options Page configures the
number of included harmonics.
Frequency (Hz) Check this option to calculate frequency. Only one frequency will
be calculated unless the "Generator Applications" option is
selected on the Output Options page. If there are no Voltage
signals available, it will try to track the frequency using the
current waveforms instead.
Continued on the next page
110
Dran-View 6 User Guide
Harmonics/ Power
Timeplot
Calculator
(continued Phase
difference fund.
Totals
Add L-N wave
shapes if L-L
measured
Voltage
Harmonics
Magnitudes
Check this option to calculate real power, reactive power,
apparent power, true power factor, and displacement power
factor.
Check this option to calculate the phase difference between the
voltage and current fundamentals.
Check this option to calculate total values for most of the selected
parameters.
Check this option to display the calculated line to neutral
waveforms used as a base, e.g. power values if line to line was
measured.
Check this option to calculate magnitudes for voltage harmonics.
Voltage
Harmonics
Phase Angles
Check this option to calculate phase angles for voltage harmonics
Current
Harmonics
Magnitudes
Check this option to calculate magnitudes for current harmonics.
Current
Harmonics
Phase Angles
Check this option to calculate phase angles for current harmonics.
Power
Harmonics
(Watts)
Check this option to calculate magnitudes for power harmonics.
Continued on next page
111
Dran-View 6 User Guide
Harmonics/
Timeplot
Calculator
(continued)
Voltage
magnitudes
Select this option to calculate voltage symmetrical components
magnitudes.
Voltage phase
angles
Select this option to calculate voltage symmetrical components
phase angles.
Current
magnitudes
Select this option to calculate current symmetrical components
magnitudes.
Current phase
angles
Select this option to calculate current symmetrical components
phase angles.
Unbalance
factors
Check this option to calculate unbalance factors. Note that these
are equivalent to the negative and zero sequence components
normalized (divided by) to the positive sequence component.
Continued on next page
112
Dran-View 6 User Guide
Harmonics/
Timeplot
Calculator
Samples per
cycle
Select how many data points per cycle you wish to calculate.
Note that a high setting may cause calculations to take a long
time to complete. If the Harmonics/Timeplot Calculator is
processing slow, try decreasing this number.
Number of
harmonics to
calculate
Select how many harmonics you wish to calculate. The
maximum is the number of samples per cycle divided by two.
Note that a high setting may cause calculations to take a long
time to complete. If the Harmonics/Timeplot Calculator is
processing slow, try decreasing this number.
Harmonics in
THD
Select how many harmonics to use in THD calculations. As a
rule of thumb (and standards), you should use 40 harmonics for
50 Hz and 50 harmonics for 60 Hz.
If a parameter
is measured
Select if you wish to mix measured and calculated data, or
discard one or the other.
Selecting this option will cause the Harmonics/Timeplot
Calculator to skip calculation of channels that have been
measured.
(continued)
Continued on the next page
113
Dran-View 6 User Guide
Harmonics/
Timeplot
Calculator
(continued)
The channels may run on different frequencies. (Generator Application)
Selecting this option will cause calculations to take more time to
complete, but individual values for frequency, sample rate, and
samples per cycle will be used. This may result in more accurate
values if the frequency variation is high and differs between
channels.
Display only one average data point per cluster
Selecting this option will cause the Harmonics/Timeplot
Calculator to calculate an average point for each waveform
cluster (burst of multiple successive cycles) instead of a onecycle sliding window over the cluster.
Calculate odd and even THD
Selecting this option will create odd and even THD channels
when THD is selected.
Increase harmonic accuracy
Selecting this option will increase the accuracy of harmonics
calculations, especially on measurements with large frequency
variations, but calculations will take more time to complete
Symmetrical components for all harmonics
Selecting this option will create the selected symmetrical
components and unbalance factors for all calculated harmonics,
instead of just the fundamental.
Restore settings Clicking this button will restore the "Most Common" settings as
they were when you fist installed Dran-View.
Make this the new 'Most Common' setting
Clicking this button will save your current settings as the "Most
Common" settings. Subsequently selecting "Calculate Most
Common Parameters" on the Welcome Page will calculate
according to your customized settings stored here.
114
Dran-View 6 User Guide
10.13. Harmonic Scaling
Harmonic
Scaling
This command will open the Harmonic Scaling dialog box.
Introduction Harmonics may be presented in many ways. Initially they are calculated from a
voltage or current waveform signal fed into a DFT (or FFT) algorithm that
calculate the magnitudes and phase angles of each frequency component. The
magnitude is in Volts or Amps and is an “RMS” value (using the root- mean-square
formula). In Dran-View these are called “Abs” or “Absolute” values. Others may
call it “Root-Mean-Square” values. It is the same thing.
A common way to scale these values is to divide each harmonic with the
fundamental (for example 50 or 60Hz) and multiply the result with 100. This is
called %FND in Dran-View. In this case the fundamental magnitude always equals
100.0%
Another method is to divide each harmonic with the RMS- value of the signal and
multiply by 100. This is called %RMS in Dran-View.
The last method is to let the user scale the magnitude manually by a custom
number (but not 0.0). This is called %Scale in Dran-View.
Only one
scaling /
parameter is
allowed
across the
document.
Dran-View allows you to have only one type of scaling for each quantity within
the same document. This means that Phasors/DFT Charts, Harmonic Timeplots
from the instrument, and Harmonic Timeplots from the Harmonics/Timeplot
Calculator will all display Harmonics using the same scaling.
To change the settings, use the command Tools > Harmonic Scaling described in
this chapter.
Continued on the next page
115
Dran-View 6 User Guide
10.13.1.
Harmonics Setup Page
Harmonics
Setup Page
The number of options on this page may
vary depending on where you access
these settings.
This page is found in various places in
Dran-View.
Voltage/Current/Watts
These combo boxes contain possible harmonic scaling options.
"Absolute" will not scale the harmonics. They will be displayed
as volts/amps/watts if they were not measured as a percentage.
"%FND" will scale the harmonics to % of the own channel's
fundamental, and display harmonics as %. "%RMS" will scale
the harmonics to % of the RMS value of the same quantity, and
display harmonics as %. "%Scale" will scale the harmonics to %
of a user defined number, and display harmonics as %. If you
select "%Scale", the edit box next to the combo box will be
enabled. Enter a non-zero number to scale the harmonics in this
box. These settings will also affect instrument-generated
harmonics.
Harmonics
Select how many harmonics you wish to calculate from the
combo box. The maximum number of possible harmonics is the
nominal samples per cycle divided by two, rounded down to the
nearest five. Note that harmonics calculations will take more time
the more harmonics you select. If you have DFT charts, phasors.
or text labels containing DFT data, changing the active event may
be experienced as slow. Decreasing this number may speed up
Dran-View.
Harmonics in
THD
Select how many harmonics to use in THD calculations. As a rule
of thumb (and some standards), you should use 40 harmonics for
50 Hz and 50 harmonics for 60 Hz.
Continued on the next page
116
Dran-View 6 User Guide
Harmonics Harmonics calculation method – Enterprise Edition Only
Setup Page
(Continued)
Select how you wish harmonics to be calculated. This option is not
available to phasors, which always uses the "Min/Max/Avg one cycle
values" mode.
Avg of one-cycle
values
This option calculates each cycle individually, and
presents the average values for each channel. This
mode is significantly faster than bins or spectra if a
large number of cycles are selected. If you have DFT
charts, phasors, or text labels containing DFT data,
and changing the active event is experienced as slow,
selecting this mode may speed up Dran-View.
Min/Max/Avg of
one-cycle values
This option calculates each cycle individually, and
presents the minimum, average and maximum values
of each channel in a series each in the harmonic
channel. Phasors always use this mode. This mode is
significantly faster than bins or spectra if a large
number of cycles are selected. If you have DFT charts,
phasors, or text labels containing DFT data, and
changing the active event is experienced as slow,
selecting this mode may speed up Dran-View.
Harmonic and
This option adds (as the square root of the sum of the
interharmonic bins squares) the interharmonics immediately next to each
harmonic to the harmonic to form a harmonic bin, and
the rest of the interharmonics to an interharmonic bin
between each harmonic. To comply with the 61000-47 standard, each harmonic and interharmonic should
have a width of 5 Hz. This equals 12 cycles at 60 Hz
and 10 cycles at 50 Hz. In this mode, phase angles are
discarded.
Spectra
This option presents each harmonic and interharmonic
individually. A one-cycle selection will give the basic
harmonics. A two-cycle selection will introduce an
interharmonic between each harmonic. A three-cycle
selection will introduce two interharmonics between
each harmonic, etc.
Continued on the next page
117
Dran-View 6 User Guide
Harmonics Expansion type This option allows you to choose if sine or cosine expans ion
Setup Page
should be used when calculating harmonic phase angles. If you
(Continued)
are unsure of which mode you should use, sine is recommended.
This option is not available to phasors.
Phase angle
normalization
This option allows you to choose how phase angles sho uld be
normalized. The channel used for normalization always has a
value of zero at all points.
This option is not available to phasors if you have selected the
"Normalize to selected harmonic" option on the General page.
DFT Chart
specific
settings
Connected to
This option lets you choose an Event Details/Waveforms chart in
which to connect the DFT chart to. The Event Details/Waveforms
chart must be located in the same view. The selected chart's area
marker is used as a time base for DFT calculations. See DFT
Chart for more information about this.
When changing the selection in this combo box, a green border
will surround the corresponding Event Details/Waveforms chart.
Show
These checkboxes allows you to show and hide DC, THD, and
THD/DC/FND FND. THD will be displayed to the left of 0 (at a negative
frequency on the X-axis). Hiding the fundamental may make the
DFT chart easier to read as it normally has a significantly higher
magnitude than the harmonics.
Display DFT
Select whether you wish to have harmonic and interharmonic
chart X-axis as indexes on the X-axis or frequency. Note that this only affects the
X-axis labels. The delta tool and the axis status bar will always
display frequency.
118
Dran-View 6 User Guide
10.13.2.
Symmetric Components Page
Symmetrical
Components
Setup Page
Voltage/Current These combo boxes contain possible harmonic scaling options.
"Absolute" will not scale the symmetric components. They will
be displayed as volts/amps if they were not measured as a
percentage. “% of Positive Component” scales each value
towards the positive component at the same frequency. This is
also known as the unbalance factor. “% of Positive Component
FND” scales each value towards the value of the positive
component at the fundamental frequency.
These settings will also affect the instrument- generated
symmetric components.
Phase angle
normalization
This option allows you to choose how phase angles should be
normalized. The channel or point used for normalization always
has a value of zero at all points.
119
Dran-View 6 User Guide
10.14. Rescue Kit
Rescue Kit When you select this command, the
Main Dialog Rescue Kit dialog box will be shown.
Select the action that you wish to
perform, enter the new information, and
click OK.
!
Select the site
you want to
correct
Select a site you wish to modify before pressing any of the
buttons below. (Enterprise Edition only)
Correction of
Timestamps
Clicking this button will open the Correction of Timestamps
dialog box where you can modify the selected site's clock.
Correction of
Probe
Connections
Clicking this button will open the Correction of Probe
Connections dialog box where you can modify the selected site's
connection type and nominal voltage and freque ncy. You can
also correct your data if you have inverted one or more probes.
Correction of
Scale Factors
Clicking this button will open the Correction of Scale Factors
dialog box where you can modify the selected site's scale factors,
in case you supplied incorrect scale factors for your probes when
configuring your instrument.
The Rescue Kit is intended for emergencies. All parameters may not be
recoverable in all situations.
120
Dran-View 6 User Guide
10.14.1.
Probe Connections Dialog
Probe
Connections
Nominal
Voltage
Enter a new nominal voltage here.
Nominal
frequency
Enter a new nominal frequency here.
Measurement
type
Select the connection type of the measurement here.
Invert Probes
Check any probe(s) you may have inverted.
10.14.2.
Scale Factors Dialog
Scale
Factors
In this dialog it is possible to change the
scaling for one or several inputs. If you
have set up the instrument K-factors
incorrectly during a measurement, you
can change them afterwards. The
program will re-calculate the parameters
accordingly.
Rescale
Entering a number to rescale each channel to. 0.5, for example,
Voltage/Current would halve all values for that channel. 1 leaves the values as
by factor
they were.
121
Dran-View 6 User Guide
10.14.3.
Time Dialog
Change the
Clock
With this tool, it possible to change the
clock of the measurement. This
command is useful to correct the realtime clock of the instrument in case it
was incorrect while measuring.
Base
Select the unit of the adjustment.
Adjustment
Select how many time units you wish to add or subtract (start the
number with a minus sign "- " to subtract) from all timestamps.
122
Dran-View 6 User Guide
10.15. Event Removal
Event
Removal
This command will open the Event List
properties sheet. This contains the Event
Removal page wherein you can remove
events and its associated data.
This page has two modes, the "Classic
Event Removal" mode and the "Tree"
mode. The "Tree" mode functions as the
Event Removal command except that
the tree is displayed in this dialog box
rather than in a separate window.
See the Event Removal command for more information about this. The following
text applies to the "Classic Event Removal" mode.
Classic
Mode
Add/remove
event number
Specify an event range in the "Begin event #" and "End event #"
boxes. This range is inclusive, i.e. the events with the specified
event numbers are included in the range. Press the "Add" or
"Remove" buttons to toggle all events with an event number in
the specified range on or off, respectively.
Add/remove
event type
Select the event types you wish to toggle on or off and press the
"Add" or "Remove" buttons to turn these events on or off,
respectively. Selecting the "Separate Channel/Parameter" option
will show events of the same type but triggered by different
channels as separate entries in the list.
Set all / Turn
removal OFF
Click this button to turn all events on, disabling the event
removal.
Clear all
Click this button to turn all events off.
Enabled/
In this list, a separate entry for each event in the file can be
disabled events found, allowing you to toggle individual events on and off.
Tree Mode
Checking this checkbox will toggle this page to the "Tree Mode"
with the same event removal functionality as the Eve nt List Tab
in the Event List Bar.
123
Dran-View 6 User Guide
10.16. Harmonic Demo Tool
Demo Tool
This command brings up a tool to demonstrate harmonics theory. The data shown
has nothing to do with the actual document file you have loaded. You have the
option to add separate phase amplitudes for the three phases and to add separate
harmonic components, with the possibility of changing the phase angle for each
component. On the screen you can observe the three phases and how the harmonics
affect the neutral line. A Hold function makes it possible to freeze and compare
two different setups at the same time.
You will first be shown a dialog box where you can choose a waveform channel
for the initial values. The initial values are selected for the currently active event.
Manipulate the controls at the bottom of the window to see what waveforms with
the specified harmonics will look like.
3-phase stacked mode
3-phase overlaid mode
1-Phase mode with Hold activated
124
Dran-View 6 User Guide
10.17. Personal Information
Personal
When you select this command, the Dran-View Registration Guide will be shown.
Information Enter the information requested on each page and click "Next". On the last page,
click "Finish". If you have changed your e- mail address, you will shortly receive an
e-mail with a link. You must follow this link to complete registration. If you do not
complete registration, you cannot download updates for your Dran-View software.
Your e- mail address will not be given or sold to any third party. You must be
connected to the Internet while running this guide.
!
You must complete the registration guide to be able to use the update feature.
Please make sure you are connected to the Internet while running this guide.
125
Dran-View 6 User Guide
10.18. Options
Options
When you select this command, the Options dialog box will be shown. This allows
you to change many settings that govern the appearance and behavior of DranView. This dialog box contains the following pages.
Event List
Contains settings controlling the Event Tree and Event Box.
Settings
Contains many settings that govern the appearance and behavior of DranView.
Clipboard
Lets you change the kind of images to export to the clipboard when cutting
or copying objects from Dran-View, and the size and resolution of those
images.
Restore Settings
Enables you to revert to Dran-View factory settings for some or all
categories of settings.
File Extensions
Lets you choose which file formats to associate with Dran-View. When you
double-click files of selected types, Dran-View will launch and open those
files.
Used HASPs
Contains information about which HASP keys were recently used.
This page may be used to help customer support.
126
Dran-View 6 User Guide
10.18.1.
Event List Page
Event List
Settings
This page is also available by rightclicking the Event List Tab in the Event
List Bar and selecting “Properties”.
All settings on this page with the
exception of "Font" is accessible
through the Event Tree toolbar.
Sort by
Select a sort order for the Event Tree and the Event Box.
Tree
Select what grouping you wish the Event Tree and the Eve nt Box
to have.
Font
Click this button to open a dialog box where you can choose what
font to use for the Event Tree and the Event Box.
Events
Select the information that you want to display in the Event Tree
and the Event Box.
127
Dran-View 6 User Guide
10.18.2.
Restore Settings Page
Restore
Settings
Select "All" or "Selected" to restore all
or some of Dran-Views settings to their
factory default values. If you select the
"Selected" option, specify what settings
to restore using the checkboxes. The
default settings will be restored when
you click the "OK" button. You may
need to restart Dran-View for some
options to be restored.
10.18.3.
Clipboard Page
Clipboard
settings
This dialog box contains settings related
to the way the pictures are formatted
when using the Edit-Copy command.
Export on Edit-Copy Choose if you wish to create a BMP (bitmap picture) or a
WMF (Windows Meta-File), or both, and place it on the
clipboard when you copy an object in Dran-View.
Size and resolution
Choose the size of the object when Dran-View copies and
pastes it in the clipboard. Select the "Custom" option to
display the text boxes where you can specify the size (in
pixels) of object that you want.
128
Dran-View 6 User Guide
10.18.4.
File Extensions Page
File
Extensions
This page allows you to associate file
types with Dran-View. Double-clicking
a file associated with Dran-View will
open Dran-View and that file. DranView will associate all file types
compatible at startup, if these types are
not already associated with another
application.
Select the file types you wish Dran-View to gain ownership of, and click "OK". On
some operating systems, you may have to restart your computer for these settings
to take effect.
129
Dran-View 6 User Guide
10.18.5.
Settings Page
Settings
Page
Dual pane windows
Select if you want to have two views in each window
(separated by a splitter control) or only one view per
window. You must restart Dran-View if you changed
this setting.
Tabbed windows
When this option is enabled, a row of tabs representing
each window will appear. Clicking one of these tabs
will activate that window. Tabbed views will allow you
to quickly find a window.
Show tab icons
Enabling this option will show an icon to the left of
each window's name on the tabs.
Tabs at bottom
Select if you wish the row of tabs representing each
window to be located above or below the windows.
Gray Background
Select this option to color the background gray instead
of the default white.
Open bookmarks in a new
window.
Select whether or not to open snapshots in a new
window.
Minimum chart size (pixels) Enter the minimum size of each chart or pseudo-chart
(see Overlaid/Stacked Command for an explanation of
this term).
Continued on the next page
130
Dran-View 6 User Guide
Settings
Page
Compress files
when saving
This option is on by default. Deselecting it will cause DranView to save files faster (and open those saved files quicker),
but the files will become larger. To see if a saved file is
compressed, select File > Properties. Uncompressed files can
be compressed by third party applications with reasonable
results. Compressed files, on the other hand, can be reduced
in size only marginally.
Waveform samples
before user
approval of DFT
calculations:
When selecting a large area for DFT calculations, you will be
asked to confirm that you wish to proceed. This number
governs the size of the area you can select without being
asked by the software for confirmation.
Print the event
ruler
Uncheck this option to remove the event ruler from all charts
during printing.
Print the colored
event range
Uncheck this option to remove the event background from all
charts during printing.
Print area marker
Uncheck this option to remove the area marker from all charts
during printing.
(continued)
Skip all journal
Unchecking this option will cause Dran-View to skip all
triggered events – journal triggered events while reading PowerXplorer PX5 /
PowerXplorerPX5/ Power Guide 4400 / PX5-400 files.
Power Guide 4400/
PX5-400 driver
only
Advanced user
interface Enterprise Edition
Only
Selecting Advanced user interface will enable all Enterprise
Edition features. Deselecting it will cause Dran-View to
operate as Professional Edition, with the following
exceptions:
• Snapshots will be available
• Waveform Postprocessor will be available
• Formulas will be available
• All Report Writer pages will be available
• Will be able to open COMTRADE/Text files
• All DFT chart modes will be available
Language
Select what language you want to use from the combo box.
131
Dran-View 6 User Guide
10.18.6.
Used HASPs Page
Used
This page will display a list of the HASP
HASPs Page keys used on this computer. The most
recently used HASP key will be
displayed at the top of the list. If you
have problems with Dran-View, you
may ask Customer Support for this
information.
132
Dran-View 6 User Guide
Chapter 11.
11.1.
Duplicate
Duplicate
11.2.
Tile
This command creates a copy of the current Main View window.
This command will be unavailable if a Text Editor or Data List is active.
Cascade
Cascade
11.3.
Windows Menu
Use this command to arrange multiple opened windows in an overlapped fashion.
Tile
Use this command to vertically arrange multiple opened windows in a nonoverlapped fashion.
133
Dran-View 6 User Guide
11.4.
Arrange Icons
Arrange
Icons
11.5.
Close All
Close All
11.6.
Use this command to arrange the icons for minimized windows at the bottom of the
main window. If there is an open window at the bottom of the application window,
then some or all of the icons may not be visible because they will be underneath
this open window.
This command will close all open windows and documents. If you have made any
changes to these documents, you will be prompted to save.
Window List
Window
List
Dran-View displays a list of currently open windows at the bottom of the Window
menu. A checkmark
appears in front of the name of the active window. Choose
a window from this list to make it active.
134
Dran-View 6 User Guide
11.7.
Window
Window
Manager
This command will display the window
manager, used to administrate windows.
To the left of this dialog box, a list of
open windows appear. You can select
one or more windows in this list. The
following commands are available in the
window manager.
Activate
Activates the selected window. This command will be
unavailable if more than one window is selected.
OK
Closes the window manager.
Save
Saves the document in the selected window to which it belongs
to.
Close Window(s) Closes the selected windows.
Cascade
Cascades the selected windows. This command will be
unavailable if fewer than two windows have been selected.
Tile Horizontally Tiles the selected windows horizontally. This command will be
unavailable if fewer than two windows have been selected.
Tile Vertically
Tiles the selected windows vertically. This command will be
unavailable if fewer than two windows have been selected.
Minimize
Minimizes the selected windows.
135
Dran-View 6 User Guide
Chapter 12.
12.1.
Help Menu
Help Topics
Help Topics This command will display the Help menu. For quick help on a specific subject,
you can also use the Context Help tool or position the pointer over the object you
want help about, and press F1 on your keyboard.
12.2.
Context Help
Context
Help
Use this command to obtain help on some portion of Dran-View. When you choose
the Context Help button, the pointer will change to an arrow and question mark
, and the toolbar button will look like this:
. Then click somewhere in the
Dran-View window, such as another toolbar button. The help topic will be shown
for the item you clicked.
136
Dran-View 6 User Guide
12.3.
Dran-View Update
Dran-View
Update
This command will show the Dran-View
Update dialog box, where you can
change the way Dran-View checks for
updates, and manually check for
updates. You must complete the
registration guide to be able to use the
update feature.
Dran-View
Update
Dialog
Below the radio buttons, you will see when Dran-View last successfully connected
to the Internet and checked for updates. For site license, these options cannot be
changed.
Check for updates
automatically
Selecting this option will cause Dran-View to automatically
check for updates every time it is started and at least 24 hrs
since the last check.
Download
automatically
If you select this option, Dran-View updates will be
downloaded automatically. You will not be prompted to
download the updates.
Install
automatically
If you select this option, Dran-View updates will be installed
automatically. You will not be prompted to install updates
once they have been downloaded.
Remind me every
If you select this optio n, Dran-View will remind you to check
for updates with regular intervals. Use the text box to specify
how often you wish to be reminded for updates.
Disable Dran-View If you select this option, Dran-View will not check for
Update
updates. This is not recommended.
Check for updates
now
Clicking this button will cause Dran-View to look for updates
immediately. Make sure you are connected to the internet
before selecting this button. If you have not selected the
"Check for updates automatically" option, we recommend
that you do this often.
Change personal
information
Clicking this button will launch the Registration Guide.
137
Dran-View 6 User Guide
12.4.
About DV6
About DV6
This command will display the About
Dran-View dialog box, where you can
see what version of Dran-View you are
using and which extra options have been
installed. For detailed information on
memory usage, report and credits, click
"More Info".
138
Dran-View 6 User Guide
Chapter 13.
13.1.
Charts
Introduction
Introduction The Main View Window contains two Views. Each of these views contains a
frame. The frame is a container, which in Professional Edition may contain one or
two charts. Other items are contained within charts.
In Enterprise Edition, frames may contain any kind of objects, i.e. textboxes,
charts, etc. Each chart is also a container and may contain the same type of items
as the frame, with the exception that a chart cannot be contained within another
chart.
This chapter describes the chart itself and the items that are integral parts of a chart
(cannot be moved outside the chart) such as axes, channels, event rulers, legends
and grids.
Frame
Charts
Terms and
Description
Charts are Dran-View's main means of graphically displaying data, and come in
four main flavors:
• Timeplot Charts are used to display long-term data.
• Event Details/Waveform Charts are used to display event specific
instantaneous data.
• DFT Charts are used to display harmonics data for a specific interval.
• Magnitude/Duration Charts are used to plot certain events according to
magnitude and duration.
Timeplot Charts and Event Details/Waveform Charts are fairly similar and will be
described together later. DFT Charts and Magnitude/Duration Charts have special
characteristics and are given separate chapters.
Continued on the next page
139
Dran-View 6 User Guide
Adding and
Deleting
Charts
To add, and in Professional Edition, remove, a chart, select one of the following
commands from the Object Toolbar, the "Insert" menu, or the pop-up menu.
Insert Timeplot Chart
Insert Waveform Chart
Insert DFT Chart
Insert Magnitude/Duration Chart
When you create a chart, two text labels (header and footer) are also created. When
you delete a chart, all items contained within it are also deleted.
Press keyboard “Delete” or the to delete the selected chart.
Selection
To select a chart, click on the grid area. Make sure not to click on a channel, since
doing so will select the channel instead of the chart. A blue border surrounds a
selected chart and all of its children. If a frame contains only one chart, selection
may be difficult to discern. There will always be a small, white space between the
border surrounding a chart and the edge of the window. If this white space is
absent, the frame is selected.
Mouse
Pointer and
Position
When you place the pointer over a chart, the pointer will change according to the
active tool. Based on default settings, a crosshair will also appear to aid you in
determining at what point on the axes a point in the chart is located. Settings for
this crosshair can be changed on the Crosshair page in the chart's property dialog
box. In addition to this, the exact values of the point will also be displayed on the
Axis Status Bar, if it is visible.
Continued on the next page
140
Dran-View 6 User Guide
13.2.
Axes
13.2.1.
Introduction to Axes
Description Axes are reference points to
curves in a chart. Dran-View
will normally display time
(most charts), duration
(magnitude-duration charts), or
frequency (DFT charts) along
the X-axes (horizontal) while
displaying values of channels
along the Y-axes (vertical).
Terms
Both X- and Y-axes are displayed as a thick line with thinner, longer and shorter
lines protruding from it. The longer lines are called main ticks, each of which is
accompanied by a value label, a number representing a point on the axis. The
shorter lines are known as sub-ticks, and do not have value labels next to them.
Most axes, with the exception of standard time axes, also display a unit label to
their top/right. Some Y-axes also have a longer explanation label next to them.
Zooming is used in this text to mean that the scale, such as the distance between
two main ticks, has changed. Zooming out will indicate that this distance is
increasing, while zooming in will imply that it's decreasing. Panning will mean that
the scale is unchanged, but the start and end points of the axis are changing.
Adding,
Deleting
and Moving
Axes
Axes can only be moved within the chart, i.e. you cannot move an axis from one
chart to another. To move an axis, select it in order to see the selection rectangle
around it, then bring the pointer onto the boundaries of the rectangle. The pointer
should now look like this
. You can now click and drag the axis to the desired
location. A tracking rectangle will appear to aid this click and drag action.
Axes are created and destroyed as needed. If channels are added or removed, the
stack mode is changed or modified, or the X-Axis per site option is toggled. Hence,
axes cannot be added except as side effects of other actions. Deleting an axis, either
through the axis' property page or by selecting it and pressing the delete key or
selecting Cut from the pop-up menu or the edit menu (Enterprise Edition only), will
disable all channels associated with the axis.
Continued on the next page
141
Dran-View 6 User Guide
Zooming
Zooming an axis can be done in the following ways:
• By using the Zoom In tool on the Chart or Classic Toolbar or in the Tools >
Active Tool menu
• By using the Zoom Out command on the Chart or Classic Toolbar or in the
Tools > Active Tool menu
• By using the Autoscale command on the Chart Toolbar or in the Tools >
Active Tool menu
• By using the Expand/Contract tool on the Chart Toolbar or in the Tools >
Active Tool menu
• By using the Unzoom All command on the Chart Toolbar or in the Tools >
Active Tool menu
• By toggling the Autozoom to Event tool
• By bringing the pointer over an axis, holding Shift (to maintain the
bottom/left point) or Ctrl (to maintain the top/right point), and then clicking
and dragging the axis; OR by moving the scroll- wheel of the pointing
device as described in the Zoom In Tool and Zoom Out Tool chapters
• By changing the active event if Autozoom to Event Tool is active
• By manually entering a fixed scale on the axis' property page
Panning
Panning an axis can be done in the following ways:
• By using the Pan tool on the Chart Toolbar or in the Tools > Active Tool
menu
• By toggling the Autozoom to Event tool
•
•
•
•
By bringing the pointer over an axis (the pointer should look like this or
like this
) and then clicking and dragging the axis; OR by moving the
scroll-wheel of the pointing device
By changing the active event if Autozoom to Event Tool is active
By manually entering a fixed scale on the axis' property page
For Y-axes, by panning another Y-axis if the Synchronize Y-axis Zero
Point option on the charts Axes property page has been selected
Continued on the next page
142
Dran-View 6 User Guide
Settings
There are two ways of changing the
settings of the axes.
If you double-click the chart (or rightclick on the chart and select Properties),
the Chart-Properties dialog will be
shown.
Under the section “Appearance-Axis”
you will find a page containing common
settings for X and Y-axes, and how they
are to be presented and formatted in the
chart.
If you double-click an axis (or rightclick on the axis and select Properties),
the Axis-Properties dialog box will be
shown.
Most of the settings in this dialog box
are specific for that particular axis
selected.
The following two chapters will describe the options in these two dialog boxes.
143
Dran-View 6 User Guide
13.2.2.
Chart Properties Dialog – Axis Page
Chart
Properties Axis Page
Overlaid/Stacked Toggle chart selection between Overlaid/Stacked mode.
Customize
Checking this option will enable the rest of the options in this
box. Unchecking it will disable them. When this option is
unchecked/disabled, creation of Y-axes in stacked mode will be
done automatically. If you wish to manually specify how the
chart should be stacked, check this option.
Create primarily
from:
Choose if you like to create one axis per unit, or one per unit
and channel type.
Then optionally
split each
unit/type:
Choose if you like to split each Y-axis per phase and/or per site.
X-axis per site –
Enterprise
Edition Only
Checking this option will cause the chart to display one X-axis
for each site present in the document and having visible
channels in the chart. If this option is selected, the site name of
the site where each axis belongs to will be written on it.
Continued on the next page
144
Dran-View 6 User Guide
Chart
Day of week
Properties Axis Page
(Continued) Color
If this option is enabled, the weekday will be written under each
main tick representing a new day on the X-axes.
Clicking this button will open a dialog box where you can
select the color of the axes lines.
Font
Clicking this button will open a dialog box where you can
select the font type for the axes labels.
PF zero point
The At ± 1.0 will cause PF type Y-axes to range from 0 to 0 via
± 1.0. The At ± 0.0 option will cause PF type Y-axes to range
from –1.0 to 1.0.
Synchronize Yaxis zero point
If you select this option, the zero point of all y-axes will be
lined up. Panning one axis will pan all axes.
Make this the new Checking this checkbox and then clicking "OK" will store your
default setting
settings as the new default.
Apply to all
charts now
If you select this option before clicking "OK", all other charts
will also be drawn using the selected styles.
145
Dran-View 6 User Guide
13.2.3.
Axis Properties Dialog – General Page
Axis
Settings
The Axes property page of a chart
contains settings that apply to all axes
belonging to that chart. This page is
generally used for settings that affect all
axes belonging to a chart. The axes' own
property pages contain individual
settings.
The toolbar at the top of this page
contains the following options.
Axis
Properties
Dialog –
General
Page
This option gives the axis a linear scale, i.e. the ratio of the axis unit (for
example voltage) to the perceived distance is the same across the axis.
This option gives the axis a logarithmic scale, i.e. the ratio of the axis unit
(for example voltage) to the perceived distance increases exponentially.
This option toggles chart selection between stacked and overlaid mode.
This command auto-scales the axis.
This command places the axis to the left of the chart.
This command places the axis to the right of the chart.
This command brings up a dialog box where you can choose the font type to
use for the axis text.
This command brings up a dialog box where you can choose the color to use
for the axis.
This command deletes the axis and disables all channels connected to it.
Below the toolbar, the following options appear:
Fixed scale
This checkbox enables the "Minimum" and "Maximum" text
boxes below it. It allows you to manually enter the start and end
values of the axis.
Auto scale
range factor
The percentage number you enter here determines the auto
scaling margins, i.e. how far it should be between the maximum
sample and the top of the chart, and between the minimum
sample and the bottom of the chart.
Day of week –
X axis only
When this option is selected, the day of week will be displayed
below each date on the axis.
146
Dran-View 6 User Guide
13.2.4.
Axis Properties Dialog – Options Page
Axis
Settings
This page is available only to Y-axes.
Axis
Properties
Dialog –
Options
Page
Automatic YAxes
Unchecking this option will display the rest of the options on this
page. Checking it will hide them. While this option is checked,
creation of Y-axes in stacked mode will be done automatically. If
you wish to manually specify how the chart should be stacked,
check this option.
Create
Choose if you like to create one axis per unit, or one per unit and
primarily from: channel type.
Then optionally Choose if you like to split each y-axis per phase and/or per site.
split each
unit/type:
147
Dran-View 6 User Guide
13.3.
Delta Measurement
13.3.1.
Chart Properties – Delta Page
Introduction The Delta-Measurement Tool allows you to measure the relative distance between
two points in the chart. You may only have one Delta- measurement active at a
time. To measure the distanc e between two points, left-click over the first point in
a chart while moving the pointer to the second point. Release the button when
done. The distance between these two points on all axes will now be displayed in
the chart as a delta marker.
Settings
The settings of the Delta-Tool are found
in the Appearance-Delta Page in the
Chart Properties dialog box.
Line Color
Click this button to open a dialog box where you can select the
color that you want to use to draw the Delta Tool.
Font
Click this button to open a dialog box where you can select the
font type that you want to use for the Delta Tool.
Time / 1/Time (HZ) / Phase angle (Degrees)
This option is only available for Event Details/Waveforms
charts. All other charts will always display "Time". Selecting
"Time" will display the X-axis distance as elapsed time,
duration/frequency for Magnitude/Duration, and DFT charts
respectively. Selecting "1/Time (Hz)" will display the inverse
time, and selecting "Phase angle (Degrees)" will display the
phase angle, calculated for the first eligible waveform channel.
Make this the new default setting
Enable this checkbox and then click "OK" to store your settings
as the new default.
148
Dran-View 6 User Guide
13.4.
Grid
Introduction The grid is the collection of horizontal and vertical lines drawn across the chart to
aid you in reading the data. By default, a line is drawn at each main tick of the
leftmost Y-axis on the right side of the chart and the topmost X-axis below the
chart.
Settings
The settings of the Grid are found in the
Appearance-Grid Page in the Chart
Properties dialog box, accessed by
double-clicking the Chart or right
clicking the chart and selecting
"Properties" from the pop-up menu.
Main ticks: Xaxis
When this checkbox is enabled, a grid line will be drawn for
each main tick on the primary X-axis.
Main ticks: Yaxis
When this checkbox is enabled, a grid line will be drawn for
each main tick on the primary Y-axis.
Main ticks:
Color
This option allows you to choose the color of the main tick grid
lines. When you click this button, a dialog box will open where
you can select the color to use for the grid lines.
Main ticks:
Style
This option allows you to choose the style of the main tick grid
lines. Select the desired style from the combo box.
If you want to show the grid for sub-ticks, use the Sub Ticks group of controls with
the same options as described above.
Make this the
new default
setting
Enable this checkbox and then click "OK" to store your settings
as the new default.
Apply to all
charts now
If you select this option before clicking "OK", all other charts
will also be drawn using the selected styles.
149
Dran-View 6 User Guide
13.5.
Event Rulers
13.5.1.
Introduction to Event Rulers
Description
Event Ruler
Event rulers appear above Timeplot, Event Details/Waveforms and
Magnitude/Duration Charts. Each triangular icon
represents one event. The
icon representing the trigger time of the active event will be red with a black border
.
A darker background color (light yellow in these examples) indicates a higher
concentration of events. The color used is the same as the background color of an
event range in the chart. Clicking any of the icons on the event ruler will activate
the represented event.
Adding,
Deleting
and Moving
Event
Rulers
There is at most one event ruler per site present in each chart. To hide the event
ruler, double click it and deselect the ‘Show’ option. To toggle the visibility of the
event ruler, double click the chart it belongs to and change the ‘Show’ setting under
‘Event Ruler Properties’ on the ‘Legend/Rulers’ page of the chart’s property dialog.
To delete an event ruler, you can also select it and press the ‘Delete’ key on your
keyboard.
Settings
Event rulers have no changeable properties except their background color, which is
the same as the active event range background in the chart. This can be changed on
the Markers page in the chart's property dialog box.
150
Dran-View 6 User Guide
13.6.
Legends
13.6.1.
Introduction to Legends
Description
A legend appears below each chart or in the case of Stacked Mode, below each Yaxis row. A legend contains one icon per channel showing the line, bar, or symbol
used for the particular channel in the chart or pseudo-chart that it belongs to. This
graphic representation is followed by the name of that channel. If there is more than
one site present in the document, the name of the site will follow the channel na me.
Clicking an icon in the legend will select the channel it represents.
Adding,
Legends cannot be moved.
Deleting
and Moving To add a legend to a chart that has none, right-click on the chart, select "Properties"
Legends
from the pop-up menu, and check the "Show" checkbox on the Legends page. To
remove a legend, uncheck this option.
Settings
To show or hide the legend(s) for a chart, or alter their appearance, right-click on
the chart, select "Properties" from the pop-up menu, and go to the Legends page.
151
Dran-View 6 User Guide
13.6.2.
Chart
Properties
Legend /
Rulers
Page
Chart Properties Dialog – Legend/Rulers Page
This page of the Chart properties dialog
box contains settings for the Legends
and Event Rulers.
Font
Click this button to open a dialog box where you can select the
font type to use for the legends.
Legend
Properties:
Show
Check this option to display the legend. Uncheck to hide the
legend.
Event Ruler
Properties:
Show
Check this option to display the event rulers. Uncheck to hide the
event rulers.
Make this the
new default
setting
Enable this checkbox and then click "OK" to store your settings
as the new default.
Apply to all
charts now
If you select this option before clicking "OK", all other charts
will also be drawn using the selected styles.
152
Dran-View 6 User Guide
13.7.
Crosshair
13.7.1.
Chart Properties Dialog – Crosshair Page
Chart
Properties
Crosshair
Page
The crosshair settings are found in the
Chart Properties dialog box, under the
Appearance-Crosshair section.
Using a full size crosshair may increase
the readability of position coordinates of
the pointing device.
None
This option will draw only the pointer of the selected tool when
positioned over a chart.
Small
This option will draw a crosshair in addition to the pointer of the
selected tool when positioned over a chart.
Large
This option will draw a crosshair extending to the edges of the
chart in addition to the pointer of the selected tool when
positioned over a chart.
153
Dran-View 6 User Guide
13.8.
Markers
13.8.1.
Event Marker
Event
Marker
The event marker is a colored area
showing the extents of the currently
active event. A dotted vertical line
indicates the time when the event was
triggered.
13.8.2.
Area Marker
Area
Marker
The area marker is a range of data you
manually select using the Area Marker
Tool.
The selected data will override the active
event range as the data range used for
calculations by DFT Charts, Statistics
For a Waveform chart the selected
tables, and Phasors belonging to the
number of points are shown, as well as a
chart.
checkbox to turn on/off the “Free
In the Enterprise Edition, you may also Selection” option. If this option is not
use the Area Marker to delete the
enabled, the area marker will adjust itself
selected data from the measurement.
to the nearest full waveform cycle.
154
Dran-View 6 User Guide
13.8.3.
Chart Properties – Markers Page
Settings
The settings of the Markers are found
in the Appearance-Markers Page in
the Chart Properties dialog box.
Double-click the chart or right-click
on the chart and select "Properties"
from the pop-up menu to open the
Chart Properties dialog box.
Event marker:
Color
Click this button to open a dialog box where you can select the
color used to mark the range of the active event in the chart
background.
Show trigger line
Disable this option to hide the trigger line.
Trigger line color
Change the color of the trigger line by pressing this button.
Show borders
Deselect this option to hide the two black lines at the edges of
the event marker.
Free Selection
This option only affects the Event Details/Waveform Charts.
For all other charts, the area marker will behave as if this option
is enabled. Enabling this checkbox will allow you to choose an
arbitrary area with the area marker tool. If disabled, the area
marker will adjust itself to the nearest full cycle.
Area marker:
Color
Click this button to open a dialog box where you can select the
color used to draw the area marker.
Edge
This slider control determines the percentage of the area
between the "center" portion of the area marker and the edges
of the chart that will be colored with a gradually fading
background by the area marker.
Center
This slider control determines the percentage of the total chart
height that will be solidly colored by the area marker.
Make this the new Enable this checkbox and then click "OK" to store your settings
default setting
as the new default.
155
Dran-View 6 User Guide
13.9.
Channels
13.9.1.
Introduction to Channels
Terms
Channels are graphical representations
in a chart of measured data. Each
channel consists of a collection of series
with slightly different characteristics, for
example a Min, an Avg, and a Max
series.
Example 1. This channel contains Min, Avg and
Max series plus two threshold series (dashed)
A channel may consist of one or several
series of the following types:
HalfMin
Minimum value during a
cycle
values
period of time.
Avg
Average value during a period
Example 2. This channel contains Min, Avg and
of time.
Max series and a Value series (Half-Cycle
RMS).
Max
Maximum value during a
period of time.
Value
A generic “value”. For a
Trend, this series normally
consists of Half-Cycle values.
Example 3. This channel contains a Value series
For a Waveform channel,
these series consists of normal (LF-sampling) and a HF series.
(LF) waveform samples.
For a waveform channel, this series may contain High Frequency
samples.
HF sampels
HF
LF sampels
HiHiLim A trigger threshold - very high limit value
HiLim
A trigger threshold - high limit value
LoLim
A trigger threshold - low limit value
LoLoLim A trigger threshold - very low limit value
There are three main types of channels in Dran-View, measured channels which
originate from the instrument, calculated channels which are generated by the
Harmonics/Timeplot Calcula tor (Enterprise Edition only), DFT calculations or
other means within Dran-View, and math channels (Enterprise Edition only) which
are user-defined channels derived from a mathematical formula.
When plotting a channel, the individual series can be enabled/disabled.
Continued on the next page
156
Dran-View 6 User Guide
Adding,
Deleting
and Moving
Channels
To add or remove a measured or
calculated channel to a chart, click its
checkbox on the Channels page in the
chart's property dialog box. Access this
box by right-clicking on the chart and
selecting "Properties" from the pop-up
menu.
One page of this type will exist per
channel category that contains any
channels present in the selected site. One
set of pages will exist per site present in
your document.
This button will check or uncheck
ALL checkboxes in the page.
A checkbox like this, will
enable/disable ALL series in the
particular CHANNEL.
As stated above, some measured channels have many series. To add (or remove)
series individually, click the ‘+’ sign to the left of the channel. It will expand the
row and turn into a ‘-’ sign.
This button expands/contracts
ALL rows in the page.
These buttons will expand/
contract the particular row.
When the row is in this mode, the checkbox will
enable/disable an individual SERIES in the
CHANNEL.
You should no w be shown one checkbox per series for this channel. If you wish to
show one checkbox per series for all channels, click the + sign at the top- left of the
page.
Continued on the next page
157
Dran-View 6 User Guide
To hide all series of a specific kind, you
can also click the "Hide/Show series"
button. Disable the checkbox
corresponding to that series’ type in the
dialog box that appears.
For instance, if you uncheck the “Value”
series, all plotted channels within the
chart will exclude the “Value” series,
unless you expand a channel and
manually check the corresponding
checkbox. The settings in this dialog box
are not limited to the current page.
Changing this setting will affect all
channels.
To add a math channel (Enterprise
Edition only) to a chart, click the
checkbox on the Math Channels page of
the chart's property dialog box. Access
this box by right-clicking on the chart
and selecting "Properties" from the popup menu. Math channels always consist
of a single series.
To remove a channel, disable its checkbox or select one of its series and press the
“Delete” key on your keyboard to remove that series.
As each channel is connected to one X- and one Y-axis, it cannot be moved
without moving the axes related to it.
Continued on the next page
158
Dran-View 6 User Guide
Selection
To select a channel, click on the chart.
Since this can be difficult at times, you
can also click on the channel's icon in
the legend. A selected channel should
appear thicker in the chart as well as in
the legend.
Settings
As mentioned above, the visibility
settings for channels are found on the
Channels pages and the Math Channels
page (Enterprise Edition only) of the
chart's property dialog box.
Each channel’s color, style and
thickness, as well as the appearance of
thresholds can be altered on the Colors
page in the same dialog box.
Channel colors page
Here you will also find the Plotting page
containing general drawing options for
all channels in a chart.
Plotting page
Finally you can also alter channelspecific settings in the channel's property
dialog box. This dialog box will appear
if you select "Properties" from the popup menu of the selected channel.
You also have the option to rename a
channel in this dialog box.
Channel properties
159
Dran-View 6 User Guide
13.9.2.
Channel
Colors
Page
Chart Properties - Channel Colors Page
This page allows you to change the
appearance of channels.
Channel List
This list contains one entry per channel. An entry consists of the
channel name and a sample line the channel is drawn in. The line
color, style and thickness settings affect the channel(s) selected in
this list.
Color
This option allows you to choose the color of the channel line or
bar. When you click this button, a dialog box will open where
you can select a color for the line plot.
Line Style
This option allows you to choose the style of the line plot for the
channel. Select the desired style from the combo box.
Line Thickness
This option allows you to choose the thickness of the line plot for
the channel. Select the desired thickness from the combo box.
Color
Scenarios:
Locked to
channel
This option connects the selected style and color to a specific
channel definition, i.e. AVrms will always have the same line
style and color, BVrms will have its own line format, etc.
Color
Scenarios:
Incremental 1
This option connects the selected line style and color to the order
of channel plots, i.e. the first plot will have its own line style and
color, the second will have its own format, etc. Should you
disable the first channel, the second will assume its format, etc.
Color
Scenarios:
Incremental 2
Same as Incremental 1, but the default values are monochrome.
Continued on the next page
160
Dran-View 6 User Guide
Channel
Thresholds
Colors
Page
(Continued)
Click this button to open a
dialog box where you can alter
the appearance of threshold
channels.
Thresholds:
Color
This option allows you to choose the color of the
threshold line. When you click this button, a
dialog box will open where you can select a color
for the threshold. This option will be disabled if
the "Same color as channel" option is selected.
Thresholds:
Same color
as channel
Selecting this option will cause all thresholds to be
drawn using the same color as the channel they
belong to.
Thresholds:
Style
This option allows you to choose the style of the
line plot for thresholds. Select the desired style
from the combo box.
Thresholds:
Thickness
This option allows you to choose the thickness of
the line plot for thresholds. Select the desired
thickness from the combo box.
Make this the
new default
setting
Enable this checkbox and then click "OK" to store your settings
as the new default.
Apply to all
charts now
If you select this option before clicking "OK", all channels in
other charts will also be drawn using the selected styles.
161
Dran-View 6 User Guide
13.9.3.
Channel
Plotting
Page
Chart Properties - Channel Plotting Page
This page allows you to change the
appearance of the chart, and the way
channels are drawn. The options in this
page will change the appearance of all
channels.
If you wish to specify options
individually for one or more channels,
see Channel Properties.
Chart Type List
Select between 2D Line chart and 2D Bar chart. Changing this
selection will alter the controls available in the "Options" group.
2D Line chart: Options: Line Drawing: Stepwise
This option will draw a horizontal line from sample x to the
position of the next sample x, and a vertical line from sample y to
the position of the next sample y.
2D Line chart: Options: Line Drawing: Point-to-Point
This option will draw straight lines from each samples x, y to the
position of the next samples x, y.
2D Line chart: Options: Min/Max/Avg Channels Fill mode: None
This option will not color the area between the Min and Avg
series and/or the Avg and Max series.
2D Line chart: Options: Min/Max/Avg Channels Fill mode: Soft
This option will color the area between the Min and Avg series
and/or the Avg and Max series in a softer tone of the channel's
color. If several areas overlap, a mix of their colors will be used.
2D Line chart: Options: Min/Max/Avg Channels Fill mode: Solid
This option will color the area between the Min and Avg series
and/or the Avg and Max series in the channel's color. If several
areas overlap, the last channel will be drawn on top of the others.
2D Line chart: Show gaps while monitoring is off
If this option is enabled, no lines will be drawn between points
where the instrument is not measuring.
Continued on the next page
162
Dran-View 6 User Guide
Channel
2D Bar chart: Options: Fill: Solid rectangle
Plotting
This option will draw each bar as a rectangle. This is slightly
Page
faster than the "Blended cylinder" option.
(Continued)
2D Bar chart: Options: Fill: Blended cylinder
This option will draw and shade each bar as a cylinder.
2D Bar chart: Options: Fill: Outline
This option will surround each bar with a black rectangle, as well
as draw a line between each Min/Max/Avg segment of the bar.
2D Bar chart: Options: Grouping
This combo box contains grouping options. Select the grouping
mode you wish to use from the list.
Optimize for: Speed
This option causes the chart to redraw faster.
Optimize for: Quality
This option causes an increase in graphical quality.
Make this the new default setting
Enable this checkbox and then click "OK" to store your settings
as the new default.
Apply to all charts (of the same type) now
If you select this option before clicking "OK", all other charts of
the same type will also be drawn using the selected styles.
163
Dran-View 6 User Guide
13.9.4.
Channel
Properties
Channel Properties Dialog – General Page
This page of the Channel Properties
dialog box allows you to rename a
channel and its unit.
Renaming a
channel
Example: If you are measuring
Temperature on one of your voltage
channels, you may want to rename the
channel to “Temperature” and change
the unit to degrees Celsius/Fahrenheit.
Channel
In this text box, you can change the name of the channel.
Unit
In this text box, you can change the unit of the channel.
Phase
In this text box, you can change the phase of the channel.
Description
In this text box, you can change the description of the channel.
Reset to default
Click this button to restore the default name, unit, phase and
description of the channel.
164
Dran-View 6 User Guide
13.9.5.
Channel Properties Dialog – Appearance Page
Channel
Properties
The options in this page will only affect
the selected channel. If you wish to
change the chart style for all channels,
Appearance do this in the Plotting Page of the charts
Page
properties dialog box. If you wish a
channel to use these settings rather than
the individual settings, select the "Same
as Chart" option. This is the default
setting.
Line/Bar
Toggle to plot channels as lines or as vertical bars.
Line Style
This option allows you to choose the style of the line plot for the
channel. This option will be disabled if you have selected the
"Bar" option. Select the desired style from the combo box.
Line Thickness
This option allows you to choose the thickness of the line plot for
the channel. This option will be disabled if you have selected the
"Bar" option. Select the desired thickness from the combo box.
Line Fill Mode
This option allows you to choose the fill mode, i.e. the color of
the area between the Min, Avg and Max series. This option will
be disabled if you have selected the "Bar" option. Select the
desired style from the combo box.
Line Plot Mode
This option allows you to choose the plot mode of the channel.
This option will be disabled if you have selected the "Bar"
option. Select the desired plot mode from the combo box
Color
This option allows you to choose the color of the channel line or
bar. When you click this button, a dialog box will open where
you can select a color.
Bar Style
This option allows you to choose the bar style. This option will
be disabled if you have selected the "Line" option. Select the
desired style from the combo box. The "Solid" option will cause
the channel to draw faster.
Continued on the next page
165
Dran-View 6 User Guide
Channel
Properties
Bar Outline
Appearance
Page
Make this the
new default
(Continued) setting
This option allows you to put a solid border around the bars. This
option will be disabled if you selected the "Line" option. Select
"Yes" or "No" from the combo box.
Enable this checkbox and then click "OK" to store your settings
as the new default.
Always use this This option will be enabled if you select "Make this the new
channel plotting default setting". If you select this option before clicking "OK",
type
the bar/line setting will be included in the default settings. If so,
the channel will always plot using the same format.
Use this
appearance in
all color
scenarios
This option will be enabled if you select "Make this the new
default setting". If you select this option before clicking "OK",
the selected appearance will be used regardless of your "Color
Scenarios" selection on the Channel Colors Page of the charts
properties dialog box.
Apply to all
charts now
If you select this option before clicking "OK", identical channels
in other charts will also be drawn using the selected format.
Continued on the next page
166
Dran-View 6 User Guide
13.9.6.
Channel Data Annotations (“Bubbles”)
Description Data annotations are textual information attached to a sample or the event in which
a sample belongs to.
Enterprise
Edition Only
Terms
The sample to which a text annotation belongs is called the attachment point.
Similarly, the channel to which the attachment point belongs is called the
attachment channel. Hiding the attachment channel also hides the note.
Adding,
Deleting
and Moving
Data
Annotations
To add a data annotation, select a
channel by clicking on it (it should now
appear thicker than usual) or by clicking
its icon in the legend. The insert data
annotation
toolbar button is now
enabled. "Data Annotation" should
appear under the "Insert " submenu in the
chart's pop-up menu.
Select a channel and then right-click where on
the curve you want to attach the bubble. From
the pop-up menu select “Data Annotation”.
Select either of these methods to add a
data annotation to the selected channel.
By default, the “bubble” shows the data values
where it was attached.
Data Annotations can only be moved around the attachment point or moved to
another location on the same curve. When you bring the pointing device over the
Annotation, the pointer will now look like this
. Click and drag the data
annotation to the desired location while maintaining the same attachment point.
If you hold Ctrl or Shift while dragging, the attachment point will change to the
nearest sample. A tracking rectangle will appear to guide you on where to
drop/place the annotation. The position of the data annotation is relative to the
position of the attachment point, so data annotatio ns may not always be visible.
To delete a data annotation, select it and press the “Delete” key on your keyboard.
You can also use the delete button in its General Properties page.
Continued on the next page
167
Dran-View 6 User Guide
Data
All setting for the data annotation are found in its property dialog box. To view this
Annotation dialog box, select the data annotation, right-click on the chart, and select
Settings.
"Properties" from the pop- up menu.
General
Page
This page of the dialog box works the
same as the properties for the text box
item. See separate chapter.
You may use plain text and/or control
codes to format text for Data Annotation.
Appearance This page governs the appearance of the
Page
Data Annotation.
This page of the dialog box works the
same as the properties for the text box
item. See separate chapter.
168
Dran-View 6 User Guide
13.10. Math Channels
Math
Channels
Enterprise
Edition
Only
The main part of this page consists of a table containing one row per available math
channel. The top- left cell contains a button used to toggle all math channels on/off.
The checkbox on each row is used to show/hide an individual math channel.
Double-clicking fields in the “Name” or “Unit” columns allows you to edit them.
Duplicate names are not allowed.
The “Formula” column contains buttons with the first part of each formula.
Pressing one of these buttons will open the Formulas Dialog box where you can
edit the formula.
The “Embed” column contains combo boxes with the values "If used", "Always"
and "Never". The selection in these boxes represent whether the formula should be
saved/embedded within DV6 files. "If used" includes the formula only if it has been
calculated for this file, even if it is turned off. "Always" always includes the
formula. "Never" never includes the formula.
The seventh and eighth columns contain the formulas description and author, as
entered on the Info Page.
Continued on the next page
169
Dran-View 6 User Guide
Math
Channels
(Continued)
The “Status” column consists of one icon per math channe l. The icons have the
following meanings:
Icon Description
Formula OK
Explanation
This formula can be or is calculated.
Required channel
not present
A channel that is used in this formula cannot be
found.
Likely causes:
§ No such channel exists in this file
§ The channel referred to exists in another site
§ The channel name is misspelled
No formula entered The formula is empty.
Illegal recursion
The formula uses some other user-defined formula. A
user-defined formula may consist of a combination of
pre-defined formulas.
Likely causes:
§ You have changed the name of one or more formula.
§ You have imported one or more functions from a DV6 or DFF file, which have names
identical to or contain referenced to formulas already present on your system.
Required site not
present
A site that is used in this formula cannot be found.
Likely cause:
§ There are too few sites present in the document.
§ The site number is misspelled.
Syntax error
The formula is malformed.
Likely causes:
§ You have misspelled the name of one or more functions used in the formula
§ One or more functions used in the formula has been deleted
§ You have imported the formula from a DV6 or DFF file, but one or more formulas used
by the formula is missing.
§ You have imported the formula from a DV6 or DFF file emanating from a newer version
of Dran-View, containing expressions your system does not have.
§ You have mistakenly typed 'garbage' signs while designing the formula
§ You have forgotten or placed one or more channel, function or parameter delimiters
("[", "]", "(", ")" or ";" in the wrong position.
§ The formula starts or begins with an operator (+,-,*,/)
§ An operand is missing between two operators
§ An operator is missing between two operands
Continued on the next page
170
Dran-View 6 User Guide
Math
Channels
(Continued)
Enterprise
Edition
Only
Import...
Click this button to open a File Open dialog box where you can
choose a DFF file to import. Importing a DFF file will add all
formulas it contains to your system. If a formula within the DFF
file has a name identical to an existing formula, the Duplicate
Formulas dialog box will be shown.
Export...
Click this button to open a Save As dialog box where you can
choose an existing DFF file, or specify a new file to be created.
After clicking "OK", you will be shown a dialog box asking if
you wish to include formulas marked "Never" in the embed field.
Formulas marked "If used" will always be exported even if they
are not used, as this option only refers to DV6 files. Click "Yes"
or "No" to complete the export.
Delete...
Click this button to delete the selected formula. You will be
asked to confirm deletion of selected formula. If no formula is
selected, this option will be unavailable.
New...
Click this button to open the Formulas dialog box to allow you to
create a new formula. If a formula is selected when doing this,
you will be asked if you wish to use the selected formula as
template. If you select "Yes" the Formulas dialog will contain
information identical to that of the selected formula. If you select
"No", or no formula is selected, the dialog will be blank.
Edit...
Pressing one of these buttons will open the Formulas dialog box
where you can edit the selected formula. If no formula is selected,
this option will be unavailable.
Continued on the next page
171
Dran-View 6 User Guide
13.10.1.
Math Channel Formula Editor
Math
Channel
Formula
Editor
This dialog box is used to create and edit
math channels.
Enterprise
Edition
Only
Terms
An Operator is an expression that does something to Operands.
+,-,*,/ are examples of operators.
10, [Site 1.A-NVrms.VAL], SQRT(2) are examples of operands.
Functions are generally regarded as operators but since by syntax they behave as
operands (as complete expressions), they are categorized as operands in this text.
Parameters are data that go into functions.
The expression MOD([Site 1.A-NV.VAL];2.0) has two parameters, "[Site 1.ANV.VAL]" and "2.0".
Formula
Editor
Formula Edit Box At the top of the page, you will find a text box where the
formula is displayed. You can edit this text manually if you
wish to do so.
Warnings
This frame may contain messages concerning errors in the
formula. The error messages have the following causes:
Message
No channel selected
Cause
You pressed the "Add" button below the channels list without first selecting
an item in the list.
You pressed the "Add" button below the functions list without first selecting
an item in the list.
The formula uses some other user-defined formula. A user-defined formula
may consist of a combination of pre-defined formulas.
A channel operand specifies a site that cannot be found.
A channel operand specifies a channel that cannot be found.
A channel operand specifies a series of code that does not exist. Valid values
are "VAL" , "MIN", "AVG", and "MAX".
There are two consecutive operands, two consecutive operators, an
unmatched right parenthesis, or an erroneous number of parameters given a
function in your formula.
You have not typed anything after a "." or an "e" following a number.
You have entered an unknown text string.
No function selected
Illegal recursion
Invalid site
Channel X not found
Invalid channel
definition
Unexpected X
Incomplete number
Unknown function X
Continued on the next page
172
Dran-View 6 User Guide
Formula
Editor
(Continued)
Enterprise
Edition
Only
Notes on syntax
• The decimal delimiter is "."
• Numbers may be entered as exponentials using "e", i.e "10.0e2" equals 100.
• No other characters including "," and " " (space) may be used in numbers.
• A left parenthesis "(" must follow a function name.
• ";" is used as the parameter delimiter.
• A right parenthesis ")" must follow the parameter list.
• A function must be supplied with its correct number of parameters.
• Some functions have additional requirements to produce meaningful results,
such as that one parameter must contain zero-transitions. These are noted in
the "Information" section displayed when the function is selected in the
function list.
• Formula names may only contain the letters a- z, the numbers 0-9, and
underscores.
• Formula names must begin with a letter a- z.
• Each left parenthesis "(" must be matched with a right parenthesis ")".
• Any missing right parenthesis ")" will be assumed to be positioned at the
end of the formula.
• Channel names must be enclosed in square brackets "[", "]" .
• Channel names consist of three parts appearing in this order: the site
definition, the channel definition, and the series definition. These must be
separated by ".".
• The site definition must begin with the string "Site " followed by a number.
Site 1 is considered to be the first site added to the document, site 2 the
second, etc.
• Site definitions must specify an existing site.
• If no site definition is present, site 1 is assumed.
• Channel definitions consist of the channel's phase followed by the channel's
name, without any delimiters or spaces.
• Channel definitions must be present in a channel name.
• Channel definitions must specify an existing channel.
• Valid series definitions are: "VAL", "MIN", "AVG", and "MAX".
• If no series definition is present, "AVG" is assumed if present, otherwise
"VAL".
• Formulas may not contain any expressions except channel names, functions,
parentheses, parameter delimiters, and the operators +, -, * and /, not even
spaces " ".
Continued on the next page
173
Dran-View 6 User Guide
Formula
Expressions are resolved according to the following priority:
Editor
1. Parameters
(Continued)
2. Functions
Enterprise
3. Expressions within parentheses "(" and ")"
Edition
4. The operators * and /
Only
5. The operators + and Name
Type the name of your function here. Formula names may only
contain the letters a-z, the numbers 0-9, and underscores. They
must begin with any letter from a- z. The name must also be
unique, i.e. you cannot have two formulas with the same name.
No distinction between upper case and lower case letters are
made.
Unit
Type the unit of your function here. The calculated channel will
be attached to a Y-axis with this unit. Upper case and lower case
letters are considered distinct for this purpose.
Channels Site
List
This combo box contains all sites present in the document. The
channel list will display channels present in the selected site.
Channels Series This combo box contains "Value", "Min", "Max", and "Avg".
List
The channel list will display channels that contain the selected
series.
Channel List
This list will display channels filtered by your selection in the site
list and the series list. Double-clicking a channel will insert that
channel at the caret in the formula edit box.
Add
Click this button to insert the channel selected in the channel list
at the caret in the formula edit box.
Function
Category
This combo box contains a list of function categories. Changing
the selection in this combo box will alter the contents of the
function list. You will find your own formulas under "Custom" at
the bottom of this list.
Function List
This list will display functions filtered by your selection in the
function category combo box. Double-clicking a function will
insert that function at the caret in the formula edit box. Changing
the selection in this list will alter the information displayed in the
"Information" box.
Add
Click this button to insert the function selected in the function list
at the caret in the formula edit box.
Continued on the next page
174
Dran-View 6 User Guide
Formula
Information
Editor
(Continued)
Enterprise
Edition
Only
Numerals and
This box contains one button for each number (0-9), the decimal
Basic Operators delimiter ("."), the four basic operators (+,-,*,/), parentheses ("(",
")"), and the parameter delimiter (";"). Clicking any of these
buttons will insert the character it depicts at the caret in the
formula edit box.
Controls
Formula
Editor
Info Page
When a function is selected in the function list, this box will
display the function name, how many parameters it takes, and a
short description of the function parameters and return value.
This box contains the following buttons:
This button acts as the backspace button on your keyboard,
i.e. it deletes the character immediately preceding the caret,
or the selected text in the formula edit box.
This button moves the caret in the formula edit box one
character to the left.
This button moves the caret in the formula edit box one
character to the right.
This button cuts out the selected text in the formula edit box
and places it on the clipboard.
This button pastes the content of the clipboard at the position
of the caret in the formula edit box.
This button copies selected text in the formula edit box and
places it on the clipboard.
The second page of the Formula Editor
dialog box contains options to add
additional information to the formula.
Enterprise
Edition
Only
Author
Write the name or company of the author of the formula here.
Description
Write a description of the formula here. This description will
appear in the "Information" box on the Math Formulas Page.
175
Dran-View 6 User Guide
13.11. Timeplot and Event Details/Waveform Chart Specific Information
Specific
These charts always have time on their X-axes. They display event rulers and event
Information markers. Event markers are thin, vertical, dotted lines indicating the trigger time of
the active event. The time range of the active event is also shown in a different
color in these charts. To change the settings for these, go to the Markers page on
the charts property dialog box.
Event Details/Waveform Charts have “Autozoom to Event” enabled by default.
Charts with this option enabled will display textual event information or a picture
describing the event if no waveforms are available. This picture will show an arrow
of the same color as the trigger channel, and the available thresholds for that
channel. The arrow will span over the crossed thresholds.
On PowerXplorer PX5, files containing EN50160 events, Event Details/Waveform
Charts will display a report if an event of this type is active. Many of the bars on
the first page of this report are clickable for additional information. Use the buttons
at the bottom of the page to navigate it.
Enterprise
Edition
In the Enterprise Edition, you may delete a chart by selecting it and pressing the
Delete key on your keyboard. You may also move a chart by clicking on it and
dragging it to another location. While dragging, a tracking rectangle will appear to
guide you where you want to drop/place the chart.
176
Dran-View 6 User Guide
13.12. DFT Chart Specific Information
Specific
DFT charts display harmonics data, calculated for a specific time range. DFT charts
Information differ from the general description of charts in the following ways:
• The DFT chart defaults to bar graph.
• The DFT chart has frequency or harmonic index along the X-axis.
• The DFT chart footer contains DFT data as opposed to event data by
default.
• The data displayed in the chart is calculated by Dran-View based on the
measured waveforms.
• The DFT chart does not always contain data.
• The DFT chart, although not a child of any other chart, can be connected to
one as a time-range source.
• Textual DFT data and child-phasors always use the same time-range for
calculations as the DFT chart itself.
• There are additional settings on the Harmonics Page of the properties dialog
box.
For more information about harmonics, see the Harmonics Page.
Time Range The DFT chart determines the time-range to use for calculations in the following
order:
1. If connected to an Event Details/Waveform Chart which contains an active
Area Marker, the range of the Area Marker is used.
2. If not connected to another chart, the time range of the active event is used
(if this is a full cycle).
3. If the range in 1 or 2 is not a full cycle, the starting-point is maintained and
the end-point is moved to the end of a full cycle after the starting point (if
there are enough waveforms available).
4. If there are any "gaps" and ranges with missing samples having been
determined, the starting-point is maintained and the end-point is moved to
the nearest full cycle ending before this gap.
If the range now determined does not equal at least one cycle, no data is calculated
Settings
The settings for the DFT chart are mostly identical to those of other charts. Specific
differences can be found on the Harmonics Page.
177
Dran-View 6 User Guide
13.13. Magnitude/Duration Chart Specific Information
Description Magnitude/Duration charts display the magnitude-duration relations of sags, dips,
swells, and interruptions as scatter plots. Magnitude/Duration charts differ from the
general description of charts in the following ways:
• Magnitude/Duration charts do not display the measured values, but the
duration of deviations from their nominal values.
• Magnitude/Duration charts have duration along their X-axes.
• Magnitude/Duration charts default to logarithmic X-axes.
• Magnitude/Duration charts' footers by default contain Magnitude/Duration
data as opposed to event data.
• Data Annotations in Magnitude/Duration charts use events from the sample
they are attached. An event represents a source of data and time ranges
rather than the active event.
• Special limit curves are available on the Limit Curves page of their property
dialog box.
• Magnitude/Duration charts may display more than one event marker, as
different phases during the same event may have different magnitude and
duration.
Magnitude/Duration charts' lack many settings available in other charts not
applicable to Magnitude/Duration charts.
Settings
The settings for Magnitude/Duration charts are mostly identical to those of other
charts, but they do not have the Plotting or Axes pages. Specific differences can be
found on the Limit Curves page.
!
Clicking an event symbol in the Magnitude/Duration chart will activate that event.
178
Dran-View 6 User Guide
13.14. Magnitude/Duration Limit Curve Page
Limit Page
This page is the shown if you doubleclick a Magnitude/Duration chart (or
right click and select Properties from the
pop-up menu).
Select Limit
Curve
This list contains the standard limit curves delivered with DranView and any customized limit curves you may have created in
this dialog box.
Nominal Voltage: Edit the “Volts” field to the proper Nominal Voltage.
Site
In the Enterprise Edition, you may have several sites. You may
need to adjust the nominal voltages individually. Select the site
for which you want to edit the nominal voltage before changing
the value.
Advanced
This checkbox activates the Limit Curve Edit part of the page.
Name
This edit box allows you to give your Limit Curve a name.
Low Limit
Enter X and Y values to create your Low Limit curve.
High Limit
Enter X and Y values to create your High Limit curve.
Create Copy
Use this button if you want to fill in the limits from an existing
curve from the “Select limit curve” list box.
Apply Changes
This will immediately apply your changes to the chart.
Remove
This button will remove the selected Limit curve from the list.
Dran-View standard curves cannot be removed.
179
Dran-View 6 User Guide
Chapter 14.
14.1.
Phasors
Introduction
Description A phasor shows the phase angle and
relative magnitude for each channel for
one selected harmonic during a specific
time interval.
CV
AV
BV
A B
V 0° 240°
Terms
C
120°
A phasor arrow is the arrow representing the average value of one channel. A
phasor range is the colored area representing the minimum and maximum values of
the phase angle for one channel. The grid is the support line, drawn to aid the
reading of the phasor arrows. The phasor labels are the names of each channel
written next to the phasor arrow. The angle labels are the values 0, 90, 180 and 270
marked on the grid. The footer is the textual information below the graphics.
For more information about harmonics, see the Harmonics Page.
Adding,
To add a phasor, select “Insert Phasor”
from the Object Toolbar, "Insert "
Deleting
menu, or the pop- up menu.
and Moving
Phasors
To change the size of a phasor, select it and bring the pointing device over one of
the squares at each corner and at the center of each side. The pointer changes to
indicate resizing. Now click and drag the corner or side to the desired size. While
dragging, a tracking rectangle will appear to guide you in resizing a phasor.
In Enterprise Edition, you may select a phasor and press the Delete key on your
keyboard to remove it.
To move a phasor, bring the pointing device over it so that the pointer looks like
this
. Now click and drag the phasor to the desired location. While dragging a
tracking rectangle will appear to guide you in moving a phasor.
Continued on the next page
180
Dran-View 6 User Guide
Time Range The phasor determines the time-range to use for calculations in the following order:
1. If its parent is a DFT Chart, the same range as its parents will be used.
2. If its parent is an Event Details/Waveform Chart that contains an active
Area Marker, the range of the Area Marker is used.
3. If 2 is not the case, the time range of the active event is used (if this is a full
cycle).
4. If the range in 1 or 2 is not a full cycle, the starting-point is maintained and
the end-point is moved to the end of a full cycle after the starting point (if
there are enough waveforms available).
5. If there are any "gaps" or ranges with missing samples in the range now
determined, the starting-point is maintained and the end-point is moved to
the nearest full cycle ending before this gap.
6. If the range now determined does not equal at least one cycle, no data is
calculated.
Settings
All settings for a phasor are available in its properties dialog box. To access this,
right-click on the phasor and select "Properties" from the pop-up menu.
181
Dran-View 6 User Guide
14.2.
Phasor Properties Dialog – Basic Page
Basic
Settings
The phasor settings are available in two
modes: Basic and Advanced.
The page to the left shows the Basic
mode.
Parameters
These checkboxes allow you to choose whether to display
voltage or current information, or both.
Site
This combo box allows you to choose what site you wish to
display information from. The "Auto" option will display
information from the site to which the active event belongs. If no
event is active or if the site lacks waveform data in the range of
the active event, the first site containing valid data in the selected
range.
Advanced Mode This option will exchange this page for the General Page, and
display the Appearance Page and the Harmonics Setup Page.
Make this the
new default
setting
Enable this checkbox and then click "OK" to store your settings
as the new default.
182
Dran-View 6 User Guide
14.3.
Phasor Properties Dialog – General Page
Advanced
Settings
The phasor settings are available in two
modes: Basic and Advanced.
General
Page
The page to the left shows the Advanced
mode.
In this mode three pages are available.
This page also includes all settings on
the General Page. These options are not
listed here.
Parameters
Under the "Voltage" option, three radio buttons allow you to
select between data based on line-to-line or line to neutral
wave shapes, if both are available. If you select "Auto" the
measured data is used. The "Power" checkbox will display
phasor arrows for power harmonics.
Harmonic
This option will allow you to choose for which harmonic you
wish to display data. In basic mode, FND is always used.
Normalize to
selected harmonic
This option will normalize phase angles to the harmonic
selected in the harmonic combo box of the selected channel.
Include Channel D
This option will show a phasor arrow for channel D (if it is
present) in addition to A, B and C, which are always shown.
Show Min/Max
Range
This option will color a pie section of the phasor background
representing the range from the minimum to the maximum
phase angle, if more than one cycle is selected. The phase
arrow always represents the average. The appearance of this
pie section may vary depending on your settings in the
Appearance Page.
Continued on the next page
183
Dran-View 6 User Guide
Advanced
Settings
Show Delta Phi
This option will show the difference between the phase angles
of the voltage and current channels for each phase in the
phasor footer. Both voltage and current must be selected
under "Parameters" for this information to be displayed. It
will appear on a separate row with a label consisting of the
Greek letters DF (∆φ).
Basic Mode
This option will exchange this page for the Basic Page, and
hide the Appearance Page and the Harmonics Setup Page.
General
Page
(Continued)
184
Dran-View 6 User Guide
14.4.
Phasor Properties Dialog – Appearance Page
Advanced
Settings
This page is only available in advanced
mode.
Appearance
Page
Transparent
Min/Max sectors
This option will only be available if you have selected "Show
Min/Max Range" on the General Page. When this option is
enabled, overlapping ranges will be drawn in a blended color.
When it is disabled, each sector will be drawn with a smaller
radius than the last. Turning this option off will increase
readability if you have many overlapping sectors.
Not transparent
Solid Min/Max
sector borders
Transparent
This option will only be available if you have selected "Show
Min/Max Range" on the General Page. When this option is
enabled, a black line will be drawn around each Min/Max
sector.
With solid borders
Without solid borders
Continued on the next page
185
Dran-View 6 User Guide
Advanced
Settings
Labels in phasor
color
When this option is enabled, each label identifying a phasor
arrow will be drawn in the same color as the arrow itself. This
will also apply to numerical values in the footer.
Appearance
Page
(Continued)
Font
Click this button to open a dialog where you can choose the
font type to use for the text labels, angle labels, and phasor
footer.
Show Grid
This option will enable a grid to ease interpretation of phasor
arrows and ranges.
Grid Color
This option will only be available if you have selected "Show
Grid". Choose if you wish the grid to be drawn in the same
color as the chart main tick grid, or if you wish to specify
another color. The color button will only be available if you
have selected custom color. Click this button to open a dialog
box where you can select a color to use for the grid.
Angle Labels
This option will only be available if you have selected "Show
Grid". When this option is available 0, 90, 180 and 270
degrees will be labeled on the grid.
14.5.
Phasor Properties Dialog – Harmonic Setup Page
See Harmonic Scaling Dialog.
186
Dran-View 6 User Guide
Chapter 15.
15.1.
Pictures
Introduction
Pictures
Enterprise
Edition Only
Description Picture objects are used to display user-defined pictures in Dran-View.
Adding,
Deleting
and Moving
Pictures
To add a picture, select “Insert Picture”
from the Object Toolbar, "Insert "
menu, or the pop- up menu. An Open File dialog box will be shown where you can
select the picture you want to use. You can also cut or copy part of an image from
another application and paste it into the main view.
To delete a picture, select it and press the Delete key on your keyboard.
To move a picture, click on it and drag to the desired location. While dragging, a
tracking rectangle will appear to guide you in moving pictures. By default, large
pictures will be resized. If no picture is loaded, the text "No picture loaded" will be
displayed in place of the picture.
To change the size of a picture, select it and bring the pointing device over one of
the squares at each corner and at the center of each side. The pointer changes to
indicate resizing. Now click and drag the corner or side to the desired size. While
dragging, a tracking rectangle will appear to guide you in resizing pictures.
Settings
All settings for pictures are available in their property dialog box. Double-click or
right-click on the picture and select "Properties" from the pop-up menu to open this
dialog box.
187
Dran-View 6 User Guide
15.2.
Picture Properties Dialog
Picture
Settings
All settings for pictures are available in
their property dialog box. Double-click
or right-click on the picture and select
Enterprise
"Properties" from the pop-up menu to
Edition Only open this dialog box.
Width
Specify your desired picture width in % of the original.
Height
Specify your desired picture height in % of the original.
188
Dran-View 6 User Guide
Chapter 16.
16.1.
Statistics Table
Introduction
Statistics
Tables
Description Statistics tables are used to display peak values or statistics for each channel or
series in its parent chart. If the statistics table parent is not a chart, no data will be
displayed.
Adding,
To add a statistics table, select Insert Statistics Table
from the Object Toolbar,
Deleting
"Insert" menu, or the pop-up menu.
and Moving
Statistics
Grids
To delete a statistics grid, you can also select it and press the Delete key on your
keyboard.
To move a statistics grid, click on it and drag it to the desired location. While
dragging, a tracking rectangle will appear to guide you in moving the grid.
Time Range The statistics grid determines the time-range to use for calculations in the following
order:
1. If its parent chart contains an active Area Marker, the range of the Area
Marker is used.
2. If 1 is not the case, the time range of the parent chart's primary x-axis is
used.
Settings
All settings for statistics tables are available in their property dialog box. Doubleclick or right-click on the statistics table and select "Properties" from the pop-up
menu to access this dialog box.
189
Dran-View 6 User Guide
16.2.
Statistics Table Properties Dialog – General Page
Statistics
Table
Settings
General
Page
The statistics table may present four
different types of tables:
• Peak values
• Statistics
• Energy calculations
• Phase Table
One row per
series
Table type:
Peak Values
When this option is enabled, separate statistics is shown for
each series. If disabled, min, max, average, etc. values are
compounded for the entire channel.
This option allows you to display min and/or max peak values
for each channel during the specified range, together with the
time of those values.
Statistics
This option allows you to display min, average, max, median,
5%, 95% and/or 99% values for each channel during the
specified range. "5%" indicates the maximum magnitude of the
channel's lowest 5% of values.
Energy
calculations
This option lets you choose on and off peak times for each day
of the week, as well as the rates for these two periods. On peak,
Off peak, and To tal cost may also be displayed.
Phase Table
This option is only available when the parent chart is a DFT
Chart. The default setting is to display the same channels as the
DFT chart it is connected to. If you wish to display other
channels, you may select which phases and parameters to
present phase angles for, what series to display (Min, Max,
Average), and what range of frequencies to include.
190
Dran-View 6 User Guide
16.3.
Statistics Table Properties Dialog – Appearance Page
Statistics
Table
Settings
This page allows you to customize the
appearance of the Statistics Table.
Appearance
Page
Grid same color
as chart grid
When this option is enabled, the borders of each cell in the
statistics object are drawn in the same color as the chart grid. If
it is disabled, the color button below this option will be
enabled. Click this button to display a dialog box where you
can choose a color for the grid.
Font...
Click this button to open a dialog box where you can choose the
font type to use in the statistics object.
Transparent cell
backgrounds
When this option is enabled, cell backgrounds are drawn in the
same color as the view background, header cell backgrounds
will be drawn in a blend of the background and the selected
header background, and the cell background button will be
disabled.
Cell background
This button will only be available if "Transparent cell
backgrounds" is disabled. Click this button to show a dialog
box where you can choose the color for the cell background.
Header
background
Click this button to show a dialog box where you can choose
the color for the header background.
Make this the new Enable this checkbox and then click "OK" to store your settings
default setting
as the new default.
191
Dran-View 6 User Guide
Chapter 17.
17.1.
Text Boxes
Introduction
Description Text boxes are used to display text in
Dran-View. The text can be a mix of
Enterprise
your custom text and control codes to
Edition
automate presentation of information.
Only
Text Boxes are commonly used as
Headers and Footers in cha rts.
Adding,
To add a text box, select “Insert Text Box”
from the Object Toolbar, "Insert"
Deleting
menu, or the pop- up menu.
and Moving
Text Labels To delete a text box, select it and press the “Delete” key on your keyboard. You can
also press the "Delete" button in its property dialog box.
To move a text box, click on it and drag it to the desired location. While dragging, a
tracking rectangle will appear to guide you in moving the text box.
Settings
All settings for text labels are available in the property dialog box. Double-click or
right-click on the text box and select "Properties" from the pop- up menu to open
this dialog box.
192
Dran-View 6 User Guide
17.2.
Text Box Properties Dialog – General Page
Text Boxes
General
Page
Simple mode
Advanced mode
This property page is common to “Text Box” and “Data Annotation” items.
The toolbar at the top of this page contains the following options:
This option aligns the text to the left.
This option centers the text.
This option aligns the text to the right.
This command opens a dialog box where you can choose the font type to use
in the label.
This command opens the "Insert Function" dialog box that allows you to
choose between the available control codes. For more information, see
"Control Codes" further down this chapter.
This command deletes the Text Box.
Below this toolbar, there is a textbox where you can specify what text you wish the
label to use. You may freely mix text and control codes.
Store all Texts and Formats as the new default setting
Enable this checkbox and then click "OK" to store your settings as the
new default.
Continued on the next page
193
Dran-View 6 User Guide
Text Boxes Advanced
General
Options
Page
(Continued) Texts
To show these options, check the "Advanced" checkbox at the bottom
of the page. To hide options, uncheck this checkbox.
The list contains Dran-View's standard texts, as well as any standard
text that you created. Whenever a chart is created, two text labels are
created with it. The labels are located above and below the chart. These
are called the Header and Footer respectively. Dran-View's standard
texts are paired with a chart type according to the following table:
Default Name
Timeplot Header
Waveform Header
DFT Header
Magnitude/Duration
Header
Footer (simple)
Footer (advanced)
Footer (DFT)
Footer
(Magnitude/Duration)
Data Annotation
Chart and position
Timeplot Chart header
Event Details/ Waveforms
Chart header
DFT Chart header
Default text (Default Font)
Timeplot (Large Font)
Event Details/Waveforms
(Large Font)
Waveform harmonics
(Large Font)
Magnitude/Duration Chart Magnitude/Duration plot
header
(Large Font)
Timeplot Chart footer
Event $EVTNBR at
$EVTDATE $EVTNAME
(Small Font)
Event Details/Waveforms Event $EVTNBR at
Chart footer
$EVTDATE
$EVTNAME
$EVTDET
(Small Font)
DFT Chart footer
$DFTDETAILSBASIC
(Small Font)
Magnitude/Duration Chart $MAGDURDETAILS
footer
(Small Font)
The default text whenever $CHANNEL $YDATA
a Data Annotation is
$XDATA
created
(Data Annotation)
Modifying any of these standard texts will affect ALL labels using
them.
Continued on the next page
194
Dran-View 6 User Guide
Text Boxes Texts
General
Administrate
Page
button
(Continued)
Press this button to open the "What do you want to do?" dialog box
containing the following four options:
• "Write To..." Selecting this option and clicking "OK" will bring up
a dialog box where you can select an already existing standard
text to overwrite. This will affect all labels containing the selected
standard text. This option will only be available if you have
entered a text that does not exist as standard text.
• "Create New" Selecting this option and clicking "OK" will bring
up a dialog box where you can enter a name for the standard text.
This name will then appear in the standard texts list. This option
will only be available if you have entered a text that does not exist
as a standard text.
• "Rename" Selecting this option and clicking "OK" will bring up a
dialog box where you can enter a new name for the selected
standard text. This name will then appear in the standard texts list.
This option will only be available if you have not modified the
standard text.
• "Delete" Selecting this option and clicking "OK" will remove the
standard text. It will no longer appear in the standard texts list.
This option will only be available if you have not modified the
standard text, and is not available for the standard texts in the
above table.
Continued on the next page
195
Dran-View 6 User Guide
Text Boxes Formats
General
Page
(Continued)
The list contains Dran-View's standard fonts, as well as any standard
fonts that you created. The information on the Appearance Page is
also stored with the font information. The standard fonts have the
following default names, fonts and appearances.
Default name
Large Font
Medium Font
Small Font
Data Annotation
Default value
Black, bold, Arial, 14
Black, Arial, 11
Black, Arial, 8
Black, Arial, 8
Default appearance
Fill disabled, no frame.
Fill disabled, no frame.
Fill disabled, no frame.
Fill enabled: Light yellow
Frame enabled: Rounded, black,
1 Point, Arrow: Bubble
Modifying any of these standard fonts will affect all labels using
them.
Formats
Administrate
button
Press this button to open the "What do you want to do?" dialog box
containing the following four options:
• "Write To..." Selecting this option and clicking "OK" will bring
up a dialog box where you can select an existing standard font
to overwrite. This will affect all labels using the selected
standard font. This option will only be available if you are using
a font that does not exist as a standard font.
• "Create New" Selecting this option and clicking "OK" will bring
up a dialog box where you can enter a name for the standard
font. This name will then appear in the standard fonts list. This
option will only be available if you are using a font that does not
exist as a standard font.
• "Rename" Selecting this option and clicking "OK" will bring up
a dialog box where you can enter a new name for the selected
standard font. This name will then appear in the standard fonts
list. This option will only be available if you have not modified
the standard font.
• "Delete" Selecting this option and clicking "OK" will remove
the standard font. It will no longer appear in the standard fonts
list. This option will only be available if you have not modified
the standard font, and is not available for the standard fonts in
the above table.
Continued on the next page
196
Dran-View 6 User Guide
Control
Codes
Control codes are replaced by data
depending on code or situation. You can
enter a control code manually into the
main text box or you can choose one from
the "Insert Function" dialog box. To
access this dialog box, press the "Insert
Function"
button. There is no limit to
how many control codes you can have in
each label.
Code
"Insert Function"
description
Name of selected
channel
$CHANNEL
Content:
Data Annotation only
Displays the name of the series in which the data annotation is attached to.
$DFTDETAILSBASIC Basic DFT Details
Content:
Availability
Always
Displays the RMS, FND, DC, THD and TID values for channels A, B, and C for
voltage and current. The time range for the calculations is identical to a phasor with
a chart as parent. If the text label has a frame as its parent, the text "No DFT Data
Available" is shown..
Data annotations use the event in the sample to which it is attached to rather than the
active event. Also it does not consider the active area markers when determining the
time range used for calculations.
For more information about harmonics, see the Harmonics Page.
$DFTDETAILSFULL
Content:
Full DFT Details
Always
As $DFTDETAILSBASIC, but also displays the site name and the exact time used for
calculations, as well as the method used to determine the time range ("Event #" or
"Selected Area") above the data table. Channel D, power, and odd, even and triplen
THD values are also included.
For more information about harmonics, see the Harmonics Page.
$EVTNBR
Content:
Event Number
Always
Displays a "#" followed by the event number of the active event.
Data annotations refer to the event the sample it is attached to, rather than the active
event.
$EVTDATE
Content:
Event Date/Time
Always
Displays the trigger date and time of the active event.
Data annotations refer to the event in the sample to which it is attached to rather
than the active event.
Continued on the next page
197
Dran-View 6 User Guide
Control
Code
Codes
(Continued) $EVTNAME
Content:
"Insert Function"
description
Event Name
Availability
Always
Displays the name of the active event.
Data annotations refer to the event in the sample to which it is attached to, rather
than the active event.
$EVTDET
Content:
Event Details
Always
Displays detailed data about the active event, if available. The contents of this data
may vary between event types and instruments.
Data annotations refer to the event in the sample to which it is attached to, rather
than the active event.
$FDIR
Content:
File Path
$FNAME
Content:
File Name
$MSDATE
Content:
Always
The file name of the file containing the first site in the document.
$MAGDURDETAILS
Content:
Always
The complete path to the file containing the first site in the document.
N/A
Magnitude/
Duration charts only
The name of the tolerance curve used, the nominal voltage of each site, and the
number of variations above and below the tolerance curve, if any.
Measurement Start
Date
Always
The start date of the measurement of the site to which the active event belongs.
Data annotations refer to the event in the sample to which it is attached to, rather
than the active event.
$MSTIME
Content:
Measurement Start
Time
Always
The start time of the measurement of the site to which the active event belongs.
Data annotations refer to the event the sample it is attached to, rather than the
active event.
$MEDATE
Content:
Measurement End
Date
Always
The end date of the measurement of the site to which the active event belongs.
Data annotations refer to the event in the sample to which it is attached to, rather
than the active event.
$METIME
Content:
Measurement End
Time
Always
The end date of the measurement of the site to which the active event belongs.
Data annotations refer to the event in the sample to which it is attached to, rather
than the active event.
$PAGE
Content:
Page number
While printing only
The page number wherein the text appears in..
Continued on the next page
198
Dran-View 6 User Guide
Control
Code
Codes
(Continued) $PRNDATE
Content:
$SITE
Content:
"Insert Function"
description
Print Date
Availability
While printing only
The date the text was printed.
Site
Always
The name of the site to which the active event belongs to.
Data annotations refer to the event in the sample to which it is attached to, rather
than the active event.
$XDATA
Content:
$YDATA
Content:
X-value of selected
point
Data Annotation only
The X-value of the sample the data annotation is attached to.
Y-value of selected
point
Data Annotation only
The Y-value of the sample the data annotation is attached to.
Continued on the next page
199
Dran-View 6 User Guide
17.3.
Text Box Properties Dialog – Appearance Page
Appearance This page governs the appearance of the
Page
Text Box (or Data Annotation Bubble).
Fill Enable
Enable this checkbox
if you want the label
to have a solid
background color,
rather than a
transparent
background.
Fill Color
If you selected the "Fill" option, click this button to select the
desired background color. A dialog box will open where you can
select a color.
Arrow Type
This option is only available to data annotations. The combo box
contains a list of arrow types. Select the kind of arrow you want
pointing from the data annotation to the sample it is attached to.
Frame Type
This option allows you to choose the kind of frame to use around
the label. Pick the desired type from the combo box.
This option allows you to choose the color of the frame around
the label, if any. When you click this button, a dialog box will
open where you can select a color.
Frame Color
Frame
Thickness
This option allows you to choose the thickness of the frame
around the label, if any. Select the desired thickness from the
combo box.
200
Dran-View 6 User Guide
Chapter 18.
Working With Multiple Sites
!
All commands and information in this chapter relates to the Enterprise Edition Only
Site
A site is intended as a conceptual geographic location. The ability to have multiple
sites in Dran-View allows you to view two or more sets of data simultaneously in
the same document, and perform comparative analyses between them.
Adding a site rather than appending it to an existing site keeps channels, events, etc.
as separate entities. This gives you the ability to view the same quantity from two
or more different locations, and have these recorded simultaneously in the same
chart or other data representation object in Dran-View. For example, you could
measure with two different instruments on either side of a load to see how that load
affects the power quality on your grid.
18.1.
Adding Sites to Your Document
New Site
To add a site, select Site New
from the File menu or the event list popup menu.
Browse to the file containing the site that you wish to add and click “OK”.
201
Dran-View 6 User Guide
18.2.
Synchronizing Sites
Synchronize Sites
Once you have added sites to your document, you may need to synchronize their
clock times or compensate for clock drift. This is usually not required for Signature
System sites, as they have built- in time synchronization.
To align sites, enable “One X-axis per Site” from the X-axis
popup menu.
When ‘one X-axis per site’ is enabled, each X-axis will have
the name of the site it belongs to written on it:
Pan each site’s x-axis left/right by using the pointer so that
the sites align in time, and select “Apply clock offset ” from
the X-axis popup menu. All timestamps in each site will now
be adjusted. The time indicated in the topmost x-axis is used.
A good way to synchronize times between sites is to find some characteristic event,
preferably containing waveforms, and try to align them first in a timeplot chart and
then in a waveform chart.
The next page shows an example of how this is done.
Continued on the next page
202
Dran-View 6 User Guide
Synchronize Sites
(Continued)
1) This is what our
sites look like before
we synchronize them.
The times seem to line
up when looking at a
large portion of the file.
2) Zooming in a bit
further reveals that the
sites are not perfectly
synchronized.
5) Again enabling ‘One 6) A closer look at a
X-axis per site’, we
half-cycle after this
align the waveforms.
adjustment.
3) After having enabled
‘One X-axis per site’,
we have now moved
the axes so that the
event we are looking at
align in the two sites.
4) After selecting
‘Apply clock offset
adjustment’, we look at
the waveform chart.
The times are still
slightly off.
7) After zooming in
and adjusting a few
times, we arrive at a
point where we are
satisfied and apply the
clock offset adjustment
for the final time.
Continued on the next page
203
Dran-View 6 User Guide
Adjusting
for clock
drift
If you have two or more sites and one or more of their clocks
are too fast or too slow, first align their starting times as
described above. Once you have done this, repeat the
procedure with a point near the end of each file, but use
“Apply clock drift adjustment” from the X-axis popup menu
instead of apply clock offset. This should compensate for each
site’s clock drift. The time indicated in the topmost x-axis is
used.
The following two graphs explain how the timestamps are modified when applying
the “Clock offset adjustment”.
Before adjustment
After adjustment
T1
T1
a
T2
T2
T1=Instrument time, T2=”Real Time”
The blue curve is the reference Site, and the red curve is the secondary Site. ‘a’ indicates the clock
offset synchronization point.
The following two graphs explain how the timestamps are modified when applying
the “Clock drift adjustment”.
Before adjustment
After adjustment
b
T1
T1
T2
T2
Site. ‘b’ indicates the clock drift synchronization point.
!
If both correction methods are to be used, it is preferable to apply the offset
adjustment at the beginning of the measurement and the drift adjustment at the end
of the measurement.
The method to adjust clock drift assumes that the clock drift is linear over time.
204
Dran-View 6 User Guide
18.3.
Items
Display
How Items Display Data From Many Sites
Items work more or less in the same way, whether you have one or more sites in
your document. The few differences are outlined below:
Text boxes:
Control codes will display data for the first file opened, except for
DFT data, which will be displayed for all sites.
Statistics:
Data for all sites will be displayed.
Pictures:
Multiple sites do not affect pictures.
Phasors:
By default, phasors display data from the first site with valid data
in the selected time range. To choose a specific site, select it on the
general page of the phasor’s property dialog box.
Charts:
Channels from different sites will appear under each site’s icon in
the Chart Properties dialog box.
One Event Bar will appear for each site above charts.
Site names will appear in the Legends.
You will now be given the option to stack Y-axes per site.
You may now select ‘One X-axis per site’
A list of sites will appear in the Edit Math Formula dialog box.
This may prove useful in certain situations, like calculating the
difference of a parameter between sites.
205
Dran-View 6 User Guide
18.4.
Multiple Sites in the Event List
Event List
When you have more than one site, you may select ‘Group by Site’ in the “Group
By” menu of the event list. This will create top-level nodes for each site in the
document.
Using the ‘+’ and ‘-’ keys on your keyboard to change events will bring you to the
next or previous event in the same site as the currently selected event. While using
the arrow keys will activate the next event in the list regardless of site.
The name of the site where each event belongs to will appear after each event
number in the event list, if you have chosen to display event numbers.
The ‘Multi-Site Events’ option in the event subset menu will also be available.
Selecting this option will filter out any events which only occurs in one site (but not
remove data belonging to such events). This will give you quick access to
disturbances occurring at more than one of your sites simultaneously. If you wish to
fine-tune this selection, you can select ‘Custom selection…’ and change the options
under the ‘Occurring in’ header. You may also elect to view only local events
(occurring in one site but not any other).
206
Dran-View 6 User Guide
18.5.
Multiple Sites and Tools
File - Report When running the File > Report Writer command, select to create one report per
Writer
site, or select one particular site to create a report for.
View Instrument
Setup
When running the View > Instrument Setup command, one configuration report
will be created for each site present in your document. The reports will be arranged
in the order they were added.
View-Goto
These commands will take you to the first, previous, next, etc. event in the same
site as the currently active event.
ToolsHarmonics
/Timeplot
Calculator
The Harmonics/Timeplot Calculator will run once with the same settings for each
site. You cannot select different settings for each site. If the nominal number of
samples per cycle differs between the sites, you may not get as many harmonics
and/or calculated samples per cycle as you have selected for all sites. The
maximum settings available are for the site with the highest number of samples per
cycle. If it not be possible to create as many harmonics or calculate as many points
per cycle for other sites, as many as possible are calculated.
ToolsHarmonic
Scaling
You cannot select different settings for each site. Scaling or normalizing to another
channel is always done within the same site.
ToolsRescue Kit
You must select what site to affect with the rescue kit.
ToolsHarmonic
Demo Tool
Only the first site in a document is available to the Harmo nic Demo tool.
207
Dran-View 6 User Guide
Chapter 19.
19.1.
Notes and Appendices
Notes on Harmonics
How does Dran-View do harmonic analysis?
19.1.1.
Harmonic Analysis -A Brief Overview
The essential concept of harmonic analysis is that a band limited, periodic, time
domain signal may be equally expressed as a summation of harmonically related
sine and cosine functions. To do this, the harmonic amplitudes and phase angle
offsets of the sine/cosine functions must be chosen properly. We refer to the
process of decomposing the time domain signal (the waveform) into amplitude and
phase components as harmonic analysis. Dran-View transforms the selected (see
Area Marker tool), or if no time range has been selected, the visible part of a
displayed time domain (Waveform) signal into its equivalent amplitude and phase
components by doing a Fourier Transform. This function is invoked by insertion of
a DFT Chart, a Text Label containing either the $DFTDETAILSFULL or
$DFTDETAILSBASIC control codes, or a Phasor. Multiple cycles of the
fundamental may be analyzed to achieve better averaging or interharmonics.
Using an appropriate sine/cosine series summation, the original time domain signal
(the waveform) may be approximately reconstructed from the provided phase and
amplitude information. The full set of required harmonics coupled with infinite
arithmetic accuracy would make it theoretically possible to regenerate the signal
exactly. The number of harmonics required to do an “ideal” reconstruction would
be N divided by two, where N is the number of samples in the highlighted sample
window.
208
Dran-View 6 User Guide
19.1.2.
A word about conventions
To minimize confusion, Dran-View expresses all phase information as an unsigned
positive angle, in degrees modulo 360. The author has found it wise to follow this
convention religiously. Failure to do so will usually result in incorrect (or
confusing) results. In all the equations in this document, all symbolic variables used
on the right side of the equation are inherently, or have been resolved to, positive
unsigned numbers. The only exception would be the variable t (time). Negative t
might buy you the dubious joy of traversing “backwards” (right to left) through a
signal. Except for Harmonic Watts, the outputs of the equations can be resolved to
positive unsigned values. It has been the author’s experience that once the basic
math is understood, the greatest obstruction to getting correct and consistent
answers is the failure to consistently handle phase angles and phase angle
differences.
19.1.3.
Harmonic Series Expansion Equations
Note:
The following equations are for harmonic volts and amps, not Harmonic Watts.
Equations for UN-Normalized Transforms
These series expansions are used for un- normalized harmonic transforms. Unnormalized phase information is ge nerated from Dran-View when you have
“Normalization-None” selected in the Harmonics Page of the chart and phasor
properties dialogs or the harmonic scaling dialog. The equations may be used to
approximately reconstruct a highlighted waveform from the un- normalized
transform data.
f(t) =
for un-normalized cosine transforms
f(t) =
for un-normalized sine transforms
Where:
f(t) is the periodic time domain signal. Usually volts or amps.
n is the harmonic number.
Continued on the next page
209
Dran-View 6 User Guide
An is the peak amplitude of the nth harmonic sine/cosine. In Dran-View you may
read rms amplitudes from the DFT Chart, a Text Label containing either the
$DFTDETAILSFULL or $DFTDETAILSBASIC control codes, or a Phasor. These
values may be converted to peak form by multiplying them by the square root of
two. Because the energy generation potential of a voltage or amperage harmonic
signal is proportional to the Root Mean Square (RMS) of the peak value, DranView displays these values in RMS format for convenience. Using the rms values
you can easily compute the rms energy in any subset of harmonics by taking the
square root of the sum of their rms amplitudes squared. This becomes useful if you
are interested in the energy contribution of a small subset of harmonics rather than
the total harmonic energy which Dran-View provides directly. For example, to find
the rms contribution of the third and fifth, sum their squared values and take the
square root. To convert to percent of the total, divide by the Total RMS value.
ω is the angular frequency. Conventionally this is 2πf1 where f1 is the fundamental
frequency in reciprocal seconds (one over the period, T1 ) and 2π is in radians.
Dran-View expresses all angles in degrees so this value resolves to 360°/T1 where
T1 is the fundamental period in seconds. Note that in special situations the period T1
may be an integral fraction of the time range used for the transform. This rule
applies primarily when more than one fundamental wave is highlighted, and
Min/Max/Avg mode is selected.
t is in seconds.
δ Is the positive modulo 360 degree phase angle offset at t equals zero.
Note that the phase offset, δ n , is subtracted in the cosine expansion and added in the
sine expansion. The cosine expansion is included as an option primarily because it
is the form that many texts on the subject of Fourier Analysis prefer to use. It is not
the preferred form for power calculations. Agreement with math texts is also the
reason that the minus sign was preserved in the cosine expansion above. Negating
the un-normalized cosine expansion δ n before presentation in the Dran-View would
have allowed the sine and cosine expansion forms to be analogous (it would be
much easier to remember that way). Because of the preponderance of cosine
transforms in texts, you are more likely to get agreement using the cosine transform
option if you are using a typical textbook application to do your own transforms on
the same data. In the power industry, the sine transform makes the most sense and
is the preferred form. For example, the phase relationship of a positive sequence
three phase system is usually expressed as 0, 240 and 120 degrees for phases A, B
and C, respectively.
Continued on the next page
210
Dran-View 6 User Guide
Expressed in the cos(ωt-δ) form preferred by mathematicians these phasor angles
would become 90, 210 and 330, respectively. Confusing, to say the least. Most nonmathematicians visualize and speak of sine waves not cosine waves. Phasors in the
power industry almost always come from sine transforms.
NOTE:
In the expansions above (and throughout most of this document) the contribution of
the DC component (harmonic zero) has been ignored. To be technically correct, it
should be included but it is typically discarded because in AC circuits it is usually
close to zero. The DC component is simply the algebraic average of all the data
points in the cycle. If the DC component is significant, then f(t) may be more
accurately computed by including the average voltage or current in the summation.
19.1.4.
Phase angles and Normalization
Normalization, as used by Dranetz-BMI, refers to the process of recomputing the
phase offsets output by the harmonic transform in order to relocate the expression
of the signal to a new origin. Since the phase angles generated by a harmonic
transform are dependent on both the start point of the sample window and the form
of the transform (whether it is sine or cosine, whether the phase angle is added or
subtracted, etc.) it is possible to get a bewildering set of equivalent phase angle data
sets for the same set of waveforms. Normalization attempts to standardize the
expression of a (set of) waveform(s) by always referencing the data to the same
point. The most useful application of this option is in referencing the phase angles
of the harmonic transform to the positive zero crossing of the voltage sample
synchronization channel fundamental. This is particularly helpful when viewing the
fundamental phasors of highly distorted signals in a three phase system. In the
presence of high distortion, typical sampling hardware may not synchronize itself
exactly to the zero crossing of a sync channel fundamental. This could cause the
phase offsets of the fundamentals that are returned from the un-normalized sine
transforms to be, for example, 343, 223 and 103 degrees for channels A, B and C,
respectively. Normalizing this data to the fundamental of channel A will yield a
familiar 0, 240, 120 degree sequence that we easily recognize as a positive
sequence three phase system. This is calculated as follows. Since we wish to
normalize to the sync channel (Channel A) we must “subtract out” the phase offset
of the sync channel from each of the channels as follows:
Continued on the next page
211
Dran-View 6 User Guide
Normalized Phase A = 343 - 343 = 0
Normalized Phase B = 223 - 343 = -120 + 360 = 240
Normalized Phase C = 103 - 343 = -240 + 360 = 120
Note that for phases B and C we add 360 degrees back in because, by convention,
we always resolve angles to positive modulo 360. If we were to use these
normalized angles in the sine expansion equation given above to generate f(t), we
would get approximately the original signals except that their time origins would be
shifted left 343 degrees. Alternatively you could view it as shifting the time axis
forward (to the right) -343+360 = 17 degrees. Imagine it as clipping 343 degrees
from the end of the cycle and pasting it to the front, or clipping 17 degrees from the
front of the cycle and pasting it to the end.
Normalization to the fundamental of a single channel does not change the channel
to channel phase offsets. This is important because the channel to channel phase
offsets are used to compute Harmonic Watts. If you “Normalize to Own
Fundamental” you are essentially “zeroing out ” the fundamental phase angles of all
the channels. This will destroy the true phase to phase relationships between
channels and thus change the hand computed Harmonic Watts from their true
values. This is very important to remember! Because of the potential to corrupt the
Harmonic Watts computations, we recommend that you exercise caution when
using the “Normalize to Own Fundamental” option. In order to insure that the
harmonic watts computations are correct, Dran-View always internally uses the unnormalized voltage and current phase angles to compute watts.
The following equations are used in normalization.
To Compute a Normalized Phase Angle from the UN-Normalized Expression
Below is the general formula that may be used to normalize un- normalized phase
angles which were intended to be used in expressions of the form sin (ωt ±δ) or cos
(ωt ±δ). Remember, δ n is unsigned modulo 360!
δ Normalized = b * (nφ - δ UnNormalized)
For Dran-View the equation above resolves to two forms:
δ Normalized = nφ − δ UnNormalized Used for cosine expansion
δ Normalized = δ UnNormalized - nφ Used for sine expansion
Continued on the next page
212
Dran-View 6 User Guide
Where:
b=1 if you wish the sign of the expression ωt ±δ to be the same for the normalized
expansion as it was in the UN normalized expansion (i.e., if the un normalized
expansion used sin(ωt ±δ) and the normalized expansion used sin (ωt ±δ Normalized),
then b=1). Otherwise, b=(-1). For example, in Dran-View the expansion is changed
from cos(ωt -δ) to cos (ωt +δ Normalized), here b=(-1).
δn is the nth harmonic phase angle. δ n on the right side of the equation is the phase
angle generated from the Un-Normalized Transform. The left side is the phase
angle transformed to its normalized perspective. δ n is expressed as a positive
number modulo 360.
φ is the Un-Normalized fundamental phase angle of the selected channel. If you
selected “Normalize To the Fnd” φ is the un normalized phase angle of the
currently displayed channel. If you select “Normalize to the Fnd of:” then φ is the
unnormalized phase angle of the selected voltage channel.
n is the harmonic number
The expression used to normalize a sine expansion is what one would intuitively
expect to see. We wish to “subtract out” the fundamental phase angle, therefore it is
logical to subtract nφ degrees from each harmonic phase offset. The harmonic
number “n” is required because one degree of shift along the fundamental is equal
to n degrees of shift along the nth harmonic. Note that the normalization equation
for cosine expansions is just the negation of the expression for sine expansions.
This unfortunate bit of confusion is caused by the fact that in the process of
normalizing the cosine expansion, the form of the expansion is changed from cos
(ωt -δ) to cos (ωt +δ). The change of the minus sign to a plus sign requires the
negation of the normalization result. Note that if we are normalizing the channel
from which we get φ the phase of the normalized fundamental will always be zero.
213
Dran-View 6 User Guide
19.1.5.
Equations to recompute waveforms from Normalized Transforms
f( t ) =
normalized cosine transform
f( t ) =
normalize sine transform
The above equations will generate the original signal just like the equations shown
for un-normalized transforms. Note that if you drop the nφ term from either
equation, what remains would be the equation required to redraw the original signal
phase shifted φ modulo 360 degrees (of the fundamental).
19.1.6.
Power Dissipation Watts
Before discussing harmonic watts, terms are defined as fo llows:
The average steady state power dissipation, PAverage , for an integral number of
cycles of a sinusoidal current driven by a sinusoidal voltage is:
PAverage = VRMS * IRMS * cos θ
Where
VRMS = RMS Voltage applied to the current.
IRMS = RMS current in amps.
θ = The phase difference between the volts and the current using volts as the
reference (i.e. if volts are referenced at 0 degrees (its display looks like a sine wave)
and the associated current is at 90 degrees (it looks like a cosine wave) then θ = 0° 90° = -90°+360° = 270°). Using this convention (keeping volts at 0 degrees), we
find that when θ is in the first and fourth quadrant (when θ is 0° to ± 90° degrees
but not equal ± 90° ) PAverage is positive (power goes to the load). The second and
third quadrants (90°< θ <270°) generate negative power (i.e. your “load” is actually
a generator; this usually means your probe is on backwards). When θ is exactly 90°
or 270° no active power is generated (PAverage = 0). In this special case the power is
pure reactive. If θ is 90° then it is pure inductive. At 270° it is pure capacitive.
214
Dran-View 6 User Guide
19.1.7.
Important Notes about θ:
Because cos(θ) is equal to cos (-θ) the computation of watts is correct if you
reference current to volts or volts to current, either way. As we shall see, this
flexibility sets the stage for endless confusion. The reactive power, VAR, is
computed as sin( θ). Since sin (-θ) is equal to –sin(θ) we can see that the
computation of VAR is greatly affected by how you compute the phase difference,
θ, between volts and current. Referencing current to voltage will give a different
reactive power than if you reference volts to current. To further confuse the issue,
the way in which you express the signals also affects your results. For example, the
phase angles from the signals expressed as sin (ωt +δ) must be handled differently
than if you take the phase angles from the same signals expressed as cos (ωt -δPrime )
if you wish to get the same results. Obviously, we need to establish a convention if
we ever wish to get consistent power calculations.
19.1.8.
Statement of Power Convention
When the current signal lags the voltage signal that is driving it, we say that it is
inductive and by convention, we assign the reactive power (VAR) to be positive.
When the current signal leads the voltage signal that is driving it, it is considered
capacitive and by convention, the reactive power is assigned to be negative. This is
the standard used on all Dranetz-BMI products. This power industry standard is
reasonable when you consider that most real world loads are inductive. If you
accept that “normal” should be positive then it is reasonable to assign positive to
inductive (normal) loads. The terms leading and lagging are taken from phasor
notation. The phasors are imagined to be rotating in a counter clockwise direction.
They are conventionally shown starting at some arbitrary phase offset equivalent to
time t equal zero. The phase offset is the phase angle offset gotten when the signals
are expressed in the form sin (ωt +δ). Expressed in this fashion the leading signal is
the signal with the greatest unsigned phase offset unless the difference between the
larger and the smaller δ n is greater than 180 degrees. In this case the signal with the
smaller δ n is the leading signal. Remember, we always express δ n in unsigned
modulo 360 format. Using this carefully constructed convention the phase
difference between volts and current is correct for computing both active power,
watts, and reactive power, VAR, whe n the signals are expressed in sin (ωt +δ)
format and the current phase angle offset is subtracted from the voltage phase
angle.
Continued on the next page
215
Dran-View 6 User Guide
The following example illustrates what happens if you fail to exercise care when
doing power calculations. Given a capacitive load with a voltage signal expressed
as sin (ωt + .2°) and a current signal expressed as sin (ωt + 35°) we can compute
the watts as cos (.2 - 35° + 360°) = cos (325.2°) = .82 watts. The VAR is computed
as sin (325.2°) = -.57 VAR. By our convention, a negative sign on the VAR
indicates that the current leads the voltage and consistent with that convention, we
can say that it is capacitive. The positive sign on the watts indicates that the power
is flowing from the source to the load, as you would expect. If the sign of the watts
value was negative it would imply that the “load” was behaving as a generator. If
you were looking at the fundamental, it would indicate that you probably have your
current probe reversed. Now, if you use the trigonometric identities cos(θ) = cos(θ) and cos (90° - θ) = sin (θ) to express the signals in cos(ωt -δ) format you will get
very different results.
sin (ωt + .2°) = cos (90° -( ωt + .2°)) = cos (ωt - + 89.8°) = cos (ωt - 89.8°) (Volts)
sin (ωt + 35°) = cos (90° -( ωt + 35°)) = cos (-ωt + 55°) = cos (ωt - 55°) (Current)
Now, using the 89.8° and 55° values that would be presented in the un-normalized
cosine expansion phase table and using the same conventions as before to compute
watts and VAR you will get the correct value for watts (cos(89.8° - 55°) = .82
watts) but the value you get for VAR will be the negation of the previous
computation (sin(89.8° - 55°) = .57 VAR). If you had known to use (-89.8°-(-55°))
= -34.8° + 360° = 325.2° as your θ, then both your watts and VAR would have
worked out correctly. Dran-View always presents the phase angle θ in a manner
consistent with computing both watts and VAR correctly regardless of which
expansion form you choose.
216
Dran-View 6 User Guide
19.1.9.
Harmonic Watts
In a non-sinusoidal system it turns out that dissimilar voltage and current harmonics
do not interact to generate useable power. You can readily convince yourself of this
by graphically sketching the power curve resulting from a fundamental voltage
signal and a second harmonic of current. The power curve results from a point by
point multiplication of the two signals. The average power results from dividing the
area under the curve by the total time. You will be able to see that the average
power over one cycle of the fundamental and two cycles of the second harmonic
will average to zero (by symmetry you will see the positive lobes will cancel the
negative lobes). The result of this little mathematical bonus is that only harmonics
of the same order interact to generate power. This means that in the frequency
domain the average active power dissipation over one cycle of the fundamental in a
system rich in harmonics may be computed by summating the individual “harmonic
watts dissipations”.
Mathematically this is :
PAverage = VDC*IDC +
Where
VRMS Is rms voltage at the Jth harmonic
IRMS Is the rms current at the Jth harmonic
θi Is the difference between the phase angles Φ, of the voltage and current at the Jth
harmonic. (θi = Φvoltage i - Φcurrent i ). See previous discussion on how to compute
θ.
PDC Is the power dissipation due to the dc components VDC*IDC. It can usually be
ignored.
Caveats
Harmonic watts may have dubious meaning if “Normalize to Own Fundamental” is
selected. Although Dran-View always gives the correct value, hand calculations
may be erroneous. Generally, the phase angles for the amperage harmonics are not
phase corrected for the lead/lag introduced by the probes. If this value proves to be
a significant proportion of the total phase difference between the volts and amps
signals then a significant error will be introduced. The phase accuracy decreases
significantly as a function of increasing harmonic frequency therefore the greater
the harmonic content the more error you are likely to see in the harmonic watts
calculations. It is possible for the phasors and the fundamental angles to disagree if
cosine expansion is chosen or if the phasors and DFT Chart and Text Label
normalization configuration disagree ("Always use Sine Expansion" is selected for
the Phasors).
217
Dran-View 6 User Guide
19.2.
Weighted Statistics
The samples inside the current time limits are sorted in ascending sample
magnitude order along with their associated durations. A given sample is assumed
to be the best estimate of line conditions until a new sample comes along to replace
it. Therefore its duration (or weighting) is given as the time difference between the
sample and the next sample. Starting at the lowest sample magnitude the associated
sample durations are summed. When the duration sum equals or exceeds the
desired percentage of the total duration of all samples, the magnitude is extracted
and shown. These are the values used for the median and percentage value
estimates.
We can think of the result as:
For N% of the time the values are less than or equal to the N% value. For the rest of
the time it is greater.
The weighted standard deviation is carried out using the following formulas. D
denotes durations and X denotes sample magnitudes:
Duration of all samples = Dtotal =
Where Dn is equal to the time duration associated with each individual sample.
Weighted (by duration) Average of Samples =
weighted =
Using the weighted average as our model the formula for the weighted standard
deviation is as follows:
Weighted (by duration) Standard Deviation (biased) =
218
Dran-View 6 User Guide