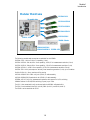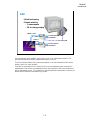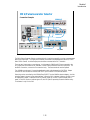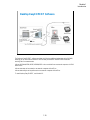
1
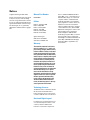
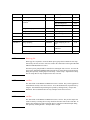
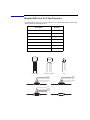
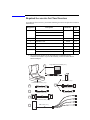
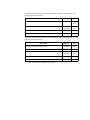
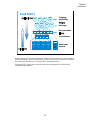
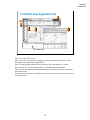
Agilent B1500A
Semiconductor Device
Analyzer
Self-paced Training Manual
Agilent Technologies
Notices
© Agilent Technologies 2005 - 2008
Manual Part Number
No part of this manual may be reproduced
in any form or by any means (including
electronic storage and retrieval or translation into a foreign language) without prior
agreement and written consent from Agilent Technologies, Inc. as governed by
United States and international copyright
laws.
B1500-90040
Edition
Edition 1, September 2005
Edition 2, May 2006
Edition 3, January 2007
Edition 4, June 2007
Edition 5, February 2008
Edition 6, October 2008
Agilent Technologies
5301 Stevens Creek Blvd
Santa Clara, CA 95051 USA
Warranty
The material contained in this document is provided “as is,” and is subject to being changed, without notice,
in future editions. Further, to the maximum extent permitted by applicable
law, Agilent disclaims all warranties,
either express or implied, with regard
to this manual and any information
contained herein, including but not
limited to the implied warranties of
merchantability and fitness for a particular purpose. Agilent shall not be
liable for errors or for incidental or
consequential damages in connection
with the furnishing, use, or performance of this document or of any
information contained herein. Should
Agilent and the user have a separate
written agreement with warranty
terms covering the material in this
document that conflict with these
terms, the warranty terms in the separate agreement shall control.
Technology Licenses
The hardware and/or software described in
this document are furnished under a
license and may be used or copied only in
accordance with the terms of such license.
Restricted Rights Legend
If software is for use in the performance of
a U.S. Government prime contract or subcontract, Software is delivered and
licensed as “Commercial computer soft-
ware” as defined in DFAR 252.227-7014
(June 1995), or as a “commercial item” as
defined in FAR 2.101(a) or as “Restricted
computer software” as defined in FAR
52.227-19 (June 1987) or any equivalent
agency regulation or contract clause. Use,
duplication or disclosure of Software is
subject to Agilent Technologies’ standard
commercial license terms, and non-DOD
Departments and Agencies of the U.S. Government will receive no greater than
Restricted Rights as defined in FAR
52.227-19(c)(1-2) (June 1987). U.S. Government users will receive no greater than
Limited Rights as defined in FAR 52.227-14
(June 1987) or DFAR 252.227-7015 (b)(2)
(November 1995), as applicable in any
technical data.
In This Manual
This document is the self-paced training manual to help you to understand what is Agilent
B1500A, what functions the B1500A has, how to use the B1500A, and what applications
the B1500A contributes to.
CAUTION
The test setup data described in this manual are only examples. If these example data
damage your devices, Agilent is NOT LIABLE for the damage.
•
Module 1. Introduction
This module explains the product concept and the key features of the B1500A/
EasyEXPERT. You will learn about what is the B1500A.
•
Module 2. Getting Started
This module explains the basic operations of the B1500A. You will learn about how to
launch B1500A/EasyEXPERT and how to perform application test and quick test.
•
Module 3. Data Display and Management
This module explains the data display and analysis capabilities of the EasyEXPERT
software. You will learn how to use analysis tools, how to change display setup, and
how to print/export test result data.
•
Module 4. Classic Test Environment
This module explains the classic test mode of the EasyEXPERT. You will learn how to
create the classic test setup in the course exercises.
•
Module 5. Basic Measurement
This module explains the basic I-V sweep measurement function and the cabling and
fixturing issues. You will learn how to measure I-V curves in the course exercises.
•
Module 6. Low Current Measurement
This module explains the low current measurement technique. You will learn how to
measure the low current in the course exercises.
•
Module 7. Measurement Functions
This module explains the measurement functions available with the B1500A. You will
learn how to use various measurement functions in the course exercises.
•
Module 8. Capacitance Measurement
This module explains the capacitance measurement function. You will learn how to
measure the capacitance in a course exercise.
•
Module 9. Modifying Application Test Definitions
This module explains a modification example of an application test definition. You will
learn how to modify the definition in a course exercise.
•
Module 10. Creating Your Test Definitions
This module explains about the application test definition. You will learn how to create
your application test definition in a course exercise.
•
Module 11. Advanced Definitions and Operations
This module explains how to control external GPIB devices, how to call an execution
file, how to perform a repeat measurement, and how to use the prober control script.
•
Module 12. Miscellaneous Operations
This module explains what is the status indicator, what is the automatic data export
function and the automatic data record function, how to perform selftest and
calibration, how to perform SMU zero offset cancel, and such.
•
Module 13. SPGU Control and Applications
This module explains the SPGU Control classic test. You will learn how to create the
classic test setup and the applications using SPGU in the course exercises.
EasyEXPERT is a trademark of Agilent Technologies. All other trademarks are the
property of their respective owners.
Class Exercises
Class exercises use the test setup listed below. The test setup data are only examples and
included in the Demo.xpg file stored in the Manual CD-ROM.
Module
Exercise
Device
Test setup/definition/data
Page
Module 1
no exercise
Module 2
Id-Vd measurement
MOSFET
CMOS: Id-Vd
2-19, 27
Id-Vg, gm-Vg measurement
MOSFET
CMOS: Vth gmMax
2-19, 27
B2200/E5250 switch control
-
Id-Vg, gm-Vg measurement
MOSFET
Module 3
Using Preview window
Module 4
3-28
-
3-31
Trng Id-Vd
4-25
Multi Channel I/V Sweep
Measurement
Bipolar Tr
LED
Trng Multi
4-37
I/V List Sweep Measurement
MOSFET
Trng List
4-51
I/V-t sampling measurement
0.1 μF
Trng Sampling
4-64
Trng CV
4-76
Trng Switch
4-81
Trng C-f
4-88
Direct Control (C-f measurement)
MOSFET
0.1 μF
Id-Vd measurement
MOSFET
IDVD, Id-Vd
5-7
SMU series connection
511 kohm
IRVR
5-24
Parallel
5-28
REKELV
5-38
SMU parallel connection
Re measurement, kelvin connection
Module 7
GMMAX.xtr
MOSFET
B2200/E5250 switch control
Module 6
2-32
Id-Vd measurement
C-V sweep measurement
Module 5
-
-
1 ohm
Bipolar Tr
Leak current measurement
-
Zero-check
6-9
Ultra low current measurement
-
Zero-check-ASU
6-19
Id-Vg measurement
MOSFET
IDVG
6-20
Gummel plot
Bipolar Tr
GUMMEL
6-25
SMU pulse mode
MOSFET
IDVD-Pulse
7-8
RC measurement
0.1 μF and
511 kohm
RC-sampling-log
7-16
Negative hold time
511 kohm
R-sampl-neg-hold
7-22
Auto analysis
MOSFET
GMMAX
7-28
Bias hold function
LED
LED
7-35
SMU series resistor
511 kohm
IV-res
7-43
Module
Exercise
Device
Test setup/definition/data
Page
Module 8
C-V sweep measurement
MOSFET
CV-1MHz
8-6
Module 9
Modifying application test
definition
MOSFET
Trng IdVd Vth.xtd
9-14
Trng idvd idvg2.xtd
9-29
Trng idvd idvg3.xtd
9-32
Using auto analysys twice
MOSFET
Vth gmMax and Id
9-34
Using vector data
MOSFET
Trng Cgg-Vg
9-42
Module 10
Creating application test definition
MOSFET
Trng idvd idvg.xtd
10-17
Module 11
no exercise
Module 12
no exercise
Module 13
Charge pumping
MOSFET
Charge Pumping 4T 0.1V
step
13-20
Flash memory
MOSFET
Demo-S-NorFlash
Endurance
13-29
ALWG output
511 kohm
ALWG monitor
13-36
NOTE
Demo.xpg file
Demo.xpg file is required to create the Demo preset group which contains the test setup
data used by the class exercises. And it is stored in the \data folder on the Agilent B1500A
Manual CD-ROM, Edition 4 or later.
The Demo preset group should be created before starting the class exercise. To create the
preset group, launch EasyEXPERT and import the file by using the Preset Group Import
dialog box opened by clicking My Favorite Setup > Preset Group > Import Preset Group.
The test setup data are only examples for the class exercises.
NOTE
.xtd files
The \data folder on the Manual CD-ROM stores some .xtd files. They are the application
test definitions used by some class exercises. To use the definition file, import the file by
using the Test Definition Import dialog box opened by clicking Library > Import Test
Definition. The test definition data are only examples for the class exercises.
NOTE
.xtr files
The \data folder on the Manual CD-ROM stores some .xtr files. They are the sample test
results created by executing the test setup which has the same name as the result data. To
display these sample test results, import the files by using the Test Result Import dialog
box opened by clicking Results > Transport Data > Import.
Test Setup for Class Exercises
The Demo preset group contains the following test setup. The setup data are only examples
for the class exercises. The following table lists the test setup name in alphabetical order.
Test Setup Name
Description
ALWG monitor
511 kohm sampling measurement with SPGU ALWG output
Charge Pumping 4T
0.1V step
MOSFET Icp-Vbase measurement
CV-1MHz
MOSFET Cgs-Vg measurement
Demo-S-NorFlash
Endurance
MOSFET Endurance test
Fowler-Nordheim
Fowler-Nordheim (FN) plot
GMMAX
MOSFET sqrt_Id-Vg, PEAK-Vg measurement
GUMMEL
Bipolar transistor gummel plot
IDVD
MOSFET Id-Vd measurement
IDVD-Pulse
MOSFET pulsed Id-Vd measurement
Id-Vd
MOSFET Id-Vd measurement, Application Test
IDVG
MOSFET Id-Vg measurement
IRVR
511 kohm I-V measurement
IV-res
511 kohm I-V measurement with SMU series resistor
LED
LED I-V measurement
Parallel
1 ohm I-V measurement, voltage force and current measurement
PG monitor
511 kohm sampling measurement with SPGU VPULSE output
RC-sampling-log
RC sampling measurement, log sampling
REKELV
Bipolar transistor Re measurement
R-sampl-neg-hold
511 kohm sampling measurement with negative hold time
Subthreshold
MOSFET subthreshold measurement
Trng C-f
Direct Control (C-f measurement)
Trng Cgg-Vg
Cgg-Vg modification example for multi-frequency
Trng CV
MOSFET C-V measurement
Trng Id-Vd
MOSFET Id-Vd measurement
Test Setup Name
Description
Trng List
MOSFET Vth-gmmax measurement using I/V List Sweep
Trng Multi
Multi Channel I/V Sweep (Bipolar transistor and LED)
Trng Sampling
0.1 μF sampling measurement
Trng Switch
B2200/E5250 switch setup, Input 1-3-5-7 to Output 1-3-5-7
Vth gmMax and Id
Vth gmMax modification example to use auto analysis twice
Zero-check
SMU open measurement
Zero-check-ASU
SMU open measurement with ASU
Required Devices for Class Exercises
To perform the class exercises, you need the device set (Agilent part number 04156-87001)
which contains the following devices.
Description
Quantity
N-channel MOSFET
2 ea.
NPN Bipolar Transistor
1 ea.
Red Miniature LED
1 ea.
0.1 μF Capacitor 50 V
1 ea.
1.0 Ω Resistor 1/8 W
1 ea.
1.1 kΩ Resistor 1/8 W
1 ea.
511 kΩ Resistor 1/8 W
1 ea.
N-ch MOSFET
NPN bipolar Transistor
LED
Brown
Black
Black
Silver
1 ohm Resistor
Brown
Brown
Black
Brown
1.1 kohm Resistor
Green
Brown
Brown
Orange
511 kohm Resistor
0.1 uF Capacitor
Required Accessories for Class Exercises
To perform the class exercises, you need the following accessories. Prepare the accessories
shown below.
Designation
1
Description
Test Fixture
Model No.
Qty.
16442A/B a
1 ea.
28 pin socket module
1 ea.
Connection wire
6 ea.
2
Triaxial Cable
16494A
4 ea.
3
Interlock Cable
16493J
1 ea.
4
Kelvin Triaxial Cable, for Module 5
16493K
1 ea.
5
CMU Cable, for Module 8
N1300A
1 ea.
6
Atto Sense/Switch Unit, for Module 6
E5288A
1 ea.
ASU control cable, triax cable, for Module 6
16493M
1 ea.
a. The 16058A Test Fixture for the 4145A/B may be substituted for the
16442A/B Test Fixture. If you use the 16058A, you also need the 16435A
Interlock Adapter.
28 pin DIP Socket Module (1ea.)
1
Connection Wire (6ea.)
E5288A ASU (1ea.)
16442A/B Test Fixture (1ea.)
6
2
Triaxial Cable (4ea.)
Control Cable (1ea.)
3
INTLK Cable (1ea.)
4
Kelvin Triaxial Cable (1ea.)
5
CMU Cable (1ea.)
Triaxial Cable (1ea.)
To perform the flash memory class exercise in Module 13 and if you use the ASU, you
need the following accessories.
Description
Model No.
Qty.
E5288A
Total
3sets
16494A or
equivalent
Total
7ea.
BNC-SMA Cable
16493P
3 ea.
SMA-SMA Cable, for synchronization of SPGU
16493Q
2 ea.
ASU (Atto Sense/Switch Unit) with control cable
Triaxial Cable
To perform the flash memory class exercise in Module 13 and if you use the selector, you
need the following accessories.
Description
Model No.
Qty.
SMU/PG selector with control cable a
16440A
2 sets
Selector adapter with control cable
16445A
1 set
16494A or
equivalent
Total
7ea.
BNC-SMA Cable
16493P
3 ea.
SMA-SMA Cable, for synchronization of SPGU
16493Q
2 ea.
Triaxial Cable
a. One selector can be replaced with one ASU.
Contents
Module 1. Introduction
•
New Features
•
EasyEXPERT
•
To Perform Easy Application Test
•
User Interface
•
Modular Mainframe
•
SCUU/GSWU
•
ASU
•
SMU/Pulse Generator Selector
•
B2200/E5250 Switch Control
•
Desktop EasyEXPERT
Module 2. Getting Started
•
To Turn on/off B1500A
•
To Launch EasyEXPERT
•
To Specify/Create Workspace
•
To Perform Application Test
•
To Save/Recall Your Test Setup
•
To Export/Import Your Preset Group
•
To Export/Import Test Record
•
To Perform Quick Test
•
To Control Switching Matrix
•
To Manage Data Display Window
Contents-1
Contents
Module 3. Data Display and Management
•
Data Display window
•
Graph Analysis Tools
•
Data Status
•
To Change Graph/List/Display Setup
•
To See Print Preview
•
To Print Display Data
•
To Copy Graph Plot/List Data
•
To Save Analysis Result
•
To Use Preview Window
Module 4. Classic Test Environment
•
Classic Test Execution Mode
•
I/V Sweep Measurement
•
Multi Channel I/V Sweep Measurement
•
I/V List Sweep Measurement
•
I/V-t Sampling Measurement
•
C-V Sweep Measurement
•
Switching Matrix Control
•
Direct Control
Contents-2
Contents
Module 5. Basic Measurement
•
SMU Fundamentals
•
Classic Test Environment
•
SMUs Connected in Series or Parallel
•
Cabling and Fixture Issues
•
Kelvin and Driven Guard
•
Probes and Prober Connections
•
Triax and Coax Adapters
•
Safety Interlock Issues
Module 6. Low Current Measurement
•
Low-Current Measurement Challenges
•
Calibration and Zero Cancel
•
Effect of Cable Movement
•
ASU for Ultra Low-Current Measurement
•
Low-Current Subthreshold
•
Trade-Off Speed Vs Accuracy
•
Low-Current Gummel Plot
•
Low-Current Gate Oxide Leakage
Contents-3
Contents
Module 7. Measurement Functions
•
SMU Pulsed Sweep Measurement
•
I/V-t Sampling Measurement
•
Negative Hold Time for High Speed Sampling
•
Auto Analysis
•
SMU Filter
•
SMU Series Resistor
•
Standby Function
•
Bias Hold Function
Module 8. Capacitance Measurement
•
CMU Fundamentals
•
Classic Test Environment
•
CMU Calibration
•
SCUU for IV/CV Switching
•
GSWU for Accurate Capacitance Measurement
•
ASU for IV/CV Switching
Contents-4
Contents
Module 9. Modifying Application Test Definitions
•
To Open Application Test Definition
•
To Modify Test Definition
•
To Use Debug Tools
•
To Use Built-in Functions
•
To Add Data Display
•
To Use Auto Analysis
•
To Use Test Setup Internal Variables
•
To Use Auto Analysis twice (as Class Exercise)
•
To Use Vector Data (as Class Exercise)
Module 10. Creating Your Test Definitions
•
What is Test Definition
•
What is Test Contents
•
To Open Test Definition Editor
•
To Define Test Specification
•
To Define Test Contents
•
Available Elements
•
Available Variables
•
To Define Test Output
Contents-5
Contents
Module 11. Advanced Definitions and Operations
•
To Control External GPIB Devices
•
To Call Execution Files
•
To Perform Repeat Measurements
•
Prober Control Script
Module 12. Miscellaneous Operations
•
Function Status Indicator
•
Run Option
•
Automatic Data Export and Data Record
•
Calibration
•
Configuration
•
XSLT Samples
•
To Enable System Controller
•
To Start Desktop EasyEXPERT
•
To Use 415x Setup File Converter
Contents-6
Contents
Module 13. SPGU Control and Applications
•
High Voltage SPGU
•
SPGU Control
•
Pulse Generator Mode
•
Charge Pumping
•
Flash Memory Test
•
ALWG Mode
Contents-7
Contents
Contents-8
1
Introduction
Module 1
Introduction
In This Module
•
Key Features
•
EasyEXPERT
•
To Perform Easy Application Test
•
User Interface
•
Modular Mainframe
•
SCUU/GSWU
•
ASU
•
SMU/Pulse Generator Selector
•
B2200/E5250 Switch Control
•
Desktop EasyEXPERT
Note:
1-2
Module 1
Introduction
Agilent B1500A Semiconductor Device Analyzer
Revolutionary
EasyEXPERT
environment
10 Slots variable
module
configuration
SCUU/GSWU
for IV/CV
combination
ASU for
100 aA
Comprehensive
application
library
B2200/E5250
switch control
415x setup file
converter
Semi-auto prober
control
+/-40 Vpp pulse
generator module
The B1500A has many exciting new features and capabilities.
1-3
Touch-screen
w/optional USB
keyboard &
mouse
Module 1
Introduction
Key Features
• EasyEXPERT software
• Application test environment (> 200 algorithms)
• Classic test environment – 415x like setup
• Quick test environment – multiple test execution
• Semi-auto prober control and B2200/E5250 switch control
• Modular mainframe
• HPSMU, HRSMU, MPSMU for I/V sweep, multi channel I/V sweep,
I/V list sweep, I/V-t sampling
• MFCMU for C-V sweep, C-f sweep
• SPGU for +/-40 Vpp pulse output or arbitrary linear waveform output
• SMU CMU Unify Unit (SCUU)/Guard Switch Unit (GSWU)
• switching effortlessly between IV and CV measurement
• Atto Sense/Switch Unit (ASU)
• 100 aA level low current measurement
• Touch-screen, knob, and softkeys
• optional USB keyboard, mouse, and stylus pen
EasyEXPERT software
•Task-oriented, “top-down” approach to device characterization
•Multiple test execution
•Automatic measurement, auto-analysis functions
•Test sequencing without programming
Application Library (>200 algorithms)
•Categorized and organized
•Easy-to-use
Versatile Modular Mainframe
•Flexible & expandable (10 slots)
•Multiple SMU types
•Atto-sense and Switch Unit (ASU)
•Multi frequency CMU
•SMU CMU Unify Unit for IV/CV probing
•High voltage SPGU, 2-channel Pulse Generator or Arbitrary Linear Waveform Generator (ALWG)
•SMU/Pulse Generator Selector
•4.2 Amp Ground Unit
Convenient User Interface
•Touch screen operation (with optional stylus pen)
•Contextual softkeys & knob control
•Optional USB keyboard & mouse
Desktop EasyEXPERT software
•Controlling B1500A, 4155B/C, or 4156B/C by an external computer
•Offline test development and data analysis
415x Setup File Converter
•Creating the EasyEXPERT test setup file by using the 4155/4156 MES/DAT file
1-4
Module 1
Introduction
EasyEXPERT
GaAs
CMOS
Bipolar
Tr
MOS
FET
Vth Idon Idoff
Vg
Ig
Vd
Id
Technology
classifications
Nanotech
WLR
Res.
Cap.
Device type
Device parameters
gm Igleak Rg
Vs
Is
Vsub
Isub
V/I on terminals
SMU1
SMU2
SMU3
SMU4
CMU
Mode
Mode
Mode
Mode
Mode
V
V
V
V
AC V
I
I
I
I
range
Measurement
resources
Instead of setting up the instrument hardware, the EasyEXPERT software focuses on the real task at
hand for the engineer ---device characterization. All that you need to do is to connect the instrument
to the device terminals as shown in the EasyEXPERT test parameters area.
The EasyEXPERT software also provides the classic test mode that allows the 4155/4156 like
measurement setup operation.
1-5
Module 1
Introduction
To Perform Easy Application Test
List of test record
Step 1: Click Application Test tab.
Step 2: Select one or more technology categories, and select a desired test from the list of tests
associated with the selected technology categories.
Step 3: Change the setup parameters (Device parameters and Test parameters) if you want.
Step 4: Connect DUT, and click the Start button. The B1500A starts the selected test.
Step 5: Analyze the measurement result data displayed on the Data Display window automatically
opened after the test.
The measurement result record is automatically stored in the internal hard disk drive when the Auto
Recode mode is ON.
1-6
Module 1
Introduction
User Interface
• Touch panel
• Stylus pen (option)
• Rotary knob
• Softkeys
• USB keyboard (option)
• USB mouse (option)
1-7
Module 1
Introduction
Modular Mainframe
B1520A CMU
10 module slots
B1511A MPSMU
B1517A HRSMU
B1510A HPSMU
B1525A SPGU
GNDU: 4.2 A
16440A Selector
N1301A-100 SCUU
N1301A-200 GSWU E5288A ASU
The following modules and accessories are available for the B1500A:
•B1520A CMU: 1 kHz to 5 MHz CV capability (1 slot)
•B1511A MPSMU: 100 mA/100 V force capability, 10 fA/0.5 uV measurement resolution (1 slot)
•B1517A HRSMU: 100 mA/100 V force capability, 1 fA/0.5 uV measurement resolution (1 slot)
•B1510A HPSMU: 1 A/200 V force capability, 10 fA/2 uV measurement resolution (2 slots)
•B1525A SPGU: 40 V pulse output or arbitrary linear waveform generation (1 slot), up to 5 modules
•Built-in GNDU: 0 V force, maximum 4.2 A sensing
•N1301A-100/102: SMU CMU unify unit (SCUU) & cable assembly
•N1301A-200/201/202: Guard switch unit (GSWU) & cable assembly
•E5288A ASU: 0.1 fA/0.5 uV measurement resolution with support for IV/CV switching
•16440A Selector for SMU/SPGU switching (2 ports), up to 2 sets
The ASU (Atto sense/switch unit) can be used with the HRSMU calibrated with it.
The SCUU can be used with the CMU (slot N), SMU (slot N-1), and SMU (slot N-2).
The GSWU can be used with the SCUU.
1-8
Module 1
Introduction
SCUU
SMU CMU Unify Unit
(SCUU)
CMU
Force1 or CMUH
SMU
Sense1
SMU
SCUU cable
Sense2
Force2 or CMUL
GSWU
Simple direct connection
between SMU/CMU and
manipulators (positioners)
You have a very hard time switching between CV and IV measurements (you may actually devote
separate probe stations to CV and IV just to avoid having to change cables). In addition, great care
has to be taken when cabling to a capacitance meter to insure that all of the capacitance
measurements are properly compensated. The SCUU removes all of these worries and makes
connection simple and easy. In addition, the B1500A software automatically takes care of the
multiplexing based upon the type of algorithm selected from the front panel.
To install the SCUU near the manipulators/positioners, use the N1301A-102 SCUU cable.
To realize accurate capacitance measurement, use the N1301A-200/201/202 GSWU & cable.
1-9
Module 1
Introduction
GSWU
SCUU
GSWU
The GSWU must be connected to the outer conductors of the manipulators/positioners connected to
the Force1/CMUH and Force2/CMUL connectors of the SCUU. And the GSWU control cable must
be connected between the GSWU and the SCUU.
When the SMU paths are available for the manipulators/positioners, the GSWU opens between the
outer conductors. However, when the MFCMU paths are available, the GSWU shorts them together
to make the return path of measurement current. This will reduce the signal path impedance. And this
is effective for the accurate capacitance measurement.
By using the EasyEXPERT software, cable length between the CMU and the SCUU is automatically
detected, and the GSWU switch control is automatically performed. Also, capacitance error
compensation is also automatically performed if the compensation data are available.
The GSWU is effective for
•reducing the residual inductance of the measurement cable
•stabilizing the residual inductance when measurement cable distance is changed (moved)
It’s roughly 1/10 to 1/30 when used with two 80 cm cable.
Note:
When the SMU paths are available for the manipulators/positioners, the connection between the
outer conductors must be broken because they are connected to the SMU guard terminals separately
and the guard terminals must be opened at the end of the extension.
1-10
Module 1
Introduction
ASU
• 100 aA level sensing
• Channel switching
• C measurements
• PG for charge pumping
CMUH or Force
Sense
To CMU Hpot/Hcur
ASU 1
To HRSMU 1
CMUL or
Force
CMU return path
To CMU Lpot/Lcur
Sense ASU 2
To HRSMU 2
The high-resolution SMU (HRSMU) has an innate 1 fA & 0.5 uV measurement resolution. The
optional ASU extends the HRSMU measurement resolution to 0.1 fA.
The ASU has another feature, built-in switching capability. It can switch between the SMU and an
auxiliary input (AUX input, two BNC).
If the CMU is connected to the AUX inputs, the ASU can switch between the low current and CV
measurements. Then connect a wire between the CMU return terminals of ASUs to make the return
path of measurement current. This is effective for accurate capacitance measurement. However, you
need to perform capacitance compensation by yourself.
1-11
Module 1
Introduction
SMU/Pulse Generator Selector
Connection Example:
16440A #2
SMU7
SMU6
16440A #1
SPGU
Digital I/O
16445A Selector Adapter
Status indicator on Selector front panel
AC power
The SMU/Pulse Generator Selector provides the built-in switching capability to select a measurement
path to the Output port. The Input ports should be connected to the measurement resources, a SMU
and a SPGU channel. And the Output port should be connected to the DUT interface.
There are two Output ports on one selector. In this example, SMU6 and PG1 are connected to the
CH1 Input ports of the selector #1, and SMU7 and PG2 are connected to the CH2 Input ports. For
the SMU connection, connect the Force terminal only. The Sense terminal must be opened.
Two 16440As can be used. Connect the dedicated control cable between the CONTROL Output
connector of the first selector and the CONTROL Input connector of the second selector.
Switching can be controlled by the B1500A/EasyEXPERT via the 16445A selector adapter. And the
switching status is known by the status indicator. When the SMU indicator lights up, the SMU Input
to Output path is made. And when the PGU indicator lights up, the PGU Input to Output path is
made. If the PGU Semicon indicator goes off, the PGU path is opened by the semiconductor relay.
This feature is only for the CH1.
1-12
Module 1
Introduction
B2200/E5250 Switch Control
• Allows use of a probe card to facilitate probing of standardized device
modules (usually 24-pin configuration)
• Enables easy multiplexing between the triaxial outputs of SMUs and
the coaxial outputs of other (BNC-based) instruments and modules
Agilent B1500A
Agilent B2200A/B2201A
Triaxial
(SMU)
Triaxial
8
12 - 48
6
Wafer Prober
Coaxial
(CMU, other)
GPIB cable
GPIB cable
Agilent B2200A/B2201A/E5250A switching matrix can be controlled by B1500A/EasyEXPERT via
GPIB. EasyEXPERT provides the Switching Matrix Operation Panel for interactive control of
B2200/E5250 independent from the test execution mode of B1500. And switch setup can be saved to
a classic test setup data. In the classic test, the switch setup is sent to B2200/E5250 when a
measurement start button is clicked.
B1500A/EasyEXPERT also provides the semi-auto prober control script. The semi-auto prober can
be controlled without programming. The prober control script supports the die move operation by
using the following first three procedures in the repeat measurement setup and adds the subsite move
operation by using the Subsite procedure in the quick test setup.
Prober control script:
•Start procedure
•Iteration procedure
•Final procedure
•Subsite procedure
Note: EasyEXPERT supports the E5250A installed with the E5252A matrix card.
Note: Standard edition of EasyEXPERT cannot support the E5250. The E5250 control is optional and
supported by the Plus edition (B1540A-002/B1541A-002).
1-13
Module 1
Introduction
Desktop EasyEXPERT Software
The Desktop EasyEXPERT software provides the following additional advantages to the B1500A,
allowing you to minimize the amount of offline tasks performed on B1500A and increase the
working ratio for measurements.
•Allows B1500A/4155B/4155C/4156B/4156C to be controlled from an external computer via GPIB
while online.
•Allows test setup to be created on an external computer while offline.
•Allows data analysis to be performed on an external computer while offline.
To start Desktop EasyEXPERT, see Module 12.
1-14
2
Getting Started
Module 2
Getting Started
In This Module
•
To Turn on/off B1500A
•
To Launch EasyEXPERT
•
To Specify/Create Workspace
•
To Perform Application Test
•
To Save/Recall Your Test Setup
•
To Export/Import Your Preset Group
•
To Export/Import Test Record
•
To Perform Quick Test
•
To Control Switching Matrix
•
To Manage Data Display Window
This section explains the above tasks. You will understand how to launch B1500A/EasyEXPERT,
how to perform application test and quick test, and how to create your test setups and preset groups.
2-2
Module 2
Getting Started
To Turn on/off B1500A
The Standby button works to turn on the B1500A when it is turned off. When the B1500A is turned
on, the Standby button works to terminate the EasyEXPERT software, Windows, and turn off the
B1500A.
After the B1500A is turned on, log on Windows.
The default user is Agilent B1500 User with no password.
2-3
Module 2
Getting Started
To Launch EasyEXPERT
Start EasyEXPERT icon
Start EasyEXPERT button/window
After logging on, click Start EasyEXPERT button to launch the EasyEXPERT software.
If you do not see the Start EasyEXPERT button, double click the Start EasyEXPERT icon to open
the Start EasyEXPERT window.
This window has the File menu and the Option menu. The File menu is used to close this window.
The Option menu provides the following functions.
Backup EasyEXPERT Database: Used to make backup of the EasyEXPERT database.
Restore EasyEXPERT Database: Used to restore the EasyEXPERT database.
Note:
Desktop EasyEXPERT provides the following additional functions in the Option menu.
Execution Mode: Used to change the software execution mode.
Move EasyEXPERT Database: Used to move the EasyEXPERT database.
2-4
Module 2
Getting Started
To Specify Workspace
Case 1
Case 2
Case 3
After launching the EasyEXPERT, you will see one of the above screens.
Case 1: If this is the first time to launch the EasyEXPERT
The LCD displays the EasyEXPERT main screen.
Case 2: If the B1500A has one workspace only
Select Yes, and click OK if you use the existing workspace.
The EasyEXPERT main screen is displayed.
Select No, and click Next if you want to create a new workspace.
See next slide.
Case 3: If the B1500A has some workspaces (more than one)
Select workspace you want to use, and click Continue.
The EasyEXPERT main screen is displayed.
If you create workspace, check the Create a new Workspace radio button, and click Continue.
To create a public workspace, check the Allow other users to access this workspace box. The public
workspace can be used by all users.
To create a private workspace, delete the check from the Allow other users to access this workspace
box.
Workspace is the space created in the Agilent B1500A’s internal hard disk drive, and is used to store
the test setup, measurement result data, and so on. The workspace can be created and allocated for
each user.
2-5
Module 2
Getting Started
To Create Workspace
1
Check this box for
Public workspace
2
1: New workspace name to create
2: New workspace name to rename
Enter the workspace name and click OK to create/rename the workspace.
If you want to create a public workspace, check the Allow other users to access this workspace box.
The public workspace can be used by all users.
If you want to create a private workspace, delete the check from the Allow other users to access this
workspace box.
2-6
Module 2
Getting Started
Online Help
Online Help is available for the B1500A and EasyEXPERT. Select Help > Agilent EasyEXPERT
Help menu to display the online help window. The online help provides the following information.
•Introduction describes overview, front view, rear view, and measurement units of the Agilent
B1500A.
•Using EasyEXPERT provides the reference information of the Agilent EasyEXPERT software.
•Function Details explains the measurement functions of the B1500A with EasyEXPERT.
•Built-in Programming Tool provides the reference information of the built-in function, read out
functions, and script programming statements.
•If You Have a Problem describes the problem solving information, the B1500A system maintenance
information, and the error messages.
2-7
Module 2
Getting Started
Application Test Description
To know about the application test, click the ( i ) icon. This icon displays the message box that
explains the application test definition. This function will help you to know what is and how to use
the application test.
2-8
Module 2
Getting Started
Typical Value Selection
You do not need to hit the keyboard.
Right clicking
this field
displays the
menu.
The values are
defined as
typical values
in the Test
Definition.
When you set a test condition of application test, you do not need to use keyboard. You can select
the value from the typical values as shown below.
•Click the entry field of a setup parameter by using the touch screen or the mouse. This displays the
typical values for the specified parameter on the softkeys.
•Select one of the softkeys.
Also you can use the following manner.
•Point the entry field of a setup parameter by using the mouse.
•Right click the mouse to display the popup menu.
•Click the Select menu to display the typical values for the specified parameter.
•Select one from the typical values.
Note:
The typical values are defined in the test definition. And you can change the values by using the
Define typical values window opened by clicking the Typical Values button on the Test Specification
screen of the Test Definition window. For the Test Definition window, see Module 9.
2-9
Module 2
Getting Started
Screen Keyboard
When you need to enter numeric characters in an entry field, you will see the icon at the right side of
the entry field. This icon opens the Numeric KeyPad. You can use this screen keypad instead of the
USB keyboard.
When you need to enter alphabetic characters in an entry field, you will see the icon at the right side
of the entry field. This icon opens the On Screen Keyboard. You can use this screen keyboard
instead of the USB keyboard.
2-10
Module 2
Getting Started
To Perform Application Test
Test Record List area
Step 1: Click Application Test tab.
Step 2: Select one or more technology categories, and select a desired test from the list of tests
associated with the selected technology categories.
Step 3: Change the setup parameters (Device parameters and Test parameters) if you want.
Step 4: Connect DUT, and click the Single button. The B1500A starts the selected test.
After the test, the test result data is displayed on the Data Display window. And the Test Result
Editor is also displayed on the lower left area of the B1500 screen. See the next page.
Step 5: Analyze the measurement result data.
The measurement result record is automatically stored in the internal hard disk drive.
2-11
Module 2
Getting Started
Test Result Editor
• Save/Delete
• ! Important
• # Valid
• ? Questionable
• Remarks
• OK
The Test Result Editor provides the following GUI to set a flag and remarks to the test result record.
Set the flag and remarks to the test record.
•Save button and Delete button
Divides test records into groups, Save and Delete.
Test records in Save-group are always listed in the lower area of the EasyEXPERT main screen.
Test records in Delete-group can be listed when Results > Filter > Show Deleted Data is checked.
•Flags buttons
The following buttons are available. You can set one of the following flags.
•Important ! Button
Sets the important flag (!) to the test result record.
•Valid # button
Sets the valid flag (#) to the test result record.
•Questionable ? Button
Sets the questionable flag (?) to the test result record.
•Remarks field
You can enter characters into this field. The characters will be recorded as the Remarks value of the
test result record.
•OK button
Applies the setup on the Test Result Editor, and closes this dialog box.
2-12
Module 2
Getting Started
Test Record List Area
Results > Filter > Show Deleted Data
Flag Setup Name
Flag Setup Name
… #
…
!
*
A
A
S
S
A
A
S
Vth gmMax
ID-VD1
ID-VD1
Vth gmMax
ID-VD1
Expand Application Test Results
Flag Setup Name
… #
… #
…
!
!
*
Vth gmMax
Vth gmMax
ID-VD1
ID-VD1
Vth gmMax
Vth gmMax
ID-VD1
#
#
?
?
!
!
*
Vth gmMax
Vth gmMax
Vth gmMax
Vth gmMax
ID-VD1
ID-VD1
ID-VD1
ID-VD1
Vth gmMax
Vth gmMax
ID-VD1
Show All Append Data
The test result records are listed in the test record list area. The area also lists the following data.
•Append measurement data marked with …
•Deleted data marked with * if Results > Filter > Show Deleted Data is checked
•Test name defined in the application test definition if Results > Filter > Expand Application Test
Results is checked
If Results > Filter > Show All Append Data is checked, all append data will be listed and the symbol
will be changed to A for the data obtained by the Append measurement or S for the data obtained by
the Single measurement.
2-13
Module 2
Getting Started
Single/Append/Repeat measurement
Append
Single
Repeat
The EasyEXPERT provides three execution modes, Single, Append, and Repeat.
Single button triggers a single measurement.
Append button triggers an append measurement. The measurement results will be appended to the
Data Display window that shows the previous measurement results. The Data Display window can
have maximum 10 layers for displaying measurement results.
Repeat button opens the Repeat Measurement Setup dialog box used to set the repeat measurement
condition. To perform the repeat measurement, see Module 11.
To abort measurement, click Stop button that appears instead of the Single button.
2-14
Module 2
Getting Started
To Save/Recall Your Test Setup
My Favorite Setup button
Preset Group name.
Use this field to select
preset group.
The test setups you create or modify MUST be saved in a preset group (My Favorite Setup).
To save the setup, click the Save button.
To recall the setup, click the Recall button.
You can organize the setups by using the My Favorite Setup button.
To select the available preset group, use the field below the My Favorite Setup button. In the above
example, the Demo group is selected and listed in the My Favorite Setup list.
To rename, duplicate, or delete the setups, and to add, rename, duplicate, delete, import, or export the
preset group, use the function of the My Favorite Setup button menu or the Organize Preset Group
dialog box shown in the next page.
2-15
Module 2
Getting Started
To organize preset group for test setup
My Favorite Setup button
This dialog box is opened by selecting the Organize Preset Group function of the My Favorite Setup
button menu, and is used to organize the preset group.
•Preset Group List
Lists the preset groups saved in the workspace. The Add, Rename, Duplicate, Delete, Import, and
Export buttons are available to organize the preset groups.
•Copy
Sets the operation of the >> button and the << button. They work as Copy when this check box is
checked, and as Move when this check box is blank.
•>>
Copies or moves the preset setup selected in the left Preset Group box to the right Preset Group box.
•<<
Copies or moves the preset setup selected in the right Preset Group box to the left Preset Group box.
•Close
Closes the Organize Preset Group dialog box.
•Preset Group
Lists the preset setups saved in the preset group. The Select All, Unselect All, Rename, Duplicate,
and Delete buttons are available to select or organize the setups saved in the preset group.
2-16
Module 2
Getting Started
To Export/Import Your Preset Group
My Favorite Setup
button
You can export/import your preset group.
To export the present preset group, click the My Favorite Setup button, select Export, and specify the
folder and the name of the preset group to export.
To import the preset group, click the My Favorite Setup button, select Import, and specify the preset
group to import.
2-17
Module 2
Getting Started
To Export/Import Test Record
1. Select data record to export, and right click.
2. Select Transport Data > Export As xxxx.
To export multiple data, select Transport Data > Folder Export.
To export the test result record, specify the data records and select the Transport Data > Export As
xxxx menu.
You can save the data records as an EasyEXPERT file, a CSV file, a XML spreadsheet file, or a
XML file created by using the specified XML style sheet.
You can import the data record exported as the EasyEXPERT file or the XML spreadsheet file.
To import the file, select the Transport Data > Import… Then the Test Result Import dialog box is
opened. On the dialog box, select the file to import.
You can read by using a text editor or a spreadsheet software as shown above. This example reads a
test record exported to a CSV file.
Note:
To export multiple test records, select Transport Data > Folder Export…, and specify the destination
folder and file names automatically set. Then the multiple test records can be exported to the
specified folder.
2-18
Module 2
Getting Started
Class Exercise
Perform Application Test.
1. Connect device (MOSFET). See the following pages.
2. Open Id-Vd test definition in the CMOS library.
3. Change the setup (SMU, output value, etc.)
4. Create your preset group, and save your setup.
5. Click
button to start a single measurement.
6. Perform this exercise for the Vth gmMax test
definition.
Note:
2-19
Module 2
Getting Started
SMU Triax Connection
Force Lines to Fixture 1,2,3,4 Ports
Force side
Sense side
CMU
16442A/B Fixture
SMU4
SMU3
SMU2
SMU1
GNDU
B1500A Rear View
For the non-Kelvin connections, connect only the Force lines, leaving the Sense lines open.
Connect corresponding numbers. On the 16442A/B fixture use the numbers labeled 1 - 6, not 1 - 3.
Your B1500A may not match the SMU configuration shown in this figure. Note that SMU1 is the
module top of the GNDU (ground unit). The SMU number become large from bottom to top as
shown.
This is the SMU cable setup that will be used in the remainder of the class exercises.
2-20
Module 2
Getting Started
Jumper Leads - MOS transistor
F
1
G
F
F
2
1
1
PGU
F
VSU
VMU
SMU
F
4
G
G
G
1
F
3
F
5
F
G
GNDU
6
F
S
G
2
2
2
4
5
6
9
10
11
12
14
15
16
17
18
20
21
22
23
1
2
7
8
13
19
28
3
15
24
25
26
27
28
14
1
16088-60002
Dual in line package
(28 pin)
For all class exercises, you need the 28-pin dual in line socket which comes standard with the 4145
fixture (16058A) or the newer fixture (16442A/B). Either fixture works fine.
With the 16442A/B fixture, note that there are two SMU numbering schemes....3 SMUs with force
and sense, or six SMUs with force only. For this class example we will use the six (6) SMU scheme.
On older fixtures, this scheme is shown in light blue lettering. In newer fixtures, this scheme is
shown in white reverse background lettering.
2-21
Module 2
Getting Started
Device Orientation and Insertion
S
Sub
Insert the transistor last,
AFTER connecting the
cables and leads. Remove
the shorting wire after
insertion in the socket.
D
G
1
23
1: Substrate
2: Source
3: Gate
4: Drain
15
14
The MOS FET leads must be re-arranged into a straight line as shown.
IMPORTANT:
The MOS FET is highly sensitive to electrostatic damage. Touching the bare leads can definitely
destroy the device. The device comes with a special shorting wire attached. Bend the leads the way
you want, insert the device in the socket, and then remove the shorting wire. The wire has a tab. Just
grab the tab and pull straight out. The wire will spiral out as you pull.
Once the shorting wire is removed, you must use a wrist strap when handling the device.
2-22
Module 2
Getting Started
Result Example
1. check
4. create
2. select
3. change
3. change
5. save
3. change
3. change
Test result data (record) is automatically saved after measurement.
1. Check the CMOS check box.
2. Select Id-Vd (or Vth gmMax) and click the Select button.
3. Change the SMU setting as follows.
Substrate: SMU1
Source: SMU2
Gate: SMU3
Drain: SMU4
4. Create your preset group (ex. Exercise).
5. Save the changed setup to your preset group.
After this class exercise, the Id-Vd setup and the Vth gmMax setup will be saved in your preset
group.
2-23
Module 2
Getting Started
Result Example
This is the Id-Vd measurement result example of the following source setup.
Gate voltage: 0.5 V to 2 V, 0.5 V step
Drain voltage: 0 V to 2 V, 0.05 V step
Source voltage: 0 V
Substrate voltage: 0 V
2-24
Module 2
Getting Started
To Perform Quick Test
Softkeys
for single
measurement
Step 1: Click Quick Test tab.
Step 2: Select the Preset Group.
Step 3: Mark (check) the test setups to be executed while the Quick Test is executed.
Step 4: Connect DUT, and click the Single button. The B1500A starts the selected tests from top to
bottom in the list.
After the test, the test result data is displayed on the Data Display window. And the Test Result
Editor is also displayed on the lower left area of the B1500 screen.
Step 5: Analyze the measurement result data.
The measurement result record is automatically stored in the internal hard disk drive.
The softkeys placed right side of the LCD are used to trigger a single measurement of the associated
test.
2-25
Module 2
Getting Started
To organize preset group for test setup
My Favorite Setup banner
This dialog box is opened by selecting the Organize Preset Group function of the My Favorite Setup
banner menu, and is used to organize the test preset group.
•Preset Group List
Lists the preset groups saved in the workspace. The Add, Rename, Duplicate, Delete, Import, and
Export buttons are available to organize the preset groups.
•Copy
Sets the operation of the >> button and the << button. They work as Copy when this check box is
checked, and as Move when this check box is blank.
•>>
Copies or moves the preset setup selected in the left Preset Group box to the right Preset Group box.
•<<
Copies or moves the preset setup selected in the right Preset Group box to the left Preset Group box.
•Close
Closes the Organize Preset Group dialog box.
•Preset Group
Lists the preset setups saved in the preset group. The Select All, Unselect All, Rename, Duplicate,
and Delete buttons are available to select or organize the setups saved in the preset group.
2-26
Module 2
Getting Started
Class Exercise
Perform Quick Test.
1. Use the device connection of the previous exercise.
2. Open your preset group.
3. Edit your preset group as you want (changing the test
execution order etc.).
4. Save your preset group.
5. Perform Quick Test.
Note:
2-27
Module 2
Getting Started
Result Example
Note:
2-28
Module 2
Getting Started
To Control Switching Matrix
Step 1: Click Switching Matrix button to open the Switching Matrix Operation Panel.
Step 2: Enter the switch setup name.
Step 3: Define the switch setup by using the matrix on the operation panel window. Label can be set
to input ports and output channels.
Step 4: Click the Apply Switch Setup button to send the switch setup to the B2200/E5250 switching
matrix.
Note:
Before clicking this button, connect the B2200/E5250 to the B1500 via GPIB, and set the
configuration. To set the configuration, see Module 12.
The switch setups you create or modify MUST be saved in a preset group.
To save the setup, click the Save button.
To recall the setup, click the Recall button.
You can organize the setups by using the Preset List button.
To select the available preset group, use the field below the Preset List button. In the above example,
the DemoSW group is selected and listed in the Preset List list.
To rename, duplicate, or delete the setups, and to add, rename, duplicate, or delete the preset group,
use the function of the Preset List button menu or the Organize Preset Group dialog box shown in the
next page.
Read Switch Setup: Read switch setup from B2200/E5250 via GP-IB and show it on the operation
panel window.
Note: Standard revision of EasyEXPERT cannot support the E5250. The E5250 control is optional
function of B1540A-002/B1541A-002.
Note: EasyEXPERT supports the E5250A installed with the E5252A matrix card.
2-29
Module 2
Getting Started
To organize preset group for switch setup
Preset List
button
This dialog box is opened by selecting the Organize Preset Group function of the Preset List button
menu, and is used to organize the switch preset group.
•Preset Group List
Lists the preset groups saved in the workspace. The Add, Rename, Duplicate, and Delete buttons are
available to organize the preset groups.
•Copy
Sets the operation of the >> button and the << button. They work as Copy when this check box is
checked, and as Move when this check box is blank.
•>>
Copies or moves the preset setup selected in the left Preset Group box to the right Preset Group box.
•<<
Copies or moves the preset setup selected in the right Preset Group box to the left Preset Group box.
•Close
Closes the Organize Preset Group dialog box.
•Preset Group
Lists the preset setups saved in the preset group. The Select All, Unselect All, Rename, Duplicate,
and Delete buttons are available to select or organize the setups saved in the preset group.
2-30
Module 2
Getting Started
To add switch setup to test preset group
Switch setups can be saved in the preset group for test setups.
Click the Export to Current My Favorite Group button. The switch setup will be converted to a
classic test setup and saved in the My Favorite Setup group opened in the main screen.
To select the available preset group, use the Preset Group field. In the above example, the Demo
group is selected and listed in the quick test setup list.
To duplicate, import, or export the preset group, use the function of the My Favorite Setup banner
menu or the Organize Preset Group dialog box shown in the next page.
2-31
Module 2
Getting Started
Class Exercise
Add switch setup to test preset group.
1. Create a switch setup.
2. Create your switch preset group, and save your setup.
3. Add the switch setup to your test preset group.
4. Save your test preset group.
Note:
2-32
Module 2
Getting Started
To Manage Data Display Window
Data Display > Default Data Display Properties…
The Data Display Properties window is used to set the default setting of the Data Display window.
This window is opened by selecting the Data Display > Default Data Display Properties... menu of
the main screen.
The Effective Area is used to select the area effective when the Data Display window is opened, and
provides the following check box.
•X-Y Graph: Check this box to enable the X-Y Graph area.
•Grid ON: Check this box to display the grid in the X-Y Graph.
•List Display: Check this box to enable the List Display area.
•Parameters: Check this box to enable the Parameters area.
The Graph Color area is used to set the color map for the Data Display window. You can change the
color of the background, text, graph grid, and line. The color palette is opened by clicking the
pattern of the item.
The Graph Trace Color area is used to set visibility, color, and thickness of the data traces Y1 to Y8
plotted on the graph.
The Log Scale area is used to set the maximum number of decades to show the minor ticks for the
log axis. If the number of graph decades is less than or equal to the entered value, the minor ticks are
displayed. If it is greater than the entered value, the minor ticks are not displayed.
The Text Size area is used to set the font size for the graph. The available settings are Largest, Large,
Medium, Small, Smallest, and Fixed. For settings other than Fixed, the appropriate size is
automatically selected. For Fixed, a font size entry field is provided, and the specified font size is
always applied.
•X/Y Axis Title: Font size for the axis title
•Scale: Font size for the X and Y coordinate values
•Legend: Font size for the graph legend
2-33
Module 2
Getting Started
To Manage Data Display Window
Data Display > Manage Data Display…
The Data Display Manager is used to control the appearances of the Data Display windows. This
window is opened by selecting the Data Display > Manage Data Display... menu of the main screen.
The Data Display Window Order area lists the Setup Name of the Data Display windows opened.
The list items from top to bottom correspond to the windows from front to back in the screen image.
The Minimized Data Displays area lists the Setup Name of the Data Display windows minimized.
The Data Display Window Configuration area provides the following radio buttons and a check box
to change the appearances of the Data Display windows. All functions are available for the opened
windows. See following slides for the display examples.
•Keep Setup: Keeps the present configuration of the Data Display windows.
•Tiling: Resize and collate the data display windows such that they fill up the entire screen.
•Stacking: Resize and collate the data display windows so that they overlap slightly with an offset.
•Overlaying: Resize, overlap, and make transparent the data display windows so that multiple graphs
can be viewed and superimposed on one another.
The following check box must be checked to apply the same graph scale to all graphs.
•Apply same scale to all graph
2-34
Module 2
Getting Started
Tiling
This is a display example of Tiling.
2-35
Module 2
Getting Started
Stacking
This is a display example of Stacking.
2-36
Module 2
Getting Started
Overlaying
This is a display example of Overlaying.
2-37
Module 2
Getting Started
To tile/stack/overlay windows
Stacking
Overlaying
Tiling
When some Data Display windows are opened, the following Windows menu functions are useful.
Tiling
Tiles all Data Display windows on the screen.
Stacking
Stacks all Data Display windows on the screen.
Overlaying
Overlays all Data Display windows on the screen. Then the position, window size, and visibility of
the most front window are applied to all windows on the screen.
The background of the X-Y Graph area is cleared except for the most back window.
2-38
3
Data Display and Management
Module 3
Data Display and Management
In This Module
•
Data Display window
•
Graph Analysis Tools
•
Data Status
•
To Change Graph/List/Display Setup
•
To See Print Preview
•
To Print Display Data
•
To Copy Graph Plot/List Data
•
To Save Analysis Result
•
To Use Preview Window
This section describes the above topics. You will understand how to use analysis tools, how to
change display setup, and how to print/export test result data.
3-2
Module 3
Data Display and Management
Data Display window
Parameters
X-Y Graph PLot
List Display
The Data Display window is opened after measurement automatically, or by clicking the Data
Display button. And the window is used to display measurement data and analyze the data.
The Show X-Y Graph icon displays/hides the X-Y Graph Plot area. This is the same as the View >
X-Y Graph menu.
The Show List Display icon displays/hides the List Display area. This is the same as the View > List
Display menu.
The Show Parameters icon displays/hides the Parameters area. This is the same as the View >
Parameters menu.
Multiple data display windows can be opened while the Multi Display indicator is ON. Then the test
result data of the same test setup name will
be displayed on the exclusive Data Display window and the test result data of the different test setup
name will be displayed on the new Data Display window. To set Multi Display ON, click the Run
Option button located at the top right of the Main window, check the “Allocate Data Display for each
test” box on the Run Option dialog box, and click the Close button.
3-3
Module 3
Data Display and Management
Graph Analysis Tools
This bar indicates
which axis is
effective for
marker control
and auto scaling.
(X value, Y1 value, Yx value)
cursor/marker position
Y1
marker
cursor
active line (normal line)
active cursor
Yx
(x : 2 to 8)
line (tangent line)
marker
The Data Display window provides marker, cursors, and lines for analyzing test result data. Marker
is used to read measurement data and draw a tangent line. Cursors are used to read the cursor
position and draw a normal line, gradient line, or regression line. The cursor/marker position data is
displayed top of the graph plot area.
Clicking Y axis can select the Y axis effective for the analysis tools. On the graph, left axis is always
Y1 axis. And the right axis is selectable from Y2 to Y8 axes.
3-4
Module 3
Data Display and Management
Graph Analysis Tools
Text
Pointer
Pointer
Text
Text and pointer are the tools to decorate the X-Y Graph.
The text is used to leave notes on the graph. The notes will be measurement conditions, device
information, operator name, and so on. Up to 20 texts can be added to a graph.
The pointer is used to indicate the remarkable measurement point and show the X and Y coordinates
like the marker. The new pointer can be displayed on the marker point at first and can be moved on
the measurement data curve by using the rotary knob or the mouse wheel. Up to 30 pointers can be
added to a graph.
3-5
Module 3
Data Display and Management
Graph Analysis Tools
Show Graph Legend
Show Line Information
Line Information:
Y1 intercept and
gradient of
active line
Line Information:
Yx intercept and
gradient of
active line
Line Information:
X intercept of active line
Graph Legend
When a line is displayed, the line information can be displayed in the graph plot area.
The Show Line Information icon displays/hides the line information. This is the same as the View >
Line Information ON/OFF menu.
The Show Graph Legend icon displays/hides the graph legend. This is the same as the View > Graph
Legend ON/OFF menu.
3-6
Module 3
Data Display and Management
Graph Analysis Tools
Hold this layer
Close All Displays
Switch Display Mode
Close this layer
Layer selection tab.
This example has
three layers.
Y1
If the append measurement is performed, the data display layer is added to the Data Display window.
In this example, the Data Display window has three layers.
Use the icons shown above to organize the data display layers.
Switch Display Mode icon switches the mode, overwrite or append.
In the overwrite mode, the data is displayed in a new Data Display window.
In the append mode, the data is displayed on a new display layer in the present Data Display window.
The Data Display window can hold up to 10 display layers. And the earliest layer over 10 will be
automatically deleted. The Hold this layer icon is available when the window holds at least two
layers. If this icon shows the standing pin, the layer will be held. If this icon shows the laid pin, the
layer can be deleted. Double clicking the tab gives the same result as this icon.
3-7
Module 3
Data Display and Management
Graph Analysis Tools
Graph control
(X value, Y1 value, Yx value)
marker
line (tangent line)
marker
Graph control:
Auto Scale icon will change the graph scale automatically to fit the trace in the graph. The right
arrow button opens the menu for enabling or disabling the run time auto scaling. This function is set
independently for the X and Y axes. If this function is enabled, the graph scale will be changed
automatically to fit the trace in the graph during the measurement.
Zoom In icon zooms the data graph in. This enlarges the trace in the graph. Then the center of
zooming will be the cursor position.
Zoom Out icon zooms the data graph out. This reduces the trace in the graph.
Graph Setup icon opens the Graph Setup dialog box used to change the graph axis setup.
Choose Active Y axis icon selects the Y axis that is effective for the analysis tools (marker control
and auto scaling).
If multiple layers are opened on the Data Display window, the scale change is applied to the layers.
This means that the X-Y graph scale will be shared by all display layers. The auto scaling is
performed as follows.
1. Graph scale is optimized for the data on the selected layer (top layer).
2. The graph scale is applied to the graph in the all layers.
Note that auto scaling is performed independently for the left and right Y axes.
There is also a function for resetting the graph scale. Click View > Cancel Scaling > This Display or
All Displays.
This Display will reset the selected layer only. All Displays will reset all display layers.
3-8
Module 3
Data Display and Management
Graph Analysis Tools
Marker control
(X value, Y1 value, Yx value)
marker
line (tangent line)
marker
Marker control:
Marker ON/OFF icon enables or disables the marker.
Interpolation ON/OFF icon enables or disables the interpolation function of measurement data. You
can read the interpolation data between two actual measurement points.
Marker Skip icon moves the marker to the next measurement curve that is added by the VAR2
variable.
Marker Maximum icon moves the marker to the maximum measurement point.
Marker Minimum icon moves the marker to the minimum measurement point.
Marker Search icon opens the Direct Marker/Cursor dialog box used to specify the coordinate values
to move the marker.
3-9
Module 3
Data Display and Management
Graph Analysis Tools
Line control
cursor
active line (normal line)
active cursor
line (tangent line)
marker
Line control:
Line 1 State icon enables or disables line 1 and its function: normal, gradient, tangent, or regression.
Line 2 State icon enables or disables line 2 and its function: normal, gradient, tangent, or regression.
Cursor to Marker icon moves the cursor to the marker position.
Adjust Gradient icon is available when a gradient line is active. Clicking this icon enables the rotary
knob and the mouse wheel to increase/decrease the gradient of the line. Clicking this icon again,
clicking the rotary knob, or clicking the mouse wheel disables this function.
3-10
Module 3
Data Display and Management
To Enable Marker and Line
Line > Line 1 ON/OFF
Line 2 ON/OFF
Marker > Marker ON/OFF
Marker ON/OFF
Line 1 & Line 2
To enable maker, click the Marker ON/OFF icon, or select the Marker > Marker ON/OFF menu.
To enable the Line 1, click Line 1 icon and select one of the line mode. Or select the Line > Line 1
ON/OFF menu and select one of the line mode.
To enable the Line 2, click Line 2 icon and select one of the line mode. Or select the Line > Line 2
ON/OFF menu and select one of the line mode.
If you enable the Normal line, two cursors are available. The cursors specify the points that the line
passes through.
If you enable the Gradient line, a cursor is available. The cursor specifies the point that the line
passes through.
If you enable the Regression line, two cursors are available. The cursor specify the measured data
used to draw the regression line.
3-11
Module 3
Data Display and Management
To Draw Normal Line
Line N > Normal
Cursor To Marker
2 cursors
line
Enable the Normal line by clicking the Line 1 (or Line 2) icon and Normal.
Move cursors to draw the line. The line passes through the cursor points.
To move the cursor, you can use the Cursor To Marker icon. The cursor will move to the marker
point.
3-12
Module 3
Data Display and Management
To Draw Gradient Line
Line N > Gradient
Cursor To Marker
Adjust Gradient
1 cursor
gradient
line
Enable the Gradient line by clicking the Line 1 (or Line 2) icon and Gradient.
Move the cursor to specify the point that the line passes through. And click the Adjust Gradient icon.
Use the rotary knob or the mouse scroll button to adjust the gradient of the line.
To move the cursor, you can use the Cursor To Marker icon. The cursor will move to the marker
point.
3-13
Module 3
Data Display and Management
To Set Gradient Value
This is another way to draw the gradient line.
Set the line 1 or 2 ON and select the gradient line mode. Then click Line > Gradient… to open the
Gradient Value dialog box.
On the dialog box, enter the desired gradient value, and click OK to draw the gradient line.
3-14
Module 3
Data Display and Management
To Draw Tangent Line
Line N > Tangent
marker
data curve
Enable the Tangent line by clicking the Line 1 (or Line 2) icon and Tangent.
Move marker to draw the line. The tangent line will pass through the marker point.
3-15
line
Module 3
Data Display and Management
To Draw Regression Line
Line N > Regression
Cursor To Marker
2 cursors
measured data
line
Enable the Regression line by clicking the Line 1 (or Line 2) icon and Regression.
Move cursors to specify the region of the measurement data used for the regression calculation.
To move the cursor, you can use the Cursor To Marker icon. The cursor will move to the marker
point.
3-16
Module 3
Data Display and Management
To Fix a Line
Line N > Fix
The specified line cannot
move while the Line Mode
is set to Fix.
To fix a line, click the Line 1 (or Line 2) icon and Fix, or select the Line > Line Mode > Fix menu.
While the Line Mode is set to Fix, the specified line cannot move.
3-17
Module 3
Data Display and Management
To Add Text
Text > New
To add a text, click Text > New. A text editor appears. Then enter the text you desire.
The following functions are available for the selected text(s) via the Text menu, the Text icons, or the
right-click menu.
Clicking on a text will select the text. To select the multiple texts, click the text while holding down
the Shift key on the keyboard.
Edit Mode: Edits the selected text.
Size: Sets the font size of the selected text(s). The available setting values are Largest, Large,
Medium, Small, Smallest, and Fixed Point (6, 7, 8, 9, 10, 11, 12, 14, 16, 18, or 20). For settings other
than Fixed Point, an appropriate size will automatically be applied. For Fixed Point, the specified
font size will always be applied.
Font: Sets the font of the selected text(s).
Text Color: Sets the text color of the selected text(s). Click Customize to open the color palette.
Background Color: Sets the background color of the selected text(s). Click Customize to open the
color palette.
Hide Frame/Show Frame: Hides or shows the frame for the selected text(s).
Delete: Deletes the selected text(s).
Dragging a text moves this text.
3-18
Module 3
Data Display and Management
To Add Pointers
Pointer > New
To add a pointer, set Marker ON, click Pointer > New. A pointer and description (pointer ID and XY coordinate values) appear. Then move the pointer you desire by using the rotary knob or the
mouse wheel.
The following functions are available for the selected pointer(s) or description(s) via the Pointer
menu, the Pointer icons, or the right-click menu.
Clicking on a pointer will select the pointer. To select the multiple pointers, click the pointer while
holding down the Shift key on the keyboard.
Clicking on a description will select the description of a pointer. To select the multiple descriptions,
click the description while holding down the Shift key on the keyboard.
Shape: Sets the shape of the selected pointer(s).
Hide Description/Show Description: Hides or shows the description of the selected pointer(s).
Delete: Deletes the selected pointer(s).
The rotary knob or the mouse wheel can be used to move the selected pointer in the VAR1 direction.
The pointer can not be moved in the VAR2 direction.
Dragging a description of pointer moves this description of pointer.
3-19
Module 3
Data Display and Management
Data Status
If measurement unit detects any status while measurement, the status code is recorded with the
measurement data. In this example, a SMU detected the compliance condition in the drain channel,
so the status code C is put just before the Idrain value.
SMU status code:
• C: Compliance
• T: Other channel compliance
• X: Oscillation
• V: Overflow
MFCMU status code:
• U: Unbalance
• D: I/V amp saturation
• V: Overflow
3-20
Module 3
Data Display and Management
To Change Graph Properties
The Graph Properties dialog box is used to set the following setting of the selected Data Display
window. This dialog box is opened by clicking the Properties... button in the X-Y Graph Plot area or
by selecting the Edit > Graph Properties... menu of the Data Display window.
The Grid ON check box in the Effective Area is used to display the grid in the X-Y Graph.
The Graph Color area is used to set the color map for the Data Display window. You can change the
color of the background, text, graph grid, and line/cursor. The color palette is opened by clicking the
pattern of the item.
The Graph Trace Color area is used to set visibility, color, and thickness of the data traces Y1 to Y8
plotted on the graph.
The Log Scale area is used to set the maximum number of decades to show the minor ticks for the
log axis. If the number of graph decades is less than or equal to the entered value, the minor ticks are
displayed. If it is greater than the entered value, the minor ticks are not displayed.
The Text Size area is used to set the font size for the graph. The available settings are Largest, Large,
Medium, Small, Smallest, and Fixed. For settings other than Fixed, the appropriate size is
automatically selected. For Fixed, a font size entry field is provided, and the specified font size is
always applied.
•X/Y Axis Title: Font size for the axis title
•Scale: Font size for the X and Y coordinate values
•Legend: Font size for the graph legend
3-21
Module 3
Data Display and Management
To Change List Display Properties
Edit > List Display Properties…
Data Status
Physical Unit
Example:
C -1.2345 V
Example: -1.2345 mA
Example: -1.23456789012345E-003 A
This dialog box is used to set the data display format in the List Display area. This dialog box is
opened by clicking the Properties... button in the List Display area or by selecting Edit > List Display
Properties... menu of the Data Display window.
Display:
Check the following check box to add the data status or the physical unit to data. Unchecking the box
removes it.
•Data Status: Adds or removes the status code before data.
•Physical Unit: Adds or removes the physical unit after data.
Number Format:
Selects the data display format from the following formats.
• Engineering Format (with Unit Prefix):
Data display with arithmetic point, SI prefix, and unit.
Example: -1.2345 mA
• Scientific Notation:
Data display with arithmetic point, exponential part (E, +/- sign, and three-digit number), and unit.
Example: -1.23456789012345E-003 A
3-22
Module 3
Data Display and Management
To Change Display Setup
View > Display Setup…
This dialog box is used to change the graph scale and data to be displayed in the Data Display
window.
The X-Y Graph area sets the X and Y1 to Y8 axes of the X-Y Graph Plot area.
Name: Specifies the parameter for the axis
•Sharing: Specifies the group for sharing the Y axis scale. Select from Group 1, Group 2, Group 3,
Group 4, or None (no grouping). The Scale, Min, and Max values are shared by the Y axes in the
same group. The scale set by Run Time Auto Scale, Auto Scale, Zoom in, and/or Zoom out are also
shared. If another layer on the Data Display window contains an X-Y trace which has the same name
for both its grouped Y parameter and its X parameter, the scaling will also be shared by this X-Y
trace.
•Scale: Scale of the axis, Linear or Log
•Min: Minimum value of the axis
•Max: Maximum value of the axis
The List Display area selects the variables to be listed in the List Display area. Up to 20 variables
can be set.
The Parameters area selects the variables to be listed in the Parameters area. Up to 20 parameters
can be set.
3-23
Module 3
Data Display and Management
To See Print Preview
File > Print Preview…
The Data Display window provides the File > Print Preview… function to show the print preview.
This is an example of the print preview.
•Select the File > Print Preview menu to open the Print Preview dialog box.
•Set the Print Range, Data to print, and Scaling.
•Click Preview button. The Print preview window is displayed.
3-24
Module 3
Data Display and Management
To Print Display Data
File > Print
File > Save Image As…
bmp, emf, gif, or png format
The Data Display window provides the display image output capability to a printer or a file.
Before printing, connect a printer to the B1500A via the parallel interface or the LAN, and set up it
by using the Add Printer Wizard of Windows. After that, do following.
•Select the File > Print menu to open the Print dialog box.
•Set the Print Range, Data to print, and Scaling.
•Click Next button.
•Select the printer, and set the Properties.
•Click OK button.
You can export the display image to a file as shown below.
•Select the File > Save Image As… menu to open the Save Image As… dialog box.
•Select the format (file type) from Save As Type menu.
•Enter the file name.
•Click Save button.
The file can be imported by the graphics software that supports the exported file type. The
EasyEXPERT supports the following types.
•bmp: Bitmap image
•emf: Enhanced metafile
•gif: GIF image
•png: PNG image
3-25
Module 3
Data Display and Management
To Copy Graph Plot
Paste to WordPad
You can copy graph image to the clipboard, and paste it to a word processing software. In the above
example, the graph image is pasted to the WordPad.
This is an example of the copy and paste operation.
•Select the Edit > Copy Graph menu on the Data Display window.
•Select the Edit > Paste menu on the WordPad.
3-26
Module 3
Data Display and Management
To Copy List Data
Paste to Notepad
Open by a spreadsheet software
You can copy the data list to the clipboard, and paste it to a word processing software. In the above
example, the data list is pasted to the Notepad.
This is an example of the copy and paste operation.
•Select the Edit > Copy List menu on the Data Display window.
•Select the Edit > Paste menu on the Notepad.
You can save the data as a text file, and read it by using a spreadsheet software. Data elements are
separated by a tab.
Note:
As same as the Copy List function, the Copy Parameter function is used to copy the data in the
Parameter area.
3-27
Module 3
Data Display and Management
To Save Analysis Result
Select File > Update Test Result
Select File > Save Image As…
Saves graph information to data record.
Saves graph image as a file.
To leave the graph modification information such as scaling, marker, cursor, and line on the graph,
select the File > Update Test Result menu.
You can see the all information when you open the graph again. Note that the modification
information will be destroyed if you did not do it.
To save the graph image as a file, select the File > Save Image As… menu.
You can save the image as a bmp, emf, gif, or png file.
3-28
Module 3
Data Display and Management
Class Exercise
Use the analysis tools.
1. Use your test setup (for example, GMMAX in the
Demo preset group) and perform measurement .
2. Enable marker and draw line. Try it for all line
types.
3. Copy/paste/save data list, and open it by using a
spreadsheet software (optional, if you can).
4. Save analysis condition. Re-open the test record.
5. Export your test record. And import it.
Note:
3-29
Module 3
Data Display and Management
To Use Preview Window
The Data Display window provides the File > Print… function to print the graph image. However,
you may want to set the graph title and change the line style. Then use the Preview window. The
Preview window is used to see and print the graph image you modified.
Select the View > Open Preview Window to open the Preview window and the Preview Settings
dialog box. And use the Preview Settings dialog box to set the title of graph, X axis, and Y axis, and
change the line style. To change the color and thickness, use the Color and Thickness dialog box
opened by clicking the Color and Thickness… button.
Clicking OK button in the Preview Settings dialog box applies the modification to the Preview
window and closes the dialog box.
Note:
The graph image in the Preview window cannot be saved.
3-30
Module 3
Data Display and Management
To Use Preview Window
This example is result of the changes shown in the previous page.
Line style was changed as shown above. The titles are set as follows.
Graph title: ID-VG Characteristics
X axis title: Gate Voltage
Y1 axis title: Drain Current
Y2 axis title: Transconductance
Y3 axis title: Drain Current
Also color of line1 was changed to red, and thickness of trace was changed.
To change the setup again, open the Preview Settings dialog box by selecting the View > Preview
Settings… menu.
3-31
Module 3
Data Display and Management
Class Exercise
Use the Preview window.
1. Use your test record used in the previous exercise.
2. Change the graph image as you want.
- Add graph title and change axis title.
- Change line style
- Change color and thickness
3. Print the graph image if a printer is available.
Note:
3-32