1
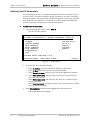
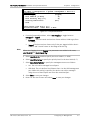
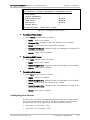
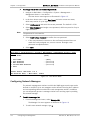
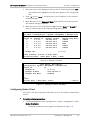
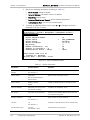
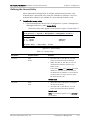
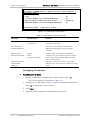
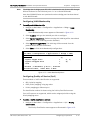
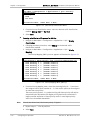
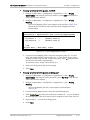
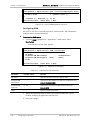
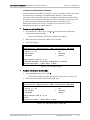
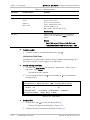
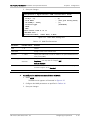
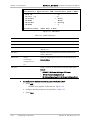
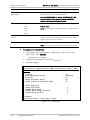
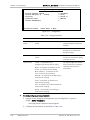
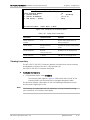
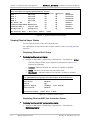
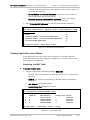
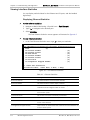
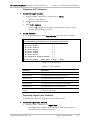
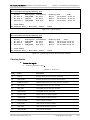
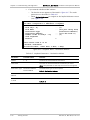
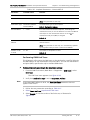
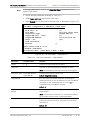
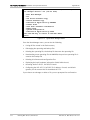
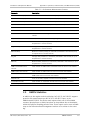
Chapter 6 Troubleshooting and Diagnostics This section describes how to do the following: • Monitoring the system performance • Displaying status and statistics • Displaying system messages • Detecting errors • Troubleshooting the device • Performing connectivity tests. 6.1 Monitoring Performance The software provides access to the following status information: • System level – MAC address, connection status, log file, and clock source • Physical level – Ethernet and E1 port status • Application level – MAC table. The status information is available via the Monitoring menu. Viewing System Status Information The System menu shows the Log file, and shows the interface connection status. For a description of system messages, which are displayed via the Log file screen, refer to Chapter 6. ³ To display interface connection information: • Navigate to Main Menu > Monitoring > System > Interface Status. The Interface Status screen appears as illustrated in Figure 6-1. It includes the following: Interface description. Fast Ethernet, E1, MLPPP, and bridge ports Type. Interface type Activation. Indicates whether the interface is enabled (Up) or disabled (Down), as user defined via the Ethernet menus (refer to Chapter 4). Operation. The link’s current operational status (Up or Down). RICi-4E1/T1, RICi-8E1/T1 Ver. 2.0 Monitoring Performance 6-1