1
3
Analyzing Models
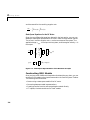
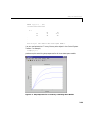
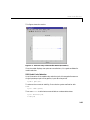
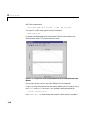
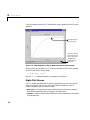
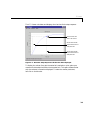
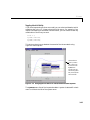
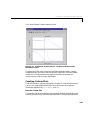
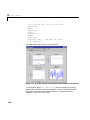
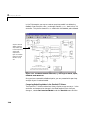
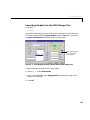
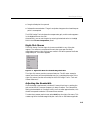
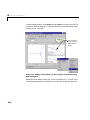
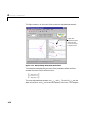
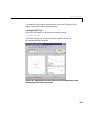
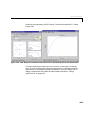
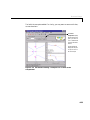
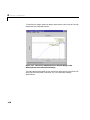
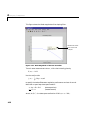
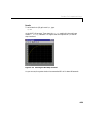
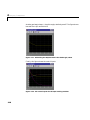
Your LTI Viewer should now look like this.
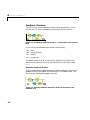
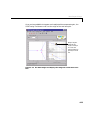
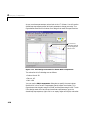
Place your cursor
on the blue or
green dots to see
phase margin data.
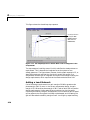
Figure 3-11: Multiple Plots with Response Characteristics Added
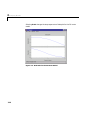
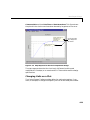
The minimum stability margins, meaning the smallest magnitude phase and
gain margins, display as green and blue markers on the Bode phase diagram.
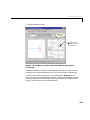
If you want to see all the gain and phase margins of a system, select Stability
Margins (all) under the Characteristics menu item.
3-16