1
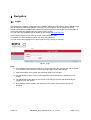
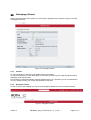
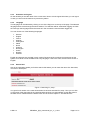
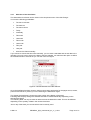
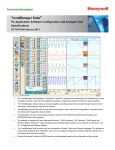
PRNetBox light User manual Version v1.11 ROTH automation GmbH Zeppelinstr. 27 D- 79713 Bad Säckingen Phone:+49 (0)7761 / 5564477 Fax:+49 (0)7761 / 5564479 Email: [email protected] Web: http://www.roth-automation.de Web: http://www.prnetbox.de 6-Mar-14 PRNetBox_light_usermanual_en_v1_11.doc Page 1 of 31 Table of contents 1 Introduction...................................................................................................................................... 3 1.1 Version..................................................................................................................................... 3 1.2 PRNetBox light......................................................................................................................... 3 1.3 Purpose of this document......................................................................................................... 3 2 Navigation....................................................................................................................................... 4 2.1 Login........................................................................................................................................ 4 2.2 Homepage (Home)................................................................................................................... 5 2.2.1 Content............................................................................................................................. 5 2.2.2 Navigation header............................................................................................................. 5 2.2.3 Username and logout........................................................................................................ 6 2.2.4 Language.......................................................................................................................... 6 2.2.5 Search field....................................................................................................................... 6 2.2.6 Navigation via the menu.................................................................................................... 7 2.2.7 Breadcrumbs navigation line............................................................................................. 7 2.2.8 Footer................................................................................................................................ 7 3 The data archive.............................................................................................................................. 8 3.1 The data archive overview....................................................................................................... 8 3.2 Data archive – display of a data value.....................................................................................9 3.2.1 Selection of the time frame............................................................................................. 10 3.2.2 Selection of the timeframe with the „zoom“mode............................................................11 3.2.3 Selection of the timeframe with the “move“ mode...........................................................11 3.2.4 Automatic update rate..................................................................................................... 12 3.2.5 Statistics of the chosen timeframe..................................................................................12 3.2.6 Visualize the minimum – maximum section (“percentiles” view).....................................13 3.2.7 Magnified view................................................................................................................ 13 4 Meter............................................................................................................................................. 14 5 Setpoints....................................................................................................................................... 15 6 Machine values............................................................................................................................. 16 7 I/O values...................................................................................................................................... 17 8 Actual values................................................................................................................................. 18 9 Errors............................................................................................................................................ 19 9.1 All errors of a timeframe......................................................................................................... 19 9.2 Actual errors........................................................................................................................... 19 9.3 Last coming/going time of all errors.......................................................................................19 10 Events........................................................................................................................................ 20 10.1 All events in a timeframe.................................................................................................... 21 10.2 Actual events...................................................................................................................... 21 10.3 Last coming/going time of all events...................................................................................21 11 Protocols.................................................................................................................................... 22 11.1 Protocol overview............................................................................................................... 22 11.2 Protocol details................................................................................................................... 23 12 Trends........................................................................................................................................ 24 12.1 General information............................................................................................................ 24 12.2 Add a new trend................................................................................................................. 24 12.3 Link tags to a trend............................................................................................................. 25 12.4 Lookup trends..................................................................................................................... 26 13 Operating hours counter............................................................................................................ 27 14 Data export................................................................................................................................ 28 14.1 Export configuration............................................................................................................ 28 14.2 Setup configuration............................................................................................................. 28 14.3 Download of export files..................................................................................................... 29 15 Change your password.............................................................................................................. 30 16 Glossary..................................................................................................................................... 31 6-Mar-14 PRNetBox_light_usermanual_en_v1_11.doc Page 2 of 31 1 Introduction 1.1 Version This document is dated from the 6-Mar-14 and refers to the version v1.5.11 of the PRNetBox. 1.2 PRNetBox light The PRNetBox light is a simplified version of the PRNetBox. The biggest difference is that the PRNetBox light is built on a virtual machine which you can download separately at VMware (VMware Player). The PRNetBox is an autonomous industrial PC 1.3 Purpose of this document This document has been made for operators of the PRNetBox light and describes its basic functionalities. It covers the data archive, trending, handling and display of errors, setpoints, machine values, protocols, operating hours counter, data export, Meters, I/O values, password change and change of events. Admin users, please consolidate the admin manual for details on the administration. The declaration of conformity 21CFR Part 11 is also separately available. 6-Mar-14 PRNetBox_light_usermanual_en_v1_11.doc Page 3 of 31 2 Navigation 2.1 Login Depending on the network configuration of the VMware Player the user interface of the PRNetBox light can have different addresses available. Generally, the user interface can be operated by using standard browsers like Mozilla Firefox, Microsoft Internet Explorer or the Google Chrome browser. To get the best result we suggest using the current Firefox version. You can reach the PRNetBox light as default on the website http://192.168.2.40. In the following figure you see the login screen of the PRNetBox light. As operator you will be asked to enter a user name and password. You can change the languages in the upper right corner by clicking on the flags. Figure1: Login Note: If the password has been entered three or more times wrong the operator login will be locked for a timeframe of 30 minutes. This rule does also apply for the administrator. After the first login to the system the password needs to be changed. The administrator sets the aging of the password and he chooses if the password can be reused. The administrator sets after how much time of inactivity the operator will automatically be logged out from the system. Every attempt will be logged in the audit trail of the system and cannot be removed or changed. 6-Mar-14 PRNetBox_light_usermanual_en_v1_11.doc Page 4 of 31 2.2 Homepage (Home) After a successful login at the system, the user with the privileges of an operator is going to see this homepage and menu: Figure 2: Homepage (Home) 2.2.1 Content On the homepage you see the recent health status of the system. You get an overview how much disk space you still have and how long this capacity will last without deleting any old data archives. Errors with the mentioned modules would be displayed here, too. Therefore you can consolidate the error log. Please contact your system administrator in this case. 2.2.2 Navigation header On the very top of the webpage you can find the navigation header with some important features. Figure 3: Navigation header 6-Mar-14 PRNetBox_light_usermanual_en_v1_11.doc Page 5 of 31 2.2.3 Username and logout On the left side you see the name of the current user. Next to it is the logout link where you can logout in case you are not at the machine to prevent any abuse. 2.2.4 Language The language can be selected by clicking on one of the flag icons on the top of the page. The selected language will be active through the whole session. The selection will be saved when logging out. With the next login the language will be the same as in the moment the user has been logged out. You can choose out of the following languages: German English French Spanish Portuguese Italian Dutch Polnisch Norwegian Czech Russian Chinese English and German are provided in each version. Because of the continuous improvement of this system some texts are not translated into every language. If this is the case, the text will be shown in English. 2.2.5 Search field Also in the navigation header you find the search field where you can enter the name of a data value, comment or description. Figure 4: Searching for „temp“ You get a list of results. In the case shown below it has been searched for „temp“. Now you can click on the name of the data value in the result list and that brings you automatically to this data value in the data archive. Details about the data archive can be found in chapter 3 “The data archive”. 6-Mar-14 PRNetBox_light_usermanual_en_v1_11.doc Page 6 of 31 2.2.6 Navigation via the menu The menu is on the left side of the webpage. Via the links listed you get to the specific themes. Figure 5: Main menu 2.2.7 Breadcrumbs navigation line By clicking on the fields in the breadcrumbs navigation line you can get to the specific themes, too (You are here …) and you can see were you are, respectively, how you get there. This is useful in cases you are already in the 4th or 5th level. 2.2.8 Footer In the footer you find a link to the start page „home“ , a logout button and an arrow to get back to the top of the page. Figure 6: Footer 6-Mar-14 PRNetBox_light_usermanual_en_v1_11.doc Page 7 of 31 3 The data archive Here you find all data values (tags) which have been setup by your administrator. For further information about how new data values will be collected automatically by the system, please refer to the admin manual. 3.1 The data archive overview Please click on the link “data archives“ on the left side in the menu to see all tags and values (see figure). Here you can see the name of the tag, its recent value in the PLC, its data type, its address in the PLC and a description of the tag. Figure 7: Data archive- overview In the first column of the table you find a drop down menu. You can choose between different filters. You can filter the values by “setpoints”, “machine data”, “actual values”, “errors”, “input/output” or “events”. Also you can filter in the next drop down menu by data type. These two filters can also be combined. For example you could filter to see only “Setpoints” with the type “Integer”. 6-Mar-14 PRNetBox_light_usermanual_en_v1_11.doc Page 8 of 31 3.2 Data archive – display of a data value By clicking on the name of the data value you get to the detailed view where you can see all values as a trend. You can choose between minimum, maximum, average and actual values (see figure). Figure 8: Details for data value aTmp To every data value which has been configured, the archived data values can be shown. “Integer”, “Real”, “Byte” and “Boolean” values are displayed as trend in addition. Data values with the data type “String” are written as text. The possibilities of this feature are explained in the next chapters. 6-Mar-14 PRNetBox_light_usermanual_en_v1_11.doc Page 9 of 31 3.2.1 Selection of the time frame The observation time frame can be chosen in the drop down menu of the field “Range“. You have the following possibilities: The last 10 minutes The last hour The last 24 hours Today Yesterday This week Last week This month Last month This year Last year Choose time frame manually If you choose to choose the time frame manually, you can enter a start data and an end date in the calendar. You only have to click on the date to see the calendar. You also have the option to define the timeframe down to seconds as you can see in the next figure. Figure 9 : Choose the date out of the calendar Once the timeframe has been chosen, this time frame stays active also for the pages errors, events, protocols and trends to prevent you from reentering the data allover again. The shorter the timeframe is chosen the more precise is the display of the trend. Following basic display settings are available and will be used automatically depending on the selected time frame. The following table can only be used as reference how the data will be read. This can be different depending on the quantity of data in the chosen timeframe. Just on top of the trend you can see which view is recently used 6-Mar-14 PRNetBox_light_usermanual_en_v1_11.doc Page 10 of 31 Timeframe 0 seconds – 60 seconds 61 seconds – 60 minutes 1 hour – 24 hours 1 day – 7 days 1 week – 1 month Longer than 1 month 3.2.2 View All available and recorded values in milliseconds. Average per second Average per minute Average of 10 minutes Average of 1 hour Average of a day Selection of the timeframe with the „zoom“mode Alternatively you can choose the timeframe also within the trend. Please note that you first have to make sure that you´ve select the „Zoom“mode. In the figure you can see the button on the top of the trend on the left side. Figure 10: Select timeframe manually First you choose a larger timeframe than you need and then you select the timeframe in the trend while holding the left mouse button. As soon as you loosen the mouse button the trend will be refreshed into the chosen selection. On the top right side of the trend you can see the current date and the current value referring to the cursor position. Alternatively you can select the timeframe in the overview on the bottom of the trend. Here you can only choose the timeframe not the scale. 3.2.3 Selection of the timeframe with the “move“ mode As soon as you have clicked on the button “zoom” mode the “move“ mode function is going to be enabled. That means that you can swipe the trend left and right as you can on recent smart phones. You just have to click on the left button of your mouse and move it left or right. 6-Mar-14 PRNetBox_light_usermanual_en_v1_11.doc Page 11 of 31 3.2.4 Automatic update rate You can choose the option to automatically refresh your data in a defined rate if you choose one of the following timeframes: The last 10 minutes The last hour On top of the trend you can check a box with the description “enable monitoring view“. It is not possible to zoom in the “monitoring view” If you would like to zoom into a timeframe, you can zoom before you choose this option. If you check this box, you can choose how quick the PRNetBox will run an automatic update. The rates you can choose are 1, 2, 5 or 10 seconds. It is not possible to activate the statistic features (min, max, etc) in this view. Figure 11: Monitoring view 3.2.5 Statistics of the chosen timeframe The minimum, maximum, actual, and averages of the values that have been recorded in a timeframe are displayed in text form. Additionally these values can be displayed in the trend according to the selection you´ve made (see figure) Figure 12: Different options to display the values in the statistic 6-Mar-14 PRNetBox_light_usermanual_en_v1_11.doc Page 12 of 31 3.2.6 Visualize the minimum – maximum section (“percentiles” view) If you set the check the box “enable percentiles view“ you can see in which section the data has been recorded in a large timeframe (between the minimum and maximum values). In the following figure you see a timeframe of +/- 8 days in the activated “percentiles” view. The red curve displays the average value of the data. The shadow shows where the data has been recorded. Figure 13: Percentiles view activated If you zoom in to approx. one day, the data will be refreshed automatically and displayed as shown below. Figure 14: Zoom on day basis 3.2.7 Magnified view With a click on the magnifier you can enlarge the trend display for optimization of the print layout with the printer function of the web browser. 6-Mar-14 PRNetBox_light_usermanual_en_v1_11.doc Page 13 of 31 4 Meter On the page „meter“ in the menu, you can see the configured meters in certain time ranges. Any data can be added to the meters and any meters can be configured. Therefore you need system admin rights. Please also look up the system admin user guide. Figure 15: Data list meter On this page you can lookup easily important data and the differences of values. Therefore choose the range in the drop down menu and click on refresh. To lookup the data on the screen click on “Load data”. You can also choose to download the data as CSV file. 6-Mar-14 PRNetBox_light_usermanual_en_v1_11.doc Page 14 of 31 5 Setpoints On the page for setpoints you get an overview of all changed setpoints in a time frame you can choose. Figure 16: Changes in setpoints In the example of the figure all changes of a manually chosen timeframe are displayed. In the drop down menu for the field “Range“ you can select the time frame you would like to see. Click on the button “refresh” to see the data in the chosen timeframe. Here you are getting an overview about the time of the change, the name of the tag, the value before the change (old value) and the new/current value of the tag. If the old value gets displayed as N/A that means this was the first change of the setpoint. If you go with the mouse cursor above the tag without clicking, the description of the tag will be shown. If you click on the name of the tag you will be redirected automatically to the data archive of this tag (see also chapter 3 “The data archive”) If there are more than 10 changes in the chosen timeframe a new page will be created (up to 25). This means that maximum 250 changes will be listed. You will get a message if you selected a time frame with more than 250 setpoint changes. 6-Mar-14 PRNetBox_light_usermanual_en_v1_11.doc Page 15 of 31 6 Machine values On the page machine values you get an overview about all changed machine values in a specific time frame that you can choose. Figure 17: Changes in machine values In the example of the figure all changes of a manually chosen timeframe are displayed. In the drop down menu for the field “Range“ you can select the time frame you would like to see. Click on the button “Refresh” to see the data of the chosen timeframe. Here you are getting an overview about the time of the change, the name of the tag, the value before the change (old value) and the new/current value of the tag. You can also see the username of the panel at the moment of the change. If the old value gets displayed as N/A that means this was the first change of the machine value. If you go with the mouse cursor above the tag without clicking, the description of the tag will be shown. If you click on the name of the tag you will be redirected automatically to the data archive of this tag (see also chapter 3 “The data archive”). If there are more than 10 changes in the chosen timeframe a new page will be created (up to 25). This means that maximum 250 changes will be listed. You will get a message if you selected a time frame with more than 250 machine value changes. 6-Mar-14 PRNetBox_light_usermanual_en_v1_11.doc Page 16 of 31 7 I/O values On the page I/O values you get an overview about all changed I/O values in a specific time frame that you can choose. Figure 18: I/O values In this figure all changes of a manually chosen timeframe are displayed. In the drop down menu for the field “Range“ you can select the time frame you would like to see. Click on the button “Refresh” to see the data of the chosen timeframe. Here you are getting an overview about the time of the change, the name of the tag and the new/current value of the tag. If you go with the mouse cursor above the tag without clicking, the description of the tag will be shown. If you click on the name of the tag you will be redirected automatically to the data archive of this tag (see also chapter 3 “The data archive”). If there are more than 10 changes in the chosen timeframe a new page will be created (up to 25). This means that maximum 250 changes will be listed. You will get a message if you selected a time frame with more than 250 I/O value changes. 6-Mar-14 PRNetBox_light_usermanual_en_v1_11.doc Page 17 of 31 8 Actual values If you click on the link „actual values” in the menu, you see all current values for the actual value tags. In the overview you will see the name of the tag, the value, the unit and the description of the tag. Figure 19: Actual values overview The exceptionality of this page is, that the blue marked values are refreshing constantly automatically. So you do not have to press any refresh button to see the most current value of the tag! By clicking on the „eye“ button you get the data without menu or design. This is very helpful for the consolidation of the values on a smartphone. In the system settings the administrator can define the quantity of actual value pages. The standard settings are as follows: Pages: 1 page Actual values per page: 10 values The displayed actual values can be defined by the administrator. 6-Mar-14 PRNetBox_light_usermanual_en_v1_11.doc Page 18 of 31 9 Errors Click in the menu on the link “Errors” to get to the page where all the define errors are listed. In the drop down menu “Display type” you can choose out of three views, which will be explained in the next chapters. 9.1 All errors of a timeframe Similar to the data archive you can choose here a time frame of interest. Like this you can track the emerged errors. In the figure below you can see one error occurred and gone in the chosen timeframe. Figure 20: All errors of the timeframe On the bottom of the page the errors will be listed. At the moment the error raises the time will be logged and a red arrow will appear in front of the listed tag. As soon as the error goes, the time will be logged again and a green arrow will appear in front of the listed tag. In the drop down menu for the field “Range“ you can select the time frame you would like to see like described in chapter 3 “The data archive”. 9.2 Actual errors If you select „Actual errors“ as display type, only the current errors will be listed. 9.3 Last coming/going time of all errors In this selection you can see when an error came up and when it has been solved. 6-Mar-14 PRNetBox_light_usermanual_en_v1_11.doc Page 19 of 31 10 Events Click on “Events“ in the menu to get to the page to see all events. Events are defined by a rising or a falling edge of a bit. For example a motor start or the start of a function could be defined as an event. To each event you can add values which are recorded together with the start/finish of the event. Like this you could record the value of the setpoint as parameter at the start of a machine. The administrator can define which bit should raise the event. Also he can define whether it should be raised with the rising or the falling edge of the bit. The log of the parameter can be defined separately for the rising or the falling edge. To one event an almost unlimited number of parameters can be defined. Sometimes it makes sense to define an error as event and to add a parameter. For example if you would have an error defined for “temperature too high” it would make sense to log the temperature as parameter. Like this you see when the temperature went to high and what the value was. Similar to the error display you have three options to display the events, like described in the next chapters. Figure 21: All events of the timeframe In this figure you can see an event, which got a green “ON“ symbol. The Green “ON“ symbol signalizes the rising edge of the event. We speak about an upcoming event. A parameter has been linked to the event. The parameter is the temperature at the doorstep at the moment that the movement in front of the door has been logged. The parameter has been setup to be logged only in case of a rising edge of the event. All temperature changes in front of the doorstep are also archived in the data archive (see also chapter 3 “The data archive”) since this is a tag which has been linked as parameter to the event. The configuration of events is described in the admin manual. Admin rights are necessary to make changes. 6-Mar-14 PRNetBox_light_usermanual_en_v1_11.doc Page 20 of 31 10.1 All events in a timeframe If you select this option you´ll see all events that have been logged in a specific time frame. Green “ON“ icons illustrate the rising edge of the event. Red “OFF” icons illustrates the falling edge of the event. In this view you see all changes even machine value and setpoint value changes. All data values can be defined as setpoint or machine value by the administrator. Setpoints are values defined by the operator like the rotational speed of a motor. Machine values are specific system configurations which are defined normally only once in the commissioning period. 10.2 Actual events If you select “Actual events“ as display type, only the current event will be listed. 10.3 Last coming/going time of all events In this selection you can see when an event came up and when it has gone. Condition here is that the event has been setup for a rising and a falling edge. 6-Mar-14 PRNetBox_light_usermanual_en_v1_11.doc Page 21 of 31 11 Protocols On this page the list of all protocols is shown. Protocols can be issued for different purposes. The main purpose is to make a protocol for an automatic run, for example a recipe of a product or a batch. The PRNetBox can save an almost unlimited quantity of protocols and several protocols can be saved simultaneously. The information that is going to be recorded in the protocol is defined by the administrator. Following details are in disposal for configuration: Errors Events Changes in setpoints Changes in machine values All values the system records can be shown in the header of the protocol A certain value at the beginning of the protocol, at the end of the protocol The difference between begin and end of the protocol in case of numeric values All kinds of trends for all data values recorded in the system. You can choose to add several data values in one trend or configure different data values in separate trends. Meter readings in defined time intervals. Also the difference to the last value can be calculated. Since you have the option to issue several different configured protocols simultaneously you have the possibility to get protocols with different details. 11.1 Protocol overview As you can see in this figure you see on the link for protocols the overview over all recorded protocols. Figure 22: protocol overview You can choose the timeframe, like „today”, „yesterday” or „last week”. In the overview the following information is listed: the batch number, the batch name, the date and time the protocol started and ended. The quantity of events and the quantity of errors are also shown in the overview. Through the link of the protocol name, e.g. „mid night” you can see the details of the protocol. By clicking on the pdf icon you can download the protocol as pdf file, save or print it. 6-Mar-14 PRNetBox_light_usermanual_en_v1_11.doc Page 22 of 31 All protocols are saved on a network share on the PRNetBox. You can access this drive via the IP address or via the configured name in the system. This share is not password protected. The network share is write- protected, nothing can be changed. The network drive suits perfectly for automated backup of all protocols by a company own data server. 11.2 Protocol details If you click on the protocol name you get to see all details of your protocol. In the protocol shown below, protocol headers have been defined. In the drop down menu “Show” you can select which information you would like to see (set points, events, errors, actual values). In case of large protocols with many header information, this can be useful. The start time, the finish time and the run time of the protocol will always be logged and displayed automatically. Figure 23: details of a protocol In the example of the figure you can see start and the end value of the machine value and its difference in the header, too. Also the events have been listed in this protocol as you can see on the picture. At the bottom of the protocol you can find a link to print the protocol details. But it is easier to use the pdf document for a proper layout of the protocol (see chapter 11.1) Also the trends can be defined for a protocol, the colors, the data values and if the data values should be shown in one trend or several trends. To combine data values in one trend is practical in case the values are in the same scale range and have the same units, since it saves space on your protocol. 6-Mar-14 PRNetBox_light_usermanual_en_v1_11.doc Page 23 of 31 12 Trends 12.1 General information Every user can define his own trends. In the next chapter this will be explained. 12.2 Add a new trend Click in the menu on the link “Trends“ to get to the page where you can add and edit trends. At the first visit of this page, you´ll be asked to add a trend (see figure). You can now choose a name for your trend. This name will be used in the listings. If you choose a name which already exist you´ll get a warning. The entry of a name is obligatory. Figure 24: How to add a trend If you check the box “Share trend” every user can see your trend configuration. If not, only you will have access to the trend. Also you can add a comment to explain the trend further. To save the new trend, hit “Create”. Now that the trend has been added you´ll get a table below the entry fields. Here you see the name, the comment and also whether the trend is shared or not. This new trend does not have any data values linked to it. Figure 25: The first trend To add data tags to the trend, click on the edit icon on the left side of the trend name. This is explained in the next chapter in more detail. To delete the trend click on the delete icon left to the name of the trend. You will be asked if you really want to delete the trend. To display the trend, just click on the trend name. If no data tags are linked yet you can´t click on the name, because the trend is still inactive. 6-Mar-14 PRNetBox_light_usermanual_en_v1_11.doc Page 24 of 31 12.3 Link tags to a trend After clicking on the „edit”-icon left to the name of a trend configuration (see figure) a input form to add new tags will be shown. Figure 26: Link tags to a trend In the drop down ”New value” menu you get a list of all configured tags in the system (except data values of data type „String“). If you click in the color field you get a big range of available colors to choose the color for the data of the tag in the trend (see figure below). Figure 27: Choose a color for the curve of the tag in the trend For every trend configuration you can add up to 20 tags. The field “multitrend group“ allows to add several tags in one group so you can see them in one trend. You can choose any number in this field. Each tag of “multitrend group” 0 is shown in a single chart. The fields “Y-Scala Minimum“ and “Y-Scala Maximum“ set the Y-Scale minimum and maximum values. For automatic scale range determination enter “0” in both fields. 6-Mar-14 PRNetBox_light_usermanual_en_v1_11.doc Page 25 of 31 Through clicking on the button “Add value to trend“ the trend will be modified and you can access your new trend. The trend you´ve added will be shown in the list below the mask for the configuration of a trend (see figure). Figure 28: Trend configuration A tag can be removed from the trend configuration by clicking on the “delete” icon in front of the tag name. A tag configuration can be changed or modified by clicking on the “edit” icon accordingly. 12.4 Lookup trends Through clicking on the configured trend name (see last figure) you get to the display of the trend with all configured tags, their colors, scales and values. Figure 29: Display of a trend In the example shown in the figure above three data tags have been assigned to the same multitrend group. Though, they are listed in one trend. The timeframe shown can be chosen by changing the “Range” selection or using the zoom functionality of the trend. 6-Mar-14 PRNetBox_light_usermanual_en_v1_11.doc Page 26 of 31 13 Operating hours counter The operating hours counter help to determine when the next service needs to be done for specific elements. The table shows the tag name, the description, the sum of hours, the set limit and the total of the operating hours. A green check mark illustrates that the limit which has been set by the administrator has not been reached yet. A red exclamation mark means in this case that the heating floor pump should be serviced. After the service has been done, the administrator sets the count of hours (sum hours) back to zero (see admin guide). Figure 30: Operating hours counter overview 6-Mar-14 PRNetBox_light_usermanual_en_v1_11.doc Page 27 of 31 14 Data export In the menu “Data export“ data of a certain period can be exported. 14.1 Export configuration In the drop down menu “Range“, you choose which timeframe you would like to look up. For example: The 4th december 2012 until the 5th of december 2012) The drop down menu “Timeframe“ sets the data density (e.g. second- or hour- or day averages) The drop down menu “Configuration“ gives you the possibility to choose which tags you would like to export. As default you can only choose “Export all tags“. But it is possible to setup configurations which consist user defined „tags“. Those customized definitions would then be available in the drop down menu (see next chapter) In the section “Others“ you can choose to export “Setpoints”, “Machine values” or “Actual value” tags by checking the specific box. Click on “Start data export” to run the export. Figure 31: Data export configuration 14.2 Setup configuration The configuration setup can be found below the export data fields. With configurations you can export specific tags. A name has to be specified in order to create a new data export configuration. Click on “Create configuration“. Figure 32: Setup a new configuration for export 6-Mar-14 PRNetBox_light_usermanual_en_v1_11.doc Page 28 of 31 The new configuration appears below the entry fields. Figure 33: Edit new configuration If you click on the “edit“ icon you can add the tags you wish to add. You can add several tags to the configuration. Figure 34: Add tag to create a new value to the configuration 14.3 Download of export files Once the data export has been started, the export task is shown on the bottom of the page. Figure 35: Export is running As soon as the export has been finished, you can download the data. You can see that in the last three columns. Figure 36: Export can be downloaded The data is provided in „CSV-format“. 6-Mar-14 PRNetBox_light_usermanual_en_v1_11.doc Page 29 of 31 15 Change your password It is mandatory to change your password on regular basis to prevent the access of others. Therefore you can click in the menu on “change password”. As you can see in the following figure you have to enter your old password to be able to define a new password. Figure 37: Change password The new password is activated by clicking on “Save new password“. 6-Mar-14 PRNetBox_light_usermanual_en_v1_11.doc Page 30 of 31 16 Glossary Tag PRNetBox IPC 6-Mar-14 A data value in the plc control which has an address assigned, like DB1.DBX0.1. Protocol and recipe management with a PC Box (IPC) which has been plugged into the network Industrial PC PRNetBox_light_usermanual_en_v1_11.doc Page 31 of 31