1
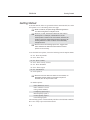
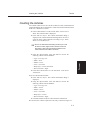
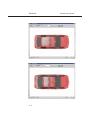
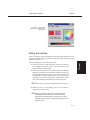
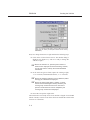
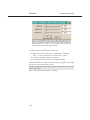
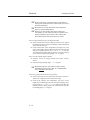
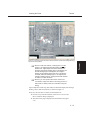
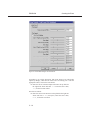
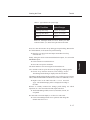
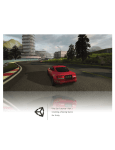
Tutorial
EDCRASH
TUTORIAL
5
This tutorial illustrates a very common use of EDCRASH, that is, to estimate
the vehicle impact velocities from accident scene and vehicle damage
measurements. This tutorial is continued in the EDSMAC(4) Tutorial,
wherein the initial vehicle velocities are used to simulate the crash. You may
wish to review that tutorial after finishing this one.
Like all EDCRASH events, the procedure involves the following basic steps:
•
•
•
•
Create the vehicle(s)
Create the environment
Execute the EDCRASH event
Review the EDCRASH output reports
This basic procedure is described in detail in this tutorial.
It is assumed that HVE-2D or HVE is up and
+ NOTE:
running, and that the user is familiar with its basic
features, such as using dialogs and viewers, as well as
the Editors. The purpose of this tutorial is to illustrate
those features while setting up and executing an
EDCRASH event.
5-1
TUTORIAL
Chapter
EDCRASH
Getting Started
Getting Started
As in other tutorials, before we get started with our current tutorial, let’s set the
user options so we’re all starting on the same page.
In HVE-2D, all options simply affect the appearance
+ NOTE:
in a viewer during Event or Playback mode.
in HVE, AutoPosition affects the data used in
+ However,
the analysis. For example, if AutoPosition is On, the
vehicle position conforms to the local surface; otherwise, the
position is set by the Position/Velocity dialog. Obviously, the
resulting difference in initial conditions could substantially
change the event.
Some of the following options are “Toggles” that
+ NOTE:
switch between two different modes. Make sure these
options are set correctly.
To set the initial user options, choose the following from the Options Menu:
â
â
â
â
â
â
â
â
ON: Show Key Results
OFF: Show Axes
ON: Show Contacts
OFF: Show Velocity Vectors
ON: Show Skidmarks
OFF: Show Targets
ON: AutoPosition
Units equals S.I.
As we’ll see when we create our environment, our
+ NOTE:
EDCRASH Tutorial studies a crash that took place in
Australia; thus we require metric units.
â Render Options:
•
•
•
•
•
•
•
Show Humans as Actual
Show Vehicles as Actual
Phong Render Method
Complexity equals Object
Render Quality equals 5
Texture Quality equals 1
Anti-aliasing equals 1
The remaining options will automatically initialize to their default conditions.
We’re now ready to proceed with the tutorial.
5-2
Creating the Vehicles
Tutorial
Creating the Vehicles
Let’s add the vehicles to our case. The first vehicle is a white, 1996 Ford Escort
2-Door Hatchback; the second vehicle is a dark red 1995 Nissan Sentra 4-door
Sedan. Let’s add the first vehicle:
â If the Vehicle Editor is not the current editor, choose Vehicle
Mode. The Vehicle Editor is displayed.
â Click Add New Object. The Vehicle Information dialog is
displayed. The Vehicle Information dialog allows the user to
select the basic vehicle attributes according to Type, Make,
Model, Year and Body Style.
The Vehicle Information dialog also allows you to edit
+ NOTE:
the Driver Location, Engine Location, Number of Axles and
Drive Axle(s). These options are already assigned for each
vehicle and need not be edited in our tutorial.
â Using the option buttons, click each button to choose the
following vehicle from the database:
TUTORIAL
• Type = Passenger Car
• Make = Ford
• Model = Escort
• Year = 1991-1996
• Body Style = 2-Door Hatchback
• Driver Location = Right
â Click OK to add Ford Escort 2-Dr Hatchback to the Active
Vehicles list.
Next, let’s add the Nissan Sentra:
â Click Add New Object. The Vehicle Information dialog is
displayed.
â Using the option buttons, click each button to choose the
following vehicle from the database:
• Type = Passenger Car
• Make = Nissan
• Model = Sentra
• Year = 1995-1999
• Body Style = 4-Door
• Driver Location = Right
â Click OK to add Nissan Sentra 4-Dr to the Active Vehicles list.
We now have the vehicles required for our study, as shown in Figure 5-1.
5-3
EDCRASH
Creating the Vehicles
Figure 5-1 Ford Escort 2-Dr Hatchback (above) and Nissan Sentra 4-Dr (below).
5-4
Creating the Vehicles
Tutorial
Figure 5-2 Vehicle Color
dialog, used for assigning the
vehicle color.
Editing the Vehicles
Next, we’ll edit the vehicles to change their color and weight. In addition, we’ll
change the stiffness of the Nissan Sentra, using values derived from our initial
reconstruction analysis.
TUTORIAL
Start by changing the color of the Ford Escort:
â Click on Ford Escort 2-Dr Hatchback in the Active Vehicles
list, making it the current vehicle. The Ford Escort is now
displayed in the Vehicle Editor.
â Click on the CG and choose Color. The Vehicle Color dialog is
displayed (see Figure 5-2), showing the vehicle’s current color
(the small black square, or hot spot, in the color wheel) and
intensity (the arrow in the intensity slider). Click on the hot spot
and drag it to the center of the blue area. To lighten the vehicle,
click on the intensity slider and drag it to the far right end.
+ NOTE: The color chip on the left shows the current color.
â When the color is to your liking, press the Close button to
apply the new vehicle color.
The vehicle’s apparent color may be slightly
+ NOTE:
misleading because the vehicle is translucent when
displayed in the Vehicle Editor. The actual color will be
used whenever the vehicle is displayed during Event and
Playback mode.
5-5
EDCRASH
Creating the Vehicles
Figure 5-3 Vehicle Inertias dialog, used for editing the current
weight and yaw inertia (roll and pitch inertias are not used by
EDCRASH).
Next, let’s change the Escort’s weight. Perform the following steps:
â Click on the CG and choose Inertias. The Inertias dialog is
displayed (see Figure 5-3), and we’re ready to change the
vehicle’s weight.
The vehicle’s roll, pitch and yaw moments of
+ NOTE:
inertia are also displayed in the Inertias dialog; however,
only the yaw inertia is used by the 3-DOF EDCRASH
calculations.
â In the Total Weight text field, replace the existing weight,
10283 Newtons, with the measured value, 11037 Newtons.
The weight is entered as a force (Newtons). Mass
+ NOTE:
units (kg) are calculated and displayed.
The dialog might display 10283.5, or similar
+ NOTE:
number because the weight is actually divided by the
current gravity constant and stored as mass. Extra
precision results when the mass is multiplied by the
current gravity constant and redisplayed.
â Press OK to accept the weight value.
The Ford Escort is now ready for use in our tutorial. Using the viewer thumb
wheels or mouse, zoom in or out on the vehicle or translate the vehicle in the
viewer X or Y directions
5-6
Creating the Vehicles
Tutorial
Now, let’s change the color, weight and stiffness of the Nissan Sentra:
â Click on Nissan Sentra 4-Dr in the Active Vehicles list,
making it the current vehicle. The Nissan Sentra is now
displayed in the Vehicle Editor.
â Click on the CG and choose Color. The Vehicle Color dialog is
displayed. The vehicle’s color is fine, but we need to darken it.
To darken the vehicle, click on the intensity slider and drag it to
the middle of the range.
+ NOTE: The color chip on the left shows the current color.
â When the color is to your liking, press the Close button to
apply the new vehicle color.
Next, let’s change the Nissan’s weight:
â Click on the CG and choose Inertias. The Inertias dialog is
displayed.
â In the Total Weight text field, replace the existing weight,
Again, the value displayed in the dialog may
+ NOTE:
contain extra precision, for the reasons explained earlier.
â Press OK to accept the weight value.
Finally, let’s change the stiffness on the right side of the vehicle. An SAE
moving barrier crash test (SAE J972) revealed the And B stiffness
coefficients for the side of the vehicle were 245 N/cm and 50 N/cm2,
respectively. Let’s enter the new values:
â Click on the right side surface icon (red sphere). The CG to
Right Side dialog is displayed.
â Click Stiffness. The Stiffness Coefficients dialog for the right
side surface is displayed, as shown in Figure 5-4 on the
following page.
The Vehicle Editor assumes the stiffness is
+ NOTE:
uniform across the right side of the vehicle. If desired, we
can add hard spots using the Damage Profile dialog
during Event mode.
5-7
TUTORIAL
10858 Newtons, with the measured value, 11282 Newtons.
EDCRASH
Creating the Vehicles
Figure 5-4 Vehicle Stiffness dialog, used for editing the current A, B and Kv
stiffness coefficients for the current surface. Note that EDCRASH allows the
user to assign different stiffness values for the front, back and sides. By
default, the stiffness is uniform on any side; however, hard spots may be
assigned using the Event Editor (described later).
To edit the current A and B stiffness coefficients:
â Replace the current value in the A field with the calculated
value, 245 N/cm. Then enter a new value for B, 50 N/cm2.
â Click OK to update the stiffness coefficients.
â Click OK again to remove the CG to Right Side dialog.
The Nissan Sentra is now ready for use in our tutorial. Using the viewer thumb
wheels, pan, zoom and look at the vehicle.
Note that, in HVE, the thumb wheels rotate the vehicle about the viewer axes,
not the vehicle axes.
Now, we have both vehicles ready for our study.
5-8
Saving the Case
Tutorial
Saving the Case
Now that we’ve created vehicles for our case, let’s save the case file.
â Click on the File menu and choose Save. The Save-as File
Selection dialog is displayed.
The Save-as dialog is displayed because the
+ NOTE:
case has not been saved previously, so we need to enter
a filename.
â Place the mouse cursor in the Case Title text field and enter
EDCRASH Tutorial, Visibility Study.
The Case Title is displayed as a heading on all
+ NOTE:
printed output reports.
â Place the mouse cursor in the Filename text field and enter
EdcrashTutorial.
â Click SAVE. The current case data are saved in the
hve2d/supportFiles/case subdirectory.
TUTORIAL
Saving the file occasionally is a highly
+ NOTE:
recommended practice.
5-9
EDCRASH
Creating the Environment
Creating the Environment
Now, let’s add the environment:
â Choose Environment Mode. The Environment Editor is
displayed.
â Click on Add New Object. The Environment Information
dialog is displayed.
â Using the Location Database combo box, choose Sydney,
NSW, Australia. The latitude (35.53.00S), longitude
(151.10.00E) and GMT, hours from the prime meridian (+10)
are displayed for the selected location.
If Sydney were not included in your Location
+ NOTE:
Database, you could add it simply by typing in the new
location name, latitude, longitude and GMT.
â Enter a name for the accident site, Blind Intersection.
â Edit the date and time of the incident we are studying,
7/23/99 and 1330, respectively.
â Edit the angle from true north to the earth-fixed X axis in our
environment, -10 degrees.
The Latitude, Longitude, GMT, Date/Time and
+ NOTE:
angle from true north are used to position the sun in the
scene. This is, of course, important because the sun is
the primary light source for the scene.
â To add the environment geometry file to our case, click on
Open. The Environment Geometry File Selection dialog is
displayed.
â Click on the Files of Type option list and choose HVE
Geometry Files (*. h3d). A list of environment geometry files
using the .h3d file format is displayed in a list box.
â Double-click on EdcrashEdsmacTutorial_2D.h3d to choose
the environment file and remove the dialog.
HVE users should select the environment file
+ NOTE:
named EdcrashEdsmacTutorial.h3d.
â Press OK.
5 - 10
Creating the Environment
Tutorial
The selected environment is added to our case and displayed in the
Environment Viewer (see Figure 5-5). Use the viewer thumb wheels to view
the scene.
5 - 11
TUTORIAL
Figure 5-5 Appearance of the 2-D environment geometry used by HVE-2D users for the
EDCRASH tutorial. HVE users will use a similar environment geometry, but with the
enhancements of additional images of buildings and traffic controls included in the model.
EDCRASH
Creating the Event
Creating the Event
As mentioned at the outset, this EDCRASH tutorial describes a common
application of EDCRASH, that is, to determine pre-impact vehicle velocities. This
can be accomplished only when scene data (vehicle positions at impact and rest) are
known. Fortunately, we have that data, owing to a splendid at-scene investigation. In
addition, vehicle damage profiles are available from vehicle inspections.
To create the event, perform the following steps:
â Choose Event Mode. The Event Editor is displayed.
â Click on Add New Object. The Event Information dialog is
displayed.
â Select Ford Escort 2-Dr Hatchback and Nissan Sentra 4-Dr
from the Active Vehicles list. The vehicles are added to the
Event Humans and Vehicles list.
â Select EDCRASH from the Calculation Method options list.
â Enter a name for the event, Visibility Study.
The name of the calculation method will
+ NOTE:
automatically be appended to the event name, thus the
complete event name will become “EDCRASH, Visibility
Study.”
â Press OK to display the event editor.
Now, we’re ready to set up the event. Event set-up for EDCRASH involves the
following three steps:
• Position the Vehicles -The minimum required vehicle positions are
Impact and Rest. Vehicle positions at Begin Braking, Point-on-curve
(POC) and End-of-rotation (EOR) are optional positions that may be
assigned for each vehicle.
If Impact and Rest positions are not assigned for
+ NOTE:
both vehicles, impact speeds cannot be computed - it is
physically impossible!
• Assign Wheel Data - Wheel data (% Wheel Lock-up, Steer Angle and
Pre-impact Wheel Lock-up) are required whenever scene data are
supplied.
• Assign Damage Profiles - Vehicle damage profiles (damage Width,
Depth and Offset) are optional for oblique collisions, but required for
collinear collisions, where the momentum analysis is too sensitive to the
scene data to be reliable.
Even though damage profiles are not required for
+ NOTE:
oblique collisions, they provide an excellent confirming
analysis.
5 - 12
Creating the Event
Tutorial
Let’s set up the Ford Escort. It skidded for a short distance before impact. Let’s
start by entering its Begin Braking position:
â Select Ford Escort 2-Dr Hatchback from the Event Humans &
Vehicles list.
â Click Set-up from the menu bar and choose Position/Velocity.
The Impact position for the Escort is displayed at the
earth-fixed origin.
â Click on the Position/Velocity dialog’s Path Location option
list and choose Begin Braking. The Escort Begin Braking
position is displayed at the earth-fixed origin.
â Click on the vehicle’s X-Y manipulator, wait for it to turn
bright yellow (indicating it has been selected), and drag it to its
begin braking position, X=18.0 m, Y=15.0 m. In the Yaw
field of the Position/Velocity dialog, replace the existing
value with the correct heading angle for the start of braking,
180 degrees.
To select the X-Y manipulator, the viewer must be
+ NOTE:
in Pick mode, as indicated by the highlighted arrow in the
upper right corner of the viewer (see Figure 5-6).
5 - 13
TUTORIAL
Figure 5-6 Positioning the Ford Escort using the Event Editor. The manipulators can be
used to drag and drop the vehicle into position. In the figure above, the Escort is being
placed in its impact position on the environment model used in HVE.
EDCRASH
Creating the Event
If necessary, adjust the viewer by panning and
+ NOTE:
dollying back (using the viewer controls) until you can see
the entire intersection.
Be sure to keep the mouse button depressed
+ NOTE:
while you drag the manipulators.
If you can’t position the vehicle at the exact
+ NOTE:
coordinates, you can simply enter the coordinates in the
dialog (remember to press <Enter> after entering the
data; otherwise the new values will not be used!).
Now let’s position the Escort at its impact position:
â Click on the Position/Velocity dialog’s Path Location option
list and choose Impact. The Escort impact position is displayed
at the earth-fixed origin.
â Click on the vehicle’s X-Y manipulator (see Figure 5-6), wait
for it to turn bright yellow (indicating it has been selected), and
drag it to its impact position, X=6.0 m, Y=13.75 m. In the
Yaw field of the Position/Velocity dialog, replace the existing
value with the impact heading angle, 195.0 degrees.
Now, enter the sideslip angle at impact:
â Click the Velocity Is Assigned check box to allow velocity
entries.
â Enter the impact sideslip angle, -4.35 degrees.
Although you could enter an impact velocity,
+ NOTE:
EDCRASH would not use it; after all, it is EDCRASH’s
role to calculate impact speed!
Next, let’s position the Escort at its rest position:
â Click on the Path Location option list and choose Final/Rest.
The Escort is displayed at the earth-fixed origin.
â Click on the vehicle’s X-Y manipulator, wait for it to turn
bright yellow (indicating it has been selected), and drag it to its
rest position, X=3.5 m, Y=12.75 m. In the Yaw field of the
Position/Velocity dialog, replace the existing value with the
rest heading angle, 230 degrees.
5 - 14
Creating the Event
Tutorial
TUTORIAL
Figure 5-7 View of the scene after the Ford Escort has been positioned at its Begin Braking,
Impact and Rest positions.
NOTE: In HVE and HVE-2D, +230 degrees is not the
+ same
as -130 degrees because the relative magnitude
+
between two angles implies the rotation direction! For
example, if the impact heading angle is 180 degrees and
the rest heading angle is 230 degrees, the change in
heading angle between impact and rest is +50 degrees
clockwise; if the rest heading angle is -130 degrees, the
change in heading angle is -310 degrees and the direction
of rotation is counter-clockwise.
NOTE: If you can’t position the vehicle at the exact
coordinates, simply enter them in the dialog (in fact, it’s
often easier to directly enter the coordinates using the
dialog).
Upon completion of this step, the Ford Escort should be displayed at its Begin
Braking, Impact and Rest positions, as shown in Figure 5-7.
Next, let’s enter the driver controls for the Ford Escort:
â Choose Set-up from the menu bar, select Driver Controls. The
Driver Controls dialog is displayed.
â The Wheel Data page is displayed for the Ford Escort (Figure
5-8).
5 - 15
EDCRASH
Creating the Event
Figure 5-8 Wheel Data dialog for the Ford Escort.
According to our vehicle inspection, both front wheels were locked after
impact by damage, while the rear wheels were free turning. Let’s enter the
appropriate values, first for the front wheels:
â Place the cursor in the Post Impact Percent Lock-up field for
the right front wheel and enter 1.0. Enter the same value,
1.0, for the left front wheel.
Now the rear wheels:
â Place the cursor in the Percent Lock-up field for the right rear
wheel and enter 0.01 (0.01/mslide). Enter the same value,
0.01, for the left rear wheel.
5 - 16
Creating the Event
Tutorial
Table 5-1 Typical Wheel Lock-up Values [20].
Wheel Condition
Typical Range
No Damage, Free-rolling
0.01/mslide to 0.02/mslide
No Damage, Drive Wheel
0.10/mslide to 0.15/mslide
Damage
0.0 to 1.0
NOTE: For undamaged wheels, be sure to divide by the slide
coefficient of friction, mslide, before entering the value for each wheel.
Next, let’s enter the Percent Lock-up during pre-impact braking. Because the
tires left skidmarks, we’ll assume 100 percent braking:
â Place the text cursor in the Pre-impact Total Wheel Lock-up
field and enter 1.0.
â Click on the Rot/Lat Skid check box.
â Press OK to accept the wheel data.
The wheel data have now been assigned for the Ford Escort.
Let’s conclude event set-up for the Escort by supplying a damage profile:
â Choose Set-up from the menu bar, select Damage Profiles.
The Damage Profile dialog is displayed for the Ford Escort.
The Damage Profile dialog initially contains None, waiting for us to assign a
CDC (Collision Deformation Classification; see HVE User’s Manual, ref. 6.3):
â Replace None in the CDC field with 11FDEW3 and click
Apply. The default damage profile is displayed according to
the CDC.
Because we actually measured the damage profile during our vehicle
inspection, let’s enter the measured width, depth and offset:
â The default damage width, 169.42 cm, and offset, 0.00 cm, are
acceptable.
We measured seven crush depths, so we have six crush zones:
â Click on the Damage Profile Zones option list and change the
default value from 3 to 6.
5 - 17
TUTORIAL
Finally, noting the vehicle rotated and skidded after impact, let’s select that
EDCRASH option:
EDCRASH
Creating the Event
Table 5-2 Crush depths for the front of the Ford
Escort 2-Dr Hatchback.
Crush
Depth
No.
Crush Depth (cm)
1
75.0
2
60.0
3
50.0
4
45.0
5
40.0
6
40.0
7
45.0
NOTE: Front and rear crush depths are entered
left-to-right.
â Enter the seven crush depths, beginning on the left end of the
damage profile, according to Table 5-2.
Remember to press Apply after entering the crush
+ NOTE:
depth values.
When completed, the Ford Escort appears as shown in Figure 5-9.
â Press OK to accept the assigned damage profile data.
Event set-up for the Ford Escort is now complete.
Let’s set up the Nissan Sentra. We’ll start by assigning its impact and rest
positions:
â Select Nissan Sentra 4-Dr from the Event Editor’s Event
Humans and Vehicles list.
â Click Set-up from the menu bar and choose Position/Velocity.
The Impact position for the Sentra is displayed at the
earth-fixed origin.
5 - 18
Tutorial
TUTORIAL
Creating the Event
Figure 5-9 Damage Profile dialog for the Ford Escort.
â Click on the vehicle’s X-Y manipulator, wait for it to turn
bright yellow (indicating it has been selected), and drag it to its
impact position, X=3.5 m, Y=13.0 m. In the Yaw field of
the Position/Velocity dialog, replace the existing value with
the heading angle, -90 degrees. When finished, the Nissan
Sentra will be positioned as shown in Figure 5-10.
Be sure to keep the mouse button depressed
+ NOTE:
while you drag the manipulators.
may wish to enter the values directly in the
+ You
Position/Velocity dialog.
5 - 19
EDCRASH
Creating the Event
Figure 5-10 Positioning the Nissan Sentra using the Event Editor. The manipulators can be
used to drag and drop the vehicle into position. In the figure above, the Sentra is being placed
in its impact position. Note the Ford Escort’s rest position visually obstructs our positioning of
the Nissan Sentra; this visual obstruction does not affect calculations.
Next, let’s position the Nissan at its rest position:
â Click on the Position/Velocity dialog’s Path Location option
list and choose Final/Rest. The Sentra’s rest position is
displayed at the earth-fixed origin.
â Click on the vehicle’s X-Y manipulator, wait for it to turn
bright yellow (indicating it has been selected), and drag it to its
rest position, X=0.5 m, Y=2.25 m. In the Yaw field of the
Position/Velocity dialog, replace the existing value with the
rest heading angle, 70 degrees.
Be sure to keep the mouse button depressed
+ NOTE:
while you drag the manipulators.
may wish to enter the values directly in the
+ You
Position/Velocity dialog.
NOTE: In HVE and HVE-2D, +70 degrees is not the
+ same
as -290 degrees because the relative magnitude
between two angles implies the rotation direction!
5 - 20
Creating the Event
Tutorial
The Nissan’s positions are now established. Let’s enter the driver controls. In
this case, there are no driver inputs, per se. However, after impact the vehicle
coasts to rest, so we need to enter rolling resistances:
â Choose Set-up from the menu bar and select Driver Controls.
The Wheel Data dialog is displayed.
According to our vehicle inspection, all the wheels were free turning (i.e., not
locked by damage). Let’s enter the appropriate values, first for the front
wheels:
â Accept the default values for Percent Lock-up for Axle 1,
Right Side and Left Side, 0.20 (0.15/mslide).
Now the rear wheels:
â In the Percent Lock-up field for Axle 2, Right Side, enter
0.01 (0.01/mslide). Enter the same value, 0.01, for the left
rear wheel.
The Nissan is a front wheel drive vehicle, hence
+ NOTE:
the larger wheel lock-up values; see Table 5-1.
â Click on the Rot/Lat Skid check box.
â Press OK to accept the wheel data for the Nissan Sentra.
The wheel data have now been assigned for the Nissan Sentra.
Let’s conclude event set-up for the Nissan Sentra by supplying a damage
profile:
â Choose Set-up from the menu bar, select Damage Profiles.
The Damage Profile dialog is displayed for the Nissan Sentra.
The Damage Profile dialog initially contains None, waiting for us to assign a
CDC (Collision Deformation Classification):
â Replace None in the CDC field with 02RPEW3 and click
Apply. The default damage profile is displayed according to
the CDC.
Because we actually measured the damage profile during our vehicle
inspection, let’s enter the measured width, depth and offset:
â Enter the right side damage width, 220 cm, and offset, -40 cm.
We measured five crush depths along the right side of the Nissan, so we have
four crush zones:
â Click on the Damage Profile Zones option list and change the
default value from 3 to 4.
5 - 21
TUTORIAL
Finally, noting the vehicle rotated and skidded after impact, let’s select that
EDCRASH option:
EDCRASH
Creating the Event
Table 5-3 Crush depths for the right side of the
Nissan Sentra 4-Dr.
Crush
Depth
No.
Crush Depth (cm)
1
20.0
2
30.0
3
50.0
4
45.0
5
10.0
NOTE: Crush depths are entered rear-to-front.
â Enter the five crush depths along the right side, according to
Table 5-3 (remember to press Apply after entering all of the
values).
The damage profile appears as shown in Figure 5-11. Note the reported force is
506,798 Newtons. Further, note the force reported for the Ford Escort is
726,647 Newtons. According to Newton’s 3rd Law, the forces on both
vehicles should be equal.
It is quite common for the initially computed forces
+ NOTE:
to be different when side impact is involved because a
vehicle’s side stiffness varies according to where it was
impacted; the wheels are much stiffer than other locations.
The best way to solve this problem is to adjust the stiffness coefficients to
equalize the forces. If the damage profile has uniform stiffness, we can quickly
estimate the amount of the adjustment by noting the current ratio of the
calculated collision forces:
force ratio
FEscort
FSentra
726,6447
506,798
143
.
But the side of the Nissan does not have a uniform stiffness, and a large portion
of the impact force was applied at the right rear wheel. Therefore, we cannot
directly use the above method. Let’s adjust the stiffness by increasing the A
and B coefficients for zone 1, the zone that includes the right rear wheel, using
trial and error.
5 - 22
Tutorial
TUTORIAL
Creating the Event
Figure 5-11 Damage Profile dialog for the Nissan Sentra.
The A and B stiffness coefficients are related;
+ NOTE:
when adjusting the stiffness coefficients, always multiply
A and B by the same factor!
Let’s try a factor of 2.0:
â Click A Stiffness. The A Stiffness Coefficients dialog is
displayed (see Figure 5-12) with the default value, 245 N/cm.
The adjusted value for our first attempt is 490 (245 x 2).
â Enter 490.0 for Zone 1.
â Press OK to accept the new value.
5 - 23
EDCRASH
Creating the Event
Figure 5-12 A Stiffness and B Stiffness coefficients dialogs.
Now, let’s adjust the B value:
â Click B Stiffness. The B Stiffness Coefficients dialog is
displayed (see Figure 5-12) with the default value, 50 N/cm2.
The adjusted value for our first attempt is 100.0 (50 x 2).
â Enter 100.0 for Zone 1.
â Press OK to accept the new value.
5 - 24
Creating the Event
Tutorial
Now, note the current peak force displayed in the Damage Profile dialog. The
value is quite a bit too low (again, we want it to equal the value of 726,647
Newtons for the Ford Escort). Try a factor of 5:
â Click A Stiffness to display the A Stiffness Coefficients dialog,
and enter 1225 (245 x 5). Press OK to remove the dialog.
â Click B Stiffness to display the B Stiffness Coefficients dialog,
and enter 250 (50 x 5). Press OK to remove the dialog.
Now the force for the Nissan is quite a bit greater than the force on the Ford.
Repeat the process using a factor of 3.4:
â Click A Stiffness to display the A Stiffness Coefficients dialog,
and enter 833 (245 x 3.4). Press OK to remove the dialog.
â Click B Stiffness to display the B Stiffness Coefficients dialog,
and enter 170 (50 x 3.4). Press OK to remove the dialog.
The resulting force on the Nissan is 734,667 Newtons, closely matching the
force on the Ford Escort.
â Press OK to accept the assigned the damage profile.
PDOF1
1
PDOF2
2
TUTORIAL
It is always a good idea to make sure that the entered impact positions and
PDOFs conform to Newton’s 3rd Law. According to Newton’s 3rd Law, the
vehicles’ PDOFs must be equal and opposite. When we apply this constraint to
our data, we find the following condition must be satisfied:
± 180
where:
= heading angle
Solving for PDOF2, we have:
PDOF2 = PDOF1 + Y1 + Y2 ± 180
= -30 + 195 - (-90) ± 180
= 75 deg
But we assigned a CDC of 02RPEW3, which has a default PDOF of 60
degrees. Our calculation above shows that to satisfy Newton’s 3rd law, we
must change the PDOF to 75 degrees. In this event, the PDOFs are not
opposite. Therefore, we will edit the PDOF:
â In the PDOF field, replace 60 with 75.
â Click Apply to accept the change.
If you click on Use Newton’s 3rd Law, EDCRASH
+ NOTE:
will make this calculation for you automatically!
5 - 25
EDCRASH
Creating the Event
Due to the effect of the energy magnification factor, the above change to the
PDOF will change the peak force calculated for the Nissan Sentra. The peak
force is now 658,684 N for the Nissan Sentra. By comparing this force with the
peak force on the Ford Escort, 726,647 N, we find the difference is acceptable,
so we are finished setting up the event.
â Press OK to accept the assigned damage profile.
Before we execute the event, let’s set up the Key Results windows:
â If Key Results windows are not displayed, choose Show Key
Results from the Options menu.
â Drag the Key Results windows to a convenient location, where
they do not block the view but still allow us access to the
viewer thumb wheel controls (in case we want to change the
view).
Now we’re ready to execute the event. The viewer should appear as shown in
Figure 5-13. Take a moment to set the view using the viewer controls or Set
Camera dialog.
Now, let’s execute the EDCRASH event.
â Using the Event Controller, press Play to execute the event.
Although nothing appears to happen (i.e., the vehicles don’t move), the event
has been executed. Unlike simulation calculations, which are repetitive,
reconstruction calculations are executed only once, and thus, happen very
quickly.
You may confirm that execution has occurred by
+ NOTE:
checking the results in your Key Results windows.
We have now completed the event.
5 - 26
Figure 5-13 EDCRASH Tutorial event after execution. The Key Results windows show the
pre-impact speeds, delta-Vs, and other key information from the analysis.
5 - 27
TUTORIAL
Tutorial
EDCRASH
Viewing Results
Viewing Results
Now that we have produced our EDCRASH simulations, let’s take a detailed
look at the results. The Playback Editor is used for reviewing and printing
reports for each event in the current case, as well as for producing video output.
EDCRASH produces the following reports:
• Accident History - A table of user-entered positions and their
respective (calculated) velocities
• Damage Data - A table of damage profile coordinates, CDC, PDOF
and Delta-V for each vehicle
• Damage Profiles - A plan view of the vehicles showing their damage
profiles (damage width, depth and midpoint offset)
• Event Data - A table of scene data (positions, orientations and
velocities)
• Messages - A list of messages produced by the current run
• Momentum Diagrams (Scene and Damage) - A vector diagram
showing the pre-impact and post-impact momentum vectors for each
vehicle. The scene-based diagram uses impact velocity calculated from
the momentum-based delta-V; the damage-based diagram uses the
impact velocity calculated from the damage-based delta-V.
• Program Data - A table containing program control information
• Site Drawing - A static perspective view of the accident site showing
the vehicles at their user-entered positions
• Vehicle Data - A series of tables containing the vehicle data used by
EDCRASH
To view the output reports, we need to be in Playback mode:
â Choose Playback Mode. The Playback Editor is displayed.
5 - 28
Viewing Results
Tutorial
Report Windows
TUTORIAL
The reports listed on the previous page are displayed by selecting Preview
Windows. Each Report Window contains an individual report.
Figure 5-14 Report Window Information
dialog, showing the name of the event(s) in
the current case.
To view the reports produced by the EDCRASH, Visibility Study event,
perform the following steps:
â Click Add New Object. The Report Window Information
dialog is displayed, as shown in Figure 5-14, and includes a list
of the active events (EDCRASH, Visibility Study is the only
event in this tutorial). The Report Window Information dialog
also includes the user-editable Report Window Name text field
and Selected Output option list.
â Select EDCRASH, Visibility Study from the Active Events list.
â Click on the Selected Output option list and choose any of the
available reports.
â Press OK to display the report.
The selected report will be displayed in a resizable window. The following
pages illustrate the reports produced for the EDCRASH, Visibility Study event.
5 - 29
EDCRASH
Viewing Results
Accident History
The EDCRASH Accident History report is the primary output from
EDCRASH. This report summarizes the key results for each vehicle,
including impact velocity, delta-V for each available calculation method
(Damage and Linear Momentum), separation velocity and relative velocity at
impact.
Figure 5-15 Accident History Report for EDCRASH, Visibility Study event.
To view the Accident History report for the EDCRASH, Visibility Study event,
perform the following steps:
â Click Add New Object. The Report Window Information
dialog is displayed.
â Select EDCRASH, Visibility Study from the Active Events list.
â Click on the Selected Output option list and choose Accident
History.
â Press OK.
The Accident History report is displayed for the EDCRASH, Visibility Study
event, as shown in Figure 5-15.
5 - 30
Viewing Results
Tutorial
Damage Data
TUTORIAL
The Damage Data report provides the user-entered damage profile and other
event-related damage data for the current EDCRASH event.
Figure 5-16 Damage Data Report for EDCRASH, Visibility Study event.
To view the Damage Data report for the EDCRASH, Visibility Study event,
perform the following steps:
â Click Add New Object. The Report Window Information
dialog is displayed.
â Select EDCRASH, Visibility Study from the Active Events
list.
â Click on the Selected Output option list and choose Damage
Data.
â Press OK.
A portion of the Damage Data report is displayed for EDCRASH, Visibility
Study is shown in Figure 5-16.
5 - 31
EDCRASH
Viewing Results
Damage Profiles
The Damage Profiles report provides a visual representation of the
user-entered damage profile and PDOF for the current EDCRASH event.
Figure 5-17 Damage Profiles Report for EDCRASH, Visibility Study event.
Let’s display the Damage Profiles report for this event. To view the Damage
Profiles report for the EDCRASH, Visibility Study event, perform the
following steps:
â Click Add New Object. The Report Window Information
dialog is displayed.
â Select EDCRASH, Visibility Study from the Active Events list.
â Click on the Selected Output option list and choose Damage
Profiles.
â Press OK.
The Damage Profiles report is displayed for the EDCRASH, Visibility Study
event (see Figure 5-17).
5 - 32
Viewing Results
Tutorial
Event Data
TUTORIAL
The EDCRASH Event Data report includes all the scene data used for the
current EDCRASH event. This scene data also provides the total amount and
direction of rotation (clockwise vs counter-clockwise).
Figure 5-18 Event Data Report for EDCRASH, Visibility Study event.
To view the Event Data report for the EDCRASH, Visibility Study event,
perform the following steps:
â Click Add New Object. The Report Window Information
dialog is displayed.
â Select EDCRASH, Visibility Study from the Active Events list.
â Click on the Selected Output option list and choose Event
Data.
â Press OK.
The Event Data report is displayed for the EDCRASH, Visibility Study event,
as shown in Figure 5-18.
5 - 33
EDCRASH
Viewing Results
Messages
The Messages report produced by EDCRASH is one of its most important
reports. While simulation programs typically produce very few messages, a
reconstruction program has the opportunity to evaluate the consistency of the
user-entered scene and damage measurements. Careful review of these
messages may show inconsistencies; correcting these inconsistencies may
lead to improved results.
Figure 5-19 Messages Report for EDCRASH, Visibility Study event.
To view the Message report produced by the EDCRASH, Visibility Study
event, perform the following steps:
â Click Add New Object. The Report Window Information
dialog is displayed.
â Select EDCRASH, Visibility Study from the Active Events list.
â Click on the Selected Output option list and choose Messages.
â Press OK.
The Messages report is displayed for the EDCRASH, Visibility Study event, as
shown in Figure 5-19.
5 - 34
Viewing Results
Tutorial
TUTORIAL
Momentum Diagrams
Figure 5-20 Momentum Diagram Report for EDCRASH, Visibility Study event.
Let’s display a Momentum Diagram report for this event. To view the
Momentum Diagram, Scene Data, report for the EDCRASH, Visibility Study
event, perform the following steps:
â Click Add New Object. The Report Window Information
dialog is displayed.
â Select EDCRASH, Visibility Study from the Active Events list.
â Click on the Selected Output option list and choose Momentum
Diagram, Scene.
â Press OK.
The Momentum Diagram report based on the scene data is displayed for the
EDCRASH, Visibility Study event (see Figure 5-20).
5 - 35
EDCRASH
Viewing Results
Program Data
The EDCRASH Program Data report lists the physics program, in this case
EDCRASH, and physics program version number. It also contains parameters
used when the Trajectory Simulation option is selected and consistency checks
within EDCRASH.
Figure 5-21 Program Data Report for EDCRASH, Visibility Study event.
To view the Program Data report for the EDCRASH, Visibility Study event,
perform the following steps:
â Click Add New Object. The Report Window Information
dialog is displayed.
â Select EDCRASH, Visibility Study from the Active Events list.
â Click on the Selected Output option list and choose Program
Data.
â Press OK.
The Program Data report is displayed for the EDCRASH, Visibility Study
event, as shown in Figure 5-21.
5 - 36
Viewing Results
Tutorial
Site Drawing
TUTORIAL
The Site Drawing is a static display of the event with the vehicles at their
user-entered path positions (Begin Braking, Impact, Point-on-curve,
End-of-rotation and Rest).
Figure 5-22 Site Drawing Report for EDCRASH, Visibility Study event showing both vehicles
at each user-entered position.
Let’s display a Site Drawing for this event. To view the Site Drawing, perform
the following steps:
â Click Add New Object. The Report Window Information
dialog is displayed.
â Select EDCRASH, Visibility Study from the Active Events list.
â Click on the Selected Output option list and choose Site
Drawing.
â Press OK.
The Site Drawing viewer is displayed for the EDCRASH, Visibility Study event
(see Figure 5-22). The vehicles are shown at each user-entered position.
5 - 37
EDCRASH
Viewing Results
Vehicle Data
The Vehicle Data report provides the physical data used by EDCRASH,
including dimensions, inertias, tire properties, wheel lock-ups and stiffness
coefficients.
Figure 5-23 Vehicle Data Report for EDCRASH, Visibility Study event.
5 - 38
Viewing Results
Tutorial
To view the Vehicle Data report for the EDCRASH, Visibility Study event,
perform the following steps:
â Click Add New Object. The Report Window Information
dialog is displayed.
â Select EDCRASH, Visibility Study from the Active Events
list.
â Click on the Selected Output option list and choose Vehicle
Data.
â Press OK.
A portion of the Vehicle Data report is displayed for EDCRASH, Visibility
Study is shown in Figure 5-23.
The Vehicle Data and several other reports
+ NOTE:
contain more information than fits into the default window
TUTORIAL
size. Use the scroll bars or resize the dialog to view the
entire report.
5 - 39
EDCRASH
Viewing Results
Printing
The final step is to print the above reports. Printing reports is simple. All you do
is choose a report and print it. For example:
â Click on the dialog header of the Accident History EDCRASH, Visibility Study report. Your selection is
highlighted and the Accident History window pops to the top
of the display (if it isn’t there already), indicating it is the
current window.
â Click on the File menu and choose Print. The Print dialog is
displayed, allowing the user to select from several available
print options.
Alternatively, you can click on the print icon in the
+ NOTE:
upper menu bar.
â Press OK. The Accident History output report is printed on the
system printer.
That’s all there is to it! You can print any other report using the same two steps
described above.
The Print dialog provides several options. Refer to
+ NOTE:
your Windows or printer manual for more information.
For several reports it may be best to print in
+ NOTE:
landscape rather than portrait mode.
The font size of both the printed reports and
+ NOTE:
screen display may be edited by clicking on the Options
menu and choosing Preferences. Use the Font Size
option list to change the size.
5 - 40