1
INTREPID User Manual
Library | Help | Top
Including datasets in a map composition (T45b)
1
| Back |
Including datasets in a map composition (T45b)
Top
Map Composition can display INTREPID datasets in a wide variety of formats.
You can include grid datasets as grey scale, pseudocolour, sun angle image, false
(three band) colour, intensity drape with pseudocolour or three band colour, contours,
colour contours.
You can include point and polygon (region of interest) datasets.
You can include a line dataset as a simple path plot or incorporate a stack profile.
Creating data boxes
Map Composition places datasets in a data box. A data box covers a geographic
region (usually defined by the datasets it contains). You can overlay several datasets
which cover the same region in a data box. INTREPID automatically aligns these
datasets geographically so that they can give a correctly located composite picture.
You can edit the extent, size, and scale of a data box, divide it into sheets and, in some
cases, change its projection and datum. See Specifying extent, scale, data box size
and sheets division in this chapter for details.
You can have a number of data boxes in your composition. Each data box is
geographically independent of the others.
The first data box that you create is always the one to which scale bars, North arrows
and sheet indexes refer.
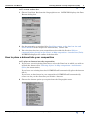
>> To create the first data box automatically
If you haven't already created a data box, you can simply include a dataset as
described in Section How to place a dataset into your composition. When you do this,
INTREPID will automatically create a Data box for you.
INTREPID will automatically set the size, scale and extents for the data box from
this dataset. If you add further datasets INTREPID may automatically adjust the
data box properties.
You can edit the properties of the data box as described in Section Specifying extent,
scale, data box size and sheets division in this chapter.
As long as you have only one Data box, INTREPID will automatically add further
datasets you specify to this data box.
Library | Help | Top
© 2012 Intrepid Geophysics
| Back |
INTREPID User Manual
Library | Help | Top
Including datasets in a map composition (T45b)
2
| Back |
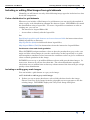
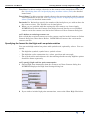
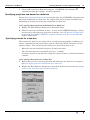
>> To create a data box
1
Choose New Data Box from the Geographic menu. INTREPID displays the Data
Extents dialog box.
2
Set the properties as required (See Specifying extent, scale, data box size and
sheets division in this chapter for instructions). Choose OK.
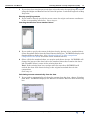
3
Place the data box into your composition as described in Section "Objects
composed before placing on the screen" in Map composition—introduction (T45a).
INTREPID displays the outline of the data box.
How to place a dataset into your composition
>> To place a dataset into the composition
1
If you have several existing Data boxes, select the Data box in which you wish to
include the dataset (See "Selecting objects" in Map composition—introduction
(T45a) for instructions).
If you have one existing data box, INTREPID will automatically place the dataset
into it.
If you have no data boxes in your composition, INTREPID will automatically
create one for you the first time you include a dataset.
2
Library | Help | Top
Choose the dataset option you require from the Geographic menu.
© 2012 Intrepid Geophysics
| Back |
INTREPID User Manual
Library | Help | Top
Including datasets in a map composition (T45b)
3
| Back |
INTREPID displays the dialog box corresponding to the type of dataset and
required format.
3
Complete the dialog box according to your requirements.
4
If there is no existing data box for the dataset, INTREPID will create one. Place it
on the screen as described in Section "Objects composed before placing on the
screen" in Map composition—introduction (T45a).
5
INTREPID will open the dataset and display its data in the data box.
Preparing to edit properties of an existing dataset display
>> To prepare to edit an existing dataset display
1
Select the data box containing the dataset display. See "Selecting objects" in Map
composition—introduction (T45a) for instructions.
2
Display the dialog box for the dataset display. See "Editing properties of selected
objects" in Map composition—introduction (T45a) for instructions.
Data box projection and datum
A data box must necessarily have a single projection and datum for all datasets it
contains.
Map Composition can convert the projection and datum of a vector dataset 'on the fly',
but not that of a grid dataset. It follows that
•
If there is a grid dataset present, it will determine the projection and datum of the
data box.
•
All grid datasets in a data box must have the same projection and datum.
The first dataset placed into a data box determines its projection and datum. We
therefore suggest that you load grid datasets first.
If you place a vector dataset into a data box that already has a projection and datum,
Library | Help | Top
© 2012 Intrepid Geophysics
| Back |
INTREPID User Manual
Library | Help | Top
Including datasets in a map composition (T45b)
4
| Back |
INTREPID will automatically convert the projection of the vector dataset to match
that of the data box if necessary.
If you place a grid dataset into a data box that has a different projection, INTREPID
will not be able to display the grid properly. If this happens, you can change the
projection and datum of the data box to match the grid (see next paragraph).
Alternatively, if you wish to change a grid dataset's projection, use the Projection
Conversion tool to change the projection before loading it into the Map Composition
tool (See Old Datum and Projection Conversion (T12) and INTREPID direct access,
import and export formats (R11) for further information).
You can specify a new projection for a data box using the Data Extents dialog box.
INTREPID will automatically convert the projection of vector datasets in the data
box. See Specifying projection and datum for a data box in this chapter for
instructions.
Rotated datasets
Some datasets you are placing in a data box may have different rotations. (See
"Rotating a grid" in Grid Operations (T25) for a discussion of rotated datasets.)
By directly editing your MAPCOMP file you can align all datasets in a data box so
that the North–South direction is vertical or at some other angle. If you wish to do
this, edit the Rotate = statement in the MapProjection block of the data box
definition block Data Begin – Data End. See "Details of MAPCOMP language
structure" in MAPCOMP Map Specification Language (R20) for further information.
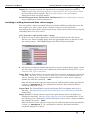
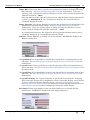
Specifying datasets and fields
The following table contains a list of the types of INTREPID data you may include in
a composition. The table also contains corresponding marker file extensions for
Windows version users.
In particular, note that if you are selecting a whole vector dataset, you must select it
from outside its directory, but if selecting a field, you must choose it from inside its
directory.
Item
Extension
Grid (image) datasets
..GRID
Vector (line, point, polygon) datasets (outside dataset directory)
..DIR
Fields of vector datasets (inside dataset directory)
..LINE
..PNT
..POLY
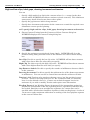
When you choose an item from the Geographic menu to include a dataset, or edit the
properties of a dataset already present in a data box, INTREPID displays the
corresponding dialog box. You can use this dialog box to specify datasets or dataset
fields for the data box.
Library | Help | Top
© 2012 Intrepid Geophysics
| Back |
INTREPID User Manual
Library | Help | Top
Including datasets in a map composition (T45b)
5
| Back |
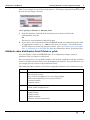
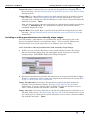
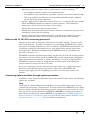
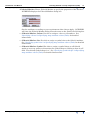
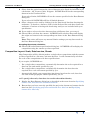
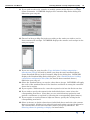
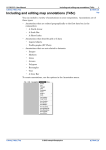
Here is an example of one of these dialog boxes. The Image command button and text
box are for specifying a dataset.
>> To specify a dataset or dataset field
1
Type the filename and full path of the dataset or dataset field in the
corresponding text box
OR
Choose the corresponding command button.
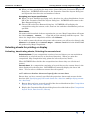
2
If you choose the command button INTREPID displays an Open dialog box with
an appropriate mask (e.g., *..PNT) for the data you require. Use the directory
and file selector to locate the dataset or field. (See "Specifying input and output
files" in Introduction to INTREPID (R02) for information about specifying files).
Attribute value distribution from Z fields or grids
You can display values of INTREPID data in a composition using a range of
attributes such as colour or symbol size.
For vector datasets, you can link Z fields to any of these attributes and the attribute
values will indicate the Z field values throughout the dataset. For grid datasets you
can assign grid cell values to the attributes listed.
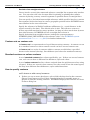
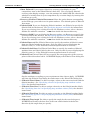
The following table contains a list of the assignable attributes for each dataset type.
Library | Help | Top
Data
Attributes available for showing value
Grid
pseudocolour
grey scale for value
grey scale for brightness in a sun angle display
false colour (intensity of red, green or blue)
contour position
contour colour
Line
colour
stack profile displacement
Point
symbol size
symbol shape
symbol colour
symbol rotation
numeric marker annotation
© 2012 Intrepid Geophysics
| Back |
INTREPID User Manual
Library | Help | Top
Including datasets in a map composition (T45b)
6
| Back |
Use of legends to distribute attribute values
You can specify how INTREPID should distribute the attribute values over the range
of values using a legend.
A legend is a set of specifications linking a set of data with a set of attribute values
and governing the assignment of the attribute values to value ranges in the data.
INTREPID stores legends in text files with the extension .leg.
INTREPID has a Legend Editor for creating and editing legends. Using the Legend
Editor you can
•
Load, save and create new legends
•
Specify the number of levels to which INTREPID will assign data (i.e., number of
colours, shades, sizes or shapes).
•
Specify the method of assigning the values to the colours etc.
You can also directly edit legend files using a text editor.
See Map legend files (R23) for details about legend files and Map Legend Editor
(T45f) for interactive legend editing instructions.
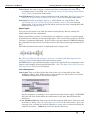
Specifying legends for grid datasets and vector dataset fields
When you choose an item from the Geographic menu to include a dataset, or edit the
properties of a dataset already present in a data box, INTREPID displays the
corresponding dialog box. You can use this dialog box to specify legend files for the
datasets or dataset fields.
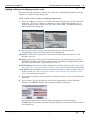
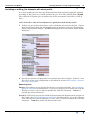
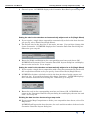
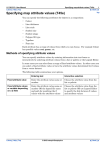
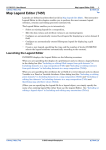
Here is an example of one of these dialog boxes. The Legend command button and
text box are for specifying a legend file.
>> To specify a legend file
1
Type the filename and full path of the legend file in the corresponding text box.
OR
Choose the corresponding Legend command button.
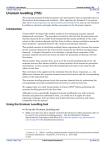
2
Library | Help | Top
If you choose the button INTREPID displays the Legend Editor Window. See Map
Legend Editor (T45f) for interactive legend editing instructions.
© 2012 Intrepid Geophysics
| Back |
INTREPID User Manual
Library | Help | Top
Including datasets in a map composition (T45b)
7
| Back |
Automatic recalculation of legend files
INTREPID automatically recalculates some legends when printing or displaying a
composition.
Specifically, it will recalculate Histogram legends, normally associated with grid
datasets, and dynamic range Level legends.
Whenever the Map Composition or Print Map tools display or redisplay data from one
or more grid datasets (or vector datasets with dynamic range Level legends) on the
screen or print the composition, after:
•
Initial placement,
•
Editing properties,
•
Loading the MAPCOMP file specifying the dataset,
•
Displaying a print preview,
•
Printing the composition,
INTREPID will
•
Recalculate and save new copies of any associated Histogram legend files;
•
Calculate cutoff values for any associated dynamic range Level legends.
See Map legend files (R23) for details about legend files.
Specifying attribute values for datasets
Fixed attributes
Depending on the nature of the data you are including in your composition you may
need to specify one or more fixed attributes for the data. For example if you are
including a line dataset, you need to specify the thickness of the flight path lines.
In each case you can type the name, number or code of the attribute value or choose
the corresponding command button.
If you choose the command button INTREPID displays a Fixed Attribute Value dialog
box with a pallette or list of attribute values (e.g., a range of different line
thicknesses). Select the attribute value you require, then OK. (See Specifying map
attribute values (T45e) for a full description of attributes and attribute values
available).
Fixed attributes with a Variable option
When specifying some attributes you have a choice of a fixed attribute value for the
composition or attribute values depending on the value of some corresponding data.
For example, if you are including a line dataset, you can specify a fixed colour for the
flight paths or that their colour will vary according to the value of a Z field.
In this case the Fixed or Variable Attribute Value dialog box has a Variable option. If
you choose Variable you will need to specify the name of the field that you wish to use.
INTREPID displays the Legend Editor. You can use this to specify the Z field and the
attribute value distribution method. (See Specifying map attribute values (T45e) for
a full description of attributes and attribute values available and Map Legend Editor
(T45f) for full Legend Editor instructions.)
Library | Help | Top
© 2012 Intrepid Geophysics
| Back |
INTREPID User Manual
Library | Help | Top
Including datasets in a map composition (T45b)
8
| Back |
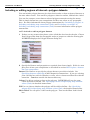
Including or editing filled images from grid datasets
Normally you will choose one only of the following image types for inclusion in a data
box in the composition.
Colour distribution for grid datasets
Whenever you include a filled image of a grid dataset you can specify the method of
colour or grey scale distribution amongst the dataset values. INTREPID will control
the distribution using a legend file. To create a legend file or nominate or edit an
existing one, you can use
•
The interactive Legend Editor OR
•
A text editor to directly edit the legend file.
See:
Specifying legends for grid datasets and vector dataset fields for instructions about
linking legend files to datasets,
Map legend files (R23) for full details about legend files,
Map Legend Editor (T45f) for instructions about the interactive Legend Editor.
Continuous colour and shade gradation
When INTREPID assigns attribute values to data for pseudocolour, grey scale, sun
angle and false colour images it uses the cutoff values in the legend only as a guide
and interpolates attribute values between the cutoff data values to give a continuous
colour or shade gradation in the image.
INTREPID can use up to 16 million different colours with pseudocolour images. In
most cases, however it will use less than 200. The colour distribution statistics
calculation uses 16 million bins so that any enhancement of the data will give a high
quality colour distribution.
Including or editing grey scale images
You can include a grid dataset as a grey scale image.
>> To include or edit a grey scale image
1
Library | Help | Top
If there are two or more data boxes, select (click) the data box for the image.
Choose New Grey Scale Image from the geographic menu or prepare to edit the
existing image. INTREPID displays the Grey Scale Image dialog box.
© 2012 Intrepid Geophysics
| Back |
INTREPID User Manual
Library | Help | Top
2
Including datasets in a map composition (T45b)
9
| Back |
Specify the grid dataset and legend as required, then choose Apply. If this is a
new image, place it into your composition as described in Section How to place a
dataset into your composition.
Image Use Image to specify the grid dataset for inclusion as a grey scale image. See
Specifying datasets and fields for instructions. If you are selecting from a dialog
box with the Windows version, select a dataset marker file with the extension
..GRID.
Legend Use Legend to specify the legend file for assigning data to grey shades. See
Specifying legends for grid datasets and vector dataset fields for instructions.
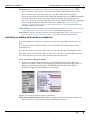
Including or editing pseudocolour images
You can include a grid dataset as a pseudocolour image. INTREPID normally
distributes the colours in a pseudocolour image statistically (using a histogram). If
you wish to manually set cutoff values for each colour, we suggest you use a Fixed
Colour image instead (See Including or editing fixed colour images for further
information).
>> To include or edit a pseudocolour image
1
If there are two or more data boxes, select (click) the data box for the image.
Choose New PseudoColour Image from the geographic menu or prepare to edit the
existing image. INTREPID displays the Pseudocolour Image dialog box.
2
Specify the grid dataset and legend as required, then choose Apply. If this is a
new image, place it into your composition as described in section How to place a
dataset into your composition.
Image Use Image to specify the grid dataset for inclusion as a pseudocolour image.
See Specifying datasets and fields for instructions. If you are selecting from a
dialog box with the Windows version, select a dataset marker file with the
extension ..GRID.
Legend Use Legend to specify the legend file for assigning data to colours. See
Specifying legends for grid datasets and vector dataset fields for instructions.
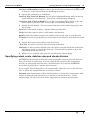
Including or editing fixed colour images
You can include a grid dataset as a fixed colour image.
INTREPID normally distributes the colours in a fixed colour image using a cutoff
value for each colour. If you wish to distribute the colours statistically (using a
histogram), we suggest you use a Pseudocolour image instead (See Including or
editing pseudocolour images for further information).
Library | Help | Top
© 2012 Intrepid Geophysics
| Back |
INTREPID User Manual
Library | Help | Top
Including datasets in a map composition (T45b)
10
| Back |
>> To include or edit a fixed colour image
1
If there are two or more data boxes, select (click) the data box for the image.
Choose New Fixed Colour Image from the geographic menu or prepare to edit the
existing image. INTREPID displays the Fixed Colour Image dialog box.
2
Specify the grid dataset and legend as required, then choose Apply. If this is a
new image, place it into your composition as described in section How to place a
dataset into your composition.
Image Use Image to specify the grid dataset for inclusion as a fixed colour image.
See Specifying datasets and fields for instructions. If you are selecting from a
dialog box with the Windows version, select a dataset marker file with the
extension ..GRID.
Legend Use Legend to specify the legend file for assigning data to colours. See
Specifying legends for grid datasets and vector dataset fields for instructions.
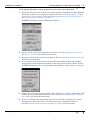
Including or editing sun angle images
You can include a grid dataset as a sun angle image.
>> To include or edit a sun angle image
1
If there are two or more data boxes, select (click) the data box for the image.
Choose New Sun Angle Image from the geographic menu or prepare to edit the
existing image.
INTREPID displays the Sun Angle dialog box.
2
Specify the grid dataset, legend and parameters as required, then choose Apply.
If this is a new image, place it into your composition as described in section How
to place a dataset into your composition.
Image Use Image to specify the grid dataset for inclusion as a sun angle image. See
Specifying datasets and fields for instructions. If you are selecting from a dialog
box with the Windows version, select a dataset marker file with the extension
..GRID.
Library | Help | Top
© 2012 Intrepid Geophysics
| Back |
INTREPID User Manual
Library | Help | Top
Including datasets in a map composition (T45b)
11
| Back |
Legend Use Legend to specify the legend file for assigning brightness values to
shades of grey. See Specifying legends for grid datasets and vector dataset fields
for instructions about legends. See Sun angle display concepts for more
information about sun angle display.
Vertical Exaggeration, Declination, Inclination See Sun angle display concepts
for an explanation of these parameters.
Including or editing three band false colour images
You can include a three-band grid dataset (or bands of different grids that cover the
same region) as a 'false colour' image, with the colours red, green and blue
representing the three bands of data respectively. Each band can have its own legend
controlling the levels of its colour.
>> To include or edit a false colour image
1
If there are two or more data boxes, select (click) the data box for the image.
Choose New Three Gun Mix Image from the geographic menu or prepare to edit
the existing image. INTREPID displays the False Colour dialog box.
2
Specify the grid dataset bands and legends as required, then choose Apply. If this
is a new image, place it into your composition as described in section How to place
a dataset into your composition.
Image Red Use Image Red to specify the grid dataset band to be displayed using red
intensity. See How to place a dataset into your composition for instructions. If
you are selecting from a dialog box with the Windows version, select a dataset
marker file with the extension ..GRID.
After the dataset name appears in the text box, add the band number preceded by
a colon e.g., mbandgrid:0. In a radiometrics dataset, the potassium band is
commonly displayed in red.
Legend Red Use Legend Red to specify the legend file for assigning data to red
intensity. See Specifying legends for grid datasets and vector dataset fields for
instructions.
Image Green Use Image Green to specify the grid dataset band to be displayed
using green intensity. See Specifying datasets and fields for instructions. If you
are selecting from a dialog box with the Windows version, select a dataset marker
file with the extension ..GRID.
After the dataset name appears in the text box, add the band number preceded by
a colon e.g., mbandgrid:1. In a radiometrics dataset, the thorium band is
commonly displayed in green.
Library | Help | Top
© 2012 Intrepid Geophysics
| Back |
INTREPID User Manual
Library | Help | Top
Including datasets in a map composition (T45b)
12
| Back |
Legend Green Use Legend Green to specify the legend file for assigning data to
green intensity. See Specifying legends for grid datasets and vector dataset fields
for instructions.
Image Blue Use Image Blue to specify the grid dataset band to be displayed using
blue intensity. See Specifying datasets and fields for instructions. If you are
selecting from a dialog box with the Windows version, select a dataset marker file
with the extension ..GRID.
After the dataset name appears in the text box, add the band number preceded by
a colon e.g., mbandgrid:2. In a radiometrics dataset, the uranium band is
commonly displayed in blue.
Legend Blue Use Legend Blue to specify the legend file for assigning data to blue
intensity. See Specifying legends for grid datasets and vector dataset fields for
instructions.
Including or editing pseudocolour plus intensity drape images
You can include a grid dataset as a pseudocolour image, then specify the same
dataset or another dataset as an intensity drape. You can specify whether the
intensity drape uses a sun angle effect or is simply a grey scale image.
>> To include or edit a pseudocolour with intensity drape image
1
If there are two or more data boxes, select (click) the data box for the image.
Choose New Drape Image from the geographic menu or prepare to edit the
existing image. INTREPID displays the Drape dialog box.
2
Specify the grid datasets, legends and parameters as required, then choose Apply.
If this is a new image, place it into your composition as described in section How
to place a dataset into your composition.
Image Pseudocolour Use Image Pseudocolour to specify the grid dataset for
inclusion as a pseudocolour image. See Specifying datasets and fields for
instructions. If you are selecting from a dialog box with the Windows version,
select a dataset marker file with the extension ..GRID.
Image Intensity Use Image Intensity to specify the grid dataset for inclusion as an
intensity drape image. See Specifying datasets and fields for instructions. If you
are selecting from a dialog box with the Windows version, select a dataset marker
file with the extension ..GRID.
Library | Help | Top
© 2012 Intrepid Geophysics
| Back |
INTREPID User Manual
Library | Help | Top
Including datasets in a map composition (T45b)
13
| Back |
Enhance Choose Enhance to modify any of the legends. INTREPID displays the
Enhance dialog box.
—Legend Pseudocolour Use Legend Pseudocolour to specify the legend file for
assigning data to colour. See Specifying legends for grid datasets and vector
dataset fields for instructions.
—Legend Intensity Use Legend Intensity to specify the legend file for assigning
data (sun angle display off) or brightness values (sun angle display on) to shades
of grey. See Specifying legends for grid datasets and vector dataset fields for
instructions about legends and Section Sun angle display concepts for more
information about sun angle display.
Choose Apply. INTREPID will close the Enhance dialog box and return to the
Drape dialog box.
(Saturation Factor) You can specify this parameter by editing the MAPCOMP file
of your composition. The saturation factor determines colour saturation
('richness') and can range between 0 and 1. The default value is 1, resulting in full
colour saturation. Values less than 1 will result in more pastel colours. You can
vary saturation factor to produce a 'metallic' look in your composition. See
"Details of MAPCOMP language structure" in MAPCOMP Map Specification
Language (R20) for the correct syntax.
(Transparency) You can specify this parameter by editing the MAPCOMP file of
your composition. Transparency is a cutoff level for high intensity data values,
ranging from 0 to 1. INTREPID examines the range of the intensity data and
calculates an intensity value between 0 and 1 for each cell. If the intensity value
exceeds the Transparency, INTREPID will not display it. The default value is 1
(full display of the intensity data). See "Details of MAPCOMP language
structure" in MAPCOMP Map Specification Language (R20)for the correct syntax.
Sun Angle Choose Sun Angle to turn sun angle display on or off and edit the
parameters. INTREPID displays the Sun Angle dialog box.
Set the parameters as required , then choose Apply. INTREPID will close the Sun
Angle dialog box and return to the Drape dialog box.
On Turn this check box on to enable sun angle display and off if you require a direct
relationship between dataset values and intensity
Library | Help | Top
© 2012 Intrepid Geophysics
| Back |
INTREPID User Manual
Library | Help | Top
Including datasets in a map composition (T45b)
14
| Back |
Vertical Exaggeration, Inclination, Declination See Sun angle display concepts
for an explanation of these parameters.
Choose Apply. INTREPID will close the Sun Angle dialog box and return to the
Drape dialog box.
Including or editing three band false colour plus intensity drape images
You can include bands from one or more grid datasets as a false colour image, then
specify a dataset band as a monochrome intensity drape. You can specify whether the
monochrome intensity drape uses a sun angle effect or is simply a grey scale image.
>> To include or edit a false colour with intensity drape image
1
If there are two or more data boxes, select (click) the data box for the image.
Choose New Ternary Drape Image from the geographic menu or prepare to edit
the existing image. INTREPID displays the Ternary Drape dialog box.
2
Specify the grid dataset bands, legends and parameters as required, then choose
Apply. If this is a new image, place it into your composition as described in
section How to place a dataset into your composition.
Image Red Use Image Red to specify the grid dataset band to be displayed using red
intensity. See Specifying datasets and fields for instructions. If you are selecting
from a dialog box with the Windows version, select a dataset marker file with the
extension ..GRID.
After the dataset name appears in the text box, add the band number preceded by
a colon e.g., mbandgrid:0. In a radiometrics dataset, the potassium band is
commonly displayed in red.
Image Green Use Image Green to specify the grid dataset band to be displayed
using green intensity. See Specifying datasets and fields for instructions. If you
are selecting from a dialog box with the Windows version, select a dataset marker
file with the extension ..GRID.
After the dataset name appears in the text box, add the band number preceded by
a colon e.g., mbandgrid:1. In a radiometrics dataset, the thorium band is
commonly displayed in green.
Library | Help | Top
© 2012 Intrepid Geophysics
| Back |
INTREPID User Manual
Library | Help | Top
Including datasets in a map composition (T45b)
15
| Back |
Image Blue Use Image Blue to specify the grid dataset band to be displayed using
blue intensity. See Specifying datasets and fields for instructions. If you are
selecting from a dialog box with the Windows version, select a dataset marker file
with the extension ..GRID.
After the dataset name appears in the text box, add the band number preceded by
a colon e.g., mbandgrid:2. In a radiometrics dataset, the uranium band is
commonly displayed in blue.
Image Intensity Use Image Intensity to specify the grid dataset for inclusion as the
monochrome intensity drape image. See Specifying datasets and fields for
instructions. If you are selecting from a dialog box with the Windows version,
select a dataset marker file with the extension ..GRID.
In a radiometrics dataset, the magnetic data or gamma radiation total count is
commonly displayed as a monochrome intensity drape.
Enhance Choose Enhance to modify any of the legends. INTREPID displays the
Enhance dialog box.
—Legend Red Use Legend Red to specify the legend file for assigning data to red
intensity. See Specifying legends for grid datasets and vector dataset fields for
instructions.
—Legend Green Use Legend Green to specify the legend file for assigning data to
green intensity. See Specifying legends for grid datasets and vector dataset fields
for instructions.
—Legend Blue Use Legend Blue to specify the legend file for assigning data to blue
intensity. See Specifying legends for grid datasets and vector dataset fields for
instructions.
—Legend Intensity Use Legend Intensity to specify the legend file for assigning
data (sun angle display off) or brightness values (sun angle display on) to shades
of grey in the monochrome intensity drape. See Specifying legends for grid
datasets and vector dataset fields for instructions about legends and Section Sun
angle display concepts for more information about sun angle display.
Sun Angle Choose Sun Angle to turn sun angle display on or off and edit the
parameters. INTREPID displays the Sun Angle dialog box.
Library | Help | Top
© 2012 Intrepid Geophysics
| Back |
INTREPID User Manual
Library | Help | Top
Including datasets in a map composition (T45b)
16
| Back |
Set the parameters as required, then choose Apply. INTREPID will close the Sun
Angle dialog box and return to the Ternary Drape dialog box.
On Turn this check box on to enable sun angle display and off if you require a direct
relationship between dataset values and intensity
Vertical Exaggeration, Inclination, Declination See Sun angle display concepts
for an explanation of these parameters.
Sun angle display concepts
Sun angle display effect makes the data display appear to have hills and valleys
corresponding to its high and low values. The hills and valleys have light and shade
as if the sun is shining on them. You can control the angle and effect of the 'sun'
using the following parameters.
Vertical exaggeration You can use Vertical Exaggeration to create a greater
contrast in the representation of high and low data values. Enter the required
value into this text box.
Declination You can use Declination to change the direction of the 'sun'. A
declination of 0° means the 'sun' is North of the overhead point. A declination of
90° means that it is East of the overhead point, –90° means that it is West and
±180° means South. Enter the required value into this text box. The Declination
is sometimes known as Azimuth.
Inclination You can use Inclination to move the 'sun' between the horizon and the
overhead point. An inclination of 0°means the 'sun' is on the horizon, and an
inclination of 90°means it is at the overhead point. Enter the required value into
this text box. The Inclination is sometimes known as the Elevation.
Brightness values In order to display a grid dataset in sun angle mode, INTREPID
must take into account your specified sun angle and the gradients of the data in
the direction of this sun angle. For each point it calculates a brightness value,
making up a reflectance map of values between –1 and +1. If the gradient of the
region is perpendicular to the sun's rays, so that the 'sun' is shining directly onto
it, INTREPID will assign the region a high brightness value. If the gradient is
parallel to the sun's rays, then INTREPID will assign a low brightness value.
Legends and sun angle display You can assign and manipulate grey scale shades
for the brightness values using a legend. By applying a histogram or adjusting
cutoff values, you may reveal some subtle but important changes in direction in
the image.
Including or editing contours from grid datasets
You can include a set of contours derived from a grid dataset in a composition. As
part of this process you can
Library | Help | Top
•
Specify the INTREPID grid dataset as the data source for the contours;
•
Specify a legend file which defines colours for colour contours;
•
Have several contour cuts for a dataset each with its own interval, density, line
colour, line thickness, annotation size, annotation colour and annotation
precision;
© 2012 Intrepid Geophysics
| Back |
INTREPID User Manual
Library | Help | Top
•
Including datasets in a map composition (T45b)
17
| Back |
Mark high and/or low points with a symbol and/or a value, specifying
•
For high/low symbols: symbol sizes, symbol colours,
•
For high/low value annotations: precision, text size, text colour and text angle,
•
The search radius and tolerance for determining whether nearby high/low
points should be shown separately;
•
Specify a high and low clip for the contour values (i.e., a range for the data outside
which INTREPID should not continue to draw contours). This eliminates
unnecessary detail of irrelevant data such as spikes;
•
Specify the gap between labels along contours;
•
Specify draw increment and tension for the contours to control the required curve
smoothness versus speed of plotting.
•
Specify a 'distance from straight tolerance' to decrease the number of contour
segments and thus reduce the size of the output file produced for printing.
Notes on the INTREPID contouring processes
Changes in data such as magnetic field data are normally smooth. Contours must
reflect this property. To achieve smoothness in contouring INTREPID uses spline
functions to resample grid data to a finer resolution. INTREPID maintains two sets
of grid data during the contouring process– the original data and the much finer
resampled grid. With this additional data INTREPID resolves all 'saddles' and
prevents crossovers, etc..
INTREPID calculates gradient and position on the sides of each cell of both grids for
all contours. In areas of low gradient INTREPID uses the original grid and applies
spline functions to the contours to achieve smoothness. In areas of high gradient,
INTREPID ensures accuracy by using the fine resolution grid and making the
contours honour exactly all cuts of cell sides.
If you are contouring a dataset with truncated precision (e.g., a grid with integer
precision or that has had integer precision at some time), INTREPID will
automatically apply special resampling procedures to ensure that contours are
smooth.
Contouring options available through system parameters
In addition to the contour composition options described in this section, the following
options are available.
Tiling
Contouring is a demanding process and there may be insufficient memory in your
computer for processing a large dataset. For large datasets INTREPID can use tiling
process, where it divides the dataset into sections and processes one section at a time.
You can use the system parameter INTREPID_MEMORY to specify the number of
grid cells above which you wish INTREPID to use tiling. See "INTREPID Memory
limits and tiling" in Configuring and using INTREPID (R04) and INTREPID system
parameters and install.cfg (R07) for further information.
Library | Help | Top
© 2012 Intrepid Geophysics
| Back |
INTREPID User Manual
Library | Help | Top
Including datasets in a map composition (T45b)
18
| Back |
Deviation from straight tolerance
Curves involve several plot commands whereas a straight line segment only involves
one. You can reduce the size of output files for printing or plotting that contain
contours by having as many contour segments as possible drawn as straight lines.
You can specify a 'deviation from straight tolerance' which specifies how far a contour
line segment can deviate from its correct geographic position before INTREPID must
start another in the correct direction.
Specify the tolerance in World Coordinate millimetres (i.e., actual distance in the
region covered by the data). The default value is 200. This allows a contour to
deviate up to 200 mm from its correct position. As long as it does not deviate by more
than this tolerance, INTREPID will use a straight line to draw it.
Specify deviation from straight tolerance setting the system parameter
INTREPID_MAX_DEVIATION to the tolerance value. See INTREPID system
parameters and install.cfg (R07) for further information.
Contour sets vs contour cuts
A Contour set is a representation of a grid dataset using contours. A contour set can
be a standard contour or colour contour set and can have several contour cuts.
A Contour cut is a series of contours within a contour set which has a specified
dataset value interval (density), line thickness (and colour for standard contours).
Standard contours vs colour contours
A set of standard contours has colours specified by you. If there are several contour
cuts, each cut can have a different line thickness, style and colour.
A set of colour contours has line colours assigned from the grid dataset values using
a legend. If there are several colour contour cuts, they must all use the same legend,
but may have different line thicknesses, styles and annotations.
How to specify contours
>> To insert or edit a set of contours
1
Library | Help | Top
If there are two or more data boxes, select (click) the data box for the contours.
Choose New Contour or New Colour Contour from the Geographic menu or
prepare to edit the existing contours. INTREPID displays the Contour or Colour
Contour dialog box.
© 2012 Intrepid Geophysics
| Back |
INTREPID User Manual
Library | Help | Top
2
Including datasets in a map composition (T45b)
19
| Back |
Specify the INTREPID grid dataset for the contours.
Use Grid to specify the grid dataset for inclusion as a contour set. See Specifying
datasets and fields for instructions. If you are selecting from a dialog box with the
Windows version, select a dataset marker file with the extension ..GRID.
3
If you are specifying colour contours, specify the legend file.
Use Legend to specify the legend file for assigning data to colours. See Specifying
legends for grid datasets and vector dataset fields for instructions.
4
Specify and adjust as necessary the contour cuts you require using Add, Delete
and Edit with the contour cuts list. See Adding, editing and deleting contour cuts
for detailed instructions.
5
Use High Low Annotation to specify high and low annotations for the contours.
See Specifying the format for the High and Low points notation for detailed
instructions.
6
Use Contour Tuning to specify
•
The high and low clips for the contours,
•
The gap between contour labels,
•
The draw increment and tension for the plotting process.
See High and low clips, label gaps, drawing increment and tension for detailed
instructions.
7
Library | Help | Top
When you have specified all settings for the contours, choose Apply in the
Contours or Colour Contours dialog box. Place the dataset into your composition
as described in section How to place a dataset into your composition.
© 2012 Intrepid Geophysics
| Back |
INTREPID User Manual
Library | Help | Top
Including datasets in a map composition (T45b)
20
| Back |
Adding, editing and deleting contour cuts
You can add, edit and delete contour cuts using the corresponding buttons from the
Contour or Colour Contour dialog box.
>> To create a new or edit an existing contour cut
1
If you are adding a contour cut, Choose Add from the Contour or Colour Contour
dialog box. If you are editing an existing set, select (click) the contour cut you
wish to modify (in the contour cuts list), then choose Edit. INTREPID displays
the Contour Cuts dialog box.
2
Specify the interval, density, line thickness and line colour using the
corresponding elements in the Contour Cuts dialog box.
Interval Use Interval to specify the interval (in Z units) between contours. The
default value is 2.
Density Use Density to specify the maximum density (in lines/cm) of the contours.
INTREPID displays fewer lines wherever they would have a higher density than
the value you enter here. The default value is 10.
Line Thickness Use this to assign a thickness to all lines in the cut. See "Specifying
line thickness" in Specifying map attribute values (T45e) for detailed instructions.
Line Colour (Not available for colour contours) Use this to assign a single colour to
all lines in the cut. See "Specifying colours" in Specifying map attribute values
(T45e) for detailed instructions.
3
If you wish to include value annotations along the contours, turn on the Annotate
check box.
4
If you wish to specify the format for the value annotations, choose Annotate
Settings. INTREPID displays the Annotate Settings dialog box.
Specify the format for the contour value annotations and choose Apply.
INTREPID will close the Annotate Settings dialog box and return to the Contour
Cuts dialog box.
Library | Help | Top
© 2012 Intrepid Geophysics
| Back |
INTREPID User Manual
Library | Help | Top
Including datasets in a map composition (T45b)
21
| Back |
Text Size Use this to assign a font size to the contour value annotations in the cut.
See "Specifying font size" in Specifying map attribute values (T45e) for detailed
instructions.
Text Colour Use this to assign a single colour to the text associated with the contour
value annotations in the cut. See "Specifying colours" in Specifying map attribute
values (T45e) for detailed instructions.
Decimals Use Decimals to specify the number of decimal places you wish to show for
the contour values. The default is no decimal places.
5
When you are satisfied with the settings for this contour cut, choose Apply.
INTREPID will close the Contour Cuts dialog box and list the new or modified
contour cut in the contour cuts list in the Contour or Colour Contour dialog box.
>> To delete an existing contour cut
Select (click) the required contour cut in the contour cuts list in the Contour or Colour
Contour dialog box, then choose Delete. INTREPID will remove the cut from the
contour cuts list.
Specifying the format for the High and Low points notation
You can mark high and/or low points with symbols and, optionally, values. You can
specify
•
The high/low symbols, symbol sizes, symbol colours.
•
The high/low value annotation size, colour, precision and text angle.
•
The search radius and tolerance for determining whether nearby high/low points
should be shown separately.
>> To specify high and low point annotation
Library | Help | Top
1
Choose High Low Annotation from the Contour or Colour Contour dialog box.
INTREPID displays the High Low Settings dialog box.
2
If you wish to include high point annotations, turn on the Show High Check box.
© 2012 Intrepid Geophysics
| Back |
INTREPID User Manual
Library | Help | Top
3
Including datasets in a map composition (T45b)
22
| Back |
The default high point symbol is H. If you wish to specify the high point symbol,
symbol size and/or symbol colour, choose Edit High Symbol. INTREPID displays
the High Settings dialog box.
Specify the attributes as required then choose Apply. INTREPID will close the
High Settings dialog box and return to the High Low Settings dialog box.
—Symbol Use Symbol to assign a string or symbol to the high point annotations.
The default is H.
If you type a string into the text box, INTREPID checks to see if it is a valid
<symbol> value (e.g., solidtriangle) (See "Symbol shape" in Available map
attribute values (R22)). If it is a valid <symbol>, INTREPID will use the
corresponding symbol for the high point. Otherwise INTREPID displays the
string exactly as you entered it.
If you choose the Symbol button, displays a symbol shape palette. See "Specifying
symbol shape" in Specifying map attribute values (T45e) for detailed instructions.
—Symbol Size Use this to assign a size to the symbol. See "Specifying symbol size"
in Specifying map attribute values (T45e) for detailed instructions.
—Symbol Colour Use this to assign a colour to all high point markers. See
"Specifying colours" in Specifying map attribute values (T45e) for detailed
instructions.
4
If you wish to include low point annotations, turn on the Show Low Check box.
5
If you wish to specify the low point symbol, symbol size and/or symbol colour,
choose Edit Low Symbol. INTREPID displays the Low Settings dialog box.
This operates in the same way as the High Settings dialog box, except that the
default symbol is L. See step 3 above for details.
6
Library | Help | Top
If you wish to include value annotations with your high and low symbols, turn on
the Show Value Check box.
© 2012 Intrepid Geophysics
| Back |
INTREPID User Manual
Library | Help | Top
7
Including datasets in a map composition (T45b)
23
| Back |
If you wish to specify the format for the value annotations, choose Edit Value
Symbol. INTREPID displays the Value Settings dialog box.
Specify the attributes as required then choose Apply. INTREPID will close the
Value Settings dialog box and return to the High Low Settings dialog box.
—Text Size Use this to assign a font size to the high and low point value
annotations. See "Specifying font size" in Specifying map attribute values (T45e)
for detailed instructions.
—Text Colour Use this to assign a colour to the text of the high and low point value
annotations. See "Specifying colours" in Specifying map attribute values (T45e)
for detailed instructions.
—Decimals Use Decimals to specify the number of decimal places you wish to show
for the high and low point values. The default number is 0.
—Angle Use the angle for the text (in degrees). INTREPID will rotate the base line
of the text anticlockwise from horizontal by the angle that you specify.
8
Specify the Search Radius and Tolerance as required.
Search Radius INTREPID will identify a point as high (or low) by comparing the
value of that point with all other points within the search radius. The default
value of –1 triggers the internal default search radius of 8 grid cells . Specify the
Search Radius by entering the required radius (in metres) into the text box.
Tolerance INTREPID will use the Tolerance value to determine whether a point is
different enough from other points within the search radius to be identified as a
high (or low) point. Low Tolerance values result in more high (or low) points.
Specify Tolerance in the units of the grid values, (e.g., nT for magnetics grids).
Enter the required value into the text box.
9
Library | Help | Top
Choose Apply INTREPID will close the High Low Settings dialog box and return
to the Contour or Colour Contour dialog box.
© 2012 Intrepid Geophysics
| Back |
INTREPID User Manual
Library | Help | Top
Including datasets in a map composition (T45b)
24
| Back |
High and low clips, label gaps, drawing increment and tension
You can
•
Specify a high and/or low clip for the contour values (i.e., a range for the data
outside which INTREPID should not continue to draw contours). This eliminates
unnecessary detail of irrelevant data such as spikes.
•
Specify the gap between labels along contours.
•
Specify draw increment and tension for the contours to control the required curve
smoothness versus speed of plotting.
>> To specify high and low clips, label gaps, drawing increment and tension:
1
Choose Contour Tuning from the Contour or Colour Contour dialog box.
INTREPID displays the Contour Tuning dialog box.
2
Specify the settings as required and choose Apply. INTREPID will close the
Contour tuning dialog box and return to the Contour or Colour Contour dialog
box.
Low Clip Use this to specify the low clip value. INTREPID will not draw contours
with values lower than the value that you specify.
High Clip Use this to specify the high clip value. INTREPID will not draw contours
with values higher than the value that you specify.
Gap Between Labels Use this to specify the number of millimetres between labels
on the contours.
Drawing Increment Use this to specify the minimum size of the plotter movements
in millimetres. You can use this to control how smooth the contours will look.
Tension A high Tension value produces sharper curves, but line position is more
accurate. Tension can range from 0 to 50. We recommend that you normally
leave it at the default value of 1. Contact our technical support service for
assistance if you wish to modify Tension and require more information.
Weeding Factor A low Weeding Factor (0) means all the intermediate points in a
polyline are transmitted to the file or plotting device, regardless of whether they
are needed. Straight or near straight line segments of a contour line can be
specified with a much reduced number of points via this weeding factor. A value of
1.0 means to apply maximum redduction or weeding of the local polyline segment
in the current contour line.
Library | Help | Top
© 2012 Intrepid Geophysics
| Back |
INTREPID User Manual
Library | Help | Top
Including datasets in a map composition (T45b)
25
| Back |
Including or editing point datasets
You can include point datasets in your composition and represent Z fields from the
point dataset using symbol colour, size and shape. You can also label each point
shown.
>> To include or edit a point dataset
1
If there are two or more data boxes, select (click) the data box for the plot. Choose
New Point Plot from the Geographic menu or prepare to edit the existing point
dataset display. INTREPID displays the Point Dataset dialog box.
2
Specify the Dataset and properties as required, then choose Apply. If this is a new
plot, place it into your composition as described in section How to place a dataset
into your composition.
Dataset Use Dataset to specify the point dataset you wish to include. See Specifying
datasets and fields for instructions. If you are selecting from a dialog box with the
Windows version, select a dataset marker file with the extension ..DIR from
outside the dataset directory.
Marker Colour Use this to assign a colour to all points or determine the point colour
according to data in a Z field. See "Specifying colours" in Specifying map attribute
values (T45e) for detailed instructions.
Marker Size Use this to assign a size to all points or determine the symbol size
according to data in a Z field. See "Specifying symbol size" in Specifying map
attribute values (T45e) for detailed instructions.
Marker Symbol Use this to assign a symbol to all points or determine the symbol
shape according to data in a Z field. See "Specifying symbol shape" in Specifying
map attribute values (T45e) for detailed instructions.
Text String You can place a text label next to each point in the dataset. You can
assign a fixed text string to all points or show the values of a Z field.
If you are including a fixed text string for all points, type the string into the text
box.
If you are including values of a Z field, choose the String button. INTREPID
displays a Load Z dialog box. Select the Z field you require from inside the point
dataset directory. If you are using the Windows version, select a point dataset
field marker file with the extension ..PNT from inside the dataset directory.
Library | Help | Top
© 2012 Intrepid Geophysics
| Back |
INTREPID User Manual
Library | Help | Top
Including datasets in a map composition (T45b)
26
| Back |
Text Colour Use this to assign a colour to the text of the labels. See "Specifying
colours" in Specifying map attribute values (T45e) for detailed instructions.
Text Size Use this to assign a font size to the labels. See "Specifying font size" in
Specifying map attribute values (T45e) for detailed instructions.
Text Angle Use this to specify the angle for the text (in degrees). INTREPID will
rotate the base line of the text anticlockwise away from the horizontal by the
angle that you specify.
Special purpose point symbols
If you are plotting a Naudy model solutions point dataset or a trend points dataset,
the MAPCOMP language has special rectangle, dip and pointer symbols with
special attributes for this purpose. See "Special purpose symbol shapes" in Available
map attribute values (R22) for details.
Including or editing line datasets
You can include a line dataset in the composition either as a simple path plot or with
a stack profile effect. INTREPID has a wide variety of composition options for line
datasets including fiducial markers, line labels and colours to represent Z values.
Including or editing standard line dataset path plots
>> To include or edit a line dataset in a flight path plot
1
If there are two or more data boxes, select (click) the data box for the plot. Choose
New Path Plot from the Geographic menu or prepare to edit the existing line
dataset path plot display. INTREPID displays the Line Dataset Path Plot dialog
box.
2
Specify the Dataset and properties as required, then choose Apply. If this is a new
plot, place it into your composition as described in section How to place a dataset
into your composition.
Dataset and line style options
Dataset Use Dataset to specify the line dataset you wish to include. See Specifying
datasets and fields for instructions. If you are selecting from a dialog box with the
Windows version, select a dataset marker file with the extension ..DIR from
outside the dataset directory.
Library | Help | Top
© 2012 Intrepid Geophysics
| Back |
INTREPID User Manual
Library | Help | Top
Including datasets in a map composition (T45b)
27
| Back |
Line Colour Use this to assign a colour to all lines or determine the line colour
according to data in a Z field. See "Specifying colours" in Specifying map attribute
values (T45e) for detailed instructions.
Line Thickness Use this to assign a thickness to all of the lines. See "Specifying line
thickness" in Specifying map attribute values (T45e) for detailed instructions.
Line Style Use this to assign a style (e.g., solid, dotted, etc.) for all lines. See
"Specifying line style" in Specifying map attribute values (T45e) for detailed
instructions. You can also specify the bipole style for the lines using MAPCOMP
language (See (Bipole style)).
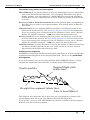
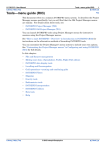
(Bipole style)
You can use the bipole style with line dataset path plots by directly editing the
MAPCOMP file for the composition.
Bipole style displays values of a Z field that you nominate as lines of varying length
perpendicular to and bisected by the flight path. The overall effect of this is a Z field
'envelope' around the flight path. If the Z value is greater than 0 INTREPID displays
the perpendicular line in red, and if the Z value is less than 0 the perpendicular line is
blue.
The following illustration shows a flight path with a bipole style.
See "Details of MAPCOMP language structure" in MAPCOMP Map Specification
Language (R20) for the bipole style specification syntax.
INTREPID has a special bipole dynamic range Level legend file for assigning Z value
ranges to the lengths of the perpendicular lines. See "The bipole line style legend" in
Map legend files (R23) for a description.
Line Label options
Line Label This set of line labels (the first of two sets) is intended to show line
numbers. Choose Line Label to place a line number (or other) label on each line.
INTREPID displays the Line Label dialog box.
Set the properties according to your requirements then choose Apply. INTREPID
will close the Line Label dialog box and return to the Line Dataset Path Plot
dialog box.
—Line Number field Use this to specify the line number field whose value you wish
to include as labels. See Specifying datasets and fields for instructions. If you are
selecting from a dialog box with the Windows version, select a dataset marker file
with the extension ..LINE from inside the dataset directory.
Library | Help | Top
© 2012 Intrepid Geophysics
| Back |
INTREPID User Manual
Library | Help | Top
Including datasets in a map composition (T45b)
28
| Back |
—Show Direction You can place arrows on each end of each line to show the flight
direction. Turn on the Show Direction check box if you require arrows.
—Line Number Text Choose Line Number Text to specify the text attributes of the
line numbers. INTREPID displays the Line Number Text dialog box.
Set the attributes according to your requirements then choose Apply. INTREPID
will close the Line Number Text dialog box and return to the Line Label dialog
box.
——Line Number Text Colour Use this to assign a colour to the text of the line
numbers. See "Specifying colours" in Specifying map attribute values (T45e) for
detailed instructions.
——Line Number Text Size Use this to assign a font size for the line numbers. See
"Specifying font size" in Specifying map attribute values (T45e) for detailed
instructions.
——Line Number Text Font Use this to assign a font size for the line numbers. See
"Specifying typeface" in Specifying map attribute values (T45e) for detailed
instructions.
——Angle Use this to specify the angle of line number text from line direction at the
end of the line. INTREPID will rotate the baseline of the text anticlockwise at the
East end and clockwise at the West end of the line. The angle must be different
from that of the second line number label (LineLabel2). Enter the angle in
degrees in the text box.
Line Label 2 This set of line labels (the second of two sets) is intended to show such
data as flight numbers or survey dates. Choose Line Label to place a second label
on each line. INTREPID displays the Line Label 2 dialog box.
Set the properties according to your requirements then choose Apply. INTREPID
will close the Line Label 2 dialog box and return to the Line Dataset Path Plot
dialog box.
—Line Number 2 field Use Line Number 2 to specify the second line number field
whose value you wish to include as labels. See Specifying datasets and fields for
instructions. If you are selecting from a dialog box with the Windows version,
select a dataset marker file with the extension ..LINE from inside the dataset
directory.
Library | Help | Top
© 2012 Intrepid Geophysics
| Back |
INTREPID User Manual
Library | Help | Top
Including datasets in a map composition (T45b)
29
| Back |
—Line Number 2 Text Choose Line Number 2 Text to specify the text attributes of
the line labels. INTREPID displays the Line Number 2 Text dialog box.
Set the attributes according to your requirements then choose Apply. INTREPID
will close the Line Number 2 Text dialog box and return to the Line Label 2 dialog
box.
——Line Number 2 Text Colour Use this to assign a colour to the text of the line
labels. See "Specifying colours" in Specifying map attribute values (T45e) for
detailed instructions.
——Line Number 2 Text Size Use this to assign a font size for the line labels. See
"Specifying font size" in Specifying map attribute values (T45e) for detailed
instructions.
——Line Number 2 Text Font Use this to assign a typeface for the line labels. See
"Specifying typeface" in Specifying map attribute values (T45e) for detailed
instructions.
——Line Number 2 Text Angle Use this to specify the angle of line number text
from line direction at the end of the line. INTREPID will rotate the baseline of
the text anticlockwise at the East end and clockwise at the West end of the line.
The angle must be different from that of the first line number label. Enter the
angle in degrees in the text box.
Fiducial/Recovery marker and label options
Point Label Use this to place fiducial (or recovery point) markers along the lines.
When you choose Point Label INTREPID displays the Point Label dialog box.
Set the properties according to your requirements then choose Apply. INTREPID
will close the Point Label dialog box and return to the Line Dataset Path Plot
dialog box.
Library | Help | Top
© 2012 Intrepid Geophysics
| Back |
INTREPID User Manual
Library | Help | Top
Including datasets in a map composition (T45b)
30
| Back |
—Show Fiducial If you require fiducial or recovery point display in your
composition, turn on the Show Fiducial check box. (You can specify fiducial/
recovery point display settings, save the settings in a MAPCOMP file, then decide
whether to include them in your composition any occasion simply by turning this
check box on or off.)
—Recovery Field or Fiducial Increment Select the option button corresponding
to the field type you wish to use for point markers. The default option is Fiducial
Increment.
—Fiducial field If you are displaying Fiducial markers, use Fiducial to specify the
fiducial field for the dataset. See Specifying datasets and fields for instructions.
If you are selecting from a dialog box with the Windows version, select a dataset
marker file with the extension ..LINE from inside the dataset directory.
—Recovery field If you are displaying Recovery points, use Recovery to specify the
recovery field for the dataset. See Specifying datasets and fields for instructions.
If you are selecting from a dialog box with the Windows version, select a dataset
marker file with the extension ..LINE from inside the dataset directory.
—Fiducial Interval Use Fiducial Interval to specify the number of fiducial counts
from one fiducial marker to the next. Only use this if you are displaying the
fiducial count (i.e., if the Fiducial Increment option button is selected)
—Fiducial Label Rate Use Fiducial Label Rate to specify the number of fiducial
markers from one fiducial label to the next. Only use this if you are displaying the
fiducial count (i.e., if the Fiducial Increment option button is selected).
—Fiducial Text Choose Fiducial Text to specify the text properties of the recovery
point or fiducial marker labels. INTREPID displays the Fiducial Text dialog box.
Set the attributes according to your requirements then choose Apply. INTREPID
will close the Fiducial Text dialog box and return to the Point Label dialog box.
——Fiducial Text Colour Use this to assign a colour to the text associated with the
fiducial markers. See "Specifying colours" in Specifying map attribute values
(T45e) for detailed instructions.
——Fiducial Text Size Use this to assign a font size to the fiducial marker labels.
See "Specifying font size" in Specifying map attribute values (T45e) for detailed
instructions.
——Fiducial Text Font Use this to assign a typeface to the fiducial marker labels.
See "Specifying typeface" in Specifying map attribute values (T45e) for detailed
instructions.
——Fiducial Text Angle Use this to specify the angle for the text (in degrees).
INTREPID will rotate the base line of the text anticlockwise from the line
direction by the angle that you specify.
Library | Help | Top
© 2012 Intrepid Geophysics
| Back |
INTREPID User Manual
Library | Help | Top
Including datasets in a map composition (T45b)
31
| Back |
—Fiducial Marker Choose Fiducial Marker to specify the properties of the markers.
INTREPID displays the Fiducial Marker dialog box.
Set the attributes according to your requirements then choose Apply. INTREPID
will close the Fiducial Marker dialog box and return to the Point Label dialog box.
——Fiducial Marker Colour Use this to assign a colour to all markers. See
"Specifying colours" in Specifying map attribute values (T45e) for detailed
instructions.
——Fiducial Marker Size Use this to assign a symbol size to the fiducial markers.
See "Specifying symbol size" in Specifying map attribute values (T45e) for detailed
instructions.
——Fiducial Marker Symbol Use this to assign a symbol shape to all fiducial
marks or recovery points or determine the symbol shape according to data in a Z
field. The default symbol shape is ‘x’. See "Specifying symbol shape" in Specifying
map attribute values (T45e) for detailed instructions.
Library | Help | Top
© 2012 Intrepid Geophysics
| Back |
INTREPID User Manual
Library | Help | Top
Including datasets in a map composition (T45b)
32
| Back |
Including or editing line datasets with stack profile
In a stack profile plot the lines are displaced from their original geographic position
according to the values in a Z field specified by you. The lines plotted form a Z path.
The collection of Z paths give an impression of the 'mountains and valleys' of the Z
data.
>> To include or edit a line dataset in a path plot with stack profile.
1
If there are two or more data boxes, select (click) the data box for the plot. Choose
New Stack Profile from the Geographic menu or prepare to edit the existing line
dataset stack profile display. INTREPID displays the Line Dataset Stack Profile
dialog box.
2
Specify the dataset and properties as required, then choose Apply. If this is a new
plot, place it into your composition as described in section How to place a dataset
into your composition.
Dataset options
Dataset Use Dataset to specify the line dataset you wish to include. See Specifying
datasets and fields for instructions. If you are selecting from a dialog box with the
Windows version, select a dataset marker file with the extension ..DIR from
outside the dataset directory.
Z field Use Z Field to specify the Z field for determining the displacement ('height') of
the Z path. See Specifying datasets and fields for instructions. If you are selecting
from a dialog box with the Windows version, select a dataset marker file with the
extension ..LINE from inside the dataset directory.
Library | Help | Top
© 2012 Intrepid Geophysics
| Back |
INTREPID User Manual
Library | Help | Top
Including datasets in a map composition (T45b)
33
| Back |
Profile options
Profile Line Vertical scale Use VScale to specify the 'height' (displacement) of the
Z path according to the data. Enter the scale in the text box in Z units/cm (e.g.,
nT/cm for magnetics data).
Profile Line Base value Use Base to specify the base Z value at which the Z path is
not displaced from its true geographical position on the image. Enter the base
value in the text box in Z units (e.g., nT for magnetics data). INTREPID shows Z
values above the base value as 'mountains' and Z values below the base value as
'valleys'.
Line style options
Line Colour Use this to assign a colour to all lines or determine the line colour
according to data in a Z field. See "Specifying colours" in Specifying map attribute
values (T45e) for detailed instructions.
Line Thickness Use this to assign a thickness to the lines. See "Specifying line
thickness" in Specifying map attribute values (T45e) for detailed instructions.
Line Style Use this to assign a style (e.g., solid, dotted, etc) for the lines. See
"Specifying line style" in Specifying map attribute values (T45e) for detailed
instructions.
Line label options
Line Number field Use Line Number to specify the line number field whose value
you wish to include as labels. See Specifying datasets and fields for instructions.
If you are selecting from a dialog box with the Windows version, select a dataset
marker file with the extension ..LINE from inside the dataset directory.
Show Direction You can display an arrow on each end of each line to show the flight
direction. Turn on the Show Direction check box if you require arrows.
Show Line to Base You can display a line
•
Between the first point of each line's Z path and the corresponding first point of its
flight path and
•
Between the last point of each line's Z path and the corresponding last point of its
flight path.
Turn on Show Line To Base if you require these lines.
If you do not specify a recovery or fiducial field in the composition, the 'line to
base' will be identical to the 'line to fiducial'. See Profile base line segments for
details.
Show Line to Fiducial You can display lines
•
Between the start point of each profile base line segment and the corresponding
point on the Z path.
•
Between the end point of each profile base line segment and the corresponding
point on the Z path.
Turn on the Show Line To Fiducial check box if you wish to display these lines.
See Profile base line segments for details.
Library | Help | Top
© 2012 Intrepid Geophysics
| Back |
INTREPID User Manual
Library | Help | Top
Including datasets in a map composition (T45b)
34
| Back |
Fiducial/Recovery marker and label options
Show Fiducial If you require fiducial or recovery point display in your composition,
turn on the Show Fiducial check box. (You can specify fiducial/recovery point
display settings, save the settings in a MAPCOMP file, then decide whether to
include them in your composition any occasion simply by turning this check box
on or off.)
Recovery Field or Fiducial Increment Select the option button corresponding to
the field type you wish to use for point markers. The default option is Fiducial
Increment.
Fiducial field If you are displaying Fiducial markers, use Fiducial to specify the
fiducial field for the dataset. See Specifying datasets and fields for instructions.
If you are selecting from a dialog box with the Windows version, select a dataset
marker file with the extension ..LINE from inside the dataset directory.
Recovery field If you are displaying Recovery points, use Recovery to specify the
recovery field for the dataset. See Specifying datasets and fields for instructions.
If you are selecting from a dialog box with the Windows version, select a dataset
marker file with the extension ..LINE from inside the dataset directory.
Label Increment Use Label Increment to specify the number of fiducial counts from
one fiducial marker and label to the next. Only use this if you have selected
Fiducial Increment rather than Recovery field.
Profile base line segments
INTREPID calculates the displacement for the Z path from one or more straight line
segments connecting points on the original flight path. These are the profile base
line segments.
If you do not specify a recovery or fiducial field, then INTREPID will use a single
straight line segment for the whole line, as shown in the following diagram.
Z path (profile)
Original flight path
(whole line)
Straight line segment (whole line)
Line to base/fiducial
This diagram also shows the 'line to base' that you can include by turning on the
corresponding check box in the Line Dataset Stack Profile dialog box.
If you specify a recovery field, INTREPID will calculate a profile base line segment
between each pair of recovery points.
Library | Help | Top
© 2012 Intrepid Geophysics
| Back |
INTREPID User Manual
Library | Help | Top
Including datasets in a map composition (T45b)
35
| Back |
If you specify a fiducial field, INTREPID will calculate a profile base line segment
between each pair of fiducial markers.
If you draw a line from a start or end point of a profile base line segment to the
corresponding point in the Z path, this line will be perpendicular to the profile base
line segment. If a flight path is curved so that the line segments are at different
angles, then the Z path will have gaps, and a line segment start/end point may have
two corresponding Z path points, one corresponding to its role as a start point and one
corresponding to its role as an end point.
The following diagram illustrates this phenomenon
Line to fiducial
Z path (profile)
Original flight path
Straight line segments
Fiducial or Recovery point
This diagram also shows the 'line to fiducial' that you can include by turning on the
corresponding check box in the Line Dataset Stack Profile dialog box.
Method of calculating profile base line segments
We have drawn the diagrams above in a simplified way. They suggest that
INTREPID calculates profile base line segments from the end points only.
In fact, INTREPID normally calculates the line of best fit (least squares) over the
segment for the base line.
Using MAPCOMP you can specify that INTREPID must actually calculate the line
from the end points only. To turn off least squares best fit, set LeastSquaresPath
to No in the StackProfilePlot Begin – End block.
Library | Help | Top
© 2012 Intrepid Geophysics
| Back |
INTREPID User Manual
Library | Help | Top
Including datasets in a map composition (T45b)
36
| Back |
Including or editing regions of interest—polygon datasets
You can include polygon datasets in a data box in order to show regions of interest or
for some other reason. You can fill a polygon or show its outline, and include a label.
You can also compose a non-dataset-related polygon annotation using the mouse.
This is simply drawn into your composition and does not relate to any geographic
data. For more information about polygon annotations See "Including a polygon" in
Including and editing map annotations (T45c) and "Including a rectangle" in
Including and editing map annotations (T45c) for more information about polygon
annotations.
>> To include or edit a polygon dataset
1
If there are two or more data boxes, select (click) the data box for the plot. Choose
New Polygon Plot from the Geographic menu or prepare to edit the existing plot.
INTREPID displays the Polygon Dataset dialog box.
2
Specify the Dataset and properties as required, then choose Apply. If this is a new
plot, place it into your composition as described in section How to place a dataset
into your composition.
Dataset Use Dataset to specify the polygon dataset you wish to include. See
Specifying datasets and fields in this chapter for instructions. If you are selecting
from a dialog box with the Windows version, select a dataset marker file with the
extension ..DIR from outside the dataset directory.
Colour Use this to assign a colour to the polygon. INTREPID will use the same
colour for borders and fill. See "Specifying colours" in Specifying map attribute
values (T45e) for detailed instructions.
Fill You can choose whether the polygon will be solid or hollow. See "Specifying
polygon fill" in Specifying map attribute values (T45e) for detailed instructions.
Show Label You can place a label on the polygon. Turn on the Show Label check
box.
Library | Help | Top
© 2012 Intrepid Geophysics
| Back |
INTREPID User Manual
Library | Help | Top
Including datasets in a map composition (T45b)
37
| Back |
Text String You can place a text label in the centre of the polygon. Use this to
directly specify a label text or select the name field of the polygon if it exists.
If you wish to specify the label directly, type the string into the text box.
If you are including the name field, choose the String button. INTREPID displays
a Load Z dialog box. Select the name field from inside the polygon dataset
directory. If you are using the Windows version the name field will have a polygon
dataset field marker file with the extension ..POLY. See "Create new field
example—Polygon name field" in Spreadsheet Editor (T15) for instructions on
creating polygon name fields.
Text Colour Use this to assign a colour to the polygon label. See "Specifying colours"
in Specifying map attribute values (T45e) for detailed instructions.
Text Size Use this to assign a font size to the polygon label. See "Specifying font
size" in Specifying map attribute values (T45e) for detailed instructions.
Including or editing tick marks in a data box
You can include tick marks in a data box to show the geographic reference for its
data.
If a data box contains projected data, you can include both metre and latitude/
longitude ticks.
If a data box contains geodetic data only, you can include latitude/longitude ticks.
The ticks can be on the border only, or shown as + marks or a grid within the data
box. You can specify tick size, label position and label font size.
>> To include or edit tick marks
1
If there are two or more data boxes, select (click) the data box for the ticks.
Choose New Metre Ticks or New Lat/Long Ticks from the Geographic menu or
prepare to edit the existing ticks. INTREPID displays the Metre Ticks or
Latitude/Longitude Ticks dialog box accordingly.
Specify the interval between ticks or grid lines.
Long Interval/East Interval Use this to specify the Interval between longitude
ticks in degrees, or the interval between Eastings in metres.
Library | Help | Top
© 2012 Intrepid Geophysics
| Back |
INTREPID User Manual
Library | Help | Top
Including datasets in a map composition (T45b)
38
| Back |
Lat Interval/North Interval Use this to specify the Interval between latitude ticks
in degrees, or the interval between Northings in metres.
2
Specify the position(s) for tick labels.
Label At Top, Label At Bottom You can place longitude/Easting labels at the top
and/or bottom of your data box. Turn on the corresponding dialog box.
LLabel At Left, Label At Right You can place latitude/northing labels at the left
and/or right of your data box. Turn on the corresponding dialog box.
3
Specify the tick format. You can choose from three tick formats and specify the
size of ticks.
Tick Select this option to place + marks inside your data box.
Grid Select this option to place a grid inside your data box.
Border Select this option to place tick marks on the inside edge of your data box.
Tick Size Use this to specify the size of the ticks in mm. Enter a value between 2 and
6.
4
Specify the format and position of the tick labels.
Text Size Use this to specify a font size for the tick labels.
Internal Use this to specify whether the edge labels associated with the tick marks
will appear inside or outside the data box. Turn on this check box to place the
edge labels inside the data box.
5
When you are satisfied with your tick specifications, choose Apply.
Specifying extent, scale, data box size and sheets division
INTREPID will normally include the entire geographic extent of all of the datasets
that you include in a data box. You can respecify the extent for the composition
directly, by placing the data box into a standard sheet or by having INTREPID
recalculate it using all or a subset of the datasets.
If you require, Map Composition can automatically adjust the scale or the data box
size, or divide the composition into a number of sheets.
Defaults: Map Composition will by default produce a single sheet composition with
extent covering all loaded datasets in a 100 mm x 100 mm data box. It will
automatically calculate the scale of the composition to fit these specifications.
Library | Help | Top
© 2012 Intrepid Geophysics
| Back |
INTREPID User Manual
Library | Help | Top
Including datasets in a map composition (T45b)
39
| Back |
>> To specify the data extent, projection and layout of a data box
1
Select the data box whose extent you wish to adjust and display the Data Extents
dialog box using the procedures described in Sections "Selecting objects" in Map
composition—introduction (T45a) and "Editing properties of selected objects" in
Map composition—introduction (T45a).
INTREPID displays the Data Extents dialog box.
Library | Help | Top
2
Specify a new projection and datum if required. See Specifying projection and
datum for a data box for detailed instructions.
3
Specify or calculate the extents as required. See Specifying extents for a data box
for detailed instructions.
4
If you require scale, data box size or sheet division different from the existing
arrangement or the defaults described at the start of this section, choose Layout.
INTREPID displays the Layout Specification dialog box. Otherwise go to step 6.
5
Specify the scale, data box size, and/or sheet division as required, then choose OK
in the Layout specification dialog box. See Composition Layout: Scale, Data box
size, Sheets for detailed instructions.
6
If you are dividing the composition into sheets and wish to change the current
arrangement, select (activate) or deselect (inactivate) individual sheets as
required. See Selecting sheets for printing or display for instructions.
© 2012 Intrepid Geophysics
| Back |
INTREPID User Manual
Library | Help | Top
7
Including datasets in a map composition (T45b)
40
| Back |
Choose OK in the Data Extents dialog box. INTREPID will redisplay the
composition using the settings you have specified.
Specifying projection and datum for a data box
Section Data box projection and datum described the way INTREPID determines the
projection and datum of a data box. We suggest that you read this carefully before
attempting to change the projection and datum of a data box.
>> To specify the projection and datum for a data box
1
Display the Data Extents dialog box as described above.
2
Choose Projection and Datum in turn. In each case INTREPID displays a dialog
box for you to select the new projection or datum. See Old Datum and Projection
Conversion (T12) and INTREPID’s supported datums and projections (R09) for
further information.
Specifying extents for a data box
The extents of a data box are expressed as an origin (the geographic coordinates of a
corner—typically the lower left corner) and an extent (the X and Y distances to the
opposite edges). You can specify the extents of a data box in three ways:
•
Enter the extents manually in degrees or projection units.
•
Place the data box into a standard sheet (e.g., 1:25000)
•
Calculate extents for the data box using the extents of some or all datasets that it
contains.
>> To specify the extents for a data box
Library | Help | Top
1
Ensure that you have set the projection and datum for the data box as required
(See Specifying projection and datum for a data box).
2
Display the Data Extents dialog box as described at the start of section Specifying
extent, scale, data box size and sheets division.
© 2012 Intrepid Geophysics
| Back |
INTREPID User Manual
Library | Help | Top
3
Including datasets in a map composition (T45b)
41
| Back |
If your data box contains projected data select the units for specifying the extents
using the Origin and Extents Are In Units Of options– Latitude/Longitude or Map
Projection.
Directly specifying extents
4
If you wish to directly specify the extent, enter the origin and extent coordinates
in the corresponding text boxes. Go to step 11.
Inserting the data box into a standard sheet
5
If you wish to specify the extent of the data box by placing it in a standard sheet,
choose Standard Sheet from the Data Extents dialog box. INTREPID displays the
Standard Sheets dialog box. (See "Standard sheets" in Map composition
configuration files (R21) for details about standard sheets.)
6
Select (click) the standard sheet you require and choose Accept. INTREPID will
change the extent of the data box to the standard sheet that contains the lower
left ('SouthXY=East') corner of the existing data box.
Note: If the existing data box overlaps onto the next sheet INTREPID will
exclude the data that doesn't belong to the original standard sheet in the
composition.
Go to step 11.
Calculating extents automatically from the data
7
Library | Help | Top
If you wish to automatically calculate the extents from the data, choose Calculate
from Data. INTREPID displays the Extent Calculation Datasets Selection dialog
box.
© 2012 Intrepid Geophysics
| Back |
INTREPID User Manual
Library | Help | Top
8
Including datasets in a map composition (T45b)
42
| Back |
Select from the option buttons the class of datasets to be listed for inclusion in the
calculation– All, Vectors, Grids, Polygons. INTREPID will list the corresponding
datasets in the Unselected list.
If you select Limits, INTREPID will use the extents specified in the Data Extents
dialog box.
If you select All INTREPID will list all loaded datasets.
9
Select a dataset to be used by clicking it in the Unselected list then choosing the
>> button. To deselect a dataset, click it in the Selected list, and then choose the
<< button. Continue selecting and deselecting until you are satisfied with your
specification.
10 If you wish to select or deselect datasets from a different class, go to step 8.
11 Choose OK to calculate the extents. INTREPID will calculate them and display
the origin and extent in the corresponding text boxes in the Data Extents dialog
box.
Note: This action will erase any manual Limits settings you may have made in
the Data Extents dialog box.
Accepting the extents calculation
12 Choose OK in the Extent specification dialog box. INTREPID will redisplay the
composition using the extents you have specified.
Composition Layout: Scale, Data box size, Sheets
Map Composition will by default produce a single sheet composition with the extents
you have specified in a 100 mm x 100 mm data box. It will automatically calculate
the scale of the composition to fit these specifications.
If you require, INTREPID can
•
For a single sheet composition, automatically determine the scale required for a
data box size and extent specified by you.
•
For a single sheet composition, automatically determine the data box size
required for a scale and extent specified by you.
•
Automatically divide your composition into sheets based on the scale, data box
size and overall geographic extent specified by you, or
>> To specify the scale, data box size and/or sheet distribution,
Library | Help | Top
1
Display the Data Extents dialog box as described at the start of section Specifying
extent, scale, data box size and sheets division.
2
Ensure that you have correctly specified the projection, datum and extents for the
data box (See Specifying projection and datum for a data box and Specifying
extents for a data box).
© 2012 Intrepid Geophysics
| Back |
INTREPID User Manual
Library | Help | Top
3
Including datasets in a map composition (T45b)
43
| Back |
Choose Layout. INTREPID displays the Customise Data Box Layout dialog box.
Setting the size for the data box and automatically adjust scale to fit (Single Sheet)
4
If you require a single sheet composition automatically scaled to the data box size
you specify, select Fixed Size (Single Sheet).
5
The default size for the data box is 100 mm x 100 mm. If you wish to change this
choose Customise. INTREPID displays the Customise Data Box Size dialog box.
Otherwise go to step 20.
6
Enter the Width and Height in the corresponding text boxes and choose OK.
INTREPID will return to the Customise Data Box Layout dialog box and display
the new size and scale. Go to step 20.
Setting the scale for the data box and automatically adjust size to fit (Single Sheet)
7
If you require a single sheet composition with a data box automatically sized to fit
the composition with the scale you specify, choose Fixed Scale (Single Sheet).
8
INTREPID calculates a default scale for the data box based on the extent and
data box size. If you wish to change this choose Customise. INTREPID displays
the Customise Data Box Scale dialog box. Otherwise go to step 20.
9
Enter the scale in the corresponding text box and choose OK. INTREPID will
return to the Customise Data Box Layout dialog box and display the new size and
scale. Go to step 20.
Dividing the data box into sheets using a map series
10 If you require Map Composition to divide your composition into sheets, select Use
Map Series.
INTREPID will report the data box size, the scale and the number of sheets in the
Customise Data Box Layout dialog box.
Library | Help | Top
© 2012 Intrepid Geophysics
| Back |
INTREPID User Manual
Library | Help | Top
Including datasets in a map composition (T45b)
44
| Back |
11 If you wish set the scale, examine or modify extents of the sheets or overlaps,
choose Customise. INTREPID displays the Customise Map Series dialog box.
Otherwise go to step 20.
12 Choose Lat/Long or Map Projection according to the units you wish to use for
sheet extents and overlaps. INTREPID displays the extents and overlaps in the
unit you require.
13 If you are using A1 page size (See "Page definition" in Map composition—
introduction (T45a)) and wish to divide your data box onto standard sheets,
choose Standard Sheets in the Customise Map Series dialog box. INTREPID
displays the Standard Map Series dialog box. (See "Standard sheets" in Map
composition configuration files (R21) for details about standard sheets.)
Otherwise go to step 15.
14 Select the standard sheet you require, then choose Accept. INTREPID will apply
the scale of the standard sheet to the data box and divide it among the standard
sheets for its region.
15 If you require a different scale, enter the required scale into the Scale text box.
16 If you wish to specify the extent for the individual sheets, enter it into the
corresponding text boxes. (Note that you can switch between projection and
geodetic coordinates as required by choosing the corresponding option button.)
17 If you require an overlap between adjacent sheets, specify the overlap in the
corresponding text boxes.
18 Select (activate) or deselect (inactivate) individual sheets and select the current
sheet as required. All sheets are selected (activated) unless you specify otherwise.
The current sheet is the lower left sheet unless you specify otherwise. See
Selecting sheets for printing or display for instructions.
Library | Help | Top
© 2012 Intrepid Geophysics
| Back |
INTREPID User Manual
Library | Help | Top
Including datasets in a map composition (T45b)
45
| Back |
19 When you have specifying the map series, choose OK in the Customise Map Series
dialog box. INTREPID will return to the Customise Data Box Layout dialog box
and report the data box size and number of sheets.
Accepting your layout specification
20 When you have finished specifying scale, data box size, sheet distribution, choose
OK in the Customise Data Box Layout dialog box. INTREPID will return to the
Data Extents dialog box.
21 Choose OK in the Data Extents dialog box. INTREPID will redisplay the
composition using the extents, scale, data box size and sheet distribution you have
specified.
Sheet names
No matter which method of sheets organisation you use, Map Composition will name
the sheets Sheet1, Sheet2, ... from left to right starting with the top row. The
sheet of a single sheet composition will be called Sheet1.
If you wish to name the sheets using some other system, you will need to directly edit
Sheets= in the Data object's Extent Begin – Extent End block in the MAPCOMP
file produced by Map Composition.
Selecting sheets for printing or display
Activating, deactivating sheets; Selecting the current sheet
Selected sheets: If your composition consists of several sheets you can mark them
individually as selected (active) or deselected (inactive). When you print the
composition, Map Composition only prints the selected (active) sheets.
When INTREPID first divides the composition into sheets they are all selected
(active).
Current sheet: In a composition consisting of several sheets, the current sheet is the
sheet displayed in the data box. INTREPID will normally display the lower left
sheet. You can select a different current sheet if required.
>> To select or deselect sheets and specify the current sheet
Ensure that you have correctly specified the projection, datum and extents for the
data box (See Specifying projection and datum for a data box and Specifying extents
for a data box).
Library | Help | Top
1
Ensure that you have correctly specified the sheets distribution (See Composition
Layout: Scale, Data box size, Sheets).
2
Display the Customise Map Series dialog box as described above (See Composition
Layout: Scale, Data box size, Sheets).
© 2012 Intrepid Geophysics
| Back |
INTREPID User Manual
Library | Help | Top
3
Including datasets in a map composition (T45b)
46
| Back |
Choose Select Sheets. INTREPID displays the Select Sheets dialog box.
Selected (active) sheets are coloured red. Deselected (inactive) sheets are
coloured white. The current sheet has a thicker border than the others.
Library | Help | Top
4
If you are selecting sheets turn on sheet Select mode using the corresponding
option button. Otherwise go to step 6.
5
Select and deselect sheets as required. To deselect (inactivate) a sheet, left button
click it so that it is coloured white. To select (activate) a sheet, left button click it
so that it is coloured red.
6
If you are selecting the current sheet turn on Current mode using the
corresponding option button. Otherwise go to step 8.
7
Select the sheet to be displayed by left button clicking it so that its border is
highlighted.
8
When you have selected and/or deselected sheets as required and selected the
current sheet, choose Accept in the Select Sheets dialog box.
9
Choose OK in the Customise Map Series, Customise Data Box Layout, Data
Extents dialog boxes. INTREPID will note the selected sheets and display the
current sheet in your composition.
© 2012 Intrepid Geophysics
| Back |