1
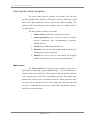
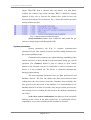
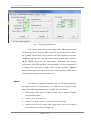
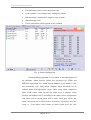
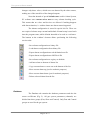
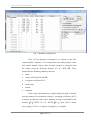
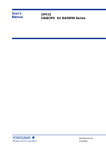
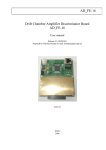
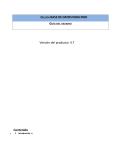
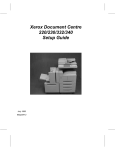
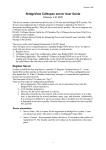
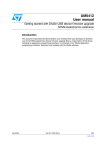
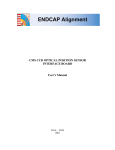
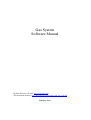
Gas System
Software Manual
By Peter Kravtsov (E-mail: [email protected])
This document location: http://lkst.pnpi.nw.ru/pdf/cbm_rich_gas_soft.pdf
February 2011
Gas system software manual
Introduction
The software described in this document was developed for the
slow control of the gas systems in STAR and PHENIX detectors and after
some modifications is used to control CBM RICH gas system. The
software provides manual control of the gas system and data acquisition
for all sensors, shows measured system parameters and maintains the gas
system database. Besides, the software reacts on some gas system faults
and takes care for automatic recovering.
The gas system software works in Windows 2000 or Windows
XP. The software consists of three separate programs. Gas system control
program does most of the job and controls the gas system. DBViewer [1]
provides visualization of the data for any gas system process variable and
export data from the database to MS Excel or tab-delimited text file for
further analysis. Charts [2] program displays up to ten selected system
parameters in the time chart format. Besides, it could be used for tabular
display of the process variables, with extra alarm signals for every
parameter in the table. In addition, the TCP/IP client/server is
implemented in the Charts software so that it can be used remotely for
monitoring the system under control.
The software utilizes MS Access database engine to keep the
history of all system parameters and event messages. DBViewer and
Charts programs are documented separately.
Page 2 of 12
Gas system software manual
Gas system control program
The main control process contains two threads. The first one
provides graphical user interface (GUI) and events log, while the second
thread does data acquisition, device control and alarms handling. The
priority of the second thread is set to highest value for reliable work in
crowded system.
The main window contains several tabs:
1. Main control provides basic gas system control.
2. System parameters tab is used for control electronics
specific parameters like communication properties,
reading interval.
3. Alarms tab contains alarm handlers list.
4. Database tab is used for the database control and also for
changing the sensor coefficients.
5. DAQ32 tab can be used for fine tuning the DAQ32
module and is not necessary for gas system operation.
Main control
The Main control tab of the gas system software gives user a
possibility to control gas system manually (Fig. 1). It has simplified gas
scheme in the main window [3]. The buttons on the gas scheme represent
every solenoid valve and device controlled by software. Red button state
means either closed valve or switched off device, while green one stays
for open valve or switched on device. Note that some solenoid valves and
devices are controlled by the pressure switch PIS1 and therefore may be
blocked for software control.
Page 3 of 12
Gas system software manual
Fig. 1. Main control of the gas system.
All the sensors being read by the software are displayed at right
side of the window. There is a possibility to see sensor’s voltages, which
can be useful for coefficients calculation. Additional controls beneath the
sensors list are used to enable or disable alarms and to control the gas
system operation parameters. Note that all alarms are disabled by default
at program start. All gas system parameters are logged into the database
with specified time interval. Current database name is always shown in
the window caption. Each software event is logged into the event log at
the bottom of the main window and into the current database as well. In
case of alarm trigger the alarm message is also logged and corresponding
sensor is displayed in red color in the list.
Page 4 of 12
Gas system software manual
Pressure regulation controls are used to control the pressure
inside the detector or fresh gas flow. [Enable PT4 regulation] checkbox
switches the PID control algorithm in the slow control module which
stabilizes detector pressure at specified setpoint. [Set]
button sends pressure regulation parameters to slow
control module. If [Enable PT4 regulation] checkbox is
cleared, operator can control FM1 flow controller
directly.
Three mode buttons are used to control the basic gas system
procedures. [Purging Mode] button starts and stops the purging
procedure. Before starting the purging, operator should specify the desired
pressure in the detector and total purging gas volume (10 litres in Fig. 1).
Then, by starting the purging mode, the software will open all necessary
valves and smoothly increase the flow to minimize pressure overshoot.
Then it calculates the gas volume passed through the FM1 controller and
shows it along with the estimated finish time for purging (Fig. 1). By
purging 90% of required gas volume the software opens SV3 and purge
analyzers also to remove traces of oxygen and water if necessary. When
the necessary volume passed through the detector, the software displays
the message about finishing the purging and keeps the system in purging
mode as the safest configuration.
[Start Normal] button serves to begin the normal gas system
operation with recirculation of the gas. The procedure is as follows (Fig.
2). The software starts gas circulation by switching on the compressor
with closing the valves SV1, SV3, SV4, SV7, and opening the valves
SV2, SV5, SV6. This configuration connects analyzers to purifier and
dryer output. Then, after one minute, the software checks the oxygen and
moisture content. If one of them does not fall below 100ppm, they will be
checked during 5 minutes in total and in case of high impurity
concentration the software logs the corresponding message and keeps the
system in this configuration.
After successful checking the purification units SV5 valve is
closed and SV4 valve is opened to establish the normal circulation gas
flow through the purification units and to connect analyzers to compressor
Page 5 of 12
Gas system software manual
output. Then FM1 flow is checked after one minute. If it falls below
0.2slpm, the software logs alarm message. BPCV1 should be slightly
adjusted in this case to increase the exhaust flow, which in turn will
increase the fresh gas flow to detector. Fig. 2 shows the normal operation
starting without any fail.
Fig. 2. Start normal operation messages.
[Stop circulation] button stops compressor and switch the gas
system to simple purge mode through the FM1.
System parameters
System parameters tab (Fig. 3) contains communication
parameters for the slow control electronics and fine tuning parameters for
the system regulation loops.
Communication parameters are adjusted during assembling of the
system and most of them should be kept untouched during gas system
operation. The [Connect] button is used to connect to slow control
module at the selected com port. It could also be used to reconnect the
device if it was switched off. The device is connected automatically
during program startup.
The most important parameters here are Data poll interval and
Database interval. The first one defines the time period between data
reading from the slow control electronics. Database interval defines the
time period of the data saved to the database. It is recommended to set
Database interval to at least 20 seconds, since the gas system processes are
slow enough. In case of alarm the data saved to the database immediately
out of turn.
[Ask valves control confirmation] checkbox prevents accidental
clicking on the valves in the main control tab. A confirmation will be
requested by every valve switching if this checkbox is checked.
Page 6 of 12
Gas system software manual
Fig. 3. System parameters tab.
PT4 control group allows fine tuning of the PID regulation loop
for detector pressure. Setpoint [SP] repeats the setpoint from main control
tab. [t_max] value defines time constant of the PID algorithm in seconds.
[COmax] is the limit for controller output with maximum value of 65535.
[K_P], [K_D], [K_I] are the proportional, differential and integral
coefficients of the PID algorithm, correspondingly. It is not recommended
to change these parameters during normal system operation. [Update]
buttons reads these parameters from slow control module; [Set] button
sends changed parameters back to the device.
Alarms
The Alarms configuration tabsheet (Fig. 4) is designed to display
and change alarms levels and actions to be taken in case of any particular
alarm. The following parameters are available for every alarm:
•
Alarm name with enable checkbox, which allows enable or disable
each particular alarm
•
Active sensor for this alarm
•
Alarm level (sensor value exceeding level causes alarm)
•
Alarm recovery level (sensor value below this level recovers system
from alarm, once it has been triggered)
Page 7 of 12
Gas system software manual
•
Threshold sign (sensor value comparison sign)
•
Count (number of exceeding sensor readings for alarm)
•
Alarm message, which will be logged in case of alarm
•
Alarm message color
•
Valves pattern that will be applied in case of alarm
Fig. 4. Alarms configuration.
Alarms handling algorithm is very similar to that implemented in
the hardware Alarm System, which was developed for STAR and
PHENIX experiments (see Alarm System Manual [2] for details). After
each measuring cycle, DAQ thread compares alarm thresholds for all
enabled alarms with appropriate sensor values using alarm comparison
signs. If the sensor value exceeds the alarm level, it displays alarm
message and updates valves according to the alarm valves configuration
(red valves will be closed, green will be open, while gray will be left
intact), storing the list of affected valves in memory. Upon alarm recovery
event, i.e. if the sensor value returns to alarm return level, the code
Page 8 of 12
Gas system software manual
changes only those valves, which were not alarmed by the other sensors,
making use of the stored list of the changed outputs.
Note that instead of special default state used in Alarm System,
PC software uses current valves state at every alarms checking cycle.
This means that no valves and devices are affected if nothing happens
with alarm situation, i.e. neither alarms nor alarm returns happened.
The alarms configuration is stored in special ini file. There are
two copies of alarms setup: normal and default. Normal setup is used each
time the program starts, while defaults intended to be used as a reference.
The buttons at the window’s bottom allows performing the following
service tasks:
– Save alarms configuration to binary file
– Load alarms configuration from binary file
– Export alarms configuration to tab-delimited text file
– Export alarms configuration to MS Excel file
– Save alarms configuration to registry as defaults
– Add new alarm to bottom of alarms list
– Copy current alarm to a new one at the bottom of the list
– Move current alarm up (just for aesthetic purposes)
– Move current alarm down (just for aesthetic purposes)
– Delete selected alarm from the list
Database
The Database tab contains the database parameters and also the
sensor coefficients (Fig. 5). All gas system parameters (channels) are
divided into three groups (Fast, Slow and Control). Only Fast and Control
groups are used for the gas system.
Page 9 of 12
Gas system software manual
Fig. 5. Database configuration.
First 32 Fast channels correspond to 32 sensors of the slow
control module. Channels 33-36 correspond to four analog outputs of the
slow control module. Sensor value for these channels is calculated from
the voltage using the following formula: S = (V + KA) ⋅ KB . Every
channel has the following editable properties:
•
name,
•
value coefficients KA and KB,
•
averaging coefficient AVG,
•
sensor units,
•
branch,
•
comment.
Name, units and comment are simple strings that used to identify
system parameter in visualization software. Averaging coefficient (AVG)
is used to average the sensor values. Running average is calculated by the
formula: Si = AVG ⋅ S i + (1 − AVG ) ⋅ S i −1 . Thus, AVG=1 means
no averaging, AVG=0.1 is equal to averaging by 10 samples.
Page 10 of 12
Gas system software manual
The channel branches are used for data channel grouping in
Charts and DBViewer programs. For the systems with 100 or more
parameters it becomes very useful to group these parameters by
subsystem. In this particular case only two groups are used: GAS branch
contains all gas system parameters, while all slow control module specific
parameters belong to Device branch (like PID coefficients, device reading
time etc.). There is also special Disabled branch for unused parameters.
Usually it is not displayed in Charts and DBViewer programs.
Using small toolbar in top-right corner of the window operator
can read and save channel configuration to ini file. Usually it is saved
automatically at the program shutdown, if checkbox [Save channels
config on exit] is checked. This ini file is also used for the Charts program
to display the list of the available parameters. Channel configuration can
also be saved or read from the current database.
Database control toolbar provides two actions for changing the
active database: create a new database and open existing database. In
addition, the software has special limit for the database file size (set to
800Mb in Fig. 5). By reaching this limit it starts new database
automatically with the date and time in the name and writes an appropriate
message in the main log.
Page 11 of 12
Gas system software manual
References
1. DBViewer Manual: http://lkst.pnpi.nw.ru/pdf/DBViewer2en.pdf
2. Charts User Manual: http://lkst.pnpi.nw.ru/pdf/chartsen.pdf
3. See gas system scheme.
4. Alarm System Manual: http://lkst.pnpi.nw.ru/pdf/alarm_manual.pdf
Page 12 of 12