
1
FLORIDA KEYS
CARRYING CAPACITY STUDY
Carrying Capacity/Impact Assessment Model
and Routine Planning Tool –
Maintenance Manual
March 2003
This report was prepared by URS Corporation (formerly Dames & Moore, Inc.), for the U.S. Army Corps of
Engineers and the Florida Department of Community Affairs. Funds for this study were provided under U.S. Army
Corps of Engineers Contract No. DACW17-99-D-0058, Delivery Order 12, Test CCAM.
Table of Contents
1.0
2.0
3.0
4.0
5.0
6.0
7.0
8.0
9.0
10.0
11.0
12.0
13.0
14.0
PURPOSE AND ORGANIZATION OF THIS MANUAL ....................................1
INTRODUCTION TO THE FLORIDA KEYS CARRYING CAPACITY
STUDY ....................................................................................................................2
OVERVIEW OF THE CARRYING CAPACITY/IMPACT ASSESSMENT
MODEL (CCIAM)...................................................................................................3
OVERVIEW OF THE ROUTINE PLANNING TOOL (RPT)...............................4
COMPUTING SPECIFICATIONS .........................................................................5
5.1
CCIAM ........................................................................................................5
5.2
RPT ..............................................................................................................6
DIRECTORY STRUCTURE ..................................................................................7
6.1
Canal_Model Directory ...............................................................................7
6.2
Data Directory..............................................................................................8
6.3
Hurricane_Model .......................................................................................10
6.4
Results Directory .......................................................................................10
6.5
Scenario_Covs ...........................................................................................13
NAMING CONVENTIONS..................................................................................14
CCIAM INSTALLATION PROCEDURES .........................................................16
MICROSOFT EXCEL OPTION SETTINGS .......................................................18
CCIAM MODELING SEQUENCE AND STRUCTURE ....................................20
10.1 Graphical User Interface ............................................................................20
10.2 Analysis......................................................................................................21
10.3 Result Reporting ........................................................................................29
10.4 Look Up Tables..........................................................................................32
10.5 Description of VBA modules in the FKCCS.mxd.....................................34
RESTORATION SCENARIOS.............................................................................38
CCIAM DATA UPDATES ...................................................................................42
12.1 Parcel Updates ...........................................................................................42
12.2 Residential Developability & Suitability Guidelines.................................53
12.3 Non-residential Suitability Guidelines.......................................................58
12.4 Vacant-Conservation Land Guidelines ......................................................59
12.5 Dwelling Unit Calibration Guidelines .......................................................61
12.6 Input Layer Updates...................................................................................61
12.7 Potential habitat/richness models...............................................................63
ROUTINE PLANNING TOOL (RPT)..................................................................64
13.1 RPT Architecture .......................................................................................64
13.2 Installation Procedures...............................................................................64
13.3 RPT Updates ..............................................................................................67
LIST OF SUPPORTING DOCUMENTATION ...................................................68
Florida Keys Carrying Capacity Study
Carrying Capacity/Impact Assessment Model Maintenance Model
i
List of Acronyms
CAMA
Computer Assisted Mass Appraisal
CCIAM
Carrying Capacity/Impact Assessment Model
GUI
Graphical User Interface
MCPA
Monroe County Property Appraiser’s
RPT
Routine Planning Tool
VBA
Visual Basic for Applications
Florida Keys Carrying Capacity Study
Carrying Capacity/Impact Assessment Model Maintenance Model
ii
Section 1
Purpose and Organization of this Manual
This manual provides the steward of the Carrying Capacity/Impact
Assessment Model (CCIAM) and Routine Planning Tool (RPT) with
technical information to maintain and update these two applications.
Other significant documentation includes the header information within
the Visual Basic for Applications (VBA) code, the user’s manual, and the
Florida Keys Carrying Capacity Study Final Report. This maintenance
manual is organized into twelve sections:
·
Introduction to the Florida Keys Carrying Capacity Study
·
Overview of the Carrying Capacity/Impact Assessment
Module
·
Overview of the Routine Planning Tool
·
Computing Specifications
·
Directory Structure
·
Naming Conventions
·
Installation Procedures
·
CCIAM Architecture
·
CCIAM Updates
·
RPT Architecture
·
RPT Updates
·
List of Supporting Documentation
Note: The FKCCS metadata files are provided under separate cover.
Florida Keys Carrying Capacity Study
Carrying Capacity/Impact Assessment Model Maintenance Model
1
Section 2
Introduction to the Florida Keys Carrying Capacity Study
In 1986, a new comprehensive plan and corresponding land development
regulations were approved for Monroe County. They were developed in
response to the Area of Critical State Concern designation, as well as to
comply with State of Florida regulations and to maintain a high quality of
life in the region. In 1991, the Monroe County Board of Commissioners
ratified the Monroe County Year 2010 Comprehensive Plan (the Plan).
The Plan was revised in 1993 following several legal challenges initiated
by the DCA and other private organizations. Ongoing legal proceedings
prompted a 1995 Final Order and Recommendation by the Hearing
Officer, which resulted in further revisions and final adoption of the Plan
in 1996. During final revisions of the Plan, a “carrying capacity
approach” to growth management was adopted. The goal of the FKCCS,
excerpted from FAC Rule 28-20.100, reads as follows:
“The carrying capacity analysis shall be designed to determine the
ability of the Florida Keys ecosystem, and the various segments
thereof, to withstand all impacts of additional land development
activities.”
The Carrying Capacity/Impact Assessment Model (CCIAM) and Routine
Planning Tool (RPT) were created as part of the FKCCS. This manual
documents the technical details of these two applications.
Florida Keys Carrying Capacity Study
Carrying Capacity/Impact Assessment Model Maintenance Model
2
Section 3
Overview of the Carrying Capacity/Impact Assessment Model
(CCIAM)
The CCIAM is a spatial model, built using ArcGIS 8.1 and automated
with VBA, which evaluates the end-state effects of land use scenarios on
the natural and social systems of the Florida Keys. The CCIAM analysis is
triggered by changes in the land use GIS layer. The user defines these
changes, as alternative land use scenarios, through the Graphical User
Interface (GUI) to modify land use patterns and specify stormwater and
wastewater treatment types. Users of this model include planners from
Monroe County, the South Florida Regional Planning Council, the Florida
Department of Community Affairs, as well as, other stakeholders involved
with the county’s comprehensive planning process.
The CCIAM is expected to be run during reviews of the Monroe County
comprehensive plan, which may occur annually or less frequently. Outputs
from the CCIAM include geodatabase feature classes and tables, Arc Info
coverages, and Arc Info grids. These outputs are summarized into two
HTML reports. First, the Scenario Report is a compilation of carrying
capacity indicators and other information that can be interpreted to derive
an assessment of the user-defined scenario. The Scenario Report is the
primary reporting mechanism for the CCIAM. It is intended to be a standalone document that can provide the planner with the information he or
she needs to evaluate their scenario. Explanatory text is included in the
Scenario Report to assist the planner in interpreting the results produced
by the CCIAM. Second, the Model Output Listing is a report that compiles
all of the outputs generated by the CCIAM. The Model Output Listing
accompanies the Scenario Report to provide supporting information
resulting from the CCIAM. It is organized by CCIAM modules and has
limited explanatory text.
Florida Keys Carrying Capacity Study
Carrying Capacity/Impact Assessment Model Maintenance Model
3
Section 4
Overview of the Routine Planning Tool (RPT)
The Routine Planning Tool (RPT) is an ArcIMS application that is
intended for more frequent use by planners and the public. It provides
wide access to the pertinent information compiled during the FKCCS and
the various scenarios run through the CCIAM. The RPT functions with
ArcIMS, a Java servlet connector (Servlet Exec), Microsoft’s web server
(MS IIS), and serves an HTML viewer using an image map service. It is a
light weight application served over the Internet and is not intended to
serve as the model itself. However, data resulting from the CCIAM can
be provided to the planners and the public through this application. If
warranted, additional data layers can easily be added to this application.
The RPT is a by-product of the overall FKCCS effort; and, therefore,
minimal customizations were made to the ArcIMS default application.
Florida Keys Carrying Capacity Study
Carrying Capacity/Impact Assessment Model Maintenance Model
4
Section 5
Computing Specifications
5.1
CCIAM
The CCIAM functions using a desktop personal computer that is
networked to a GIS data server and has access to ArcInfo 8.1 and Spatial
Analyst licenses.
ESRI recommends the following system requirements for a desktop
computer using ArcInfo 8.1
(http://arconline.esri.com/arconline/sysreqs.cfm?R=many&PID=1):
Platform:
Intel based PC, 400MHz minimum,
650MHz recommended
OS:
Windows 2000 (fully supported), SP1 and
SP 2 optional
Memory/RAM:
128 minimum, 256 recommended
Hard Drive Space:
ArcInfo Desktop 8.1: 540MB NTFS,
754MB FAT
ArcInfo Workstation 8.1: 695MB NTFS
Disk spaces do not include the 50MB of
system drive space needed for installation.
(Typically C:\Winnt\System32)
Networking:
Simple TCP/IP, Network Card or Microsoft
Loopback Adapter
However, the CCIAM was developed using the following computing
infrastructure and the contractor recommends at least this level of
computing power:
Desktop Personal Computer
Platform:
HP P4, 1.7 GHZ
OS:
Windows 2000
Memory/RAM:
512 MB RAM BUS
Hard Drive Space:
20 GB
Florida Keys Carrying Capacity Study
Carrying Capacity/Impact Assessment Model Maintenance Model
5
Section 5
Networking:
100BT, access to ArcInfo 8.1 and Spatial
Analyst licenses.
GIS Data Server
Platform:
HP LC 2000 Dual P3/866 Mhz, RAID 5
OS:
Windows 2000
Memory/RAM:
1,512 MB DRAM
Hard Drive Space:
80 GB
Networking:
Fiber optic networking capabilities
Other:
Tape back up system or an equivalent back
up plan
Note: Microsoft Access and Excel 2000 are required (Microsoft Office
2000) in order for the CCIAM to run. Access is required for the
geodatabases, and Excel is required for the Hurricane Evacuation and
Canal modules.
5.2
RPT
The RPT is a lightweight ArcIMS application that serves interactive maps
using an HTML viewer and an image map service. The RPT was
developed using the following computing infrastructure:
Web Server:
Microsoft IIS
Java Servlet:
Servlet Exec
Mapping Software:
ArcIMS 3.1
OS:
Windows NT Server 4.0
Hard Drive Space:
20 GB
Networking:
Internet Service Provider or access to a T1
connection
Florida Keys Carrying Capacity Study
Carrying Capacity/Impact Assessment Model Maintenance Model
6
Section 6
Directory Structure
The CCIAM, all of the input data, and all of the results are contained
within the \FKCCS directory. This directory contains five subdirectories:
·
Canal_Model
·
Data
·
Hurricane_Model
·
Results
·
Scenario_Covs
The map document file, FKCCS.mxd, contains the VBA code to run the
GUI, analysis, and reporting of results. The FKCCS.mxd is the “model”
and it refers to all of the directories within the \FKCCS directory. It must
be located in \FKCCS in order for the CCIAM to execute correctly.
Additional information regarding the contents of the FKCCS.mxd is in
Section 9.5.
6.1
Canal_Model Directory
The \FKCCS\Canal_Model directory contains the canal model Microsoft
Excel spreadsheets developed by URS Corporation. The canal model
consists of ten canal spreadsheets, one loading spreadsheet, and one tide
stations spreadsheets. The application will copy these files, replace the
inputs, run the Excel macros, and place the results in the
\FKCCS\Results\Canal_Results directory. For a detailed discussion of the
Canal model, refer to the Canal Report.
Florida Keys Carrying Capacity Study
Carrying Capacity/Impact Assessment Model Maintenance Model
7
Section 6
Figure 6-1
6.2
Data Directory
All of the input GIS data required for the CCIAM to operate are located in
the \FKCCS\data directory (Table 6-1). These data include both vector
and raster datasets. When these data get updated, the dataset name, item
definitions in the attribute tables, and location must conform to the current
structure.
Florida Keys Carrying Capacity Study
Carrying Capacity/Impact Assessment Model Maintenance Model
8
Section 6
Table 6-1
Dataset Name
Advanced Identification of Wetlands
Overlay of Advanced Identification of Wetlands
and basins
Wasteshed Basins
Overlay of planning units and basins
Benthic communities of the Florida Keys
Overlay of Advanced Identification of Wetlands
and basins for the canal module
Wasteshed Basins for the canal module
Conservation and Recreational Lands
Grid to re-class unnecessary richness values in the
water
Topography
Florida Keys Aqueduct Authority Customer
Locations
Key deer habitat
Mile Markers on U.S. 1
Lower Keys marsh rabbit habitat
Municipalities of the Florida Keys
Monroe County Property Appraiser’s Parcels
Grid of planning units
Planning units
Historical vegetation
Propeller scars in seagrass
Silver Rice Rat habitat
Species richness grid
Grid of a Euclidean distance from roads
Grid of roads
Roadway line work
South Florida mainland
Official shoreline of the FKCCS
FKCCS study area
Monroe county subdivisions
Line work for US1
White crowned pigeon habitat
Potential habitat grids
Florida Keys Carrying Capacity Study
Carrying Capacity/Impact Assessment Model Maintenance Model
File Name in \FKCCS\data
adid
adid_basins
basins
basins_units
benthics
canal_adidbas
canal_basin
carl
clipwater
fema
fkaa-pts
keydeer
milemarkers
mrabbit
municipality
parcels
planunitland
planunits
primitiveveg
propscars
ricerat
rich
roaddist
roadgrid
roads
sf_mainland
shoreline
studyarea
subdivisions
us1
wcp
Species_GRIDS subdirectory with
18 ArcInfo grids, one for each of
the 17 species and one for the
species richness grid
9
Section 6
6.3
Hurricane_Model
The \FKCCS\Hurricane_Model directory contains the Miller Consulting,
Inc. Microsoft Excel spreadsheet model and a blank Microsoft Excel
spreadsheet (Figure 6-1).
Figure 6-2
The hurricane model is comprised of two related spreadsheets,
MODEL_V1.xls and DECLININGBACKTRAFF.xls. Miller Consulting,
Inc. has locked both of these spreadsheets so that their macros cannot be
accessed by the user. The HurricaneResults.xls is a template spreadsheet
where the scenario run’s hurricane results are temporarily placed until they
are loaded into the \FKCCS\results\SIF.mdb geodatabase.
6.4
Results Directory
The \FKCCS\Results directory is comprised of five sub-directories, plus
one directory for each scenario (e.g. c, sg1, etc.) and five geodatabases:
Directories:
·
Canal_Results
·
mol_layer_files
·
report_layer_files
·
Report_Template
·
Terrestrial_GRIDS
Florida Keys Carrying Capacity Study
Carrying Capacity/Impact Assessment Model Maintenance Model
10
Section 6
Geodatabases:
·
Scenario_lu.mdb
·
Scenarios.mdb
·
SIF.mdb
·
Terrestrial.mdb
·
Water.mdb
In the example below, the c_Web_Report and the sg1_Web_Report are
the scenario directories. These two directories contain all of the report
results (HTML reports, jpg maps, etc.) for the scenarios.
Figure 6-3
The Canal_Model directory contains the ten Excel spreadsheet canal
results and the associated Loading.xls spreadsheet. Each canal spreadsheet
is linked to the Loading.xls spreadsheet. To view the canal results, first
open the Loading.xls file, then open one of the ten canal .xls files, enable
the macros, and go to the Results worksheet to view results. For a more
detailed discussion of the canal results, please refer to the canal report.
Florida Keys Carrying Capacity Study
Carrying Capacity/Impact Assessment Model Maintenance Model
11
Section 6
The web_report directory contains the HTML, XML, XSL, and images
required for the two result reports. At the conclusion of the analysis VBA
code, the first action of the result reporting code is to copy this entire
directory to with a new name of the scenario number.
The mol_layer_files and report_layer_files directories contain the ArcInfo
layer files that reference feature classes and grids in the FKCCS\results
geodatabases and grid workspaces. These layer files are referenced by the
result reporting VBA code to produce maps. Layer files contain the
symbology for a dataset. The layer files in the \FKCCS\Results\
mol_layer_files\water_loads directory are created through VBA code,
whereas, all the other layer files have been created as static files that do
not change with each scenario. The water loads layer files are
dynamically created with VBA code on the fly because they require a
table join to a feature class before conversion to a layer file. Therefore a
simple change of data source will not work with these layer files to
accommodate different scenarios.
The terrestrial_GRIDS directory is an ArcInfo workspace that contains the
ArcInfo grids that result from the terrestrial analysis. It contains seventeen
potential habitat grids and one species richness grid for each scenario run.
The Scenario_lu.mdb geodatabase contains the feature classes of each
scenario’s land use layer and summary table. These feature classes are
identical to the land use coverages for each scenario in the
\FKCCS\scenario_covs directory. The socio-economic module uses an
ADO connection to the Scenario_lu.mdb to execute the SQL queries on
the feature class. Therefore, each scenario land use coverage is imported
into this geodatabase. This geodatabase also contains the US1 feature
class used in the GUI spatial queries.
The Scenarios.mdb geodatabase houses all of the user’s selections from
the GUI and contains no spatial data. Prior to executing the analysis VBA
code, all of the user’s GUI selections are written to this database.
All of the socio-economic, fiscal, and infrastructure results are located in
the SIF.mdb geodatabase. There are no spatial data in this database.
The terrestrial feature classes and statistic tables are housed in the
terrestrial.mdb geodatabase. This geodatabase, and the terrestrial_GRIDS
workspace, comprise all of the terrestrial results.
Florida Keys Carrying Capacity Study
Carrying Capacity/Impact Assessment Model Maintenance Model
12
Section 6
The Water.mdb geodatabase contains all of the wastewater, stormwater,
potable water and canal feature classes and tables (including cost tables).
It also contains twenty lookup tables, ending in LUT.
6.5
Scenario_Covs
The Scenario_covs directory is an ArcInfo workspace that contains each
scenario’s land use ArcInfo coverage. Once the user completes the
Administrative Information form, the parcels coverage in the
\FKCCS\data directory is copied to \FKCCS\Scenario_covs and given the
scenario prefix as its name. The coverage attributes are changed after the
user clicks the change attributes button on the Scenario Selections form.
This workspace is referenced by the socio-economic analysis VBA code
when it imports the scenario’s land use coverage into the
\FKCCS\results\SIF.mdb geodatabase.
Florida Keys Carrying Capacity Study
Carrying Capacity/Impact Assessment Model Maintenance Model
13
Section 7
Naming Conventions
All scenario-specific coverages, feature classes, and grids have the
scenario number as prefix and an acronym of what the data represent in
the model (Figure 7-1).
Figure 7-1
Scenario number
Description of feature
class - indirect impacts to
ADID
S99_INADID
The Terrestrial tabular statistics have the scenario number as a prefix, an
identifier for the impact being summarized, and a suffix “_stats” for each
table name (Figure 7-2).
Figure 7-2
Impact descriptor – lower keys
marsh rabbit
Scenario Number
S99_LKMR_stats
Statistics suffix
For selected results and look up tables, an additional identifier is used to
denote which module or component the impact descriptor references in the
database (Figure 7-3, Table 7-1).
Figure 7-3
Component descriptor –
Socio-economic
Scenario Number
Impact descriptor – Socioeconomic, Taxable Value result
S99_SE_ Taxable_Value
Florida Keys Carrying Capacity Study
Carrying Capacity/Impact Assessment Model Maintenance Model
14
Section 7
Table 7-1
Component Descriptor in Geodatabase
SE
F
I
SW
WW
PW
Z
R
T
RT
W
RW
GW
CAN
Reference
Socioeconomic module
Fiscal Module
Infrastructure Module
Stormwater Module
Wastewater Module
Potable water module
Miscellaneous land use
Miscellaneous results
Terrestrial Module
Result Terrestrial Module
Miscellaneous Water Lookup
Tables
Result Water Module
Groundwater
Canal Result Tables
Each look up table has a prefix representing the CCIAM module or
component and a suffix of “_LUT” (Figure 7-4). The module/component
prefix is identical to those noted in Table 7-1.
Figure 7-4
Module/Component
descriptor - Terrestrial
Prefix
Descriptor – Uplands thresholds
Look up table suffix
T_UPLANDS_LUT
Florida Keys Carrying Capacity Study
Carrying Capacity/Impact Assessment Model Maintenance Model
15
Section 8
CCIAM Installation Procedures
The CCIAM is designed to be contained entirely within the FKCCS
directory. Therefore, the installation procedures primarily involve
copying the contents of the CCIAM DVD to the server and ensuring that
the sub-directories are correctly located within the project directory.
1. Ensure that the hardware and software configuration is
compatible with the computing specifications outlined in
Section 5.1.
2. The FKCCS.mxd project must have 17 references available to
properly execute the model. The first 6 references in Table 8-1
are standard ArcMap references and should automatically be
available with all mxd’s. The remaining references should be
made available by turning them on. If the library is not
available, go to \FKCCS\data\Libraries and copy the files into
the appropriate directory on the \C: drive of the computer being
used to run the CCIAM.
Table 8-1
Location on Local Computer
NA
NA
NA
NA
NA
NA
C:\WINNT\system32
C:\arcgis\arcexe81\Bin
C:\arcgis\arcexe81\Bin
C:\Program Files\Common
Files\System\ado\
C:\Program Files\Microsoft
Office\Office\
C:\Program Files\Common
Files\Microsoft Shared\DAO\
Reference Name
Visual Basic for Applications
ESRI Object Library
OLE Automation
Normal
ESRI ArcMap Object Library
Microsoft Visual Basic for
Applications Extensibility 5.3
Microsoft Forms 2.0 Object Library
ESRI Spatial Analyst Extension
Object Library
ESRI Spatial Analyst Shared Object
Library
Microsoft ActiveX Data Objects 2.5
Library
Microsoft Excel 9.0 Object Library
Microsoft DAO 3.6 Object Library
Florida Keys Carrying Capacity Study
Carrying Capacity/Impact Assessment Model Maintenance Model
File Name
NA
NA
NA
NA
NA
NA
FM20.dll
EsriSpatialExt.
olb
EsriSpatialShared.
olb
msado15.dll
EXCEL9.OLB
dao360.dll
16
Section 8
Table 8-1 (Continued)
Location on Local Computer
C:\arcgis\arcexe81\Bin
C:\arcgis\arcexe81\Bin
C:\arcgis\arcexe81\Bin
C:\Program Files\Common
Files\System\ado\
C:\WINNT\system32
Reference Name
ESRI Coverage Resource Library
ESRI UIControls
ESRIutil automation server
Microsoft ActiveX Data Objects
Recordset 2.5 Library
Microsoft Scripting Runtime
File Name
CovRes.dll
UIControls.dll
strings.dll
msador15.dll
scrrun.dll
3. Copy the contents of the DVD to the server – ensure that the
directory structure remains intact. See Section 6 for details
regarding the directory structure.
4. Once the contents of the DVD have been placed on the data
server, check to ensure that the FKCCS.mxd map document
file is located at the top of the \FKCCS directory.
5. Check to ensure that there are five subdirectories within the
\FKCCS directory:
a.
Canal_Model
b.
data
c.
Hurricane_Model
d.
Results
e.
Scenario_Covs
6. To ensure that the CCIAM is operational, double-click on the
FKCCS.mxd. ArcMap will open and load the FKCCS.mxd into
the application.
7. Refer to the CCIAM User’s Manual for instructions on the
operation of the CCIAM.
Florida Keys Carrying Capacity Study
Carrying Capacity/Impact Assessment Model Maintenance Model
17
Section 9
Microsoft Excel Option Settings
The CCIAM uses Microsoft Excel files for both the Hurricane Evacuation
and the Canal models. In order for the VBA code to run correctly, the
Excel option settings must be set. Open Microsoft Excel, select ToolsOptions and the Options window will be displayed.
Two settings have to be checked. First, go to the Edit tab and make sure
the settings are the same as those displayed below.
Note: The “Ask to update automatic links” check box should NOT be
checked.
Figure 9-1
Florida Keys Carrying Capacity Study
Carrying Capacity/Impact Assessment Model Maintenance Model
18
Section 9
Next, go the Calculation tab and make sure the settings are the same as
those displayed below.
Note: The option button “Automatic” should be selected, meaning that
the calculations in the Hurricane Evacuation model will be made
automatically whenever new inputs are entered.
Figure 9-2
Florida Keys Carrying Capacity Study
Carrying Capacity/Impact Assessment Model Maintenance Model
19
Section 10
CCIAM Modeling Sequence and Structure
The CCIAM executes in three general steps: Graphical User Interface
(GUI), analysis, and result reporting (Figure 10-1). All of the VBA code
and SQL statements reside in the FKCCS.mxd located in the \FKCCS
directory. The look-up tables that are referenced by the CCIAM are
located in the geodatabase pertaining to that particular analysis. Additional
information regarding the assumptions, mathematics, and rationale for the
CCIAM can be found in the various delivery order reports and final report
for the study.
Figure 10-1
GUI
10.1
ANALYSIS
RESULT
REPORTING
Graphical User Interface
The GUI completes five tasks (Figure 10-2):
·
Collects information from the user through the controls on
the forms;
·
Checks the land use coverage to ensure that there is enough
land available to accommodate the user’s selections;
·
Copies the land use coverage to the \FKCCS\scenario_covs
workspace and names the coverage with the scenario
identification number (prefix);
·
Changes the land use coverage attribute values accordingly;
·
Populates the scenario geodatabase with the user’s
selections collected from the forms.
Florida Keys Carrying Capacity Study
Carrying Capacity/Impact Assessment Model Maintenance Model
20
Section 10
A
Figure 10-2
USER
INPUT
COPY COVERAGE
AND RE-NAME WITH
SCNEARIO ID
CHECK LAND
AVAILABILITY
CHANGE
ATTRIBUTE
TABLE
A
POPULATE
SCENARIO
DATABASE
REPEAT TASKS
FOR EACH
LOCATION
ANALYSIS
RESULT
REPORTING
These five tasks may be repeated depending upon how many locations the
user selects to change in their scenario. At the “CHANGE ATTRIBUTE
TABLE” step, all items in the land use coverage attribute table with an
“_NS” extension have their values changed according to the user’s input.
The letters “NS” refer to new scenario. The items that get changed from
GUI selections are noted in Table 10-1.
Table 10-1
Attribute in Coverage
LU_NS
DU_NS
DENSITY_NS
GFA_NS
FAR_NS
WWT_NS
EDU_NS
HOTELROOM_NS
10.2
Description
Land Use
Residential Dwelling Units
Residential Density
Non-residential Gross Floor Area
Non-residential Floor Area Ratio
Wastewater Treatment Type
Equivalent Dwelling Unit
Hotel Rooms
Analysis
The analysis VBA code executes all of the spatial and mathematical
operations of the CCIAM. While the CCIAM is comprised of analysis
modules (terrestrial, water, socio-economic, fiscal, infrastructure, and
canals), the VBA code is also organized into modules. Further discussions
will refer to the CCIAM analysis modules as “analysis modules” and
references to the VBA code will be “VBA modules.”
Florida Keys Carrying Capacity Study
Carrying Capacity/Impact Assessment Model Maintenance Model
21
Section 10
The order of analysis module execution is: terrestrial, water, canals,
socio-economic, fiscal, infrastructure, and hurricane (Figure 10-3). Each
module is further broken down into components. The components specific
to a module are itemized in the order they are executed with the module
box.
Figure 10-3
GUI
Terrestrial:
Water:
Socio-economic:
1.
2.
3.
4.
5.
1.
2.
1.
2.
6.
7.
8.
9.
10.
11.
12.
13.
Richness
Potential Habitat
Direct Impact to Habitat
Indirect Impact to Habitat
Forest Interior Birds
(5 species)
Direct Impact to Uplands
Indirect Impact to Uplands
Schauss Swallowtail
Butterfly
Key Largo Woodrat
Key Deer
Lower Keys Marsh Rabbit
White Crowned Pigeon
Silver Rice Rat
Stormwater to surface
Stormwater to
groundwater
3. Wastewater to
groundwater
4. Potable water demand
5. Potable water cost
6. Potable water aquaduct
adequacy
7. Stormwater costs
8. Wastewater costs
9. Stormwater flows
10. Wastewater flows
11. Groundwater flows
Fiscal:
1.
2.
Sum costs from
water
Expenditures
Infrastructure:
1.
2.
Level of service on
U.S. 1
Hurricane
Evacuation Model
Canal
Water
Quality
Impacts
Module
3.
4.
5.
6.
7.
8.
Population
Customers
available
Employees
required
Payroll
Total construction
costs
Total taxable value
Added
construction costs
Added taxable
value
RESULT
REPORTING
Note that the arrows in Figure 10-3 do not represent dependencies, or data
transfers, between analysis modules. Information regarding the placement
and structure of the data resulting from the analysis modules is provided in
Section 6. The following analysis module descriptions briefly outline the
process and data used for each computation in the CCIAM.
Terrestrial Module
Species richness - Developed parcels from the scenario land use coverage in
FKCCS\scenarios are selected, converted to a temporary grid as a recordset,
reclassified to zero and multiplied with the ROADGRID grid. This temporary
grid is added to the CLIPWATER grid and then multiplied with the species
rich grid located in FKCCS\data. The resulting grid is placed in
FKCCS\results\species_grids. Zonal statistics are created using the
Florida Keys Carrying Capacity Study
Carrying Capacity/Impact Assessment Model Maintenance Model
22
Section 10
PLANUNITLAND grid and the resultant richness grid. This statistics table is
placed in the terrestrial geodatabase located in FKCCS\results\terrestrial.mdb.
Potential Habitat (17 species) - Developed parcels from the scenario land use
coverage in FKCCS\scenarios are selected, converted to a temporary grid as a
recordset, reclassified to zero, multiplied with the ROADGRID grid. This
temporary grid is added to the CLIPWATER grid and then multiplied with
each species’ potential habitat grid located in FKCCS\data\species_grids. The
resultant grid is placed in FKCCS\results\species_grids.
Direct Impacts to Habitat - Developed parcels from the scenario land use
coverage in FKCCS\scenarios are selected to create a recordset. A UNION
operation is performed with this selected record set and the ADID coverage
located in FKCCS\data. The CODE_NS field for those areas that became
developed is updated with a value of ‘8’. The resultant feature class is located
in FKCCS\results\terrestrial.mdb. SQL statements summarize the data and
place a statistics table in FKCCS\results\terrestrial.mdb.
Indirect Impacts to Habitat - Developed parcels from the scenario land use
coverage in FKCCS\scenarios are selected, converted to a temporary grid as
a recordset, and a EUCLIDEAN DISTANCE operation is performed. The
recordset is multiplied with the ROADDIST grid and then reclassified to
one. A UNION operation is performed with the recordset and the ADID
coverage located in FKCCS\data. The CODE_NS field for those areas that
became developed is updated with a value of ‘8’. The resulting feature class
located in FKCCS\results\terrestrial.mdb. SQL statements summarize the
data and place a statistics table in FKCCS\results\terrestrial.mdb.
Forest Interior Birds (5 species) – SQL statements are executed using the
scenario’s ADID feature class located in FKCCS\results\terrestrial.mdb
and the T_HAB_REQ_LUT located in FKCCS\results\terrestrial.mdb to
generate individual statistics tables for each species. These tables are
located in FKCCS\results\terrestrial.mdb. Note that the ADID feature class
referred to here has already been created in the Direct Impacts to Habitat
analysis.
Direct Impacts to Uplands - SQL statements are executed using the scenario’s
ADID feature class located in FKCCS\results\terrestrial.mdb and the
T_UPLANDS_LUT located in FKCCS\results\terrestrial.mdb to generate the
statistics table. This table is located in FKCCS\results\terrestrial.mdb. Note
that the ADID feature class referred to here has already been created in the
Direct Impacts to Habitat analysis.
Florida Keys Carrying Capacity Study
Carrying Capacity/Impact Assessment Model Maintenance Model
23
Section 10
Indirect Impacts to Uplands - SQL statements are executed using the
scenario’s indirect impacts to ADID feature class located in
FKCCS\results\terrestrial.mdb and the T_UPLANDS_LUT located in
FKCCS\results\terrestrial.mdb to generate the statistics table. This table is
located in FKCCS\results\terrestrial.mdb. Note that the in direct impacts to
ADID feature class referred to here has already been created in the Indirect
Impacts to Habitat analysis.
Schauss Swallowtail Butterfly - SQL statements are executed using the
scenario’s ADID feature class located in FKCCS\results\terrestrial.mdb to
select hammocks within the species’ range and generate a statistics table.
This table is located in FKCCS\results\terrestrial.mdb. Note that the ADID
feature class referred to here has already been created in the Direct
Impacts to Habitat analysis.
Key Largo Woodrat - SQL statements are executed using the scenario’s
ADID feature class located in FKCCS\results\terrestrial.mdb to select
hammocks within the species’ range and generate a statistics table. This
table is located in FKCCS\results\terrestrial.mdb. Note that the ADID
feature class referred to here has already been created in the Direct
Impacts to Habitat analysis.
Key Deer - Developed parcels from the scenario land use coverage in
FKCCS\scenarios are selected to create a recordset. A UNION operation is
performed with this selected record set and the KEYDEER coverage located
in FKCCS\data. The HABITAT attribute for those areas that became
developed is updated with a value of ‘0’. The resultant feature class is
located in FKCCS\results\terrestrial.mdb. SQL statements summarize the
data and place a statistics table in FKCCS\results\terrestrial.mdb.
Lower Keys Marsh Rabbit - Developed parcels from the scenario land use
coverage in FKCCS\scenarios are selected to create a recordset. A UNION
operation is performed with this selected record set and the LKMR
coverage located in FKCCS\data. The HABITAT attribute for those areas
that became developed is updated with a value of ‘0’. A spatial query is
performed to select additional habitat patches that are within 500 meters of
developed areas. The RISK attribute for those records is updated with a
value of ‘1’. The resultant feature class is located in FKCCS\results\
terrestrial.mdb. SQL statements summarize the data and place two
statistics tables in FKCCS\results\terrestrial.mdb.
Florida Keys Carrying Capacity Study
Carrying Capacity/Impact Assessment Model Maintenance Model
24
Section 10
White Crowned Pigeon - Developed parcels from the scenario land use
coverage in FKCCS\scenarios are selected to create a recordset. A UNION
operation is performed with this selected record set and the WCP coverage
located in FKCCS\data. The ADULT and JUV attributes for those areas
that became developed is updated with a value of ‘0’. The resultant feature
class is located in FKCCS\results\terrestrial.mdb. SQL statements
summarize the data and place juvenile and adult statistics tables in
FKCCS\results\terrestrial.mdb.
Silver Rice Rat - Developed parcels from the scenario land use coverage in
FKCCS\scenarios are selected to create a recordset. A UNION operation is
performed with this selected record set and the RICERAT coverage located in
FKCCS\data. The HABITAT attribute for those areas that became developed
is updated with a value of ‘0’. A spatial query is performed to select
additional habitat patches that are within 500 meters of developed areas. The
RISK attribute for those records is updated with a value of ‘1’. The resultant
feature class is located in FKCCS\results\terrestrial.mdb. SQL statements
summarize the data and place two statistics tables in
FKCCS\results\terrestrial.mdb.
Water
Stormwater to Surface Loads – A UNION operation is performed with the
scenario land use coverage located in FKCCS\scenarios and the
ADID_BASINS coverages located in FKCCS\data that produces a new
feature class named ADBas, located in FKCCS\results\water.mdb. SQL
statements are executed using this feature class to calculate the stormwater
surface loads and place the statistics table in FKCCS\results\water.mdb.
Note that various look up tables are used in these SQL statements. These
look up tables are itemized in Section 9.4 of this manual. If BMPs are
selected by the user then the loads are reduced according to those
selections using the W_SWBMP_LUT look up table. The BMP
reductions are applied on a per-planning-unit basis. If the stormwater
master plan is selected by the user then the loads are reduced according to
the “Retention” BMP in the W_SWBMP_LUT look up table and is
applied to all planning units. Note: BMP reductions are ONLY applied to
records which show a land use change and are uplands (these records
make up a small subset of the total stormwater records).
Stormwater to Groundwater Loads - SQL statements are executed using
the feature class created in the Stormwater to Surface Loads operations to
calculate the stormwater surface loads and places the statistics table in
FKCCS\results\water.mdb. Note that various look up tables are used in
these SQL statements. These look up tables are itemized in Section 10.4
of this manual.
Florida Keys Carrying Capacity Study
Carrying Capacity/Impact Assessment Model Maintenance Model
25
Section 10
Wastewater to Groundwater Loads - A UNION operation is performed
with the scenario land use coverage located in FKCCS\scenario_covs and
the BASINS coverage located in FKCCS\data to produce a feature class
located in FKCCS\results\water.mdb. SQL statements are executed using
this feature class to calculate the wastewater to groundwater loads and
place the statistics table in FKCCS\results\water.mdb. Note that various
look up tables are used in these SQL statements. These look up tables are
itemized in Section 10.4 of this manual. If the wastewater master plan is
selected by the user, then the wastewater treatment types are changed
accordingly during the land use change phase of the GUI operation.
Potable Water Demand – SQL statements are executed using various look
up tables and dwelling unit data from the WW_Ground Table located in
FKCCS\results\water.mdb. Statistics tables are placed in
FKCCS\results\water.mdb. The look up tables are itemized in Section 10.4
of this manual.
Potable Water Costs – SQL statements are executed using various look up
tables that are itemized in Section 10.4 of this manual. Statistics tables are
placed in FKCCS\results\water.mdb.
Potable Water Aquaduct Adequacy – SQL statements are executed using
various look up tables that are itemized in Section 10.4 of this manual.
Statistics tables are placed in FKCCS\results\water.mdb.
Stormwater and Wastewater Costs - SQL statements are executed using
various look up tables that are itemized in Section 10.4 of this manual.
Statistics tables are placed in FKCCS\results\water.mdb.
Stormwater, Wastewater, and Groundwater Flows – SQL statements are
executed for each of the flow calculations using the feature classes noted
in the analysis to calculate each load. Statistics tables are placed in
FKCCS\results\water.mdb.
Socio-economic
The scenario land use coverage located in FKCCS\scenario_covs is
converted to a feature class and placed in FKCCS\results\scenario_lu.mdb.
All of the socio economic SQL statements are performed on this feature
class. The resulting statistics tables are placed in the SIF.mdb
geodatabase. Note that various look up tables are used in these SQL
statements. These look up tables are itemized in Section 10.4 of this
manual.
Florida Keys Carrying Capacity Study
Carrying Capacity/Impact Assessment Model Maintenance Model
26
Section 10
Fiscal
SQL statements are executed using data from the water cost analysis and
the socioeconomic module to produce government costs tables in the
SIF.mdb geodatabase. Note that various look up tables are used in these
SQL statements. These look up tables are itemized in Section 10.4 of this
manual.
Infrastructure
Level of Service on U.S. 1 – SQL statements summarize acreages of
residential and tourist-related land uses from the scenario land use feature
class located in FKCCS\results\scenario_lu_mdb and calculate the level of
service along the roadway. The resulting statistics table is placed in the
SIF.mdb geodatabase.
Hurricane Evacuation Model – This is a Microsoft Excel spreadsheet
model created by Miller Consulting, Inc. It has been locked by Miller and
can not be modified except for those cells that accept changes from the
user. SQL statements summarize dwelling unit data and pass these data to
the appropriate cells in the spreadsheet. The model also requires input
from the user that is obtained through the CCIAM GUI. Once this
information is passed to the model, it runs, and SQL queries are executed
to summarize the results into a table located in the SIF.mdb geodatabase.
Canal Impacts
This model consists of eleven Excel spreadsheets, ten canal spreadsheets
and one Loading spreadsheet. The code used in the canal model is very
similar to that used in the wastewater/stormwater module. The parcels are
unioned with the canal_basin and the canal_adidbas coverages, rather than
the basins and adid_basins coverages, as used in the water code. The
resulting two feature classes, named xx_Can_Basins and xx_Can_ADBas,
are then used to calculate the canal stormwater and wastewater loads and
flows per watershed ID. The final result tables are named
xx_Can_WW_Final and xx_Can_SW_Final (where xx represents the
unique scenario ID or prefix). The data in these two tables serve as the
inputs into the canal Loading.xls spreadsheet. The feature classes and
tables for the canal model are located in the Water.mdb geodatabase.
The second part to the canal model involves copying the results from the
WW and SW final tables into the Loading.xls file (load and flow data per
watershed ID), then doing a save as, saving the file as xx_Loading.xls.
Next, each individual canal Excel file is opened, the macros enabled, the
link established (with xx_Loading.xls), and the Model_Reset and
Florida Keys Carrying Capacity Study
Carrying Capacity/Impact Assessment Model Maintenance Model
27
Section 10
Flush_Model Excel macros are run. The file is then saved using the new
scenario prefix (example: sg1_208 Marathon Model.xls, where sg1
represents the scenario prefix). This is repeated ten times, once for each
canal Excel spreadsheet.
For a more detailed discussion of the canal model, please refer to the canal
report.
Additional information regarding each analysis module can be found in
the delivery order report pertaining to that part of the FKCCS and the
FKCCS Final Report. However, module information specific to the
operation and management of the CCIAM is noted in Table 10-2.
Table 10-2
Analysis Module
Terrestrial
Water
Socio-economic
Fiscal
Infrastructure
Canal Impacts
Operation/Maintenance Comment
· Most computationally intensive
· Overlay analyses result in feature classes
· Raster analyses result in ArcInfo grids
· Two spatial overlay processes occur that result in
feature classes. The remaining analysis is
performed using SQL statements.
· Wastewater requires data from the land use
attributes EDU_NS and WWT_NS
· Stormwater BMPs requires data from user input
from GUI
· Master plan implementation requires data from user
input from GUI
Scenario land use coverage converted to feature class
prior to executing SQL statements.
· Requires taxable value data from the land use
feature class
· Requires cost data from water module
· Requires population data from socio-economic
Hurricane Evacuation Model is a MS Excel spreadsheet
model that is external to the CCIAM. It requires data
from user input in the GUI and residential dwelling
units.
This model consists of 11 Excel spreadsheets, 10 Canal
spreadsheets, and 1 Loading spreadsheet. It requires
the wastewater and stormwater loads and flows by
watershed ID as inputs.
Florida Keys Carrying Capacity Study
Carrying Capacity/Impact Assessment Model Maintenance Model
28
Section 10
There is not a one-to-one relationship between analysis modules and VBA
modules. A VBA module may be used by more than one analysis module.
Table 10-4 in Section 9.5 itemizes each VBA module and where it is used
in the CCIAM.
10.3
Result Reporting
CCIAM results include maps, tables, and charts. The result reporting VBA
code and SQL queries build these outputs dynamically for each scenario
(Figure 10-4).
Figure 10-4
GUI
ANALYSIS
COPY
TEMPLATE
HTML
DIRECTORY
LOAD
LAYER
FILES
INTO
DATA
FRAME
CHANGE
LAYER
FILE
SOURCE
CHANGE
MAP
TITLE &
LEGEND
CONVERT
MAP TO
JPG
EXECUTE SQL
TO GENERATE
TABLES AS XML
FILES
Upon completion of the analysis portion of the CCIAM, a blank HTML
directory template is copied to the FKCCS\results directory and renamed
to the scenario identification number (Figure 10-5).
Florida Keys Carrying Capacity Study
Carrying Capacity/Impact Assessment Model Maintenance Model
29
Section 10
Figure 10-5
The layer files in the \FKCCS\Results\mol_layer_files\water_loads
directory are created through VBA code, whereas, all the other layer files
have been created as static files that do not change with each scenario.
The water loads layer files are created with VBA code dynamically
because they require a table join to a feature class before conversion to a
layer file. Therefore a simple change of data source will not work with
these layer files to accommodate different scenarios.
A predetermined map layout and design is populated with the symbolized
data. Map titles and legends are changed using VBA and ArcObjects.
The layout is then exported as a JPG to the webreport\web_fields\
images\maps directory.
When the FKCCS.mxd is opened, it will have zero layers in the Data
View. In the Layout View, the project will have a data frame, neat line
and FKCCS logo. These three objects should never get deleted from the
Layout View. When the user runs the GUI, three base layer files
(Planning_Units.lyr, us1.lyr, and Roads.lyr) and the xx_lu coverage will
be automatically added to the table of contents.
A series of SQL statements are executed to generate statistics tables that
are formatted for the Scenario Report and Model Output Listing. These
tables are not physical tables in the geodatabases. Once the SQL query is
executed the recordset is immediately converted to XML and placed in the
XML directory. The data to produce the tables for the two reports are
Florida Keys Carrying Capacity Study
Carrying Capacity/Impact Assessment Model Maintenance Model
30
Section 10
generated as part of analyzing the scenario. Therefore, it is unnecessary to
create another large set of formatted tables for the HTML reports.
The two HTML documents (Scenario Report and Model Output Listing)
are located in \webreport. They have been built using HTML, JavaScript,
and XML Stylesheets that point to the JPGs and XML files located in the
appropriate sub-directories. These two HTML documents, and their
supporting sub-directories of data constitute the reports generated for each
scenario. Each report can be printed. It is suggested that the Scenario
Report be provided to the planners in both hardcopy and digital format.
The Model Output Listing can be printed; however, it is envisioned that
this report and all of its components be written to CD-ROM and simply
accompany the Scenario Report.
After the FKCCS CCIAM code is run (either with or without the GUI), the
last step is to run the map creation code.
Note: * As mentioned in the User’s Manual, the creation of Jpeg maps had
to be separated from the CCIAM due to limitations with the ESRI
JpegExporter object.
When the Jpeg map generating code is run (using the “Maps” button), the
code will delete all previous layers in the table of contents and add the
three base layers as shown in Figure 10-6.
Figure 10-6
Florida Keys Carrying Capacity Study
Carrying Capacity/Impact Assessment Model Maintenance Model
31
Section 10
10.4
Look Up Tables
The CCIAM references 63 look up tables. Each look up table conforms to
the naming convention outlined in Section 7. The CCIAM is designed so
that each coefficient, or look up value, can be easily updated with more
current data. Therefore, no thresholds are “hard coded” into the model, but
are located in tables that are referenced by the VBA code. Table 10-3
briefly describes the location and purpose of each look up table in the
CCIAM.
Table 10-3
Geodatabase
Look-up Table
scenario_lu
Z_LuPC_LUT
scenario_lu
Z_Zones_LUT
scenario_lu
Z_HabitatOSR_LUT
scenario_lu
RZ_Pugeo_LUT
scenario_lu
RZ_Result_LUT
scenario_lu
R_Feature_Class_List_LUT
scenario_lu
scenario_lu
scenario_lu
scenario_lu
scenario_lu
R_HabitatList_LUT
R_KeySegment_LUT
R_LYRLIST_LUT
R_PlanUnitList_LUT
Z_Ave_EDU_LUT
scenario_lu
Z_PrimeVeg_LUT
scenario_lu
Z_RE2_DuplicatesOnly_LUT
SIF
F_Existing_Expenditures_CC_LUT
SIF
F_Capital_Annualized_LUT
SIF
F_Gov_Expenditures_LUT
SIF
SIF
F_School_Cost_LUT
H_TouristDU_LUT
SIF
SIF
I_Length_of_US1_LUT
I_LOS_LUT
Florida Keys Carrying Capacity Study
Carrying Capacity/Impact Assessment Model Maintenance Model
Description
Land Use / PC code cross reference for
pre-processing the parcel data
Zoning / PC code cross reference for
pre-processing the parcel data
Habitat development ratio for preprocessing the parcel data
Planning unit / key segment cross
reference
Planning unit / key segment, used for
cross tab queries
List of feature classes to load for
median calculation
Lost of habitat categories
List of key segments
List of layer files to process
List of Planning Units
List of average dwelling units for non
residential parcels.
List of primitive vegetation types by
RE2 (69,745 unique RE2 numbers).
List of duplicate RE2 numbers (RE2
numbers with a count greater than 1).
Current conditions expenditures
(millions of dollars)
Annual debt payment (millions of
dollars)
Gov. expenditures by jurisdiction
(millions of dollars)
Constants used in school costs
Percent tourist dwelling units by
evacuation zone
Length of US1 by planning unit (miles)
LOS thresholds for US 1 (miles per
hour)
32
Section 10
Table 10-3 (Continued)
Geodatabase
Look-up Table
SIF
I_Regression_Coef_LUT
SIF
SIF
SE_ConstCosts_LUT
SE_DemoCoef_LUT
SIF
SE_Employment_Coef_LUT
SIF
SE_FloorArea_LUT
SIF
SE_MCPD_LUT
SIF
SIF
SIF
SIF
SIF
SIF
SIF
SE_PropertyValues_LUT
SE_PU_LUT
SE_WageRates_LUT
SE_Construction_Cost_CC_LUT
SE_Population_CC_LUT
SE_Taxable_Value_CC_LUT
RI_Pugeo_LUT
SIF
RI_Result_LUT
terrestrial
terrestrial
terrestrial
T_Adid_LUT
T_Hab_Req_LUT
T_Indirect_ReMap_LUT
terrestrial
terrestrial
T_Uplands_LUT
RT_Pugeo_LUT
terrestrial
RT_Result_LUT
terrestrial
RT_Rich_LUT
water
water
W_EDU_LUT
W_EMC_LUT
water
W_GWRed_LUT
water
W_LU_LUT
water
W_Pollcon_LUT
water
water
W_PU_LUT
W_PUWS_LUT
Florida Keys Carrying Capacity Study
Carrying Capacity/Impact Assessment Model Maintenance Model
Description
Regression coefficients for traffic
equation
Socioeconomic cost coefficients
Socioeconomic demographic
coefficients
Socioeconomic population/employment
coefficients
Socioeconomic gross floor area
coefficient
Socioeconomic Monroe County census
statistics
Taxable value coefficients
List of planning units
Annual wage rates
Current conditions construction costs
Current conditions population
Current conditions taxable value
Planning unit / key segment cross
reference
Planning unit / key segment, used for
cross tab queries
ADID vegetation types
Forest interior birds habitat thresholds
Remap table to reclassify indirect
impacts grid
Upland vegetation threshold
Planning unit / key segment cross
reference
Planning unit / key segment, used for
cross tab queries
Planning unit number reference in
xx_rich_stats table
GPD per EDU by Planning unit
EMC and RC values by major land use
& load type
Groundwater reduction applied to
saturated & unsaturated
Major land use category by land use
description
Pollution concentration by wastewater
treatment type
Reference list of planning units
Reference list of planning unit /
watershed ID combinations
33
Section 10
Table 10-3 (Continued)
Geodatabase
Look-up Table
water
W_PW_Aquaduct_LUT
water
water
W_PW_Variables_LUT
W_Rainfall_LUT
water
water
water
W_SW_Public_Costs_LUT
W_SWBMP_LUT
W_SWDCIA_LUT
water
water
W_US1_Flows_LUT
W_US1PPD_LUT
water
water
water
W_Var_LUT
W_WS_LUT
W_WW_Costs_LUT
water
W_WW_MP_Costs_LUT
water
W_PW_Existing_EDUs_CC_LUT
water
RW_Pugeo_LUT
water
RW_Result_LUT
10.5
Description
Aqueduct Adequacy template
(in geographic order)
Potable water and cost constants
Rainfall data, this table is presently not
used in the CCIAM
Public stormwater cost values
Stormwater BMP reduction values
Stormwater reduction values, presently
not used in the CCIAM
US1 stormwater flows in GPD
US 1 stormwater loads in pounds per
day
Water load constants
Reference list of watersheds
Wastewater cost coefficients by
treatment
Wastewater costs when implementing
MP
Sum of EDU’s by planning unit for
current conditions
Planning unit / key segment cross
reference
Planning unit/key segment, used for
cross tab queries
Description of VBA modules in the FKCCS.mxd
The FKCCS.mxd is an ArcGIS 8.1 map document file that houses 31
VBA modules. These VBA modules perform all of the functions of the
GUI, analysis, and reporting of results. Where possible, global variables
are declared and repeatedly used throughout the code. In addition, some
VBA modules are called in multiple instances to execute the model.
Table 10-4 itemizes the VBA modules and provides a brief description of
the VBA module’s use in the model. Note that each VBA module has a
header with descriptive information and each procedure within the module
is documented with a bulleted description of the action.
Florida Keys Carrying Capacity Study
Carrying Capacity/Impact Assessment Model Maintenance Model
34
Section 10
Table 10-4
Number of
Procedures/
Functions
14
CCIAM Step
GUI
Module Name
a_Save_Scenario_to_Access
GUI
a_modFromQuery
GUI
a_modParamCode
GUI
a_ChangeTo_Method2
Analysis & GUI
a_modPublicSettings
Analysis
a_Create_Water_Layer_Files
Analysis
a_Analysis_Module
Description
Save GUI selections to the
scenarios.mdb
Get the land use "From"
selection set
Form opening and closing
sequence
Change the “NS” fields in the
“xx_lu” parcels coverage.
Listing of public functions and
procedures used throughout the
CCIAM.
Creates layer files for SW and
WW loads
Contains the union procedure
Analysis
a_Fiscal_Stats
Calculates all the fiscal statistics
11
Analysis
a_Hurricane_Evac
4
Analysis
a_Level_of_Service
Analysis
a_Main_Module
Runs the Hurricane Excel
spreadsheet
Calculates the level of service
statistics
Used to call the main procedures
Analysis
a_modFunctions
8
Analysis
a_Soc_Economic_Mod
Analysis
a_Socio_Economic_Stats
Analysis
a_Terrestrial_Impacts_Rest
Contains 3 functions, e.g. get
developed parcels
Import the land use coverage into
scenario_lu; Call main Socio
procedures
Calculates all the socio economic
statistics
Create indirect impact rasters
Analysis
a_Terrestrial_Mod_Rest
Analysis
a_Terrestrial_Species_Rest
Analysis
a_Terrestrial_Stats_Mod_Rest
Analysis
a_Water_Module_Rest
Analysis
a_Water_Stats_Rest
Analysis
a_Canal_Mod_Rest
Call terrestrial union and statistic
procedures
Create habitat species feature
classes for LKMR, Rice Rat,
WCP
Run SQL's to create terrestrial
statistic tables
Perform 2 water unions; Call
main water procedure
Calculates all the water loads,
flows, potable water, and costs
Calculate the canal wastewater
and stormwater loads and flows
by watershed ID.
Florida Keys Carrying Capacity Study
Carrying Capacity/Impact Assessment Model Maintenance Model
6
4
32
19
9
1
5
1
1
27
11
2
8
15
1
42
23
35
Section 10
Table 10-4 (Continued)
CCIAM Step
Analysis
Module Name
a_Canal_Run_Excel
Result Reporting
Result Reporting
Result_Create_JPG_Files_
Median
Result_Gen_Folders
Result Reporting
Result_Infra_SQL
Result Reporting
Result_LU_SQL
Result Reporting
Result_Scenarios_SQL
Result Reporting
Result_Terr_SQL
Result Reporting
Result_Water_SQL
Result Reporting
Result_XMLQueries
Result Reporting
Result_Run_Map_Creation
Description
Run the 10 Excel canal models
and create new Excel. results.
Create jpg maps median and
values
Create reporting directory
structure for new scenario, copy
template HTML files to web
report directory
Create XML tables for SIF
Number of
Procedures/
Functions
3
40
2
16
Create XML table for
Scenario_lu
Create XML tables for Scenarios
5
Create XML tables for
Terrestrial
Create XML tables for Water
12
Call all XML table generating
modules
Calls jpg creation procedures
4
2
8
2
Note: The “_Rest” at the end of some of the names means the VBA
module was modified to accommodate restoration scenarios.
Additional notes concerning the execution of the CCIAM:
·
If the application stops in the middle of code execution, the
FKCCS.mxd project should not be saved when closed. The
code creates objects and adds these objects to the layout
view. If the FKCCS.mxd project is saved, then these
objects will get saved, which means the FKCCS.mxd
project will not be in its pre-run set up state. If the code
runs through without stoppage, then it is OK to save the
FKCCS.mxd.
Florida Keys Carrying Capacity Study
Carrying Capacity/Impact Assessment Model Maintenance Model
36
Section 10
The VBA modules are shown in Figure 10-7 below:
Figure 10-7
Florida Keys Carrying Capacity Study
Carrying Capacity/Impact Assessment Model Maintenance Model
37
Section 10
10.6 Description of VBA Forms in the FKCCS.mxd
The FKCCS.mxd contains 32 forms. These forms make up the Graphical
User Interface, also referred to by the acronym, “GUI”. The forms
provide a front end to allow the user to build a custom land use scenario,
which can then be analyzed by the CCIAM. The forms gather the users
selections, which are then saved to the Scenarios.mdb database located in
the FKCCS\Results directory. To actually see images of all the forms,
please refer to the User’s Manual (under CCIAM Step-by-Step
Guidelines).
The 32 VBA forms are shown in Figure 10-8 below.
Figure 10-8
Florida Keys Carrying Capacity Study
Carrying Capacity/Impact Assessment Model Maintenance Model
38
Section 11
Restoration Scenarios
The restoration scenario requires its own section because it is a special
case. Different procedures are called in the Analysis modules if the
scenario is a restoration scenario.
The GUI will change all selected parcels to “open space restored” and all
other “NS” fields to zero, except WWT_NS (wastewater treatment type),
which will remain as is. The land use “open space restored” was added to
the W_LU_LUT lookup table in the Water.mdb geodatabase.
All feature classes created had to have the CODE_NS (from Adid
coverage) and DESCRIPTION fields changed to the primitive vegetation
type (which comes from the Z_PrimVeg_LUT lookup table in the
Scenario_lu.mdb geodatabase) for restored parcels.
The problem occurred because not all feature classes had the CODE_NS
field (it was not needed in some feature classes for non restoration
scenarios). Therefore, some additional unions had to be performed for
restoration only. As well, all the SQL statements run on the CODE_NS
field had to be modified to pick up the new primitive vegetation types.
The T_Adid_LUT lookup table in the Terrestrial.mdb had to be updated to
reflect the six primitive vegetation types, as shown below.
Figure 11.1
Florida Keys Carrying Capacity Study
Carrying Capacity/Impact Assessment Model Maintenance Model
39
Section 11
Rather than perform a union with the primitiveveg coverage, a new lookup
table was created named Z_PrimVeg_LUT located in the Scenario_lu.mdb
geodatabase. This lookup table is used to determine the primitive
vegetation type (“AGGCODE”) for each unique RE2 number in the
parcels coverage, see Figure 11-2.
Figure 11-2
(Entire table contains 69,745 records.)
The Z_PrimVeg_LUT table was created manually using the following
steps:
1) Identity of parcels with primitiveveg to create parc_prim (at Arc/Info
prompt),
2) Summarize parc_prim on RE2 – Max_Area, First_AGGCODE to
create PrimVeg.dbf (using ArcMap),
3) Summarize parc_prim on RE2 – Sum_Area to create PrimVeg2.dbf
(using ArcMap),
4) Table join of PrimVeg.dbf and PrimVeg2.dbf using RE2 as common
field, add a new field named “perc”, calc perc = Max_Area /
Sum_Area, if perc < 0.5 then calc AGGCODE = “wa”, else calc
AGGCODE = First_AGGCODE (using ArcView),
5) Import the table created in step 4 into the Scenario_lu.mdb
geodatabase (using ArcCatalog).
Florida Keys Carrying Capacity Study
Carrying Capacity/Impact Assessment Model Maintenance Model
40
Section 11
To summarize, the primitive vegetation type will be changed to water
(“wa”) for the entire parcel if the largest polygon is less than half the area
of the parcel, or else the primitive vegetation type will be changed to
whatever the largest polygon is.
Note: Since the application does not actually perform a union with the
primitive vegetation coverage, the entire parcel will be changed to the
primitive vegetation type listed in the Z_PrimVeg_LUT lookup table (at
least 50% of the parcel will consist of this primitive vegetation type).
Florida Keys Carrying Capacity Study
Carrying Capacity/Impact Assessment Model Maintenance Model
41
Section 12
CCIAM Data Updates
The following section describes the procedures for updating information
housed in the CCIAM’s personal geodatabases, coverage workspaces, and
grid workspaces. There is a clear distinction between updating the data as
they are organized and structured in the current model versus adding data
or changing look up table values to reflect a more current scientific
understanding or user preference. For example, if a new land cover layer
becomes available, there are procedures outlined in this document to assist
the steward in pre-processing those data for use in the CCIAM. However,
if new scientific understanding allows for a more refined analysis of the
indirect effects of development on habitat, and additional look up tables or
data are required for this analysis, then that is a model enhancement. The
steward should work closely with the Florida Department of Community
Affairs, South Florida Regional Planning Council, and Monroe County to
reach consensus on data updates versus model enhancements.
12.1
Parcel Updates
The Monroe County Property Appraiser’s (MCPA) Office parcel GIS
layer is the land use dataset used in the CCIAM and the steward should
have an understanding of how these data are maintained by the MCPA.
The tax roll data are maintained in a Computer Assisted Mass Appraisal
(CAMA) database. The parcel GIS layer is maintained in an ArcInfo 7.x
Librarian system. Therefore, the MCPA must extract both the tax roll, as
a DBF file, and the parcel geometry, as an ArcInfo export file, for use in
the CCIAM. These files are large. The tax roll DBF is approximately
80mb and the exported parcel geometry is approximately 450 mb. Since
these files have been extracted from two computing systems, they must be
joined using the real estate identification number, RE2. Note that there can
be multiple polygons for one RE2, creating a one-to-many relationship
between the tax roll record and the parcel GIS layer (Figure 12-1).
Therefore, it is vital that a frequency be run on RE2 to obtain the
correct acreage, floor area, etc. for each parcel. A simple summary on
the attribute table will result in double counting of parcels with more
than one polygon.
Florida Keys Carrying Capacity Study
Carrying Capacity/Impact Assessment Model Maintenance Model
42
Section 12
Figure 12-1 Example of multiple polygons for one RE2
Both the spatial component and attribute data have been enhanced to
support CCIAM analyses. All of these enhancements represent preprocessing activities that should be completed if new parcel data become
available for use in the CCIAM.
First, the spatial accuracy of the parcel data was manually corrected by
moving contiguous polygons into a position that visually lined up with the
shoreline on the Digital Orthophoto Quarter Quadrangles. The contractor
made the decision not to break up contiguous “clumps” of parcels in order
to maintain the integrity of shared boundaries. Note, that due to the
rotation, skew, and shift in the parcel geometry not all parcels line up
correctly with the shoreline. However, this correction does provide a
spatial enhancement to the parcels and increases the accuracy of the
CCIAM. Since this was a manual, visual, process it is doubtful that the
outcome of future corrections will be identical to the current accuracy of
the GIS layer. However, the goal of this correction was to obtain a “best
fit” until a systematic spatial correction process is undertaken by the
county. Review the Delivery Order 10 report for further details regarding
parcel corrections.
Florida Keys Carrying Capacity Study
Carrying Capacity/Impact Assessment Model Maintenance Model
43
Section 12
Second, there are well over 55 attribute fields associated with the Monroe
County tax roll. Many of these fields are not required by the CCIAM. In
addition, the contractor added several fields to the attribute table while
developing the CCIAM. Table 12-1 itemizes each field, where it
originated, and, if it was derived for the CCIAM how it was calculated in
the table.
Table 12-1
Items in the CCIAM Parcel Attribute Table
Item in
Attribute Table
RE2
NAME
PC
FLA
SALE1
YRBLT
PBLDG1
PLAND1
PTAX1
PLAN_UNIT
KEY_SEGMENT
WW_HOTSPOT
MUNICIPALITY
EVAC
Description of Item
Real Estate Identification
Number
Name of property owner
Property Code
Floor Living Area
Last sale
Year the structure was built
Taxable value of the structure
Taxable value of the land
Total taxable value
Method to
Calculate the Value
Obtained directly from tax roll
Obtained directly from tax roll
Obtained directly from tax roll
Obtained directly from tax roll
Obtained directly from tax roll
Obtained directly from tax roll
Obtained directly from tax roll
Obtained directly from tax roll
Obtained directly from tax roll
GIS process - Overlay parcels
Assign parcels to planning units
and plan_units
Manual activity - Visually
inspect parcels to determine if
they are located in the upper,
Assign parcels to key segment
middle, or lower keys.
Calculate attribute
accordingly.
Manual Activity - Visually
inspect parcels using the maps
from the CH2MHill Sanitary
Assign parcels to wastewater
Wastewater Master Plan to
hotspots
assign parcels to hotspots.
Calculate attribute
accordingly.
Manual activity – visually
inspect the parcels with the
municipality layer to
Assign parcels to municipality determine which jurisdiction
the parcel belongs to.
Calculate the attribute
accordingly.
Manual activity - Assign
Assign parcels to hurricane
parcels to hurricane
evacuation zones
evacuation zones according to
Florida Keys Carrying Capacity Study
Carrying Capacity/Impact Assessment Model Maintenance Model
44
Section 12
Table 12-1
Items in the CCIAM Parcel Attribute Table
(Continued)
Item in
Attribute Table
ZONE
ACRES
SQFOOTAGE
LU
HOTEL_ROOMS
DU_AVE
DENSITY
RES_SUIT
NONRES_SUIT
MAX_ALLOW_DU
Description of Item
Method to
Calculate the Value
the Miller Consulting
Hurricane Evacuation Report
GIS process - Link the zoning
field obtained from the MCPA
Assign zoning to each parcel
to the parcels using RE2 as the
unique identifier
GIS process - Run a frequency
on RE2 and area. Add an item,
ACRES, to the frequency table
and calculate ACRES =
Calculate acreage for each parcel
AREA / 43560. Do a
JOINITEM back to the parcel
attribute table using RE2 as
the unique identifier.
GIS process - Run a frequency
on RE2 and area. Add an item,
SQFOOTAGE, to the
Calculate the square footage for frequency table and calculate
each parcel
SQFOOTAGE = AREA. Do a
JOINITEM back to the parcel
attribute table using RE2 as
the unique identifier.
Manual activity - See the land
use categories Table 10-2.
Calculate land use categories
Select the PC codes and
calculate the LU accordingly.
Assign hotel rooms to parcels
Manual activity.
Calculate dwelling units per
See dwelling unit guidelines
parcel
Manual activity - Divide the
Calculate residential density
du_ave by ACRES
Calculate residential suitability
for development on vacant
See suitability guidelines
parcels
Calculate non-residential
suitability for development on See suitability guidelines
vacant parcels
Manual activity – Select
Calculate maximum allowable vacant residential parcels and
multiply ACRES by the
dwelling units for vacant
residential parcels
allotted dwelling units
according to the ZONE value.
Florida Keys Carrying Capacity Study
Carrying Capacity/Impact Assessment Model Maintenance Model
45
Section 12
Table 12-1
Items in the CCIAM Parcel Attribute Table
(Continued)
Item in
Attribute Table
MAX_FLOORAREA
MAX_HOTEL
REDEV_VALUE
WATERFRONT
ADJ_US1
VACANT_CONS
SUB_ID2
SUBDIV_PERC
FAR
Method to
Calculate the Value
See the zoning allotted density
table.
Manual activity – Select
vacant non-residential parcels
Calculate maximum allowable
and multiply SQFOOTAGE
gross floor area for vacant nonby the allotted floor area
residential parcels
according to the parcel's
ZONE value.
Manual activity – Select
Calculate maximum allowable vacant commercial parcels and
multiply the ACRES by the
hotel units for vacant
allotted hotel units according
commercial parcels
to the ZONE value.
Calculate the ratio of the
Manual activity - Divide
building taxable value to the
PBLDG1 by PLAND1
land taxable value
Manual activity - visually
Identify waterfront parcels
inspect parcels to find
waterfront properties
Manual activity - Visually
inspect parcels to determine
Identify parcels adjacent to US 1
which ones are adjacent to
US1.
Identify parcels within 300 feet
of at least 10 acres of contiguous
see calculation guidelines
undisturbed habitat or of a
publicly owned conservation
area.
GIS process - Overlay with
subdivisions layer from
Identify parcels in subdivisions MCPA. NOTE: must be done
prior to manually shifting
parcels.
Manual activity - Summarize
the number of developed
Identify subdivision percentage
parcels and divide by the total
developed
number of parcels in the
subdivision to get the ratio.
Manual activity - Divide the
GFA column by the
Calculate floor area ratios
SQFOOTAGE column.
Description of Item
Florida Keys Carrying Capacity Study
Carrying Capacity/Impact Assessment Model Maintenance Model
46
Section 12
Table 12-1
Items in the CCIAM Parcel Attribute Table
(Continued)
Item in
Attribute Table
Description of Item
GFA
Calculate gross floor area
EDU
Assign EDUs to each parcel
Assign wastewater treatment to
each parcel
WWT
Method to
Calculate the Value
Manual activity - Add an item
called GFA and calc GFA
equal to FLA. This was done
simply to make the item more
intuitive and still retain the
original data field.
See Delivery Order 8 Report
See Delivery Order 8 Report
Table 12-2
Land Use Categories
Land Use in the FKCCS
Vacant Land
Residential (high, medium, low density)
Retail
Office
Service
Marina
Commercial Entertainment
Golf Course
Hotel/Motel
Light Industrial
Heavy Industrial
Warehouse/Storage
Public Facilities and Services
Institutional
Agriculture
Open Space and Recreation
Military
Submerged Lands
Corresponding PC Values
in the Tax Roll
00, 10, 40, 70
01, 02, 03, 04, 05, 06, 07, 08, 09, 36
11, 12, 13, 14, 15, 16
17, 18, 19, 23, 24
21, 22, 25, 26, 28, 29, 30, 61
27
31, 32, 33, 34, 35, 37
38
39
41, 44, 45, 46
42, 43, 47
48, 49
83, 84, 85, 91, 94
20, 71, 72, 73, 74, 75, 76, 77, 78, 79,
90
69
80, 82, 86, 87, 88, 89, 92, 99
81
95
Florida Keys Carrying Capacity Study
Carrying Capacity/Impact Assessment Model Maintenance Model
47
Section 12
Updating the parcels can take three forms:
·
First, the spatial accuracy of the parcel geometry is
improved either manually or through a systematic process.
As long as the real estate (RE2) attribute does not change, a
simple join of the attribute table to the new GIS layer can
be performed to update the table of the new layer.
·
Second, the tax roll data are updated by the MCPA and,
therefore, the attribute data in the CCIAM parcels need to
reflect these updates. The steward would have to perform
the attribute updating actions identified in Table 10-1 and
the steps noted below. Once completed, this new table has
to be linked to the parcel GIS layer.
·
Third, both the spatial and attribute data have been updated.
The steward would have to obtain the new GIS layer and
update the attributes accordingly.
It is highly recommended that the steward closely coordinate with the
MCPA prior to any modifications to these data and to ensure that the
steward is aware of future updates or enhancements to this information.
Assuming that an entirely new parcel GIS layer and tax roll needs to be
integrated into the CCIAM, the following steps must be performed (items
in bold are the attributes being calculated):
1.
Import the parcel GIS layer from the MCPA.
2.
Link the tax roll to the imported GIS layer using RE2 as
the unique identifier.
3.
Drop the un-necessary items from the attribute table.
4.
Perform an overlay operation with the subdivision layer to
get the SUB_ID2 item into the parcel attribute table.
5.
Summarize the number of developed parcels and divide by
the total number of parcels in the subdivisions to get the
ratio for SUBDIV_PERC.
6.
If necessary, correct the spatial shift either manually or
through a systematic process.
Florida Keys Carrying Capacity Study
Carrying Capacity/Impact Assessment Model Maintenance Model
48
Section 12
7.
Overlay with the planning units layer to get the
PLAN_UNIT item into the parcel attribute table.
8.
Add an item, KEY_SEGMENT, and manually assign
parcels to key segment (upper, middle, lower).
9.
Add an item, WW_HOTSPOT, and manually assign
parcels to wastewater hotspots using the hardcopy maps
produced by CH2MHill in the Sanitary Wastewater Master
Plan.
10.
Load the parcels and the municipality layer into ArcInfo for
viewing. Add an item, MUNICIPALITY, and manually
assign parcels to their appropriate municipality by visual
inspection.
11.
Add and item, EVAC, and assign parcels to hurricane
evacuation zones using the descriptions found in the Miller
Consulting, Inc. Hurricane Evacuation Plan for Monroe
County.
12.
Select PC codes and calculate LU according to Table 12-2.
13.
Link the zoning table to the parcels using RE2 as the
unique identifier to get the ZONE field into the parcel
attribute table.
14.
Run a frequency on RE2 and AREA. Add an item,
ACRES, to the frequency table and calculate ACRES =
AREA / 43560. Do a JOINITEM back to the parcel
attribute table using RE2 as the unique identifier.
15.
Run a frequency on RE2 and area. Add an item,
SQFOOTAGE, to the frequency table and calculate
SQFOOTAGE = AREA. Do a JOINITEM back to the
parcel attribute table using RE2 as the unique identifier.
16.
Select the vacant residential parcels (PC = 00) and calculate
MAX_ALLOW_DU = ACRES * DENSITY for each
zoning value. See Table 12-3 for zoning allocation.
17.
Select the vacant non-residential parcels (PC = 10, 40, 70)
and calculate MAX_FLOORAREA = SQFOOTAGE *
Florida Keys Carrying Capacity Study
Carrying Capacity/Impact Assessment Model Maintenance Model
49
Section 12
GFA for each zoning value. See Table 12-3 for zoning
allocation.
18.
Select the vacant commercial parcels (PC = 10) and
calculate MAX_HOTEL = ACRES * HOTEL_DENSITY
for each zoning value. See Table 12-3 for zoning
allocation.
19.
For the DU_AVE item, do not update unless there are new
CENSUS data or the MCPA refines its method of
accounting for dwelling units in the tax roll. The steward
should maintain close coordination with the MCPA and
Monroe County planners. See the dwelling unit guidelines
for information regarding this procedure.
20.
Divide the DU_AVE by ACRES to obtain DENSITY. This
should only be performed if there has been a change to the
number of dwelling units or the size of the parcels.
21.
See the suitability guidelines to calculate RES_SUIT.
22.
See the suitability guidelines to calculate NONRES_SUIT.
23.
Add an item, REDEV_VALUE, and calculate
REDEV_VALUE = PBLDG1 / PLAND1.
24.
Add an item, WATERFRONT, and visually inspect
parcels to find those that are adjacent to the shoreline or are
on a canal. Calculate WATERFRONT = 1 for those that
meet the criteria.
25.
Add an item, ADJ_US1 and visually inspect parcels to
determine which ones are adjacent to US1. Calculate
ADJ_US1 = 1 for those parcels that meet the criteria.
26.
See the vacant conservation guidelines for the
VACANT_CONS item.
27.
Add an item called GFA and calc GFA equal to FLA.
28.
Add an item called FAR and divide the GFA column by
the SQFOOTAGE column to obtain the FAR values.
Florida Keys Carrying Capacity Study
Carrying Capacity/Impact Assessment Model Maintenance Model
50
Section 12
29.
For both the EDU and WWT items, refer to the Delivery
Order 8 report. These items should only be updated if a
systematic effort to account for equivalent dwelling units
and wastewater treatment methods is undertaken to
enhance the CCIAM.
Table 12-3
Zoning Classifications and Land Development Standards
ZONE MAX_RES_DEN MAX_HOTEL MAX_FAR ZONE_OSR
ACCC
0.00
0.00
0.00
1.00
UC
12.00
10.00
0.45
0.20
BU-2
12.00
10.00
0.45
0.20
BU-2F
12.00
10.00
0.45
0.20
BU-3
12.00
10.00
0.45
0.20
UR
12.00
0.00
0.30
0.20
RU-3
12.00
0.00
0.30
0.20
RU-5
12.00
0.00
0.30
0.20
RU-5P
12.00
0.00
0.30
0.20
URM
7.00
7.00
0.00
0.20
RU-1M
7.00
7.00
0.00
0.20
SC
6.00
10.00
0.40
0.00
sc
6.00
10.00
0.40
0.00
BU-1
6.00
10.00
0.40
0.00
BU1L
6.00
10.00
0.40
0.00
C-1
6.00
10.00
0.40
0.00
SR
10.00
5.00
0.50
0.50
SRL
3.00
0.00
0.00
0.00
SS
6.00
5.00
0.20
0.80
SS(ACCC)
6.00
5.00
0.20
0.80
OS
2.00
2.00
0.00
0.95
NA
-999.00
0.00
0.20
-999.00
IS
1.00
0.00
0.25
0.00
IS-D
1.00
0.00
0.25
0.00
IS-M
1.00
0.00
0.25
0.00
Isve9
1.00
0.00
0.25
0.00
RU
1.00
0.00
0.25
0.00
RU1
1.00
0.00
0.25
0.00
RU-1
1.00
0.00
0.25
0.00
RU-2
1.00
0.00
0.25
0.00
R-1
1.00
0.00
0.25
0.00
R-1A
1.00
0.00
0.25
0.00
Florida Keys Carrying Capacity Study
Carrying Capacity/Impact Assessment Model Maintenance Model
51
Section 12
Table 12-3
Zoning Classifications and Land Development Standards
(Continued)
ZONE MAX_RES_DEN MAX_HOTEL MAX_FAR ZONE_OSR
R-2
1.00
0.00
0.25
0.00
IC(ACCC)
1.00
0.00
0.25
0.00
IS(ACCC)
1.00
0.00
0.25
0.00
DR
18.00
10.00
0.30
0.20
RV
0.00
15.00
0.00
0.00
CFA
12.00
0.00
0.40
0.20
CFV
12.00
0.00
0.40
0.20
CFSD
12.00
0.00
0.40
0.20
MU
12.00
10.00
0.40
0.20
I
12.00
0.00
0.40
0.00
MI
12.00
10.00
0.60
0.00
MF
12.00
0.00
0.50
0.20
M
12.00
0.00
0.50
0.20
AD
0.00
0.00
0.10
0.00
PR
5.00
5.00
0.20
0.90
LDR-C
1.00
0.00
0.00
0.50
MDR-C
8.00
0.00
0.00
0.50
SF-1
1.00
0.00
0.00
0.50
SF-2
1.00
0.00
0.00
0.50
SF
1.00
0.00
0.00
0.50
MDR
16.00
0.00
0.00
0.50
HDR
22.00
0.00
0.00
0.60
LC
16.00
0.00
0.80
0.60
GC
16.00
0.00
0.80
0.60
CT
16.00
0.00
0.80
0.60
RO
16.00
0.00
0.80
0.60
PRD
8.00
0.00
0.80
0.60
HMDR
16.00
0.00
1.00
0.60
HHDR
22.00
0.00
1.00
0.60
HRCC-1
22.00
0.00
1.00
0.70
HRCC-2
8.00
0.00
1.00
0.60
HRCC-3
22.00
0.00
1.00
0.60
HNC-1
16.00
0.00
1.00
0.60
HNC-2
16.00
0.00
1.00
0.60
HNC-3
16.00
0.00
1.00
0.60
HCT
22.00
0.00
1.00
0.70
HRO
16.00
0.00
1.00
0.60
HPS
0.00
0.00
1.00
0.50
Florida Keys Carrying Capacity Study
Carrying Capacity/Impact Assessment Model Maintenance Model
52
Section 12
Table 12-3
Zoning Classifications and Land Development Standards
(Continued)
ZONE
HPRD
PS
A
C-OW
C-TW
C-UH
C-FW
CM
MAX_RES_DEN MAX_HOTEL MAX_FAR ZONE_OSR
22.00
0.00
1.00
0.50
0.00
0.00
0.80
0.50
0.00
0.00
0.80
0.00
0.10
0.00
0.01
0.95
0.10
0.00
0.01
0.95
0.10
0.00
0.01
0.95
0.10
0.00
0.01
0.95
0.10
0.00
0.01
0.95
12.2
Residential Developability & Suitability Guidelines
Each developable vacant residential parcel has been assigned a value of
one through four, with one representing parcels that are most suitable for
development and four representing parcels least suitable for development.
Details regarding the rationale and methods of this
developability/suitability analysis can be found in the Delivery Order 11
report. There are four instances where this analysis may have to be
performed to update the developability/suitability information:
·
The spatial accuracy of the parcels is greatly improved and,
therefore, enhances the habitat constraints portion of the
analysis. Note that the contractor has already manually
moved the parcels GIS data. See Section 10.1 for more
information.
·
The land cover attribute data (ADID) are updated to
include descriptor information regarding the quality of the
vegetation. Monroe County includes habitat quality in their
assessment of development suitability. This was not
performed in the CCIAM due to the lack of available data.
·
The land cover data are delineated with an emphasis on
determining the true extent of developed areas. Currently
areas of vegetation that may lie throughout the “developed”
ADID polygons are simply coded as developed in the
ADID attribute table. See Delivery Order 10 for more
details.
Florida Keys Carrying Capacity Study
Carrying Capacity/Impact Assessment Model Maintenance Model
53
Section 12
·
GIS data regarding potable water and electricity hook ups
becomes available and is appropriate to use in that portion
of the suitability analysis which determines vacant parcels’
access to infrastructure.
The following list itemizes the steps taken to determine the residential
suitability rankings for vacant residential parcels:
1.
Select vacant parcels from the \data\parcels coverage to
create VACPARCELS.
2.
Perform an IDENTITY operation on VACPARCELS and
ADID to produce VACADID.
3.
Join the Z_ZONE_LUT to VACADID using the ZONE
item.
4.
Join Z_HabitatOSR_LUT to VACADID using the
CODE_NS item.
5.
Add an item, DEV_RATIO. Compare the open space
values from the zoning and the habitat. Calculate
DEV_RATIO equal to the most stringent of the two open
space ratios.
6.
Add an item, POLY_ACRE, and calc POLY_ACRE equal
to AREA / 43560.
7.
Add an item, DEV_POLY, and calculate DEV_POLY
equal to POLY_ACRE * DEV_RATIO.
8.
For each RE2, summarize DEV_POLY (in Arc
Workstation, this is a FREQUENCY, in ArcMap it is a
SUMMARIZE) to produce a new summarized table.
9.
In the summarized table, change the DEV_POLY name to
PARC_TOTDEV. Do this to avoid confusion when joining
these data back to the coverage.
10.
Add an item, LESS_01, to the summarized table.
11.
Select for PARC_TOTDEV greater than or equal to 0.1.
Calculate LESS_01 equal to ‘N’.
Florida Keys Carrying Capacity Study
Carrying Capacity/Impact Assessment Model Maintenance Model
54
Section 12
12.
Select for PARC_TOTDEV less than 0.1. Calculate
LESS_01 equal to ‘Y’.
13.
Join the summarized table to VACPARCELS using RE2 as
the join item.
14.
Select from VACPARCELS all polygons that have a
LESS_01 value of ‘N’ to create VACRESDEV. These are
the developable vacant residential parcels. The remaining
tasks calculate the suitability ranking of these developable
parcels.
15.
Add four items to the VACRESDEV attribute table:
POT_H2O, HABITAT, FEMA, SUBDIV.
16.
Select for parcels that have access to potable water. Do this
by finding all roads that have an FKAA customer location
within 100 feet of the road. Then select all parcels that are
within 50 feet of the selected roads. The assumption being
that if a road has a FKAA customer on it, then the vacant
parcels would be able to get a potable water hook-up. The
50 foot buffer is used try to minimize the effect of the
spatial error in both the FKAA point data and the parcel
data. After both selections have been made calculate
POT_H2O equal to ‘1’.
Select roads first
Florida Keys Carrying Capacity Study
Carrying Capacity/Impact Assessment Model Maintenance Model
55
Section 12
Select parcels within 50
feet of the selected roads.
17.
Select for parcels with no habitat constraints by selecting
for parcels that intersect the ADID description of
developed’ or description of ‘exotics’. Calculate
HABITAT = ‘1’.
Florida Keys Carrying Capacity Study
Carrying Capacity/Impact Assessment Model Maintenance Model
56
Section 12
18.
Visually inspect the VACRESDEV with the FEMA
coverage. Very few intersect the ‘X’ zone. Most intersect
the ‘AE’ zone. Manually calculate the FEMA item
according to the flood zone for the parcel.
19.
Select for parcels in VACRESDEV that have a SUB_ID2
value greater than zero. Calc SUBDIV equal to ‘1’.
20.
Add an item called RES_SUIT. Calculate RES_SUIT with
a ‘1’, ‘2’, ‘3’, or ‘4’ based on Table 12-4.
Table 12-4
Ranking
1
1
2
2
2
2
2
3
SUBDIV
1
0
x
x
x
x
x
x
x
x
POT_H2O
1
0
x
x
x
x
x
x
x
x
Florida Keys Carrying Capacity Study
Carrying Capacity/Impact Assessment Model Maintenance Model
HABITAT
1
0
x
x
x
x
x
x
x
x
X
x
FEMA
AE V
x
x
x
x
x
x
x
57
Section 12
12.3
Non-Residential Suitability Guidelines
Each developable vacant non-residential parcel has been assigned a value of
one though four, with one representing parcels that are most suitable for
development and four representing parcels least suitable for development.
Details regarding the rationale and methods of this developability/suitability
analysis can be found in the Delivery Order 11 report. The steps to calculate
the non-residential suitability for vacant non-residential parcels is identical
to the residential suitability methods with the exception of three items:
1. Location within a subdivision is not a criterion for nonresidential development. Do not make these selections and
calculations.
2. Access to potable water and electrical infrastructure is not a
criterion for non-residential development. Do not make these
selections and calculations.
3. Adjacency to US 1 is a criterion for non-residential
development. Add an item, US1, and visually inspect the data
to calculate US1 equal to ‘1’ for those parcels adjacent to US1.
Once the HABITAT, US1, and FEMA items have been calculated, add an
item, NONRES_SUIT and calculate it with a ‘1’, ‘2’, ‘3’, or ‘4’ based on
Table 12-5.
Table 12-5
US1
Ranking
1
2
2
2
3
3
4
4
1
x
x
0
x
x
x
x
x
x
HABITAT
1
0
x
x
x
x
x
x
x
x
X
x
Florida Keys Carrying Capacity Study
Carrying Capacity/Impact Assessment Model Maintenance Model
x
x
x
FEMA
AE
V
x
x
x
x
x
x
x
x
x
x
58
Section 12
12.4
Vacant-Conservation Land Guidelines
The GUI has an option in the ‘Change From “Vacant” ‘ form for a user to
select vacant parcels that are within 300 feet of 10 acres of contiguous
habitat or CARL lands. The steps to identify these parcels are noted
below.
1. Select all ADID vegetation types except for developed and
exotic.
2. Dissolve the selected polygons.
3. Select for polys greater than or equal to 10 acres from the
resulting dissolved layer.
4. Buffer the selected polys in the dissolved layer by 300 feet
(Figure 12-2)
5. Select for all PC = 00, 10, 40, and 70 from the PARCELS
coverage.
6. Select by location, in ArcMap, to get vacant parcels within the
300 foot buffer layer (Figure 12-3).
Figure 12-2
“Habitat” after
the dissolve.
300 foot buffer
of polys 10 acres
or more.
Developed area not
part of the dissolved
habitat layer.
Figure 12-3
Florida Keys Carrying Capacity Study
Carrying Capacity/Impact Assessment Model Maintenance Model
59
Section 12
7. Add an item, VACANT_CONS, and calculate
VACANT_CONS = 1 for those records.
8. Do another select by location in ArcMap with the CARL
coverage layer and use the buffer on the fly option
(Figure 12-4).
Florida Keys Carrying Capacity Study
Carrying Capacity/Impact Assessment Model Maintenance Model
60
Section 12
Figure 12-4
9. Calculate VACANT_CONS = 1 for those records.
12.5
Dwelling Unit Calibration Guidelines
The CENSUS 2000 provided additional information regarding the number
of dwelling units in the Florida Keys. The contractor used this opportunity
to calibrate the dwelling units in the parcel GIS layer with the dwelling
units being reported in the CENSUS. See the Delivery Order 11 report for
a discussion on the methods and rationale that guided this effort. The
DU_AVE attribute should not be updated unless the Monroe County
Property Appraiser’s office provides a more accurate, or reliable, count of
dwelling units from their CAMA tax roll database.
12.6
Input Layer Updates
There are sixteen ArcInfo coverages and 22 grids required by the CCIAM.
Table 12-6 itemizes each coverage and describes the required preprocessing activity for the layer.
Florida Keys Carrying Capacity Study
Carrying Capacity/Impact Assessment Model Maintenance Model
61
Section 12
Table 12-6
Input Layers and Required Pre-Processing
Layer Name
ADID
FEMA
Description of Layer
land cover
overlay of land cover and
basins
historic vegetation
wastesheds/watersheds
overlay of basins and planning
units
FEMA flood zones
KEYDEER
key deer habitat
MRABBIT
lower keys marsh rabbit
habitat
ADID_BASINS
ADIDFIN_DO7
BASINS
BASINS_UNITS
PARCELS
PLANUNITS
land use
27 areas throughout the
Florida Keys used to
summarize results
RICERAT
silver rice rat habitat
ROADS
road line work
official shoreline of the
FKCCS
U.S. 1 line work
SHORELINE
US1
WCP
PLANUNITLAND
RICH
ROADDIST
ROADGRID
Required Pre-Processing
Add an item for planning units
IDENTITY operation with ADID and
BASINS
No Action
No Action
IDENTITY operation with BASINS and
PLANUNITS
No Action
Add an item, HABITAT, and calculate all
habitat polys to 1
Add an item, HABITAT, and calculate all
habitat polys to 1. Add item, RISK, and
calculate to 0.
See section 6.1.
Add an item, KEY_SEGMENT, and
calculate each planning unit poly based on
upper, middle, lower keys.
Add an item, HABITAT, and calculate all
habitat polys to 1. Add item, RISK, and
calculate to 0.
No Action
No Action
No Action
white crowned pigeon habitat Add an item, HABITAT, and calculate all
habitat polys to 1
grid of the land within the
planning units
species richness grid
euclidean distance grid from
roads
roads as a grid
Florida Keys Carrying Capacity Study
Carrying Capacity/Impact Assessment Model Maintenance Model
Convert planning units to grid. Convert
shoreline to grid where the shoreline polys
have a value of 0 and all other values are
nodata. Add the planning unit grid to the
shoreline grid to produce a new grid with
the planning unit numbers only on land.
See section 6.3.
Perform a Euclidean distance to 500 feet
using the ROADGRID as the source.
Convert the roads to a grid.
62
Section 12
12.7
Potential habitat/richness models
Potential habitat for seventeen terrestrial species were modeled and then
aggregated into a species richness grid. All seventeen models, as ArcInfo
grids, and the resulting species richness grid were created based on the
Florida Fish and Wildlife Conservation Commission’s Habitat Needs of
Rare and Imperiled Species study. The steward should read the metadata
associated with each model, the Florida Keys Carrying Capacity Final
Report, and the Habitat Needs of Rare and Imperiled Species
documentation prior to updating these models. If the potential habitat
models are updated, then they are simply summed to produce the overall
species richness grid.
Florida Keys Carrying Capacity Study
Carrying Capacity/Impact Assessment Model Maintenance Model
63
Section 13
Routine Planning Tool (RPT)
13.1
RPT Architecture
The steward should be familiar with the installation and operation of
ArcIMS 3.1. The RPT was designed using ArcIMS manager and all of the
subdirectories for this application were created in accordance with the
standards outlined in the ArcIMS 3.1 documentation. The RPT is a lightweight application that serves shapefiles using an image map service
through a HTML viewer. Specific configuration parameters for the RPT
are itemized in Table 13-1.
Table 13-1
Map Configuration File
Map Services
(Note: Image map services only)
ArcIMS website
Shapefiles
Homepage and associated
HTML files
13.2
C:\ArcIMS\AXL\rpt.axl
C:\ArcIMS\AXL\currentconditions.axl
C:\ArcIMS\AXL\smartgrowth.axl
C:\ArcIMS\AXL\scenario5.axl
basemap (uses rpt.axl)
Current conditions (uses current conditions.axl)
smartgrowth (uses smart growth.axl)
scenario5 (uses scenario5.axl)
C:\ArcIMS\website\rpt
E:\rpt\basedata
E:\rpt\currcondition
E:\rpt\smartgrowth
E:\rpt\scenario5
C:\Inetpub\wwwroot\fkccs
Installation Procedures
1. Install ArcIMS 3.1 according to the software documentation.
This installation assumes that the steward is using a Java
Servlet connector and Microsoft IIS webserver.
2. Copy the contents of the RPT DVD to the appropriate locations
on the server:
a. Copy the AXL files to C:\ArcIMS\AXL
b. Copy the rpt directory to C:\ArcIMS\website
Florida Keys Carrying Capacity Study
Carrying Capacity/Impact Assessment Model Maintenance Model
64
Section 13
c. Copy the shapefile directories (rpt\basedata,
rpt\currcondition, rpt\smartgrowth, rpt\scenario5) to a local
drive on the server. Note that you will have to re-path the
AXL files if the data are not placed on the E:\ drive.
3. Copy the contents of the fkccs directory to
C:\Inetpub\wwwroot.
4. Re-path the AXL files within the <WORKSPACE> tags
(Figure 13-1).
Figure 13-1
<WORKSPACES>
<SHAPEWORKSPACE name="shp_ws-6" directory="E:\rpt\basedata" />
<SHAPEWORKSPACE name="shp_ws-8" directory="E:\rpt\currcondition" />
</WORKSPACES>
5. Edit the C:\ArcIMS\website\rpt\ARCIMSparams.js file to
change the name and IP address of the server (Figure 13-2)
Florida Keys Carrying Capacity Study
Carrying Capacity/Impact Assessment Model Maintenance Model
65
Section 13
Figure 13-2
//***************************************************************************
//*
parameters File for HTML Template
*
//***************************************************************************
// get machine name
var hostName = document.location.host;
// make URL for getting mapservice catalog
var catURL=
"http://10.101.4.12/servlet/com.esri.esrimap.Esrimap?ServiceName=catalog";
var serverURL=
"http://10.101.4.12/servlet/com.esri.esrimap.Esrimap?ServiceName=";
//var catURL = "http://" + hostName +
"/servlet/com.esri.esrimap.Esrimap?ServiceName=catalog";
//"http://10.101.4.12/servlet/com.esri.esrimap.Esrimap?ServiceName=catalog";
// make prefix for URL
//var serverURL = "http://" + hostName +
"/servlet/com.esri.esrimap.Esrimap?ServiceName=";
//"http://10.101.4.12/servlet/com.esri.esrimap.Esrimap?ServiceName=";
//*********************************************************************
//*
parameters set by Designer
*
//*********************************************************************
var imsURL =
'http://10.101.4.12/servlet/com.esri.esrimap.Esrimap?ServiceName=BaseMap';
//var imsURL = "";
//'http://10.101.4.12/servlet/com.esri.esrimap.Esrimap?ServiceName=BaseMap';
//var imsOVURL =
"";
var imsOVURL=
'http://10.101.4.12/servlet/com.esri.esrimap.Esrimap?ServiceName=BaseMap';
6. Edit the aimsPrint.js file to change the name of the server
(Figure 13-3)
Florida Keys Carrying Capacity Study
Carrying Capacity/Impact Assessment Model Maintenance Model
66
Section 13
Figure 13-3
Win1.document.writeln('
<IMG
SRC="http:\/\/ursims\/Website\/rpt\/images\/FKCCSsmall.gif" width = "75"
HSPACE="10" VSPACE=0 BORDER=0 BORDERCOLOR = "white" ALT="" ALIGN =
"middle" ></TD>');
Table 13-2
Map Service Name
Basemap
currentconditions
smartgrowth
scenario5
AXL File
C:\ArcIMS\AXL\rpt.axl
C:\ArcIMS\AXL\currentconditions.axl
C:\ArcIME\AXL\smartgrowth.axl
C:\ArcIMS\AXL\scenario5.axl
Service Type
Image
Image
Image
Image
7. Start ArcIMS Administrator.
8. Add four new map services
9. Save the website configuration and close ArcIMS
Administrator.
10. Type the URL of the server into the address line of a web
browser to view the application.
13.3
RPT Updates
The RPT can be updated with new data or functionality. It can also be
updated with the latest version of ArcIMS. If new data become available,
the steward can either edit the map configuration files with ArcIMS
Author or build entirely new map configuration files and associated map
services. If new data from the CCIAM are to be added to the RPT, these
data will have to be converted to shapefiles prior to being added to the
RPT.
The steward can add to the functionality of the RPT by either modifying
the JavaScript in the HTML viewer or by creating a new website using the
ArcIMS Java viewer. If the steward chooses to upgrade the RPT to a new
version of ArcIMS, then it is highly recommended that the steward
research all of the implications of a version change to an application built
in ArcIMS 3.1.
Florida Keys Carrying Capacity Study
Carrying Capacity/Impact Assessment Model Maintenance Model
67
Section 14
List of Supporting Documentation (Refer to USACE FKCCS
Website)
·
FKCCS Final Report
·
CCIAM Users Guide
·
Delivery Order 10 Report
·
Florida Keys Hurricane Evacuation Study, Miller
Consulting
·
ArcGIS Users Guides (including Spatial Analyst)
·
Exploring ArcObjects Volumes I & II
·
ArcObjects Object Model Diagrams
·
Microsoft Access 2000 Developers Guide
·
HTML and Java Script Reference Guides
Florida Keys Carrying Capacity Study
Carrying Capacity/Impact Assessment Model Maintenance Model
68


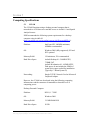
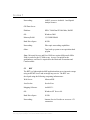


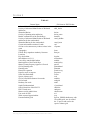
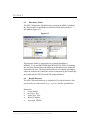
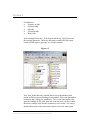
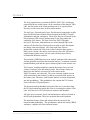
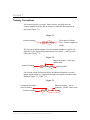
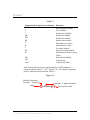
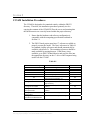
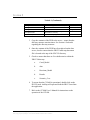
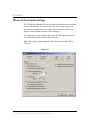
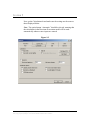
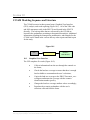
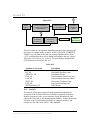
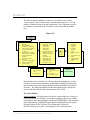
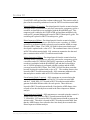
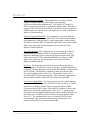
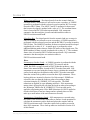
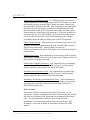


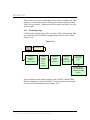
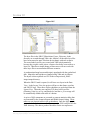

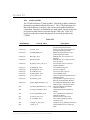
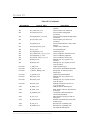
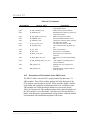
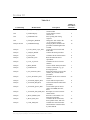
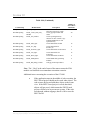
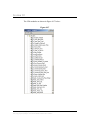
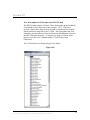
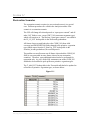
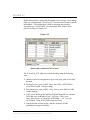

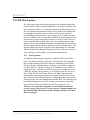
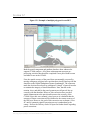
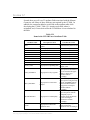
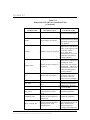
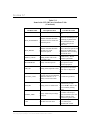
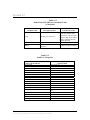
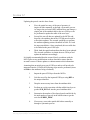


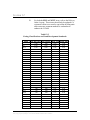
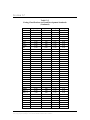
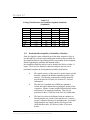
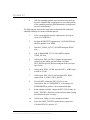
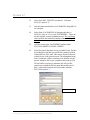
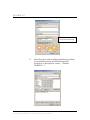
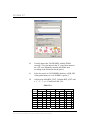
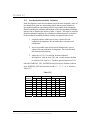
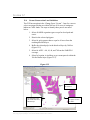
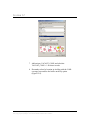
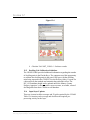
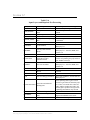

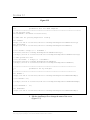


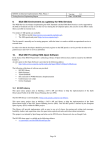


![MapInfo [v9.5 - v10.0] User manual PDF](http://vs1.manualzilla.com/store/data/005662542_1-c58f11f989f54f88b5c049879cd1b1b4-150x150.png)