1
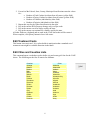
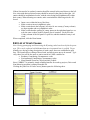
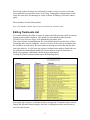
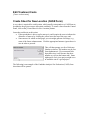
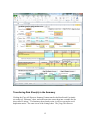
DRAFT User Manual CORRECT Cost-benefit Optimization for the Reduction of Roadway Environment Caused Tragedies This document is in draft form and is intended for information purposes only. It should not be used for system operation. DRAFT February 26, 2011 Table of Contents Introduction ......................................................................................................................... 3 Create a new file ................................................................................................................. 3 Control Panel (Instructions sheet) ....................................................................................... 3 Edit Crash Parameters Button ............................................................................................. 5 Edit Cities and Counties Lists ............................................................................................. 6 Edit List of Crash Causes .................................................................................................... 7 Editing Treatments List....................................................................................................... 8 Edit Treatment Costs........................................................................................................... 9 Create Sheet for New Location (or Estimate) ..................................................................... 9 (1) Time period for accident history ............................................................................. 11 (2) Date ......................................................................................................................... 11 (3) Select the Roadway System .................................................................................... 11 (4) Funding Information ............................................................................................... 11 (5) Location Information............................................................................................... 11 Description ................................................................................................................ 11 County:...................................................................................................................... 11 City:........................................................................................................................... 11 (6) Milepost Information............................................................................................... 12 (7) Investigators Information ........................................................................................ 12 (8) Causes of Accidents ................................................................................................ 12 Select Cause Group ................................................................................................... 12 Enter Cause Details ................................................................................................... 12 (13) Treatments ............................................................................................................. 13 Select a Treatment..................................................................................................... 13 Insert Initial Cost....................................................................................................... 14 Life expectancy and Maintenance costs ................................................................... 14 Accident/Crash Rate Reduction Factors ................................................................... 14 Benefit/Cost Analysis ................................................................................................... 14 Create Summary and Listing ............................................................................................ 16 Summary sheet .............................................................................................................. 16 Listing Sheet ................................................................................................................. 16 2 Introduction CORRECT is designed to ease the cost and benefit evaluations for determining optimal alternative safety treatments to be applied to the highway system. CORRECT has been built as an Excel Workbook into which multiple locations can be added and summarized. CORRECT opens a control panel sheet from which a number of commands can be initiated. These are divided into two broad classes: 1) editing of parameters and pick lists, and 2) creation new analysis (CASE) sheet, and creating the summary. The benefit computations are dependent upon the road classification (e.g. Federal, State, County or Municipal) and whether the location under consideration is determined to be Urban or Rural. For each combination of these classifications, a set of annual crash frequencies is used to derive the overall Benefit/Cost values and ratios. Each workbook can contain multiple Candidate Analysis Site Evaluation (CASE) sheets that all utilize the same basic parameters that are set up in a single Parameters sheet. CASE sheets essentially define the costs and benefits of alternative improvement scenarios at a given location. The Parameters sheet is used to set up the primary parameters that will be used for all CASE sheets in the workbook. Create a new file It is generally necessary to create a new file of CASE sheets when making a new CORRECT application. To do this, copy the delivered file: CORRECT_Template_<version>.xls to a suitable location, and give it a meaningful name. Do NOT called it Template – give it a name that is representative of the project funds you are allocating (e.g., “2011-HESAllocation”). Be sure to copy it as an Excel Macro Enabled Spreadsheet; if not, functionality will be lost. Terminology. Each file (in Excel jargon, a workbook) can hold multiple CASE sheets. Each CASE sheet will be in a separate worksheet within the workbook. Again, “worksheet” is the Excel name for a separate subdivision within their workbook. In this manual these will generally be referenced as “CASE sheets” or just “sheets.” The number of CASE sheets will be dependent on the number of locations under consideration. It is recommended that the total number of potential locations to be improved be subdivided so that, for example, very large and very small projects are not considered simultaneously within the same workbook. This assists in creating a better situation for optimization, and it will also facilitate processing, since the more sheets in a single workbook, the slower the response time may become. A suggested target would be 20 to 30 CASE sheets per workbook. Further instructions are given in the next section. Control Panel (Instructions sheet) Note: “Instructions” is the name of the sheet containing the Control Panel. 3 Once the template is copied, open the new file (workbook). The initial display will be the Control Panel with the worksheet named “Instructions” (bottom tab). The Control Panel has only 1 editable field (called “Analysis Basis”); otherwise its function is to gain access to basic parameter sheets. Insert (for reference purposes only) the basis and source for the entries made in the Parameters section. This could include the name of the particular program being addressed, the years for which crash counts were extracted, and the date for the current crash costs. The Control Panel is shown below for a copy of the template into the file named: CORRECT_Template-v-0-1-0.xls Different versions of Excel behave differently – it might be necessary to unlock the copy of the spreadsheet; if this is the case use help and adjust the settings appropriately. The most recent versions will give warnings and directions when a protected field is selected. Note the color codes and their definitions. They are used in the analysis sheets to help make them easier to read and to avoid erroneously keying into fields that contain formulas. Before embarking on the first Benefit/Cost estimate, it is necessary to set up and/or check all the parameter sheets that will be used in all the estimates in this workbook. If any 4 such estimate requires a different set of parameters, these should be set up in a new Workbook. (e.g. if the years used to create base crash statistics (see Parameters sheet) change, then they should be created in a new workbook. If not, the new values will be applied to ALL estimates in this workbook. The buttons on the Control Panel will now be discussed in order. Edit Crash Parameters Button Clicking this button will open the Parameters sheet, an example of which is given below. The left portion of the page is for RURAL data, and the right portion is for URBAN data. Because the ratio of injury to fatality crashes is different for rural and urban crashes (mainly due to speeds and also the availability of EMS), they are calculated independently in this spreadsheet. As is evident, the number of crashes by severity, injuries and fatalities for each of the roadway classes over the last three years will be contained in this worksheet. If (and only if) this worksheet needs to be updated, the following procedure should be used: 1. Key in the lowest year for the 3-year set of base parameters in cell A1. Generally this data will be for the most recent three years for which data area available (either in CARE or other sources). 5 2. For each of the Federal, State, County, Municipal classifications enter the values for : Number of Fatal Crashes/Accidents from all causes (yellow field) Number of Injury Crashes/Accidents from all causes (yellow field) Number of Fatalities (individuals) (white field) Number of Injuries (individuals) (white field) 3. Repeat this step for the Urban classification on the right. 4. Key in the current PDO (Property damage only) cost per crash 5. Key in the current cost of an injury used by the state 6. Key in the current cost estimate for a fatality used by the state. All other fields are calculated and are used in the CASE sheets that will be created. When complete, click [Done] button in lower left corner. Edit Treatment Costs This button is not activated. It is a place holder in anticipation that a standard set of treatment costs might be available sometime in the future. Edit Cities and Counties Lists This command opens a worksheet used to define city and county pick lists for the CASE sheets. The following are the first 20 entries for Alabama. Counties Autauga Baldwin Barbour Bibb Blount Bullock Butler Calhoun Chambers Cherokee Chilton Choctaw Clarke Clay Cleburne Coffee Colbert Conecuh Cities Abbeville Adamsville Addison Akron Alabaster Albertville Alexander City Aliceville Allgood Altoona Andalusia Anderson Anniston Arab Ardmore Argo Ariton Arley 6 If these lists need to be updated, counties should be entered in the panel shown to the left. New cities with their associated county should be entered in the panel on the right. All entries should be in alphabetical order, with the cities being listed alphabetically within their county. When inserting new entries, make certain that the following rules are followed: Insert a row within the heavy blue lines. Make certain to insert in alphabetic order. Make certain that in the left panel, all cities for one county (County column) are kept together and are in alphabetic order . Make certain that the spelling of county names in the right-hand panel are exactly the same as those in the left panel (list of counties). Each cell in the County column of the left panel is a pick list, and this method of entry is advised. When completed, click the Done button. Edit List of Crash Causes Note: During prototyping and beta testing the Wyoming codes have been left in the prototype. This can be replaced with Alabama data once its potential use is verified. To potentially save keying in long descriptions of crash causes, these are established as pick lists. This button allows editing of those listed, and allows new ones to be entered. Typically, these lists will be the same as entries stored in CARE variables for: Roadway Contributing Circumstances codes Environmental Contributing Circumstances codes Most Harmful Event for Causal (at-fault) Vehicle Since CORRECT is primarily aimed at finding benefits for roadway projects, Driver and Non-Motorist causation is omitted from this list. Clicking the [Edit List of Crash Causes] button opens the following sheet. 7 The Groups in the left column are used simply to make it easier for a user to select the Cause when the list of possible causes is very long. Although the column names are different, the same rules for entering new values as shown for Editing Cities and Counties apply. When finished, click the [Done] button. Note: The Number column shown is not used and is for reference only. Editing Treatments List In a similar fashion to the table of causes of crashes, this table presents a table of roadway treatments that could be deployed. The default list of treatments is taken from the NCHRP Research Results Digest #299 published in November 2005. This report includes recommendations for Crash Modification Factors for many of these Treatments under various conditions. However, because of the levels of uncertainty and the variability in crash causes, this sheet makes no attempt to provide that data for inclusion in the analyses. It is left up to the analyst to estimate those numbers based either on the published recommendations modified by best judgment in specific situations, or based on best practice established with the analysts organization. Clicking the [Edit Treatments] button opens the following tables. Once again, the Categories are defined to help to navigate the Treatments in the pick lists. Despite the different column headings, the rules for editing these tables are the same as for Cities and Counties 8 Edit Treatment Costs [Future enhancement] Create Sheet for New Location (CASE Form) A new sheet is required for each location, which usually corresponds to a CASE form to be added to the project resource allocation workbook. To create a sheet from the Control Panel, click on the [Create Sheet for New Location] button. Issues that could arise at this point: If the spreadsheet is not set up for macros it could require the user to indicate the allowance of macros by clicking the yellow bar at the top of the page; and Some macros for which no data pages yet exist might generate a message; e.g., some of the future enhancements. Click the appropriate button to ignore these issues in order to proceed. This will then prompt you for a Reference Number as shown. The number may be free form alphanumeric. We recommend it be kept short since it will become the sheet number as well (on the bottom tab). Some alpha prefix for a given project might serve to attach the site to a given project. The following is an example of the Candidate Analysis Site Evaluation (CASE) form sheet that will be opened: 9 Notice that the Reference number is inserted into the sheet, and is used as the sheet name as shown below. 10 (1) Time period for accident history The cursor will initially be positioned in the cell marked “Time period for accident history”. This is an important number and should be the first item entered. It is the number of years of accident history that will be used to generate the statistics used in the four entries of Causes of Crashes (see below). Enter the number and press “Enter’. (2) Date Range Key in the date range (e.g., 2007-2009) for the crash history estimates for reference only (e.g., for potential CARE reruns). (3) Select the Roadway System In order to set up the calculations correctly, and to utilize the proper parameters, it is necessary to select the right system from the area of the screen shown below. Choose either the Urban or the Rural row and click the appropriate button for Federal, State, County or Municipal road system. Click the button that has the label – not the blue box. If, for example, Rural–State is selected, the resulting screen appears as follows: By selecting this button, not only has the “X” been set, but all the calculation formulas have been adjusted in the benefit calculations. It also makes available the area of the screen used to enter the causes of crashes and associated statistics available for entry. These are hidden until items (1) and (3) are entered. In addition, clicking one of these seven buttons enters the description of the system in the field marked “System” (see 6 below). (4) Funding Information These funding fields are for record purposes only. Insert the names of the On-System and/or Off-system funding sources. (5) Location Information The following information is mandatory, although not used by the application. Description: This field is free form and should be used to describe the highway or street name an other relevant information. County: This value must be entered from the picklist. (see Control Panel above) City: This value must be entered from the picklist. (see Control Panel above) 11 (6) Milepost Information In order to record the precise location for which accident statistics are being recorded (e.g. from a Hot Spot identified in CARE), the milepost information is recorded here. Notice that the System information was filled automatically when it was selected. (7) Investigators Information It is often very important to record the names of the investigators who prepared this estimate. This is a free form field in which to record the information. (8) Causes of Accidents In any Hot Spot being analyzed, there may be more than one significant cause of the accidents there. The following entries allow the description of, and statistics related to those causes. At least one cause MUST be inserted and designated by the mandatory colors of the cells. Select Cause Group First, scroll to the right of the screen to find the Select Cause Group fields and select the appropriate group. By selecting a group, the appropriate list of Causes will be made available for selecting in the main Causes panel. Enter Cause Details Select the required Cause in (8a): For the specific cause listed for the roadway location being considered for improvement, key in the Numbers of: (10) Fatal Accidents/Crashes (11) Injury Accidents/Crashes 12 (12) PDO Accidents/Crashes Note: These numbers are for the “Time Period of Accident History” discussed earlier (Item 1). Repeat the previous two steps for up to three more causes. IMPORTANT: any historically determined crash must only be assigned to ONE roadway environment cause, or else this “double counting” will result in an exaggerated benefit estimate. Assign each crash to its most likely cause only. If any historically determined crashes cannot be assigned to any roadway environment cause, then they should be excluded from consideration since the countermeasures proposed will not have any effect on them. Note that total accidents are automatically accumulated, and the number of causes is counted automatically. (13) Treatments Up to three treatments for the segment of road specified are allowed. Enter all treatments that are being considered. If more than three have to be considered, create an additional (virtual) location to handle it. Select a Treatment To enter a Treatment, scroll to the right . and select a treatment category as shown. Having selected a Treatment Category, scroll back to the left and select a treatment (up to three treatments may be specified in this way. 13 Insert Initial Cost For each treatment, an initial capital cost needs to be estimated. This is usually fairly easy to estimate from past project of similar type. The results will be entered here: Life expectancy and Maintenance costs For each treatment, the life of that treatment and the cost per annum to maintain it must be estimated and entered. Accident/Crash Rate Reduction Factors For each Treatment, the investigator should estimate a Crash rate reduction factor associated with each Cause specified. If three Causes have been listed, then the first row under 8a, 8b, and 8c in the illustration shown above will be shown as mandatory. Note these are to be specified as reduction factors and not modification factors as reflected in the NCHRP report. Further, these are not applied to all crashes at the location, but ONLY to the crashes that are listed for the corresponding causes. Benefit/Cost Analysis Once all of the above information has been entered, the Benefit/Cost fields are automatically calculated. B/C Ratio1 = Benefit / Cost B/C Ratio2 = Benefit / (Cost + Maintenance Cost) The following gives another possible completed example for a location. 14 Transferring Data Sheet(s) to the Summary Clicking the [Copy All Sheets to Summary] button transfers the Benefit and Cost Analysis results to a “Summary” sheet, and at the same time enters them into a sortable list in a sheet called “Listings.” If a Summary sheet already exists, it will be recreated to avoid duplication entries. The same is true of the Listings sheet. The [Copy This Sheet to 15 Summary] button will not work until a summary sheet is created, which will occur when the [Copy All Sheets to Summary] button is used to create the Summary sheet. Repeat Process for All Locations The process indicated above for the first location will be repeated for all locations – this might include dozens of replications of the above procedure to get all of the locations into the spreadsheet. All location CASE forms must be entered before going to the next step. To enter a new CASE form, go back to the Instructions page and click [Create Sheet for New Location]. Create Summary and Listing Clicking the button [Create Summary and Listing] causes two sheets (Summary and Listing) to be created. NOTE: These two sheets are not dynamically updated. The user must again click on one of the “Copy …” buttons to regenerate the pages after a new page is created or any change is made to any of the analysis sheets. Summary sheet The summary sheet will contain a copy of the Benefit and Cost Analysis from each analysis sheet one below the other for easy reference. Listing Sheet (Optimization) This sheet presents the optimal allocation of resources according to the data input given for the various alternatives at all of the locations. Optimal here means that it is impossible to produce any greater benefit by changing any alternative specified. The specified alternatives produce the maximum possible safety benefit given the budget. In order to view how this works, it is recommended that users change the value of the budget specified and click the “Run Optimizer” button. The alternatives will change to fit the updated optimal set of alternatives within the new budget. 16