1
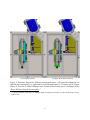
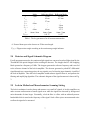
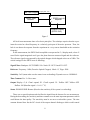
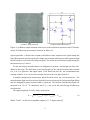
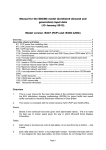
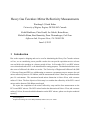
Heavy Gas C̆erenkov Mirror Reflectivity Measurements
Wenliang Li∗, Garth Huber
University of Regina, Regina, SK S4S-0A2 Canada
Keith Blackburn, Chris Gould, Joe Gubeli, Brian Kross,
Michelle Shinn, Brad Sawatzky, Drew Weisenberger, Carl Zorn
Jefferson Lab, Newport News, VA 23606 USA
June 14, 2012
1 Introduction
Due to the expensive shipping and service cost for aluminizing the Heavy Gas C̆erenkov mirrors
at Cern, we are considering a new possible vendor who can provide equivalent service at lower
cost and deliver the products in a shorter period of time. In November 2011, two HGC mirrors
were selected and sent to ECI1 to be aluminized for testing purposes. The aluminized mirrors were
then sent to Jefferson Lab within two weeks. The University of Regina and Jefferson Lab (Hall
C, Detector Group and FEL) are collaborating to construct a permanent setup to measure the real
mirror reflectivity between 165-400nm, with the measurement below 190nm are performed under
pure N2 environment. The maximum hosted mirror dimension is 60cm×50cm, with curvature
radius of 110cm. The first objective of this setup is to confirm the reflectivity of the ECI’s coated
mirror surface between 200-400nm wavelength.
We report the completion of the mirror reflectivity setup and the first measurement on the
ECI coated HGC mirrors. The HGC mirror bracket has dimension of 60cm×55cm, and curvature
radius of 110cm, for more detailed information on the HGC mirrors, please see the prior technical
report[1].
∗
1
[email protected]
Evaporated Coatings Inc. 2365 Maryland Road, Willow Grove, PA 19090
1
2 Methodology
2.1 Equipment list
The list of important components used for the setup construction is given below:
• 2 × IRD2 AXUV-100G photo-diode UV Detectors (#02, #18) with Ceramic Shoulders
• Thorlab MC100 Optical Chopper System with MC1F2 Chopping Blade
• SR530 Lock-in Amplifier
• The McPherson Model 218 Vacuum Ultraviolet (VUV) Monochromator with Holographic
200nm Blaze (1200G/mm) Grating
• 1mW Melles Griot Alignment Laser
• 3 Watt Hamamastu Deuterium UV Light Source
• Deep UV Flipper Mirror: Melles Griots DUVA-PM-5010M-UV
• F1.5 Focusing Lens: Edmund Optics UV Plano-Convex 50mm Dia.x75mm FL Uncoated
Lens
• F4 Focusing Lens: Edmund Optics CAF2 PCX50.8 Lens
• 1 × Translation Stage, 1 × Rotation Stage and 8 × Stepper Motors
The mirror reflectivity measurements used the HGC mirror #8 and IRD UV detector #02. The
HGC mirror is clamped along the left and bottom edges with metal clamps (two along each side).
The clamped mirror edges are sandwiched between the rubber gasket to isolate them from the
metal pieces.
2.2 Setup
The main body of the setup is constructed by three parts as shown in Fig. 1 and 2: the light source
box, the monochromator and the detector hutch. In Fig. 1 the hutch was not yet installed
The light box houses the Hamamatsu deuterium lamp and F1.5 focussing lens. The distance
between the lamp and the lens is 4cm, and the distance between the lens and the light entering
2
International Radiation Detectors, Inc. Opto Diode Corp. 750 Mitchel Road, Newbury Park, CA 91320
2
Figure 1: Pictures of the mirror reflectivity setup.
the slit of the monochromator is also 4cm. The monochromator was calibrated and installed with
a brand new holographic 200nm blaze (1200G/mm) grating to optimize the performance around
200nm wavelength.
Inside of the detector hutch, the test mirror is clamped onto the hosting bracket and then
mounted to the angle adjusting frame. The stepper motors attached to the frame are able to change
the pitch and yaw angle with an accuracy of 0.1◦ . The whole frame sits upon a three axis translation stage which allows the source light from the monochromator to reach any spot on the sample
mirror.
During the reflectivity measurement, the detector position is fixed at a constant point. This
means the sample mirror’s position and angle needs to be adjusted to reflect the source light towards the detector. Since the human eye does not respond to MUV or FUV light, an alignment
laser is introduced to match the monochromator light path, in order to help guide the mirror adjustment. The laser is installed in perpendicular to the monochromator light path, and a pneumatically
controlled stage device will insert a small reflecting mirror to intercept the light path if the laser is
needed for alignment Fig. 1
The air will start to block UV light around 190nm, so for the reflectivity measurement at wavelengths below 190nm, an oxygen free environment is required. A high vacuum environment would
be ideal, but the cost of the large vacuum chamber is beyond the budget. Instead, a pure N2 environment is used, where the leak tight requirements for a purged system are much less demanding.
All three parts of the setup can be fed with cool N2 gas separately. The volume of the hutch may
need several hours of purging before reaching the condition necessary for reflectivity measurement. The purging process will continue during the data taking period to maintain the low oxygen
level and also cool the UV lamp. An oxygen monitor will be placed inside of the hutch to readout
3
the oxygen level. For the HGC mirror reflectivity measurement, the wavelength range of interest
is 190-400nm, therefore the pure N2 condition is not required.
2.3 Methodology and Schematic Diagrams
We performed wavelength scans between 190-400nm at three different modes to compute the final
results and the their descriptions are listed as follows:
No Reflection (NR) Mode: Light from the monochromator slit was focused by the focusing lens
and the image was directly projected onto the detector. The slit-lens distance (do ) was 31cm,
and the lens-detector distance (dl−d ) was 69cm. The wavelength scan at this mode was used
as the reference measurement for determination of the flipper mirror reflectivity. Only one
measurement was taken.
Flipper Mirror Reflection (FMR) Mode: The do was the same as that for the NR mode. However, the light was then reflected off the Deep Ultra Violet (DUV) flipper mirror and projected onto the detector. The total light path of this mode was equivalent to the NR mode.
The flipper mirror was rotated to 10.75◦ according to the rotation stage indicator and the light
incidence angle to the flipper mirror was 47.5◦ . Other key parameters are listed in Table 1.
The wavelength scans at this mode were used for the reflection measurement to compute the
flipper mirror reflectivity, as well as the reference measurement to compute the test mirror
reflectivity. A total of 8 measurements of wavelength scan were taken across the 8 hour
testing period. Measurement: Flipper Mirror Reflection (FMR) 1 and FMR2 were done immediately after the NR measurement. Measurements Left FMR, Right FMR, Center FMR,
Top FMR, Bottom FMR and Corner FMR were performed before the Real Mirror Reflection
Measurement at the indicated mirror location. The schematic diagram of this mode is shown
in Fig. 2a.
Real Mirror Reflection (RMR) Mode: With do reduced to 22.2cm, the flipper mirror was rotated by 95◦ , where the rotating stage indicator should record 105.75◦. The schematic digram of this mode is shown in Fig. 2b. After the focusing lens, the light was first reflected
by the flipper mirror towards the test mirror instead of detector, then the test mirror reflected
the light towards the detector. The light incidence angles to the flipper mirror and test mirror
were 47.5◦ and 5.5◦ accordingly. From Table 1, the total light path of this mode was 2 times
longer than the NR and FMR mode. The focused spot size is also larger. The wavelength
scan of this mode will be used as the reflection measurement to compute the test mirror
4
reflectivity. There were 6 measurements in total in this mode, and each measurement was
performed immediately after the FMR measurement corresponds to the same orientation
(Left FMR, Right FMR and so on). The exact position of these labels on the test mirror is
shown in Fig. 4b.
The flipper mirror reflectivity is computed as
Rf lipper =
IF M R
IN R
(1)
where IF M R is the signal strength at arbitrary wavelength in Flipper Mirror Reflection Mode, IN R
is the signal strength at the same arbitrary wavelength in the NR Mode.
The real mirror reflectivity is determined as
R=
IRM R
IF M R
(2)
where IRM R is the signal strength at arbitrary wavelength in RMR Mode, IF M R is the signal
strength at the same arbitrary wavelength in the FMR Mode.
The focal length of a lens is dependent on the incoming light’s wavelength. All three modes
project a focused image of the source (monochromator) onto the detector at 225nm. The focused
image size of each mode is listed in Table 1. The image will be slightly out of focus (blurry) at
higher and lower wavelength. The active area of the detector is 1cm×1cm which is sufficient to
detect the slightly blurred image.
Table 1 shows the distance between the important components in various different modes.
do : Distance between beam out slit of monochromator to focusing lens.
dl−f : Distance between focusing lens and flipper mirror.
df −d : Distance between flipper mirror and detector.
dl−d : Distance between focusing lens and detector.
df −m : Distance between flipper mirror and real mirror.
dm−d : Distance between real mirror and detector.
di : Total length of light path from the lens and detector (The sum of dl−f , df −d , dl−d , df −m and
dm−d for each mode).
5
(a) No Reflection Mode
(b) Flipper Mirror Reflection Mode
Figure 2: Schematic diagram for different measurement modes. All important components are
labelled with a capital letter. A: Light source box; B: Monochromator; C: Focusing lens; D: Flipper
Mirror; E: Detector; G: Mirror Holding Frame. Position of the focusing lens (C) and flipper mirror
(D) are different between the two modes. a
a
Conceptual design of the setup is by Michelle Shinn and Engineering design is by Chris Gould. Image courtesy
of Chris Gould.
6
do
dl−f
df −d
dl−d
df −m
dm−d
di
A
Tf lipper
No Reflection
Mode
31cm
69cm
69cm
6mm×5mm
-
Flipper Mirror
Reflection Mode
31cm
42cm
27cm
69cm
6mm×5mm
105.75◦
Real Mirror
Reflection Mode
22.2cm
43.3cm
34cm
60cm
137.3
8mm×7mm
10.75◦
Table 1: The key parameters for all measurement modes.
A: Focused beam spot at the detector at 225nm wavelength.
Tf lipper Flipper mirror angle according to the rotation stage angle indicator.
2.4 Detector and Signal Schematic Diagram
For all measurement modes, the continuous light signal was converted to pulsed light signal by the
Thorlab MC100 optical chopper before reaching the detector. The chopper had a 2 slot chopping
blade operated at a frequency of 14Hz. The chopper generated a reference frequency and it was fed
to the reference channel of the lock-in amplifier. The detector generated a pulsed DC differential
signal through two connecting points, the two signals were fed into the input channels A and B of
the lock-in amplifier. Then the lock-in amplifier would subtract signal B from A, and perform the
filtering and amplifying algorithm. The schematic diagram of the signal treatment is shown in Fig.
3.
2.5 Lock-in Method and Monochromator Scanning Setting
The lock-in technique is used to detect and measure very small AC signals. A lock-in amplifier can
make accurate measurement of small signals even when the signals are obscured by background
noise thousands of times larger. Essentially, a lock-in filter is a filter with an arbitrarily narrow
bandwidth which is tuned to the frequency of the signal. Such a filter rejects most unwanted noise
to allow the signal to be measured.
7
MC 100 Chopper
Chopping Rate: 14Hz
Ref
AXUV 100G
Detector
A
SR530 Lock-In
Amplifier
B
Output A-B
Computer Display
(EPICS GUI)
Figure 3
All lock-in measurements share a few basic principles. The technique requires that the experiment be excited at a fixed frequency in a relatively quiet part of the noise spectrum. Then, the
lock-in can detect the response from the experiment in a very narrow bandwidth at the excitation
frequency.
In this measurement, the SR530 lock-in amplifier was operated in R, θ display mode, where R
stood for the signal magnitude and θ gave the phase between measured signal and the reference.
The reference signal was generated by the optical chopper which chopped at the rate of 14Hz. The
critical settings for the SR530 were as following:
Signal Filters Bandpass: OUT. ENBW: 1Hz. Notch 1X: OUT. Notch 2X: OUT.
Reference Frequency: 14Hz (From the Optical Chopper). Mode: 1f, Triger: POS.
Sensitivity 5mV (must make sure the status is not overloading). Dynamic reserve: NORMAL.
Time Constant Pre: 3s. Post: none.
Output Display: R, Θ. Chan1 expand: X1. Chan2 expand: X1. Xoffset: OFF. Yoffset: OFF.
Roffset: ON (Baseline signal = 1.6×10⁻⁵ V).
Status ENABLE GRIP. Remote (Reselect the sensitivity if the system is overloading).
There was no special option needed to filter the signal from the detector for our measurement.
During the data taking, the sensitivity and time constant were the most important parameters which
could dictate the data quality. The sensitivity must be set not to overload the system. The time
constant dictated how fast the RC circuit of the output channel discharges which would control
8
(a) Witness sample placement
(b) Mirror Measurement Position
Figure 4: (a) Witness sample locations with respect to the main mirror position in the ECI aluminzation. (b) Reflectivity measurement locations on Mirror #8.
signal registration. A shorter time constant would allow a faster response to the signal change but
larger fluctuation in signal strength, and a longer time constant would register stable signal strength
but take longer to react to the any change in signal. The preferred time constant settings during the
measurement were 1s and 3s.
For the data taking, monochromator was configured to perform a wavelength scan from 190400nm at 5nm steps. The dwell time at each wavelength was 20s, and the associated time constant
was 1s or 3s to generate a flat signal output. If the dwell time was 60s, the recommended time
constant would be 3s or 10s (the time constant does not need to be larger than 10s).
A baseline (background) measurement should be taken before any real measurement. The
monochromator light was diverted away from the detector so that only the background light falling
into the chopping frequency window could be registered. The baseline (background) signal was
measured to be 1.6×10⁻⁵ V consistently, and Rof f set was set for this value during all reflectivity
measurements.
The signal magnitude R can be can be calculated as
R=
q
(x + xof f set )2 + (y + yof f set )2 + Rof f set
Where X and Y are the lock-in amplifier outputs in X, Y display mode[3].
9
(3)
2.6 Remarks During Data Taking
Although the large background noise can be filtered by the lock-in technique, sudden changes of
the background during the measurement create large fluctuations in the signal output. Such sudden
changes include switching on and off the room lights, a door opening, changing the view of the
computer monitor, etc. It is important to create the constant background noise during the data
taking process. The main room light and the computer monitors should be switched off and one
should remotely control the system through the computer located in other userlab.
10
3 Results
3.1 Deuterium UV Lamp Thermal Test Results
The 3 Watt Hamamatsu deuterium UV source’s stability has been questioned from the beginning.
It was purchased 20 years ago by the FFL Facility at Jefferson Lab. A thermal effect test was
carried out to investigate the stability of the UV lamp for long operation at the room temperature.
The monochromator was set for 225nm wavelength, corresponding to a maximum signal output
of 0.25mV. No Reflection (NR) mode was used for the test, where the light from monochromator
was directly focused onto the detector by the focusing lens. The X and Y output from the lock-in
amplifier were monitored separately as shown in Fig. 5.
After 6 hours of operation, we observed no fluctuation in either X or Y signal output, therefore
signal magnitude R was also constant according to Eq. 3. From this result, we can safely conclude
the UV source performance did not change due to heat and long operation, even without any
method of cooling and ozone removal. Under the real testing scenario, the light source box will be
Figure 5: Lock-in amplifier X, Y signal strength monitoring of the Deuterium lamp for 6 hour
testing period. The blue curve is the X signal and green curve is the Y signal.
11
Flipping Mirror %R at 47.5 Degree Incidence Angle
Detector Response With and Without Flipper Mirror Reflection
No Reflection
Flipper Mirror Reflection (FMR) 1
Flipper Mirror Reflection (FMR) 2
Left FMR
Right FMR
Center FMR
Top FMR
Signal (10-4V)
20
Bottom FMR
Corner FMR
15
10
Flipper Mirror Reflection (RMF) 1 %R
100
% Reflectivity
25
Flipper Mirror Reflection (RMF) 2 %R
98
Left FMR %R
96
Center FMR %R
Top FMR %R
94
Bottom FMR %R
Right FMR %R
Averaged Flipper Mirror %R
92
90
88
86
5
84
0
200
250
300
Wavelength (nm)
350
400
200
(a) Detector Response
250
300
Wavelength (nm)
350
400
(b) Flipper Mirror Reflectivity
Figure 6: Flipper mirror reflectivity results. (a) shows the detector response; (b) shows the percentage reflectivity results.
constantly purged with cold N2 vapour, thus the UV source intensity should be stable during the
long data taking process.
3.2 Flipper Mirror Reflectivity Result
In Fig. 6, 1 measurement of NR mode and 8 measurements of FMR mode wavelength scan curves
are plotted. Measurements FMR1 and FMR2 were taken immediately after the NR measurement.
The other 6 FMR measurements were taken separately within 6 hour period. The ratio between
each of the FMR curve and NR curve is plotted in Fig. 6b. The averaged reflectivity curve and
the standard deviation (error bar) are calculated and plotted. The standard deviation of percentage
reflectivity at most of measured wavelength is between 1-2%, excepting at 190nm, where the signal
is too close to the baseline to be trusted.
Between 220-400nm, the averaged reflectivity gradually increases as the wavelength goes
deeper into the UV region, peaks around 235nm at 89.5%, and then starts to decease. At 200nm
the reflectivity is 86.5%. The measured curve is different from the typical reflectivity curve for
the Melles Griots DUV mirrors, see App. B. The typical curve peaks around 197nm at 94.5%,
and gradually decreases as the wavelength increases. At 250nm the reflectivity is 91%. The difference between the measured and typical reflectivity curve is around 3% between 220-250nm;
this difference will keep increasing as wavelength gets shorter and at 200nm region there is 8%
difference.
There are a few possibilities that could contribute to the discrepancy between measured and
12
Detector Response at FMR and RMR Mode
25
Real Mirror % Reflectivity
Left FMR & RMR Mode Respose
90
Right FMR & RMR Mode Respose
Center FMR & RMR Mode Respose
20
80
Bottom FMR & RMR Mode Respose
15
Corner FMR & RMR Mode Respose
10
% Reflectivity
Signal (10-4V)
Top FMR & RMR Mode Respose
Left %R
70
Right %R
Center %R
60
Top %R
Bottom %R
5
0
50
200
250
300
Wavelength (nm)
350
400
Corner %R
200
(a) Detector Response
250
300
Wavelength (nm)
350
400
(b) Real Mirror Reflectivity
Figure 7: Real mirror reflectivity results
typical reflectivity curves, the typical curve is not a real measurement for the actual DUV mirror so some variation between the mirror performance and specification are expected. Also the
mirror surface was scratched during the alignment process and the scratches would result in some
scattered light.
3.3 HGC Mirror #8 Reflectivity Results
Fig. 7a shows 6 sets of FMR and RMR detector response curves. Each set of FMR and RMR
measurements were taken after the mirror was adjusted to a new position for testing. For FMR
measurements, the signal output was unrelated to the mirror position because the light was only
reflected from the flipper mirror. For the RMR measurements the lens and flipper mirror positions
needed to be adjusted, so light could reflect of the flipper mirror and real mirror. The FMR and
RMR measurements were taken back to back, also the lens and flipper mirror positions were adjusted remotely, so that the testing environment was not disturbed. The orientation of the measured
position (Left FMR, Right FMR and so on) on the mirror are demonstrated in the Fig. 4b.
Fig. 7b shows the reflectivity curves, which are the ratios between FMR and RMR measurements of the same orientation, for example (Left FMR curve)/(Left RMR curve). The plotted
error bars were the same as for the averaged flipper mirror reflectivity. From the results, between
200-300nm, the reflectivity at the Center is worse than at the Corner; between 300-400nm, the
reflectivity at the center is marginally better than at the corners.
During the aluminization process, ECI placed nine 1′′ witness samples at different locations
across the test mirror as shown in Fig. 4a. The samples’ reflectivity were tested for product quality
13
Real Mirror - ECI Testing Sample %Reflectivity
Real Mirror Reflectivity - ECI Testing Sample Reflectivity
10
Center Real Mirror Reflectivity - ECI testing sample #5 Reflectivity
Corner Real Mirror Reflectivity - ECI Testing Sample #7 Reflectivity
Left Real Mirror Reflectivity - ECI Testing Sample #4 Reflectivity
5
0
-5
-10
200
210
220
230
Wavelength (nm)
240
250
Figure 8: The difference between the witness samples and real measurement reflectivity results.
control, and these measurements are attached in App. C.
Witness sample reflectivity curves #4, #5 and #7 were chosen to compare with the measured
reflectivity curves at positions Left, Center and Corner between 200-250nm wavelength. The
mirror testing positions of #4 and Left, #5 and Center, #7 and Corner are similar. The sample
reflectivity curves were subtracted from the measured reflectivity curve and the difference is plotted
in Fig. 8. The ECI sample results have significant jitter. The estimated error below 230nm is 1%
and above 230nm is 0.5%. The error bar in Fig. 8 is calculated by
δDif f erence
q
2
2
= δECI
+ δM
easurement
(4)
where δECI is the ECI sample result error and δM easurement is the measurement error. For most of
the points, the difference is between 0-3%, which means the measured percentage reflectivity is
higher than the witness sample reflectivity. At the corner, the differences are slightly below 0, but 0
is still within the error bar. In the ECI witness sample results there is a sharp peak at 205nm which
does not exist in our measurement. Despite the peak, we can confirm the ECI sample testing result
represents the performance of the product and success of the reflectivity measurement setup.
14
3.4 Uncertainty
The UV detector response uniformity was tested with a smaller focused beam of 6mm × 4mm
at 225nm. Five measurements were taken: one at the center and four at the corners with 1mm
clearance to the edge. The response signal differences were around 1-2%. For the real mirror
measurement alignment, the focused spot was not guaranteed to be at the same location. The uniformity error should have already been included into the reproducibility error, which was computed
by 8 measurements of FMR Mode. The reproducibility error should be representative for the real
mirror reflectivity.
15
4 Conclusion
Based upon the real HGC mirror reflectivity measurements, we can safely confirm the ECI witness sample measurement represents the reflectivity performance of the aluminized mirror surface
between 200-400nm. At 200nm wavelength, the reflectivity is 10% lower than the original ECI
claimed value of 76% with the worst witness sample results. However, this difference decreases
rapidly as the wavelength increases. At 250nm, the difference between the sample curves and
theoretical curves ranges between 0-5%. Based on the Geant4 simulation results, the difference
between the theoretical curve and worst sample curve corresponds to 2.5% in terms of the detected
photo-electrons and 0.13% in terms of detected pion events. This effect is insignificant compared
to other significant contributions to the UV absorption in the deep UV region, i.e the C4 F8 O gas
absorption etc. We believe ECI product quality meets specified performance and is sufficient for
the real HGC mirror aluminization.
We are also delighted to report that the reflectivity setup at Jefferson Lab is capable of measuring the large size optics reflectivity between 200-400nm wavelength at normal atmospheric
condition and is potentially able to measure the reflectivity down to 165nm wavelength under the
N2 purged environment.
5 Suggestions for the Future Measurement
It is not obvious if the current UV source is suitable for UV measurements below 190nm. Further
testing is required to confirm that the signal strength is sufficiently strong and stable at such low
wavelength. One of the possible options is to replace the 3Watt Hamamastu deuterium lamp with
a Newport Oriel 30Watt deuterium lamp, which has much higher intensity at lower wavelength.
At the moment, the setup is in a semiautomatic state, where some manual fine adjustments
are required. Also, the cameras which can help with the alignment and status check are yet to
be installed. For the Noble Gas C̆erenkov mirror reflectivity measurements, the detector hutch
enclosure with pure N2 environment will forbid any manual adjustment and alignment. Some
level of automation is needed. However, it is not obvious at the moment how accurate automatic
alignment can be achieved. Manpower needs to be committed to resolve this issue.
16
References
[1] W. Li, G. Huber, M. Denissenya, D. Gervais, L. Sichello, K. Wolbaum, Mirror Testing Result,
Hall C Document 716-v1, 2011.
[2] http://www.ird-inc.com/text/SXUV%20RESPONSIVITY%20MASTER.txt
[3] SR530 Lock-in Amplifier User Manual.
17
Appendix
A AXUV-100G Detector Response Curve
The graph below shows the signal response curve for the IRD AXUV-100G detector between 100800nm. The numerical data are provided by the IRD company[2].
Detector Response
Detector Response (10-2A/W)
45
40
35
30
25
20
15
10
5
0
100
200
300
400
500
Wavelength (nm)
18
600
700
800
B Typical Melles Griots DUV Mirror Reflectivity Curve
The graph below shows the typical Melles Griots DUV mirror reflectivity between 185-250nm
wavelength.
19
C ECI Testing Sample Reflectivity Measurements
The ECI data sheets are attached in the following three pages, the actual placement of the witness
samples with respect to the real mirror are shown in Fig. 4a. The first page of the data sheet is
the theoretical reflectivity performance; 2nd and 3rd page are the reflectivity measurement of the
witness samples.
20
21
22
23