1
164
gnuplot 5.0
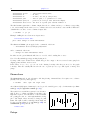
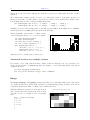
Set style rectangle
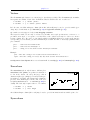
Rectangles defined with the set object command can have individual styles. However, if the object is not
assigned a private style then it inherits a default that is taken from the set style rectangle command.
Syntax:
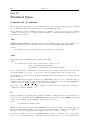
set style rectangle {front|back} {lw|linewidth <lw>}
{fillcolor <colorspec>} {fs <fillstyle>}
See colorspec (p. 36) and fillstyle (p. 161). fillcolor may be abbreviated as fc.
Examples:
set style rectangle back fc rgb "white" fs solid 1.0 border lt -1
set style rectangle fc linsestyle 3 fs pattern 2 noborder
The default values correspond to solid fill with the background color and a black border.
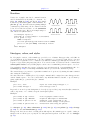
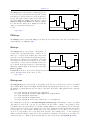
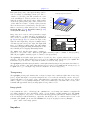
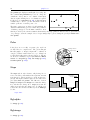
Set style ellipse
Syntax:
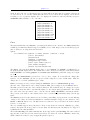
set style ellipse {units xx|xy|yy}
{size {graph|screen} <a>, {{graph|screen} <b>}}
{angle <angle>}
{clip|noclip}
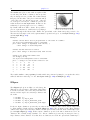
This command governs whether the diameters of ellipses are interpreted in the same units or not. Default is
xy, which means that the major diameter (first axis) of ellipses will be interpreted in the same units as the
x (or x2) axis, while the minor (second) diameter in those of the y (or y2) axis. In this mode the ratio of the
ellipse axes depends on the scales of the plot axes and aspect ratio of the plot. When set to xx or yy, both
axes of all ellipses will be interpreted in the same units. This means that the ratio of the axes of the plotted
ellipses will be correct even after rotation, but either their vertical or horizontal extent will not be correct.
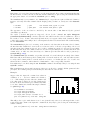
This is a global setting that affects all ellipses, both those defined as objects and those generated with the
plot command, however, the value of units can also be redefined on a per-plot and per-object basis.
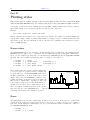
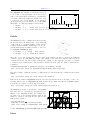
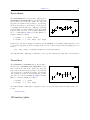
It is also possible to set a default size for ellipses with the size keyword. This default size applies to data
plots with only 2 columns of data (x,y) and to function plots. The two values are interpreted as the major
and minor diameters (as opposed to semi-major and semi-minor axes) of the ellipse.
The default is "set style ellipse size graph 0.05,0.03".
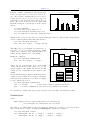
Last, but not least it is possible to set the default orientation with the angle keyword. The orientation,
which is defined as the angle between the major axis of the ellipse and the plot’s x axis, must be given in
degrees.
Clip clips the ellipse at the plot boundaries, noclip disables this. Default is clip.
For defining ellipse objects, see set object ellipse (p. 143); for the 2D plot style, see ellipses (p. 50).
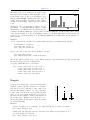
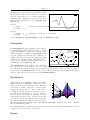
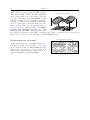
Set style textbox
Syntax: set style textbox {opaque|transparent}{{no}border}
This command controls the appearance of labels with the attribute ’boxed’. Terminal types that do not
support boxed text will ignore this style.
Surface
The set surface command is only relevant for 3D plots (splot).
Syntax: