1
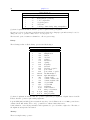
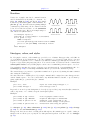
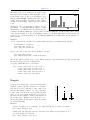
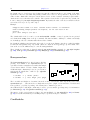
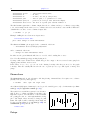
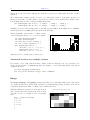
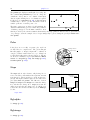
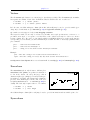
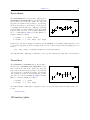
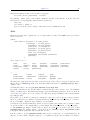
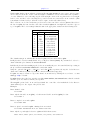
gnuplot 5.0
49
The candlesticks style can be used for 2D data plotting
of financial data or for generating box-and-whisker plots
of statistical data. The symbol is a rectangular box,
centered horizontally at the x coordinate and limited
vertically by the opening and closing prices. A vertical
line segment at the x coordinate extends up from the
top of the rectangle to the high price and another down
to the low. The vertical line will be unchanged if the
low and high prices are interchanged.
with candlesticks
Five columns of basic data are required:
financial data:
whisker plot:
date open
x box_min
low high close
whisker_min whisker_high
box_high
The width of the rectangle can be controlled by the set boxwidth command. For backwards compatibility
with earlier gnuplot versions, when the boxwidth parameter has not been set then the width of the candlestick
rectangle is controlled by set bars <width>.
Alternatively, an explicit width for each box-and-whiskers grouping may be specified in an optional 6th
column of data. The width must be given in the same units as the x coordinate.
An additional (6th, or 7th if the 6th column is used for width data) input column may be used to provide
variable (per-datapoint) color information (see linecolor (p. 36) and rgbcolor variable (p. 37)).
By default the vertical line segments have no crossbars at the top and bottom. If you want crossbars, which
are typically used for box-and-whisker plots, then add the keyword whiskerbars to the plot command. By
default these whiskerbars extend the full horizontal width of the candlestick, but you can modify this by
specifying a fraction of the full width.
The usual convention for financial data is that the rectangle is empty if (open < close) and solid fill if (close
< open). This is the behavior you will get if the current fillstyle is set to "empty". See fillstyle (p. 161).
If you set the fillstyle to solid or pattern, then this will be used for all boxes independent of open and close
values. See also set bars (p. 108) and financebars (p. 52). See also the
candlestick
and
finance
demos.
Note: To place additional symbols, such as the median value, on a box-and-whisker plot requires additional
plot commands as in this example:
# Data columns:X Min 1stQuartile Median 3rdQuartile Max
set bars 4.0
set style fill empty
plot ’stat.dat’ using 1:3:2:6:5 with candlesticks title ’Quartiles’, \
’’
using 1:4:4:4:4 with candlesticks lt -1 notitle
# Plot with crossbars on the whiskers, crossbars are 50% of full width
plot ’stat.dat’ using 1:3:2:6:5 with candlesticks whiskerbars 0.5
See set boxwidth (p. 110), set bars (p. 108), set style fill (p. 161), and boxplot (p. 47).
Circles