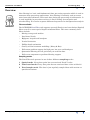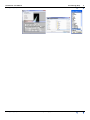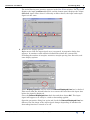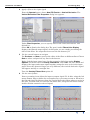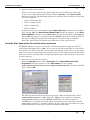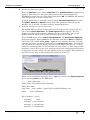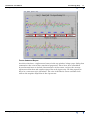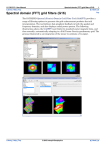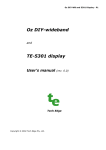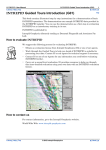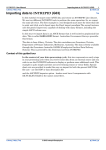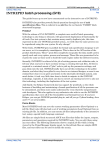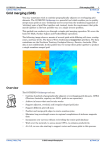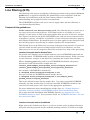
1
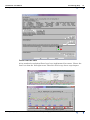
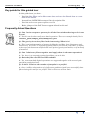
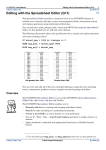
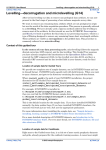
INTREPID User Manual
Library | Help | Top
Line filtering (G15)
1
| Back |
Line filtering (G15)
Top
Line filtering is the process of applying a filtering operation to the geophysical line or
profile data, as opposed to filtering the gridded data. Some experience with line
filtering and a familiarity with the more common filters is essential for
understanding how geophysical data is manipulated.
The INTREPID Line Filter tool can be used to apply either spectral (Fourier) or
convolution (Spatial) filters.
Context of this guided tour
In the context of your data processing cycle, Line filtering may be carried out at
any stage of the processing sequence. Your signal maybe be as simple as a set of
samples, a time series, or fully geolocated samples that are more or less in a straight
line. Signal is defined in the genric INTREPID sense and can mean scalar measures
of magnetics, gravity, elevations, or gradients, vectors and tensors that have purpose
built algebra behind them. For magnetic data it is often applied to the final processed
data for the purposes of producing an enhanced product for interpretation.
This Guided Tour can be followed at any stage of the processing sequence. If you have
a final levelled and fully processed magnetic data field in your dataset, use that.
Otherwise you can use any magnetic data field created at any stage of the processing.
Location of sample data for Guided Tours
We provide two complete sets of sample datasets, one in INTREPID format and one
in Geosoft format. INTREPID works equally well with both formats. When you want
to open a dataset, navigate to the directory containing the required data format.
Where install_path is the path of your INTREPID installation, the project
directories for the Guided Tours sample data are
install_path\sample_data\guided_tours\intrepid_datasets and
install_path\sample_data\guided_tours\geosoft_datasets.
For example, if INTREPID is installed in
C:\Program Files\Intrepid\Intrepid4.5.nnn,
then you can find the INTREPID format sample data at
C:\Program Files\Intrepid\Intrepid4.5.nnn\sample_data\
guided_tours\intrepid_datasets
This is the default location for the sample data. If you have installed INTREPID
normally, the data resides there. If you have installed INTREPID elsewhere, the
exercises will work just as well. Just use the appropriate pathnames.
For more information about installing the sample data, see "Sample datasets—
installing, locating, naming" in INTREPID Guided Tours Introduction (G01)
For a more detailed description of INTREPID datasets, see Introduction to the
INTREPID database (G20). For even more detail, see INTREPID database, file and
data structures (R05).
Location of sample data for CookBooks
Right next to the Guided tours data, is a rich set of more exotic geophysics datasets
and grids, already prepared for the cookbook training sessions. A casual user might
Library | Help | Top
© 2012 Intrepid Geophysics
| Back |
INTREPID User Manual
Library | Help | Top
Line filtering (G15)
2
| Back |
also gain some trial and error insights into the capbilities of the software, just by
testing the Project Manger’s ability to preview and describe the attributes of each of
the cookbook datasets.
Library | Help | Top
© 2012 Intrepid Geophysics
| Back |
INTREPID User Manual
Library | Help | Top
Line filtering (G15)
3
| Back |
Overview
Line filtering is a basic and fundamental data processing operation which is used in
numerous data processing applications. Line filtering is routinely used to remove
noise from radar altimeter and cosmic data during the processing of radiometrics. It
is used implicitly in procedures such as tie line levelling, decorrugation and
microlevelling. It is used to separate different frequencies for interpretation analysis.
Filters available
The INTREPID Line Filter tool supports spectral (Fourier) and convolution (Spatial)
filters as well as some special depth estimation filters. The more commonly used
filters include:
•
Moving average and median
•
Non-linear Naudy
•
Highpass, lowpass and bandpass
•
Vertical derivative
•
Phillips depth estimation
•
Gravity section basement modelling ( Murty & Rao)
•
Full tensor gradient support for high pass, low pass and band pass
•
Quaternian filtering for roll, pitch and yaw rotation data.
•
Full vector component or gradient filtering support.
Sampling modes
The Line Filter tool operates in one of three different sampling modes.
Library | Help | Top
1
Spatial mode. Every data point has an associated X and Y value.
2
Time-based mode. Every data point has an associated time value or fiducial.
3
Fixed sample mode. The data is just regularly sampled data with no time or
spatial associations.
© 2012 Intrepid Geophysics
| Back |
INTREPID User Manual
Library | Help | Top
Line filtering (G15)
4
| Back |
Steps to follow
Filter input and create output field
1
Launch the Line Filter tool
Start the Project Manager. Navigate to the directory
install_path\sample_data\guided_tours\intrepid_datasets. From
the Filtering menu, launch Line Filter. The INTREPID Line Filter tool window
appears.
2
Open the input dataset and field
From the File menu, choose Load Line Dataset. The Sample Mode dialog box
appears. Under Select Resampling Mode, select Geo-Located. Choose OK. This
is the vital decision regarding what context you are wanting to operate in.
The Select Line Dataset dialog box appears. Select the dataset albury..DIR and
choose Open.
The Select Signal Field dialog box appears. Select magfinal from the list of
dataset fields. If you do not have magfinal in your dataset you may select any
other magnetic data field, for example, rawmag. Choose OK.
The Select Sensor Altitude(m) & Select Optional Drape Altitude(m) dialog
boxes appear, Choose SKIP. These are when you wnat to do an altitude
adjustment of your signal.
This can also be a vector, tensor or quaternion field.
Library | Help | Top
© 2012 Intrepid Geophysics
| Back |
INTREPID User Manual
Library | Help | Top
Library | Help | Top
Line filtering (G15)
5
| Back |
© 2012 Intrepid Geophysics
| Back |
INTREPID User Manual
Library | Help | Top
Line filtering (G15)
6
| Back |
The main filtering user interface appears in the Line Filter window. The top panel
displays the input (unfiltered) signal, and the bottom panel displays the output
(filtered) signal. Since there is currently no filter chosen, the input and output
signal are the same.
3
Examine the display options
Right mouse click the input signal area ( top panel). A properties dialog box
appears. It contains useful statistical information about the current line,
including the number of samples, statistics, sample spacing, line direction, and
some display options.
Under Display Options, observe that the Detrend Displayed Line box is checked.
This means that the default behavior is to remove the trend from the input data
before the signal is displayed.
Clear the Detrend Displayed Line check box and then choose OK. The input
signal will appear as it really is—with no detrending applied.
Open the properties dialog box again and check the Detrend Displayed Line box.
Observe how the shape of the input signal changes depending on whether the
detrending function is turned on or off.
Library | Help | Top
© 2012 Intrepid Geophysics
| Back |
INTREPID User Manual
Library | Help | Top
4
Line filtering (G15)
7
| Back |
Apply a filter to the input signal
From the Spectral menu, choose New FIR Fourier > Vertical Derivative. The
Vertical Derivative Filter Properties dialog box appears.
Under Filter Properties, you can specify order of the vertical derivative. The
default is 1.
Select OK to dismiss the dialog box. The panel under Filtered Line Display
displays the filtered output signal. At this point you are simply previewing the
effect of the filter. No output has been saved in the dataset yet.
5
Use the control buttons to navigate
Use Previous and Next to preview the effect of the filter on different lines. Choose
Goto to select and preview any line in the dataset.
Right click the input signal area. In the properties dialog box under Display
Options, check the box next Overlay Filtered line. Select OK. The Line Filter tool
displays the input and output signal together using the same scale in the input
panel. Since the dynamic ranges are very different, the vertical derivative signal
will appear mainly as a straight line.
Turn the Overlay Filtered line option off.
6
Use the zoom feature
Now try zooming in on either the input or output signal. To do this, using the left
mouse button, drag to define the rectangular area you want to zoom to. Zoom in to
the filtered signal and observe how the vertical derivative filter enhances noise in
the data. To zoom back out and view the whole line, using the left mouse button,
double click the zoomed section of signal.
Library | Help | Top
© 2012 Intrepid Geophysics
| Back |
INTREPID User Manual
Library | Help | Top
7
Line filtering (G15)
8
| Back |
Apply the filter to the dataset
Now we are ready to process the lines using the vertical derivative filter and
create a new output field in the dataset. Choose Process . The Lines to Filter
dialog box appears. The following options are available for selecting the lines that
you want to process:
•
Select lines from a list
•
Select a range of lines
•
Select a single line
•
Select all lines
In this exercise we use the default option Select All Lines, which processes all the
lines. Choose OK. The Save Filtered Signal Field dialog box appears. In the Enter
New Field Name text box, delete newZ. Enter the new output field name mag1vd.
Choose OK. A progress bar appears and INTREPID begins processing the lines in
the dataset. When the progress box disappears, the processing is complete.
Leave the Line Filter tool window open and move to the next exercise.
Save the filter description file and the power spectrum
INTREPID allows you to save and load your filter parameters using special files
called filter description files (.fdf). If you want to run the same filter at a later date,
it is useful to be able to save the current filter description. In fact, this is a necessary
step if you want to run the filtering as a batch process. The following section describes
how you can save and load filters as filter description files, and also how to get access
to power spectra.
1
Save the current filter description
From the Spectral menu, choose Save Filter. The Vertical Derivative Filter
Properties dialog box appears. In the Filter Name text box, change
VerticalDerivative-Untitled to VerticalDerivative-1 for the new field
name. Choose OK.
The filter specification has now been saved into a filter description file called
VerticalDerivative-1.fdf. All of the .fdf files are stored in a directory
called filters within your INTREPID installation. As of this version of
INTREPID, it is possible to embed a fileter description into a line filter job file,
rather than call out to a seperate *.fdf file. At V5.0, this also generalises to using
GOOGLE protobuf syntax for all filter descriptions and tasks.
Library | Help | Top
© 2012 Intrepid Geophysics
| Back |
INTREPID User Manual
Library | Help | Top
2
Line filtering (G15)
9
| Back |
Load a new filter description
From the Spectral menu, choose Load Filter. The Available Filters parameter box
appears. This displays a list of pre-defined filters that are provided with
INTREPID. Choose any one of the filters and choose OK. INTREPID will load the
filter and preview it for the current line.
To check which filter is currently loaded, choose Current Properties from either
the Spatial, Spectral or Special menus. The filter properties box will appear.
Another way to do this is to right click the output signal area.
3
Compute and save the power spectrum
The INTREPID Line Filter tool provides access to the power spectrum for any
line. Choose Power Spectrum. The Power Spectrum box appears. The box
displays graphs of power spectra computed for the current line. Spectra are
displayed for the input data in black and the output data in white.
From the File menu, choose Save Power Spectrum. The Save Power Spectrum
dialog box appears. Enter power for the filename and choose Save. INTREPID
will create a file called “Your_Name”.spec in your working directory. This file
contains the power spectrum calculated for the output data only. Load the file
into an editor (for example, Excel), and you can do depth estimates etc. we have
made this something that can be automated as well, when you have large profile
databases, and wish to create your own proceedures for estimating either depths
or properties of rocks, using a moving window along each profile. The numbers in
the file have the units of wavenumber (X) and log of power (Y).
When you have finished inspecting the *.spec file, dismiss the Power Spectrum
box by choosing Quit from the File menu.
---------- Power Spectrum --------Filter Name: VerticalDerivative-Untitled
Filter Size: 4096
Line Name : Line: 140201 Signal Field: magfinal,Bearing: 270
Units
: Cycles / kilometer
Wave Number
0.000000,
Power
Null
0.069234, -1.051153e+001
0.138467, -1.051363e+001
0.207701, -1.274858e+001
Library | Help | Top
© 2012 Intrepid Geophysics
| Back |
INTREPID User Manual
Library | Help | Top
Line filtering (G15)
10
| Back |
0.276935, -8.913523e+000
4
Exit from the Line Filter tool.
To exit from the Line Filter tool, choose Quit from the File menu.
Gradient Data Example from Cookbook
If you wish to see how we handle FTG data, start again, but this time navigate to the
Intrepid\V4.5\sample_data\cookbooks\tensors\Aurizonia\A_1_DB
directory.
Start the line filtering tool, choose Open Line Dataset, choose Geo-located dataset,
then select Aurizonia_tensor_FormedTensor..DIR. Choose the Field T_fa_tensor.
This represents a FreeAir measured gravity tensor gradients.
This is the initial tensor profiule screen, without any filters being applied. The
characteristic for a profile of tensor data is the lack of any long wavelength trends,
with all the components around +- zero. The before and after colours are changed
slightly in the superimpose view so you can make out which is which.
Library | Help | Top
© 2012 Intrepid Geophysics
| Back |
INTREPID User Manual
Library | Help | Top
Line filtering (G15)
11
| Back |
Tensor Statistical Report
As with scalar data, a right mouse button in the top window, brings yup a dialog that
summarises the current lines statistical properties. These have been extenbded
beyond normal stats to include characteristics of the tensor, such as the average
eigenvector direction and angular spread for each eigenvector. We then represent
these in a stereonet-style plot mimic. The size of the Black, Green and Red circle
reflects the angular dirpserion of the eigenvector.
Library | Help | Top
© 2012 Intrepid Geophysics
| Back |
INTREPID User Manual
Library | Help | Top
Line filtering (G15)
12
| Back |
Tensor Low Pass Filter
A few standard convolution filters have been implimented for tensors. Choose the
Low Pass from the Pull right menu. Then left click in top, choose superimpose
Library | Help | Top
© 2012 Intrepid Geophysics
| Back |
INTREPID User Manual
Library | Help | Top
Line filtering (G15)
13
| Back |
Key points for this guided tour
In this guided tour you have:
•
Used the Line Filter tool to filter some data and save the filtered data as a new
field in the dataset
•
Learned how INTREPID manages filter description files
•
Used the tool to save power spectra to a file
•
Had a glimpse of the Full Tensor support offered in this tool
Frequently Asked Questions
Q : Can I write out power spectra for all the lines without having to do it one
by one?
A : Yes this can be done easily as a batch operation. There are example batch files in
install_path/sample_data/Examples/jobs.
Q : The gravity inversion filter looks interesting. What is it?
A : This is an implementation of a paper by Murthy and Rao, from Computers and
Geosciences, Vol 15 No 7. A profile of gravity data is inverted to yield either 1) depths
to the top of the basement surface below each point of gravity anomalies, or 2) anomaly
of structure.
Q : Can I chain two filters together and apply them in the same operation?
A : Yes, there is a composite option that allows you to do this.
Q : Does the filter use FIR and IIR nethods?
A : Yes, most standard digital operations are supported together with several quite
specialist geophysical ones.
Q : Is there a limit to the number of samples in a profile?
A : Over 8 million observations of a full tensor gradient signal have successfully been
filtered using this tool for one profile. This is close to a current limit.
Library | Help | Top
© 2012 Intrepid Geophysics
| Back |