1
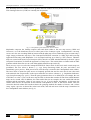
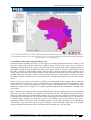
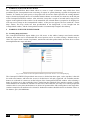
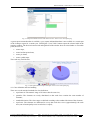
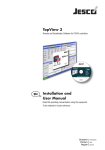
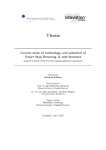
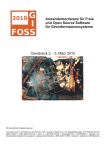
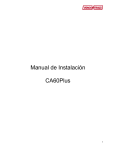
CentropeSTATISTICS – a Tool for Cross-Border Data Presentation
Manfred Schrenk, Clemens Beyer, Norbert Ströbinger
(Dipl.-Ing. Manfred Schrenk, Multimediaplan.at, 2320 Schwechat, Austria, [email protected])
(Dipl.-Ing. Clemens Beyer, CORP – Competence Center of Urban and Regional Planning, [email protected])
(Dipl.-Ing. Norbert Ströbinger, Planungsgemeinschaft Ost, 1010 Vienna, Austria, [email protected])
1 ABSTRACT
CentropeMAP is a geoportal which aims to help planners and stakeholders to get an overview of the
Centrope region. It converts statistic data from tables into easily legible thematic maps and various types of
charts on the fly. CentropeMAP emphasises on datasets which are of interest for spatial planning and similar
professions and visualises statistical data from the regions Vysocina, Jihomoravsky, Bratislavsky, Trnavsky,
Győr-Moson-Sopron, Burgenland, Lower Austria, and Vienna. Almost all datasets in the cross-border
statistical database are collected in a time series so that the development of the region can be explored in
yearly steps since 2001; the data range comprises various fields like population statistics, population
development and projection as well as land use, educational statistics, tourism or migration.
2 INTRODUCTION
The Centrope region is situated at the mutual borders of Austria, the Czech Republic, Hungary, and
Slovakia. Its aim is to foster cultural, ecologic and economic development in an area that had to suffer
enormous disadvantages during the decades of existence of the Iron Curtain and is now ready to catch up.
To help planners and stakeholders to get an overview of the Centrope region, the geoportal CentropeMAP
went online in 2005 and was soon extended by a cross-border statistics database which is directly linked to
the map view. This powerful tool allows you to convert statistic data into easily legible thematic maps and
various types of charts on the fly.
CentropeMAP is an online geoportal, which means it collects web map services (WMS) from all parts of the
Centrope Region and presents all these services to the user compiled into one single map. CentropeMAP
emphasises on datasets that are of interest for spatial planning and similar professions, comprising multiple
data layers from the fields of biota, boundaries, elevation, imagery/base maps, inland waters,
planning/cadastre, structure, and transportation.
Planners and stakeholders receive a great help from maps. Also, statistic data is important to analyse a
region. So why not combine maps and statistics and create a combined view of statistic data directly in a
map? CentropeSTATISTICS joins data from the regions Vysocina, Jihomoravsky, Bratislavsky, Trnavsky,
Györ-Moson-Sopron, Burgenland, Lower Austria, and Vienna and features readymade thematic maps as well
as an expert mode which gives full access to the whole Centrope cross-border statistics database. Note that
you can also download these data and, for example, use it in a spread-sheet. Almost all datasets are collected
in a time series so that the development of the region can be explored in yearly steps since 2001; the data
range comprises various fields like population statistics, population development and projection as well as
land use, educational statistics, tourism or migration.
Parts of this paper are written similar to the style of a user manual; this should encourage the reader to open
http://www.centropemap.org and try CentropeMAP and CentropeSTATISTICS themselves!
3
TECHNICAL IMPLEMENTATION
3.1 Server Hardware, Operating System, Software
The CentropeMAP applications and files are hosted on a Linux server. All geodata and viewing applications
for CentropeMAP and CentropeSTATISTICS use open source software, for example UMN Mapserver,
Geoserver, PostgreSQL (with PostGIS), Mapbender, Typo3, and some in-house developed PHP and
Javascript code.
3.2 System Architecture
The Mapbender map viewing client is the heart of the CentropeMAP system. It gives access to all embedded
web map services, manages user access rights and hosts the web interface for map viewing. CentropeMAP
Proceedings REAL CORP 2014 Tagungsband
21-23 May 2014,Vienna, Austria. http://www.corp.at
ISBN: 978-3-9503110-6-8 (CD-ROM); ISBN: 978-3-9503110-7-5 (Print)
Editors: Manfred SCHRENK, Vasily V. POPOVICH, Peter ZEILE, Pietro ELISEI
823
CentropeSTATISTICS – a Tool for Cross-Border Data Presentation
uses Web Map Services (WMS) to access geodata and Web Feature Services (WFS) to access attribute data;
Web Catalogue Services (CSW) are currently not in operation.
Fig. 1: CentropeMAP system architecture. Source: authors.
Mapbender composes the GetMap requests and sends them either to the own map servers (UMN and
Geoserver) or to the distributed servers in other parts of the Centrope region. CentropeMAP’s own map
servers now also use cascading WMS to interact with the other map servers within the region to return only a
single image per thematic map layer. The CentropeSTATISTICS extension is a PHP, SQL and Javascript
application interacting with Mapbender. It is developed and kept up to date by CEIT Alanova. Thematic
maps are created with Styled Layer Descriptor (SLD) which is an XML standard defined by the OGC (Open
Geospatial Consortium) to define the appearance of map layers. The statistic data are linked with an XML
generator which allows the user to create chloroplethic thematic maps on the fly.
There are two ways to work with CentropeSTATISTICS: Basic mode: In the basic mode certain maps are
predefined. The user selects a theme (e. g. “Age Group Percentage 2008, 80 years and older”) and
immediately gets a preview. With just one more click the map is created in the CentropeMAP main window.
The basic mode is meant for quick access to frequently queried data and for users who do not often work
with statistical data. Expert mode: In the expert mode the user selects a theme (e. g. “Population Indicators:
Age Group Percentage (by year)”). Then the query parameters have to be defined (in our example, the user
would have to select a year). In the next step the table is shown that contains all data from which thematic
maps can be created, and, in addition, also other useful data (in our example, the user would find both the
absolute and the percentage values of age groups 0 to 14, 15 to 60, 60plus, and 80plus). At this stage the
statistic data can also be exported for use outside CentropeMAP in CSV or MS Excel format. The user
selects the desired column and can then choose the grouping method, the number of classes, and a colour
ramp. Again, a preview is shown like in the basic mode, and with one more click the map is transferred to
the CentropeMAP main window (see fig. 2).
824
REAL CORP 2014:
PLAN IT SMART
Manfred Schrenk, Clemens Beyer, Norbert Ströbinger
Fig. 2: Statistic map created from census 2011 data with CentropeSTATISTICS (showing percentage of population aged more than
60). Although the boundaries are not shown in the data overlay, you can clearly recognize the countries by their different population
structure. Source: www.centropemap.org.
3.3 Styled Layer Descriptor and Web Map Services
SLD describes the appearance of layers in a web map service when the data are delivered to a client. A map
layer has a default style which is defined for standard display. However, this style can be overruled by
attaching a SLD document to this layer (as far as the map server supports SLD). In the GetMap request, the
SLD code can either be directly added to the URL of the request or it can be saved in a separate file of which
the URL is referred to in the GetMap request. This may bring along the advantage that a GetMap request
always refers to the same URL, but the SLD file at this URL may be altered by user interaction. Of course,
the SLD URL can be anywhere, it need not be stored at the same server as the geodata. It is therefore a great
advantage of SLD to customise layers of web map services without influencing the way other users see this
layer.
However, only a few map servers which are referred to in CentropeMAP accept GetMap requests containing
SLD information. If all servers of the CentropeMAP project partners interpreted SLD documents, there
would not be any problems matching the styles of layers from different servers containing the same
information. If this can be changed, the cross-border geodata integration in CentropeMAP will make a big
step forward.
SLD is also the main technique behind CentropeSTATISTICS: The user-defined maps are created through
SLD only. The layer containing the geodata for the statistical map has a pre-defined transparent layout so
that it is invisible without any attached SLD document. As soon as the user creates their own map layer from
statistic data, their selections are converted into a SLD document on the CentropeMAP server. The map view
is refreshed then, containing the SLD URL as part of the GetMap request of the statistics layer. Also a
timestamp is added to this request. These timestamp characters are ignored by the mapserver, but Mapbender
only reloads a layer when the request string has changed, so the timestamp ensures that every GetMap
request is different from the one before, causing the client to load the new map on refresh.
Proceedings REAL CORP 2014 Tagungsband
21-23 May 2014,Vienna, Austria. http://www.corp.at
ISBN: 978-3-9503110-6-8 (CD-ROM); ISBN: 978-3-9503110-7-5 (Print)
Editors: Manfred SCHRENK, Vasily V. POPOVICH, Peter ZEILE, Pietro ELISEI
825
CentropeSTATISTICS – a Tool for Cross-Border Data Presentation
4 WORKING WITH THE BASIC MODE
The CentropeSTATISTICS Basic Mode allows to create a couple of thematic maps which have been
predefined by the CentropeMAP team consisting of experts in spatial planning, regional development and
statistics. It is mainly for quick queries or for people who do not have much experience in creating thematic
maps or charts from statistic tables. All available statistics themes are collected in a menu tree on the left part
of the CentropeSTATISTICS window. After selection, it may take a couple of seconds until a map preview
appears in the right half of the window. In the meanwhile, the selected theme is prepared to be displayed as
web map service image in the CentropeMAP window. As the preview appears, the user can hit the “Create
Map” button. The map, which has been precalculated in the background, is now brought into the
CentropeMAP window, and the CentropeMAP window is automatically brought to the desktop.
5
WORKING WITH THE EXPERT MODE
5.1 Creating maps and charts
The CentropeSTATISTICS Expert Mode gives full access to the whole Centrope cross-border statistics
database, these data can be downloaded and several options can be set while creating a thematic map or
chart. The expert mode is meant for planners, statisticians and other professionals who know how to create
meaningful thematic maps and charts.
Fig. 3: Start window of the CentropeSTATISTICS expert mode. Source: www.centropemap.org
The CentropeSTATISTICS Expert Mode start screen is divided into three parts. At the top there is the title
bar with some buttons, and below the screen is divided into a left and a right half. All available statistics
themes are collected in a menu tree on the left part of the CentropeSTATISTICS window. After selecting a
theme by clicking on it, the availability form is loaded into the right half of the statistics window. It shows
which attributes are available for selection. In most cases, this will be the year only as we tend to prepare the
statistics table in a way that similar themes are shown in separate tables and not altogether in one large table.
Another example for an attribute to be selected is whether the number should be shown as absolute values or,
for instance, per 1,000 inhabitants.
826
REAL CORP 2014:
PLAN IT SMART
Manfred Schrenk, Clemens Beyer, Norbert Ströbinger
Fig. 4: CentropeSTATISTICS screen after theme selection. Source: www.centropemap.org
A green square means that data is available, a grey square indicated that data is not available in a certain part
of the Centrope region for a certain year. Clicking the “View Table” buttons opens the selected table in the
statistics window. The division between left and right half of the window does not exist further on. From this
point, the user can
•
create maps,
•
create bar/line/point charts,
•
create pie charts,
•
create symbol maps.
The result may look like this:
Fig. 5: CentropeSTATISTICS output examples. Source: www.centropemap.org
4.2. Class definition and zero handling
There are several statistical methods for class definition:
•
equal interval: The numeric range of all classes has the same size;
•
quantiles: The elements are evenly distributed so that each class contains the same number of
elements;
•
standard deviation: The class ranges are defined according to the standard deviation of the elements;
•
equal area: The elements are distributed in a way that each class covers (approximately) the same
area (sum of municipality areas in each class is equal);
Proceedings REAL CORP 2014 Tagungsband
21-23 May 2014,Vienna, Austria. http://www.corp.at
ISBN: 978-3-9503110-6-8 (CD-ROM); ISBN: 978-3-9503110-7-5 (Print)
Editors: Manfred SCHRENK, Vasily V. POPOVICH, Peter ZEILE, Pietro ELISEI
827
CentropeSTATISTICS – a Tool for Cross-Border Data Presentation
•
natural breaks (ArcView): The natural breaks algorithm minimises the variance within classes and
maximises the variance between classes. This option produces an output similar to the algorithm
used in ESRI’s ArcView GIS;
•
natural breaks (Jenks): same as above but using the Jenks algorithm which produces slightly
different results than the ArcView method;
If there is data with positive and negative values (e. g. population density increase/decrease) and a
dichromatic colour ramp is used, special zero handling can be defined:
•
no special zero handling: leave everything as it is;
•
treat white as zero only: The class including zero is split into two classes, and a separate class having
zero as only value is added. Note: The effective number of classes is higher by 2 than the preselected
number of classes;
•
use white for class incl. 0: preserve class definition, but shift the colour ramp so that white is used
for the class including the zero value;
•
no white in legend: preserve class definition, but build a colour ramp with no white class.
Of course all class values and all colours can be set manually if something different than the given options is
required.
5.2 Working with user-defined tables
CentropeSTATISTICS is not restricted to the given tables in the cross-border statistics database. There is
also a possiblity to combine data from more than one table, put it together in a custom table, and even
calculate own values and indicators. First of all, if you want to work with a custom table, you have to create
one. The “Create custom table” button is situated below the table tree menu on the start page of the
CentropeSTATISTICS expert mode. After table creation, if you press the “View custom table” button, the
same happens as if you selected any other table from the menu tree. It is still empty, so in the next step you
have to add columns to your custom table. Return to the start page and select any table you want from the
menu tree. Open it as usual. You can see that an additional button appears on the top of each column: “Add
to custom table”. Map calculations and map output are done only for the geographic intersection of the data
added to your table. E. g. if you add a column containing data for the whole Centrope region and another
column with data for whole Austria, all following operations will only be performed for the Centrope part of
Austria. If you try to add a column which would set the intersection to null, CentropeSTATISTICS will
notice this and prevent you from adding this column.
Fig. 6: CentropeSTATISTICS map calculator. Source: www.centropemap.org, authors.
The map calculator works similar to any standard desk calculator. The “C” button lets you undo your last
calculator action, i. e. remove a digit, an operator or a column name from the formula field. If you press
828
REAL CORP 2014:
PLAN IT SMART
Manfred Schrenk, Clemens Beyer, Norbert Ströbinger
“OK”, the formula will be checked for errors and executed, resulting in a new column within your custom
table.
CentropeSTATISTICS also allows to upload user-generated content into custom tables. Uploaded data may
be used for indicator calculation and map creation like any other values – the only difference is that, for
reasons of ensuring data quality, user-generated content is only stored temporarily and cannot be accessed by
other users through the cross-border database.
There is also a possibility to reclassify data by assigning new values to user-defined attribute ranges. This
can be a useful tool to hide or combine certain value ranges as the reclassification also influences the map
layout. In case of data reclassification, a new column is created so that the original values are preserved.
6 MULTI-LINGUAL WEBSITE
The CentropeMAP website is available in five languages (German, English, Czech, Slovak, Hungarian). It
offers information about the region, the project, and also a lot of downloadable material from maps and
tables to workshop protocols. Also the CentropeMAP help (“How to Use” guides for CentropeMAP and
CentropeSTATISTICS) are offered multilingually (German and English).
7 CONCLUSION AND OUTLOOK
Behind CentropeMAP and CentropeSTATISTICS there is a cross-border database collecting comparable
data from Austria, the Czech Republic, Slovakia, and Hungary. Due to different methods of survey and
analysis, only a small number of datasets turned out to be really comparable so that these numbers could be
put together in one common table for all four countries. The result of this data compatibility restriction is an
emphasis on population data in CentropeSTATISTICS because this is the only group of data so far which is
comparable within the Centrope region. Approximately twice a year experts from all partner regions meet to
discuss the further extension of this database. The 2011 census data – which will be available soon
throughout the whole region – are going to be an important source of information in CentropeSTATISTICS,
and they will allow CentropeSTATISTICS to expand the cross-border statistics datsbase onto new thematic
fields because the census was done in a way that data become comparable throughout all countries.
Proceedings REAL CORP 2014 Tagungsband
21-23 May 2014,Vienna, Austria. http://www.corp.at
ISBN: 978-3-9503110-6-8 (CD-ROM); ISBN: 978-3-9503110-7-5 (Print)
Editors: Manfred SCHRENK, Vasily V. POPOVICH, Peter ZEILE, Pietro ELISEI
829