1
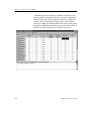
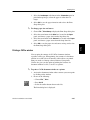
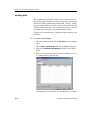
Running a ProjectLeader experiment
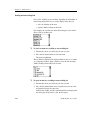
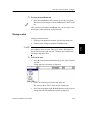
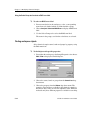
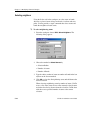
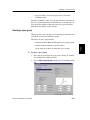
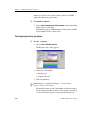
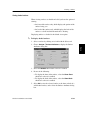
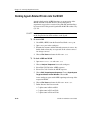
To add a statistical analysis to a worksheet
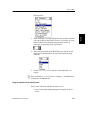
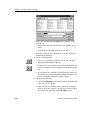
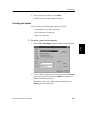
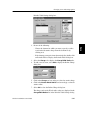
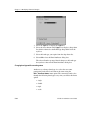
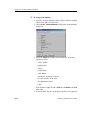
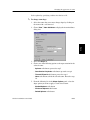
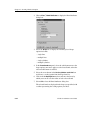
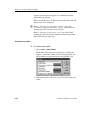
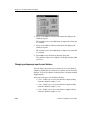
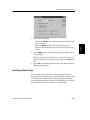
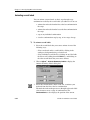
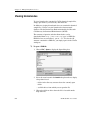
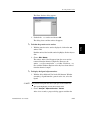
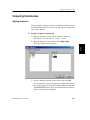
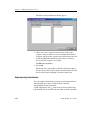
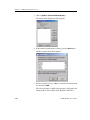
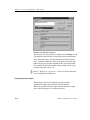
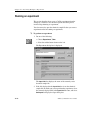
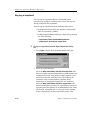
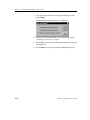
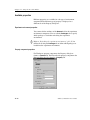
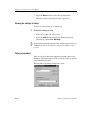
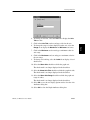
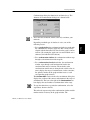
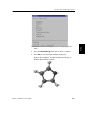
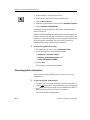
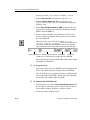
1. Double-click on an empty column title cell to display the Enter
Property dialog box.
2. Select the Analysis radio button, then select Next.
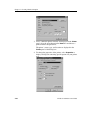
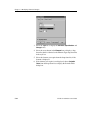
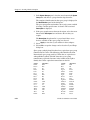
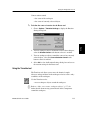
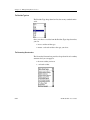
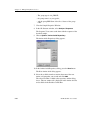
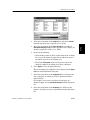
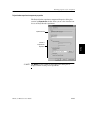
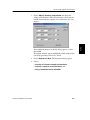
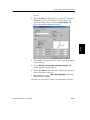
3. Select one of the types of regression from the Kind of analysis
scrolling list, then select Next.
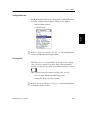
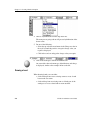
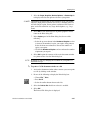
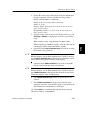
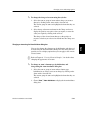
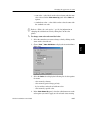
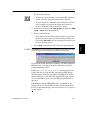
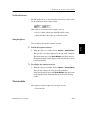
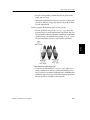
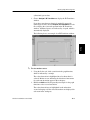
4. Select the column that contains the data you want to predict from
the Predict scrolling list.
Tutorials
ª
Introduction
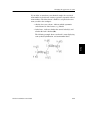
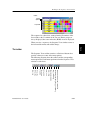
The sample component is displayed in the column title cell at the
top of the relevant column. When you evaluate any cell in this
column, the chosen sample component is calculated.
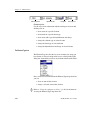
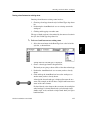
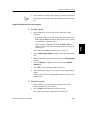
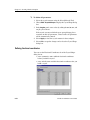
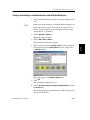
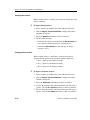
To add an equation to a worksheet
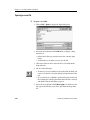
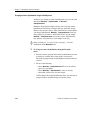
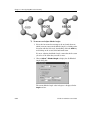
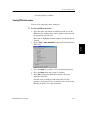
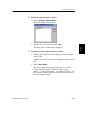
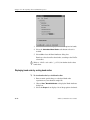
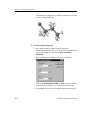
1. Double-click on an empty column title cell to display the Enter
Property dialog box.
2. Select the Analysis radio button, then select Next.
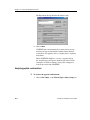
3. Select Algebraic Equation, then select Next.
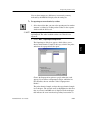
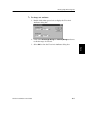
4. Type an algebraic equation into the Equation panel.
Start the equation with an equals sign, and use letters to refer to
the worksheet columns.
5. Select OK.
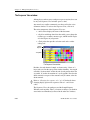
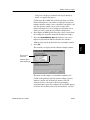
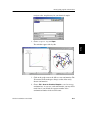
The equation is displayed in the column title cell at the top of the
BioMedCAChe User Guide
12-23
Using
Customizing
ª
Understanding
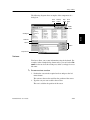
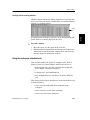
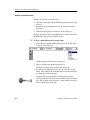
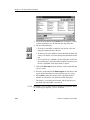
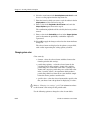
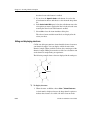
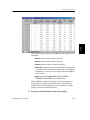
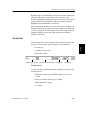
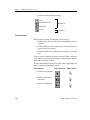
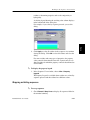
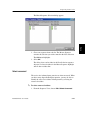
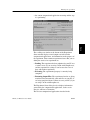
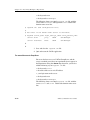
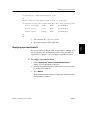
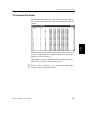
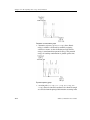
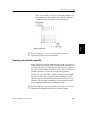
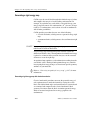
The regression equation, regression coefficient and crossvalidation are given in the column title. When you evaluate any
cell in this column, the regression is evaluated. Columns with no
predictive power, that is those without any variance, are omitted
from the regression. The regression equation for each
cross-validation step can be distinctly different for each model,
even if the overall regression equation is the same for a given set
of data to predict one variable.
Appendices
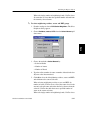
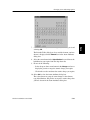
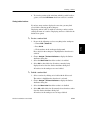
6. Select OK.
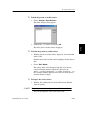
Using
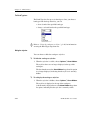
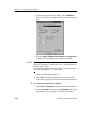
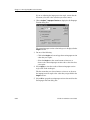
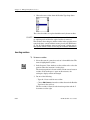
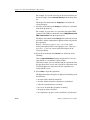
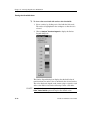
5. Select one or more columns to include in the regression from the
Using scrolling list.