1
Cursor button
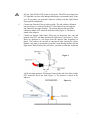
After clicking the cursor button, a vertical line is displayed in the graph that is used as a
reference indicator to get a more accurate wavelength reading for instance. If the mouse
cursor is placed near this line, the shape of the mouse cursor changes from an arrow to a
‘drag’shape. If this shape is displayed, the left mouse button can be used to drag (keep left
mouse button down) the line with the mouse towards a new position. Moving this line
shows the corresponding values of wavelength and amplitude in the main screen. As an
alternative for dragging the line, the small step and big step arrow buttons may be used, or
the left and right arrow keys on the keyboard. The step size for the arrow buttons can be
changed by holding down the CTRL-key while clicking at a (single or double) arrow
button.
Autoscale Y-axis button
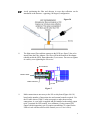
By clicking this button, the graph will be rescaled on-line. A maximum signal will be
shown at about 75% of the vertical scale. The same result can be achieved with the option
View-Autoscale Y-axis
Change Graph Scale button
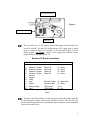
By clicking this button, a dialog will be shown in which the range can be changed for both
X- and Y-axis. This range can be saved as well and restored any time by clicking the Go to
Preset Scale button (see below). The menu option with the same functionality is ViewChange Graph Scale.
Goto Preset Scale button
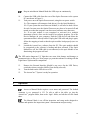
By clicking this button, the scale for X- and Y-axis will be set to a range that has been
set previously before. The same result can be achieved with the menu option View-Go
to Preset Scale
Graphic Reset button
By clicking this button, the X- and Y-axis will be reset to their default values. The same
result can be achieved with the option View-Graphic Reset
21