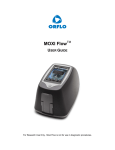
Download Moxi-Flow Technical Training Guide
Transcript
Revolutionizing Life Science Moxi Flow An Innova(ve New Approach to Flow Cytometry Training Guide 20131105 By: Don O’Neil SVP, Sales and Strategic Partnership, ORFLO Technologies • Amazing performance (up to 2.2 log Revolutionizing Life Science separa6on) • Combina6on 532 Laser w/ 590/40 PMT & Impedance detec6on (20nm size resolu6on • No training • 30 – 50K events measured in 10 seconds, outperforms any bench top or mid-‐6er flow cytometer on the market • Brand new Flow Cell for every experiment • Enables cell assay experiment “on-‐ demand” • Instant design of experiment execu6on & trend analysis • Save thousands of dollars on waste, cleaning and down 6me issues associated with tradi6onal flow cytometers • Ideal for cancer, stem cell, immunology, metabolic disease research The iPhone of Flow Cytometry Intui6ve User Interface Revolutionizing Life Science • Preset assays, no need for se\ng gains • U6lize “open-‐flow” for any PE labeled flow an6body • Compa6ble with PE, Sytox Orange, Ethidium Homodimer, Suncoast Yellow, Texas/Nile Red • Ability to store 1000’s of data files • FCS 3.1 data output enables more complex analysis with standard flow sobware • ORFLO’s also offers VESTIGO, simple intui6ve alterna6ve to complicated flow analysis sobware • Bluetooth label prin6ng Confiden6al Basic Func6onality Home Screen Revolutionizing Life Science Baiery indicator, if red, charge over night with wall plug Always run experiments with instrument plugged into the wall Baiery power should last all week Bluetooth enabled for prin6ng screen dumps and adding to lab book • Pre-‐set assay categories • Eliminates need for gain and power se\ngs, simply select and the system will walk you through how to run complete the test • When new applica6ons are developed (ie Cell Cycle) Orflo will send out OS updates, similar to iPhone, simply plug the unit in and drag and drop the files on top of the “Moxi-‐Flow” which appears as a hard drive in on your file manager Click for help, last screen will give you latest OS Click to set date and 6me Click to view other basic apps, rarely used, not important to highlight Click to view stored files (saves up to 500 data files on board) Confiden6al, not to be shared outside of Orflo or it's Distributors Running An Experiment Select your desired assay Revolutionizing Life Science Select assay by touching desired box Confiden6al, not to be shared outside of Orflo or it's Distributors Running An Experiment Screen immediately aOer assay selec(on Step by step instruc6ons given on screen Confiden6al, not to be shared outside of Orflo or it's Distributors Revolutionizing Life Science Running An Experiment Load cassePe Revolutionizing Life Science 1. Open top and boiom doors of unit 2. Insert the casseie 3. Close doors, be sure to keep index and pointer finger on lower door, while closing so that it doesn’t slam shut • If door slams shut, it’s not a problem, however closing the door gently is preferred Confiden6al, not to be shared outside of Orflo or it's Distributors Running An Experiment AOer inser(ng cassePe & closing doors laser auto aligns Revolutionizing Life Science • Alignment takes about 15 seconds • Do not open door un6l alignment completes • This alignment eliminates a major issue associated with tradi6onal flow cytometers that require lasers to be aligned, frequently aber shipping and typically once per year, or more • Requires a service technician and translates to significant instrument down 6me Confiden6al, not to be shared outside of Orflo or it's Distributors Running An Experiment System is now ready for sample to be pipePed Revolutionizing Life Science • Scaier plot screen empty • Data will plot in real-‐6me once sample is pipeied and door is closed • Fluorescence intensity axis (voltage from PMT) • Impedance axis, cell diameter • Fluorescence intensity axis (voltage from PMT) • Impedance axis, cell diameter Confiden6al, not to be shared outside of Orflo or it's Distributors Running An Experiment PipePe 5 sample into cassePe Revolutionizing Life Science 1. Open top door only 2. Rapidly pipeie 50ul sample into well of casseie • Do not worry about a bead forming • It’s important to pipeie rapidly in order to avoid air being drawn in, which will compromise the test 3. Close doors, be sure to keep index and pointer finger on lower door, while closing so that it doesn’t slam shut 4. The test will begin running and plot data in real-‐6me Confiden6al, not to be shared outside of Orflo or it's Distributors Basic Func6onality Manual Gate Mode Revolutionizing Life Science • Once complete data is presented in a scaier plot • Brightness of each popula6on indicates density/concentra6on • The brighter the more concentrated the popula6on Icon for toggling between ver6cal and horizontal gate adjust Ver6cal gate, use to separate two popula6ons by their diameter, these gates are ac6ve note large blue circle at top of gate Note green dot at boiom of leb ver6cal gate, this keeps the gate perfectly ve6cal Touch green dot and it will turn red, which enables you to angle gate Horizontal gate, use to separate out non-‐stained and stained popula6ons, gate is not ac6ve, ver6cal gates are in this screen shot System noise Mean cell concentra6on in gated region Mean cell/volume in gated region Store up to 5 gates se\ngs, this is handy for blood samples that have mul6ple cell types, which can be gated by size Use to zoom the x-‐axis (3 levels of auto scale) Toggle between scaier plot and histogram view mode Confiden6al, not to be shared outside of Orflo or it's Distributors Basic Func6onality Manual Gate Mode Revolutionizing Life Science • X-‐axis zoomed in (2-‐17um) • No6ce popula6ons look wider • Next we will adjust the gates Confiden6al, not to be shared outside of Orflo or it's Distributors Basic Func6onality Re-‐gated for accurate measurement Revolutionizing Life Science • File name, click to change • If dilu6ng, it may be handy to enter dilu6on factor into file name • One proposed conven6on • “sample-‐name_cell-‐type_dilu6on-‐factor.fcs” • These are the gated regions • All values for fluorescence intensity and size will be generated from events only occurring in the these two regions • Use the STO store gate func6on to gate around other popula6ons and rapidly quan6fy their values • Note leb ver6cal gate has red dot at boiom • This enables angling to gate • The gate can be wrapped around the y-‐axis fluorescence, if a more extreme angle is required • Note concentra6on and size have changed from the unadjusted gates Confiden6al, not to be shared outside of Orflo or it's Distributors • Click to save and or print file • Screen shot can be saved, or printed via blue-‐tooth label printer Basic Func6onality Fluorescence histogram view Revolutionizing Life Science MFI: Mean fluorescence intensity, can be used to quan6tate protein expression, based of user created standard curve You can calculate the log difference in intensity between dim and stained popula6on Subtract MFI values: 2.82 – 1.22 = 1.6 log difference Click “Cell Histo” icon to view size histogram Confiden6al, not to be shared outside of Orflo or it's Distributors Basic Func6onality Cell diameter histogram view Revolutionizing Life Science Observa6on: Note both popula6on are bi-‐modal in size These are beads which are manufactured with two different bead sizes to achieve a desired mean diameter The Moxi Flow with it’s 10nm bin resolu6on has the sensi6vity to detect these incredibly small size changes This is an enabling feature for studying morphology changes (swelling) over 6me, that no other instrument can enable Mean cell diameter of gated popula6on intensity, can be used to quan6tate protein expression, based of user created standard curve Confiden6al, not to be shared outside of Orflo or it's Distributors Open Flow Mode 3 different gain levels can be selected Revolutionizing Life Science Touch here and the different gain se\ngs will appear Select either high, medium, default or low If you have a known low expressing marker like CD19 set gain to high to create more separa6on Confiden6al, not to be shared outside of Orflo or it's Distributors Naming File Revolutionizing Life Science • Aber touching file name (appears in green box) this screen will appear, which allows you to name the file • .FCS is done automa6cally, no need to type in the .FCS Confiden6al, not to be shared outside of Orflo or it's Distributors Key Takeaways Revolutionizing Life Science • Be sure to dilute so cells are in op6mal concentra6on range • 1,000-‐1.5M cells/ml for S-‐Casseies • 1,000 – 500K cells/ml for M-‐Casseies • Cells need to be in size range of our casseies • S-‐casseies: 2.8-‐18um mean diameter • M-‐casseies: 10-‐25um mean diameter • Always run experiments with instrument plugged into wall • Pipeie quickly and don’t worry about the bubble that forms it will be drawn in by our vacuum pump Confiden6al, not to be shared outside of Orflo or it's Distributors Moxi Flow Bench Mark Table Fig. 4– Average coefficients of varia6on (CV) percentages for both counts and viability measurements for all systems. Error bars represent one standard devia6on. Confiden6al Revolutionizing Life Science Moxi Flow Go To Market Approach (RUO) Revolutionizing Life Science Pitch as Rapid, “Plug & Play” Affordable Protein and Cell Analyzer TargeEng 4 Key Category Areas in Cell and Protein Biology 1 Open PlaQorm Flow Cytometry PE, Sytox Orange, Nile Red, Suncoast Yellow, Ethidium Homodimer Single marker, transfecEon efficiency, purity checks Under the hood experimentaEon, trend & Eme course Target 700K researchers across well defined customer segments 2 Powerful Immunology Analyzer 4 Part Diff. WBC’s counts (lympho, mono, granulacyte) Single CD marker expression Instant direct size confirmaEon Cell Biology Cancer, Neuro, Metabolism Immunology 3 4 MulEplex quanEtaEve protein expression analysis “on-‐demand” 1-‐6 plex bead assays Stem Cell Labs Tissue Culture Cell Health & QC Gold Standard Counts, Viability Apoptosis, Cell Cycle Microbe contaminaEon “Quick-‐Check” Cell Volume, morphology PD Groups Flow Cores 1. In most cases lead with “open flow” have customers prepare samples ahead of demo (PE labeled flow ab) 2. During demo customer will begin thinking of other ways to use the system Bench Top Flow Compe66ve Landscape Revolutionizing Life Science Moxi Flow Muse Accuri C6 easyCyte MACSQuant MFG Orflo EMD Millipore BD EMD Millipore Partec Price $9,995 $15,000 $70,000 $50-‐125K $80-‐120K Features • • • • • • • • • 1 Laser (532nm – green) • 2 colors (YLW, Red), FSC • Cell Counts via forward scaier • 100-‐300ul sample • 2-‐3 minute read 6me • AC powered • • • • • 2 Laser 4 colors, FSC, SC 100-‐200ul sample 1-‐2 minute read 6me Peristal6c pump creates noise challenge, but lower price • AC powered • Up to 2 Laser • Up to 6 colors • 2 Laser • Up to 8 colors, FSC, SC • 2 minute read 6me • • ☟ ☟ • Requires skilled flow cytometrist to use • Sheath fluid waste • Spend 7X more 6me maintaining than running (from user manual and manufacturer’s recommenda6ons) • Complete solu6on of reagents, analy6c • Flow cell enables small sample, less waste • Requires skilled flow cytometrist to use • Posi6oning Brand 1 Laser (532), 1 PMT (590/40) Direct size (3D+2D) via coulter principle Disposable flow cell 50ul sample 10 second read 6me 2lbs 11 oz (3”x 6” X 5”) Baiery and AC powered <3% CV and <5% error, count & viability ☝ World’s first combina6on flow cytometer under $10K ☝ Direct viability and count, with combined flow cytometry and coulter accuracy and precision ☝ Single cell resolu6on ☝ Industry leading ease of use ☝ No cleaning no maintenance ☝ Rapid run and analysis 6me ☝ The ideal cell assay development, QC, Design Of Experiment and Trend analyzer ☝ In-‐hood capable, blue tooth prin6ng ☝ iPhone like simplicity and power Single cell resolu6on Low Cost Instrument Moderate ease of use Requires cleaning, flow cell subject to clogging and frequent replacement ☟ Closed system ☟ No mul6plexing capabili6es for bead based assays ☟ Spend 7X more 6me maintaining than running (from user manual and manufacturer’s recommenda6ons) Requires skilled flow cytometrist to use • Sheath fluid waste Mul6plex Compe66ve Landscape Revolutionizing Life Science Brand Moxi Flow + OS Plex Luminex LX200, FM3D Luminex MagPix MSD Price $13,995 $50-‐120K $35K $100-‐$150K Features and Specs • • • • • • • • 2 Laser • 3 colors • Plate based • Image based system • 3 log dynamic range • 1pg/ml sensi6vity • Func6onal detec6on limit (binding assays): ~106 labels • Dynamic range: 105 • Read 6me: 70 seconds per plate • Cooled CCD camera • Custom telecentric lens • Integrated bar code readers • Two-‐dimensional mo6on control • 3 second per sample Posi6oning VS Compe66on ☝ World’s first combina6on flow and MPX bead analyzer for under $10K ☝ Direct viability and count, with combined flow cytometry and coulter accuracy and precision ☝ Single cell resolu6on ☝ Industry leading ease of use ☝ No cleaning no maintenance as the casseie = the flow cell ☝ Rapid read 6me ☝ The ideal cell assay development, QC instrument ☝ In-‐hood capable • Extremely complicated front end • Fickle fluidic management • Requires cleaning maintenance • Steep learning curve • Not at all plug and play • Extremely complicated front end • Fickle fluidic management • Requires cleaning maintenance • Steep learning curve • Not at all plug and play • Plex limited at 10 • Fickle fluidic management • Requires cleaning maintenance • Steep learning curve • Not at all plug and play 1 Laser (532), 1 PMT Direct size via coulter Disposable casseie 50ul sample 10 second per sample read 6me 10-‐4000 pg/ml dynamic range 3-‐6 plex capability Product Comparison Heat Map Versus Imaged Based Approaches (Viability and Cell Coun6ng) Viability Instrument Cost Event Rate Open Flow Cytometer Apoptosis, Cell Cycle, Multiplex bead assays Count Cell Diameter Moxi Flow Nucleo-counter 100X separation with PI Yes, PI based, but vision based approach lacks accuracy $9,995 $15,000-$25,000 $50,000 30-50K (10 sec) 100’s-1000 (minutes) 5,000 (minutes) Yes 1um resolution on size Can’t handle complex samples 10nm resolution 1um resolution Yes Mean Cell Volume Yes In Hood Use Yes Vi-Cell, Cedex (vision) Cellometer Luna, Countess, TC20 2X separation w/ Trypan Blue Exclusion +20% error (accuracy & precision) $19,000-‐$50,000 Euro 100’s (1 minute) No Gold standard Coulter <3% error Cell Volume Revolutionizing Life Science Less than 20% accuracy and precision Can’t handle complex samples (RBC lysed whole blood, PBMC’s) 1um resolution No No 2D image only No No Test Time and sample volume 10 sec 50 ul 30 seconds 1-2 minutes 500ul 1-2 minutes 100 ul Instrument Cost $9,995 $14,000-20K $40,000-$50,000 $5,00-20,000 $2.14 per test $2.66/Cartridge plus two reagents 500ul sample, time, $1.14 reagents per sample Repeats required, time, not reliable Up to $3/test w/ 3 Running cost (US LP) Tradi6onal Flow Cytometry Drawbacks Revolutionizing Life Science • Significant cost and 6me associated with non-‐value added ac6vi6es – Startup, shutdown, cleaning, decontamina6on, de-‐clogging, maintenance, calibra6on, sheath fluid consump6on (as per manufacturers recommenda6on) and waste disposal • Overkill capability and complexity – – – – For most experiments 1 log separa6on is all that is needed for an accurate/precise answer More than two colors, mul6ple laser func6onality serves niche need in market place 96 well plate automa6on is also overkill for the everyday researcher who studies 3-‐6 samples per week Moxi Flow single color and impedance sa6sfies large unmet need for rapid, accurate, precise answers to scien6fic ques6ons, under the hood • Most bench top service plans exceed the cost of the Moxi Flow! • Tradi6onal Flow Cytometers are PC based controlled with complicated sobware – Complicated and overkill for majority of applica6ons that the “every-‐day” researcher is focused on Moxi Flow Truly is the iPhone of Flow Cytometry Intui6ve, Powerful, Fast, Affordable and Allows Researchers to spend their 6me on research, not non-‐value added ac6vi6es Summary of Non-‐Value Added Cost and Time Using Tradi6onal Flow Cytometers Utilization)Assumptions)Per)Instrument Usage&rate&(per&week) Average&tests&per&day Weeks&per&year Assumed&rate&of&clogging&as&a&%&of& total&annual&tests Average&tests&per&year&(used&as&basis& for&each&platform) Labor&Rate&in&$'s&fully&burdened Total&Cost&&&Time&Associated&with&NON4 VALUE&Added&Activities Moxi&Flow Accuri Muse MACSQuont Revolutionizing Life Science 5 3 50 5% 750 $40 Consumable+&+ Standard+ Consumable+&+ Maintenance+Cost+ Standard+Maintenance+ Per+Year Cost+Per+Test Time+per+year+(hours) $1,575& $2,217 $3.69 138 $2,545 $4.24 60 $568 $0.95 104 Average+Time+per+test+ (min) 0.5 13.78 6.00 10.35 Average+Time+per+test+(min)+ Annual+Labor+Cost Per+Test+Labor+Cost Total++Cost+Per+ Test Total+Annual+ Cost $5,513.33 $2,400.00 $4,140 $9.19 $221.69 $6.90 $12.88 $225.93 $7.85 $7,730 $4,945 $4,708 Consumable+&+Standard+ Maintenance+Cost+Per+Year+ MACSQuont# MACSQuont# Muse# Muse# Accuri# Accuri# Moxi#Flow# Moxi#Flow# 0.0# 2.0# 4.0# 6.0# 8.0# 10.0# 12.0# 14.0# 16.0# $0## $500## $1,000## $1,500## $2,000## $2,500## $3,000## ACCURI(W(BD Accuri Hidden Costs and Time Detailed Analysis Revolutionizing Life Science Ra6o of Maintenance Time to Actual Analysis Time = 13.8 Minutes/2 minutes (7X) Weight: 30 lbs (11” x 14.75” x 16.5”) Recommended(by(Manufacturer Cleaning,)decontamination,)de/clogging)&) Washing Power&on&sytem&flush Shut&down&decontamination DeDclog&(assume&once/week) Wash&flow&cell&after&each&sample Maintenance Laser&Alignment 2&month&maintenance&(tubing,&filters 1&Year&Maintenance Consumables)Used)During)Test Sheath&fluid&used&in&typical&run Calibration Cassette WASTE(Disposal Volume&of&biological&waste&per&year Total)Cost)&)Time)Associated)with)NON/ VALUE)Added)Activities Source Frequency((per(year) Time(Required(MFG( Recommended(Step( (minutes) Usesr&guide Usesr&guide User&Manual Usesr&guide 250 250 50 750 10 10 30 5 Volume(of(solution( used(per(activity((ml) Cost(per(ml 8 $0.03 4 $0.18 4 $0.03 2 $0.03 Total)Wash/Decontamination)Costs)&)Time Time(Required(MFG( Recommended(Step( (minutes) Cost(per(test( (averaged(out( over(1(year) Total(Time( Per(Year( (min) Time(Per( Test((min) $66.00 $175.00 $1.65 $49.50 $292.15 $0.09 $0.23 $0.00 $0.07 $0.39 2500 2500 1500 3750 10,250 3.3 3.3 2 5 13.7 Cost(per(Year $200.00 $900.00 $825.00 $1,925.00 Cost(per(test( (averaged(out( over(1(year) $0.27 $1.20 $1.10 $2.57 Total(Time( Per(Year( (min) Time(Per( Test((min) 60 10 70 0.08 0.01 0.09 Source Industry&expert User&Manual User&Manual Frequency(per(year 1 6 1 Sheath(Fluid(Flow( Rate((ml/min) 6 Average(Run(Time( (seconds) 152 Volume(of(solution( used((ml) 15.2 Cost/ml(of( Bacteriostatic( Concentrate $0.0055 Cost(of(DI(H20(per(ml $0.0009 Cost(per(Year $72.73 Cost(per(test( (averaged(out( over(1(year) $0.10 NA NA NA NA NA NA NA Cost(Per(Year Cost(Per(Test Time(per(year((hours) Average(Time(per(test( (min) Annual(Labor(Cost Per(Test(Labor(Cost Total((Cost(Per( Test $2,289.88 $3.05 &&&&&&&&&&&&&&&&&&&&&&&&&&&&&&&&172 13.76 $6,880 $9.17 $12.23 10 10 Kit(Cost Cost(per(year((using( test(per(year( assumptions) $150.00 $825.00 Total)Routine)Maintenance)Costs Liters 16.1 Total(Annual( Cost $9,169.88 Muse(K(EMD(Millipore Muse Hidden Costs and Time Detailed Analysis Revolutionizing Life Science Ra6o of Maintenance Time to Actual Analysis Time = 6 Minutes/2 minutes (3X) (Weight = 13.1 lbs, 8.1” x 11.1” x 8.7”) Cost(per(year((using( test(per(year( assumptions) Cost(per(test( (averaged(out( over(1(year) Total(Time( Per(Year( (min) Time(Per( Test((min) $1,500.00 $41.25 $82.50 $41.25 $16.50 $1,681.50 $2.00 $0.06 $0.11 $0.06 $0.02 $2.24 1250 500 1250 500 1000 4,500 1.7 0.7 1.7 0.67 1.33 6.0 Recommended(by(Manufacturer System'Check,'Cleaning,'Decontamination Power&on&system&Check&(beads,&3X) Capillary&rinse&(Guava&ICF) Complete&clean&(end&of&each&day) Quick&clean& DeQclog&(assume&once/week) Source Frequency((per(year) Time(required(to( perfor(step((minutes) Usesr&guide&(pg&46) Usesr&guide Usesr&guide&(pg&59) User&Manual Usesr&guide 250 250 250 250 50 5 2 5 2 20 Consumables'Used'During'Test Flow&Cell&(VOC) Cassette Replacements(per( year 4 NA 152 NA 10.1 NA $0.0055 NA Cost $400.00 NA Cost(per(Year $1,600 NA Cost(per(test( (averaged(out( over(1(year) $2.13 NA Cost(Per(Year( (materials) Cost(Per(Test Time(per(year((hours) Average(Time(per(test( (min) Annual(Labor(Cost Per(Test(Labor(Cost Total((Cost(Per( Test $3,281.50 $4.38 &&&&&&&&&&&&&&&&&&&&&&&&&&&&&&&&&&75 6.00 $3,000.00 $22.90 $27.27 Total'Cost'&'Time'Associated'with'NONJ VALUE'Added'Activities Volume((units(or(ml) Cost(per(unit(or(ml 3 $2.00 0.50 $0.33 1.00 $0.33 0.50 $0.33 1.00 $0.33 Total'Wash/Decontamination'Costs'&'Time Total(Annual( Cost $6,281.50 MACSQuant(T(Miltenyi MACSQuant Hidden Costs and Time Detailed Analysis Revolutionizing Life Science Ra6o of Maintenance Time to Actual Analysis Time = 10.4 Minutes/2 minutes (5X) Weight: 100 lbs (23.6” x 13.8” x 15.7”) Recommended(by(Manufacturer Cleaning,)decontamination,)de/clogging,) calibration)&)Washing Power&on&sytem&flush Shut&down&decontamination DeEclog&(assume&once/week) Calibration&(automated) Wash,&clean&and&backflush Maintenance Exchanging&Hydrophobic&Air&Filters Laser&reEalignment Source Frequency((per(year) Time(Required(MFG( Recommended(Step( (minutes) Tech&Service&Chat Usesr&guide Industry&Expert User&Manual Tech&Service&Chat 250 250 5 250 250 7 7 30 20 16 Frequency(per(year 1 1 Time(Required(MFG( Recommended(Step( (minutes) 10 60 Source User&Manual Tech&Service&Chat Volume(of(solution( used(per(activity((ml) Cost(per(ml 6.6 $0.03 4 $0.00 4 $0.03 0.1 $38.00 6.6 $0.02 Total)Wash/Decontamination)Costs)&)Time Unit(Cost $30.00 $150.00 Total)Routine)Maintenance)Costs Consumables)Used)During)Test Sheath&fluid&used&in&typical&run&(tech& service&chat) Cassette WASTE(Disposal Volume&of&biological&waste&per&year Total)Cost)&)Time)Associated)with)NON/ VALUE)Added)Activities Cost(per(year((using( test(per(year( assumptions) Cost(per(test( (averaged(out( over(1(year) Total(Time( Per(Year( (min) Time(Per( Test((min) $54.45 $4.44 $0.17 $950.00 $24.75 $1,033.81 $0.07 $0.01 $0.00 $1.27 $0.03 $1.38 1750 1750 150 2.3 2.3 0.2 4000 7,650 5.3 10.2 Cost(per(Year $30.00 $300.00 Cost(per(test( (averaged(out( over(1(year) $0.04 $0.40 Total(Time( Per(Year( (min) 10 60 Time(Per( Test((min) 0.01 0.08 $330.00 $0.44 60 0.08 Sheath(Fluid(Flow( Rate((ml/min) Average(Run(Time( (seconds) Volume(of(solution( used((ml) Cost(per(ml Cost(per(ml Cost(per(Year Cost(per(test( (averaged(out( over(1(year) NA NA 6.6 NA $0.0039 NA $0.0009 NA $23.71 NA $0.03 NA Cost(Per(Year Cost(Per(Test Time(per(year((hours) Average(Time(per(test( (min) Annual(Labor(Cost Per(Test(Labor(Cost Total((Cost(Per( Test Total(Annual( Cost $1,387.51 $1.85 129 10.28 $5,140 $6.85 $8.70 $6,527.51 Liters 9.3 Flow Performance Comparison Parameter Sample'size'(ul),'(competitors'sample'sizes' are'determined'from'recommended'User' Manuals'by'suppliers) Flow'rate'(ul's/sec) Average'Cell'Concentration'per'test'(cells/ul) Average'Test'time'(seconds) Cells'analyzed'per'second Average'number'of'cells'analyzed'per'test Revolutionizing Life Science Moxi+Flow Accuri Muse MacsQuant 27 100 100 100 2.73 0.66 0.36 0.83 1,000 500 250 500 10 2,730 27,300 152 330 50,000 278 90 25,000 120 417 50,000 Moxi Flow Outperforms Instruments that are 4-‐10X It’s cost Vestigo – Flow Analysis Software • • • • • • Intui6ve UI for a broader cytometry user base Flow Cytometry Standard (FCS) compa6bility Automated 2D Gaussian Curve-‐Fi\ng • Maximum likelihood es6ma6on • Removes subjec6vity of ga6ng analysis • Precise popula6on core iden6fica6on • Fully automated or user-‐defined regions Iden6fies poten6al “hidden” popula6ons Easily groups iden6fied regions Demo using web-‐ex Revolutionizing Life Science Revolutionizing Life Science Moxi Flow, Single Color Flow Standard CD Markers Sample Set Overview (test date: 20130913) All prep performed by Elena Wang, Biolegend Custom Specialists Revolutionizing Life Science • Sample Cell Type: Peripheral Human Blood • Sample Prepara6on: – RBC Lyse hip://www.biolegend.com/rbc-‐lysis-‐buffer-‐10x-‐1498.html – PE an6-‐human an6body stain with Biolegend reagent • Sample 1 (test 18): Stained with BioLegend PE an6-‐human CD3 An6body (100ul/ 100ul of whole blood) • Sample 2 (test 19): Stained with BioLegend PE an6-‐human CD4 An6body (100ul/ 100ul of whole blood) • Sample 3 (test 20): Stained with BioLegend PE an6-‐human CD8a An6body (100ul/ 100ul of whole blood) • Sample 4 (test 22): Stained with BioLegend PE an6-‐human CD45 An6body (100ul/ 100ul of whole blood) – All samples were then tested on the LSR pre-‐dilu6on – Aber LSR tes6ng a 10 to 1 dilu6on was performed for the Moxi Flow experiments (less than 2 minutes) – 5 Moxi Flow runs were performed in 1-‐2 minutes Whole Blood Reference Table Revolutionizing Life Science Component Count/ml RelaEve % Diameter (um) Class Lymphocyte 1.7-‐3.5M 25-‐35% 7-‐8 aGranulocyte Monocyte 200-‐600K 4-‐6% 14-‐17 aGranulocyte Neutrophil 2.5-‐7M 50-‐70% 10-‐12 Granulocyte Eosinophil 100-‐300K 1-‐3% 10-‐12 Granulocyte Basophil 40-‐100K 0.4-‐1% 12-‐15 Granulocyte Total WBC 4.5-‐10M Component Count/ml RelaEve % Diameter (um) Class RBC 5B 5-‐6 RBC Platelets 150-‐450K 2-‐3 PE CD3 An6 Human Stained Peripheral Blood Sample Revolutionizing Life Science Cropped to include only WBC’s Granulocytes (Pop 0): 40% of total WBC Lymphocytes (Pop 2): 54% of total CD3+ (green): 6.1% of total WBC Comments • Dynamic range – 1.3 log (MF) vs 3.0 (LSR) • Moxi Flow provides very clear and sufficient separa6on of the primary stained CD4+ lymphocytes • Also has the advantage of impedance channel and providing direct and instant confirma6on PE CD4 An6 Human Stained Peripheral Blood Sample Revolutionizing Life Science Cropped to include only WBC’s Granulocytes (Pop 0): 39% of total WBC Lymphocytes (Pop 2): 56% of total CD4+ (green): 4.5% of total WBC Comments • Dynamic range – 1.8 log (MF) vs 2.0 (LSR) • Moxi Flow provides very clear and sufficient separa6on of the primary stained CD4+ lymphocytes • Also has the advantage of impedance channel and providing direct and instant confirma6on PE CD45 An6 Human Stained Peripheral Blood Sample Revolutionizing Life Science Cropped to include only WBC’s Granulocytes (Pop 0): 34% of total WBC Lymphocytes (Pop 2): 57% of total CD45+ (green): 8.7% of total WBC Comments • Dynamic range – 1.5 log (MF) vs 3 (LSR) (cd45+ lympho’s) – 0.5 log (MF) vs 2 (LSR) CD45+ (granulocytes) • Moxi Flow provides very clear and sufficient separa6on of the primary stained CD4+ lymphocytes • Also has the advantage of impedance channel and providing direct and instant confirma6on PE CD8 An6 Human Stained Peripheral Blood Sample Revolutionizing Life Science Cropped to include only WBC’s Granulocytes (Pop 0): 47% of total WBC Lymphocytes (Pop 1): 47% of total Monocytes (grey): 1% CD8+ (yellow): 1.2% of total WBC Comments • Dynamic range – 1.5 log (MF) vs 3 (LSR) (cd8+ lympho’s) • Moxi Flow provides very clear and sufficient separa6on of the primary stained CD4+ lymphocytes • Also has the advantage of impedance channel and providing direct and instant confirma6on Viability (Sytox Orange) plus AnnexinV Simultaneously Revolutionizing Life Science Comments • Clear separa6on of popula6ons – Yellow (Sytox Orange +): Dead – Green (AnnexinV +): Apopto6c – Red: Live Revolutionizing Life Science Examples of Different ApplicaEons Moxi Flow Viability for More Typical Cell Necrosis Approach Viability decrease à • • • • • Typical, healthy Suspension CHO culture Suspension CHO culture aber over-‐growth of cells (Test 27) Clear separa6on and clustering of dead cells (6ght fluorescence distribu6on and ~1.8 Log (>60x) separa6on in live vs. dead cells) Scaier plots are typical (compared to CHO H2O2-‐killed cell data shown previously) based on viability tes6ng at Orflo Moxi Flow provides a unique insight to size distribu6on through it’s direct sizing capability, with 20nm resolu6on (volume & diameter) Viability decrease à Revolutionizing Life Science Sample Set Overview (test date: 20130920) All prep performed by customer, PE CD4 Experiment Revolutionizing Life Science • Sample Cell Type: Peripheral Human Blood Mono-‐nuclear Cytes • Sample Prepara6on: – Ficoll Paque Centrifuga6on – 4 days of suspension culture in Mabvax Media condi6ons (note an6body was 4-‐5 years old) • Sample 1 (test 32): Stained with Mabvax PE an6-‐human CD4 An6body • Sample 2 (test 33): Stained with Mabvax PE an6-‐human CD4 An6body • Sample 3 (test 34): Stained with Mabvax PE an6-‐human CD4 An6body • Sample 4 (test 35): Stained with Mabvax PE an6-‐human CD4 An6body • Sample 5 (test 36): Stained with Mabvax PE an6-‐human CD4 An6body • Sample 6 (test 37): Stained with Mabvax PE an6-‐human CD4 An6body – Note Moxi Flow system was running off of baiery power – All samples were then tested on the LSR pre-‐dilu6on – Aber LSR tes6ng a 10 to 1 dilu6on was performed for the Moxi Flow experiments (less than 2 minutes) – 5 Moxi Flow runs were performed in 1-‐2 minutes PBMC Analysis Snapshot of En6re Sample PE CD4 An6 Human PBMC Sample1 (Test 32) Revolutionizing Life Science Sample Snapshot Count % Debris (red) 8,953 64% Residual RBC’s (green) 699 5% CD4-‐ Lymphocytes (orange) 1691 12% CD4+ Lymphocytes (yellow) 1505 11% CD4-‐ monocytes (white) 260 2% CD4+ monocytes (blue) 129 1% Other debris (grey) 824 6% Comments • Dynamic range – 0.5 log, some error introduced due to minimal overlap, but es6mate this is less than 2-‐3% error contribu6on – Sufficient separa6on to quan6fy CD4 + lymphocytes (green) • Impedance channel observa6ons – Clear direct sizing and counts of CD4+&-‐ lymphocytes, as well as the monocytes (blue) – Impedance channel reveals small residual granulocyte popula6on, despite Ficoll-‐Paque Prep – Enables amazing sensi6vity on count, down to as few as 33 Cell Count % CD4+ Lymphocytes (green) 1,508 42% CD4-‐ Lymphocytes (yellow) 1,675 47% CD4-‐ Monoctyes (blue) 218 6% CD4+ Monocytes (orange) 33 1% CD4-‐ Granulocytes 105 3% CD4+ Granulocytes PBMC Analysis Snapshot of En6re Sample PE CD4 An6 Human PBMC Sample1 (Test 33) Revolutionizing Life Science Sample Snapshot Count % Debris (red) 11,210 56% 947 5% CD4-‐ Lymphocytes (orange) 3,440 17% CD4+ Lymphocytes (yellow) 3,774 19% CD4-‐ monocytes (white) 398 2% CD4+ monocytes (blue) 301 1% Other debris (grey) 824 6% Residual RBC’s (green) Comments • Dynamic range – 0.5 log, some error introduced due to minimal overlap, but es6mate this is less than 2-‐3% error contribu6on – Sufficient separa6on to quan6fy CD4 + lymphocytes (green) • Impedance channel observa6ons – Clear direct sizing and counts of CD4+&-‐ lymphocytes, as well as the monocytes (blue) – Impedance channel reveals small residual granulocyte popula6on, despite Ficoll-‐Paque Prep – Enables amazing sensi6vity on count, down to as few as 33 Cell Count % CD4+ Lymphocytes (green) 1,508 42% CD4-‐ Lymphocytes (yellow) 1,675 47% CD4-‐ Monoctyes (blue) 218 6% CD4+ Monocytes (orange) 33 1% CD4-‐ Granulocytes 105 3% CD4+ Granulocytes PBMC Analysis Snapshot of En6re Sample PE CD4 An6 Human PBMC Sample1 (Test 34) Revolutionizing Life Science Sample Snapshot Count % Debris (orange) 10,916 59% Residual RBC’s (yellow) 1,267 7% CD4-‐ Lymphocytes (green) 2717 15% CD4+ Lymphocytes (red) 2792 15% CD4-‐ monocytes (white) 435 2% CD4+ monocytes (blue) 145 1% CD4-‐ Residual Granulocytes (grey) 145 1% Comments • Dynamic range – 0.5 log, some error introduced due to minimal overlap, but es6mate this is less than 2-‐3% error contribu6on – Sufficient separa6on to quan6fy CD4 + lymphocytes (red) versus CD4-‐ lymphocytes • Impedance channel observa6ons – Clear direct sizing and counts of CD4+&-‐ lymphocytes, as well as the monocytes (blue) – Impedance channel reveals small residual granulocyte popula6on, despite Ficoll-‐Paque Prep – Enables amazing sensi6vity on count, down to as few as 129 events Cell Count % CD4+ Lymphocytes (green) 2,886 48% CD4-‐ Lymphocytes (red) 2,504 42% CD4-‐ Monoctyes (yellow) 476 6% CD4+ Monocytes (grey) NA <1% CD4-‐ Granulocytes (orange) 129 3% CD4+ Granulocytes (grey) NA <1% PBMC Analysis Snapshot of En6re Sample PE CD4 An6 Human PBMC Sample1 (Test 35) Revolutionizing Life Science Sample Snapshot Count % Debris (orange) 2,239 25 Residual RBC’s (yellow) 763 9 CD4-‐ Lymphocytes (green) 2,807 31 CD4+ Lymphocytes (red) 2,630 29 CD4-‐ monocytes (white) 392 4 CD4+ monocytes (blue) 109 1 CD4-‐ Residual Granulocytes (grey) NA <1% Comments • Dynamic range – 0.5 log, some error introduced due to minimal overlap, but es6mate this is less than 2-‐3% error contribu6on – Sufficient separa6on to quan6fy CD4 + lymphocytes (red) versus CD4-‐ lymphocytes • Impedance channel observa6ons – Clear direct sizing and counts of CD4+&-‐ lymphocytes, as well as the monocytes (blue) – Impedance channel reveals small residual granulocyte popula6on, despite Ficoll-‐Paque Prep – Enables amazing sensi6vity on count, down to as few as 129 event • Debris region overlaps with system noise Cell Count % CD4+ Lymphocytes (green) 2,324 41 CD4-‐ Lymphocytes (red) 2,903 51 CD4-‐ Monoctyes (yellow) 414 7 CD4+ Monocytes (grey) NA CD4-‐ Granulocytes (orange) NA CD4+ Granulocytes (grey) PE CD4 An6 Human PBMC Sample1 (Test 36, must be the treated sample) Snapshot of En6re Sample Sample Snapshot Count Debris (orange) 4,958 35% Residual RBC’s (yellow) 936 7% CD4-‐ Lymphocytes (red) 4,781 34% CD4+ Lymphocytes (green) 2,632 19% CD4-‐ monocytes (white) 365 3% CD4+ monocytes (blue) 347 2% CD4-‐ Residual Granulocytes (grey) NA Cell PBMC Analysis % Revolutionizing Life Science Comments • Dynamic range – 0.5 log, some error introduced due to minimal overlap, but es6mate this is less than 2-‐3% error contribu6on – Sufficient separa6on to quan6fy CD4 + lymphocytes (red) versus CD4-‐ lymphocytes • Impedance channel observa6ons – Clear direct sizing and counts of CD4+&-‐ lymphocytes, as well as the monocytes (blue) – There appears to be a significant morphology change in the PBMC’s, significant swelling (30% or more) – Enables amazing sensi6vity on count, down to as few as 129 event • Debris region overlaps with system noise Count % CD4+ Lymphocytes (green) 1,581 20% CD4-‐ Lymphocytes (red) 5,713 73% CD4-‐ Monoctyes (yellow) 331 4% CD4+ Monocytes (grey) 150 2% CD4-‐ Granulocytes (orange) NA CD4+ Granulocytes (grey) NA PE CD4 An6 Human PBMC Sample1 (Test 37) PBMC Analysis Snapshot of En6re Sample Sample Snapshot Count Revolutionizing Life Science % Debris (orange) 1,811 21% Residual RBC’s (yellow) 528 6% CD4-‐ Lymphocytes (green) 3,155 37% CD4+ Lymphocytes (red) 2,439 29% CD4-‐ monocytes (white) 367 4% CD4+ monocytes (blue) 128 2% CD4-‐ Residual Granulocytes (grey) NA Comments • Dynamic range – 0.5 log, some error introduced due to minimal overlap, but es6mate this is less than 2-‐3% error contribu6on – Sufficient separa6on to quan6fy CD4 + lymphocytes (red) versus CD4-‐ lymphocytes • Impedance channel observa6ons – Clear direct sizing and counts of CD4+&-‐ lymphocytes, as well as the monocytes (blue) – Enables amazing sensi6vity on count, down to as few as 129 event • Debris region overlaps with system noise Cell Count % CD4+ Lymphocytes (green) 2,090 39% CD4-‐ Lymphocytes (red) 2,980 55% 319 6% CD4-‐ Monoctyes (yellow) CD4+ Monocytes (grey) CD4-‐ Granulocytes (orange) CD4+ Granulocytes (grey) Summary and Conclusions Revolutionizing Life Science Trend&Analysis&with&Treated&Sample& 80%# 70%# CD4'+'Lymphocytes CD4;'Lymphocytes CD4;'Monocytes CD4+'Monocytes %"of"PBMC"population,"Moxi"Flow"+"Vestigo"Data"Analysis Sample'1 Sample'2 Sample'3 Sample'4 Sample'5 Sample'6 42% 46% 42% 41% 20% 39% 47% 46% 48% 51% 73% 55% 6% 5% 8% 7% 4% 6% 3% 3% 2% 1% 2% 1% CD4'+'Lymphocytes CD4;'Lymphocytes CD4;'Monocytes CD4+'Monocytes Counts"of"PBMC"population,"Moxi"Flow"+"Vestigo"Data"Analysis Sample'1 Sample'2 Sample'3 Sample'4 Sample'5 Sample'6 1,508 3,442 2,504 2,324 1,581 2,090 1,675 3,476 2,886 2,903 5,713 2,980 218 413 476 414 331 319 105 205 129 50 150 50 60%# 50%# CD4#+#Lymphocytes# 40%# CD4K#Lymphocytes# CD4K#Monocytes# 30%# CD4+#Monocytes# 20%# 10%# 0%# Sample#1# Sample#2# Sample#3# Sample#4# Sample#5# Sample#6# %#of#PBMC#popula9on,#Moxi#Flow#+#Ves9go#Data#Analysis# Trend&Analysis&without&Treated&Sample& 60%# 50%# 40%# CD4#+#Lymphocytes# 30%# CD4I#Lymphocytes# CD4I#Monocytes# 20%# CD4+#Monocytes# 10%# 0%# Sample#1# Sample#2# Sample#3# Sample#4# %#of#PBMC#popula7on,#Moxi#Flow#+#Ves7go#Data#Analysis# Sample#6# Comments • Moxi Flow enables immediate insight into the quanta6ve levels of expression of CD4 within the PBMC popula6on • Moxi Flow enables a never seen before direct morphology view in combina6on with the CD marker expression of PBMC popula6on • Moxi Flow also enables a view into the level of debris and other residual blood components aber Ficoll sepera6on and 4 days of suspension culture • Sample 5 was the treated sample that resulted in significant morphology changes of the PBMC’s (+ 30% swelling) along with far less CD4 expression • There is an observable trend of increasing CD4-‐ lymphocytes and decreasing CD4+ lymphocytes in the untreated sample set Revolutionizing Life Science CustomerX Primary PE CD34 Flow Ab & Viability EvaluaEon On Moxi Flow By Don O’Neil 10/4/13 Sample Set Overview (test date: 20131004) All prep performed by customer, PE CD4 Experiment Revolutionizing Life Science • Sample Cell Type: Peripheral Human Blood • Sample Prepara6on: – Miltenyi Clinimax WBC isola6on (?) – All 5 samples were mixed with Orflo’s Moxi Cyte Viability reagent (15ul of sample to 135 ul of Moxi Cyte Viability reagent) • First tests were run aber 5 minutes of incuba6on • Repeat was done 15-‐20 minutes later with some assumed nega6ve impact on viability due to long incuba6on – Master sample 1 was pulled and thawed presumed to have high viability – Samples 2-‐5 were a mixture of sample 1 with 3 day old suspension culture of same cells • Sample 2 (test 50): 25% master to 75% 3 day suspension culture • Sample 3 (test 51): 50% master to 50% 3 day suspension culture • Sample 4 (test 53): 75% master to 25% 3 day suspension culture • Sample 5 (test 54): 100% 3 day suspension culture – Note test 52 was a blown test due to assumed reuse of casseie – Sample 6 was an isolated hematopoie6c stem cell stained with standard stem cell marker (BD Pharmigen Primary PE an6 human CD34 an6 body catalog # xxxxxx, expired July 2012, with short 8 minute incuba6on and a brief wash step – Sample 7: 15 ul’s o sample 6 mixed with 50 ul’s of sample 1(?) Charts (using average of the two repeats) Revolutionizing Life Science %"Viable" 100%$ 90%$ 89%$ 80%$ 73%$ 70%$ 81%$ 76%$ 63%$ 60%$ 50%$ 100%$3$day$ 2.5% 2% 75%$3$day$ 50%$3$day$ 25%$3$day$ 100%$Fresh$ LIve%&Dead%Count(millions%of%cells/ml)% 2.005% 2% 1.985% 1.91% 1.87% 1.5% Live%Count% 1.199% 1% Dead%Count% 0.760% 0.5% 0.592% 0.460% 0.246% 0% 100%%3%day% 75%%3%day% 50%%3%day% 25%%3%day% 100%%Fresh% Sample 1 (100% Fresh sample) Test 50 t = (5 minutes post incuba6on Revolutionizing Life Science Run 55 t = ~ 12 minutes post incuba6on Sample 2 (25% Fresh sample, 75% 3 day suspension culture) Test 51 t = ~ 5 minutes post incuba6on Test 56 t = ~ 12 minutes post incuba6on Revolutionizing Life Science Sample 3 (50% Fresh sample, 50% 3 day suspension culture) Test 57 t = ~ 13 minutes post incuba6on Test 58 t = ~ 13 minutes post incuba6on Revolutionizing Life Science Sample 4 (75% Fresh sample, 25% 3 day suspension culture) Test 53 t = ~ 6 minutes post incuba6on Test 59 t = ~ 13 minutes post incuba6on Revolutionizing Life Science Sample 4 (75% Fresh sample, 25% 3 day suspension culture) Test 53 t = ~ 6 minutes post incuba6on Test 59 t = ~ 13 minutes post incuba6on Revolutionizing Life Science Sample 5 (100% 3 day suspension culture) Test 54 t = ~ 6 minutes post incuba6on Revolutionizing Life Science Test 60 t = ~ 14 minutes post incuba6on Addi6onal incuba6on lead to increase in cell death Sample 6 & 7 (CD34 +) Test 61 PE Primary Ab Stain, CD34+ Revolutionizing Life Science Test 62 Spiked CD34 stained popula6on into non CD 34+ stained popula6on Sample 7 Data Analysis Sample 70(same0as01?) Description 6 PE0C30labeled0sample Mixture Total0CD340 Total0CD340 ul's0of0CD340 ul's0of0fresh0 positive negative sample sample 0.847 0 NA NA 0.276 15 50 Revolutionizing Life Science CD34+0 dilution NA 23% Expected0 CD34+0 count0from0 sample06 NA 0.195 Total0actual0 Absolute0 Absolute0 CD34G0 CD34+0 measured0 CD34G0 CD34+0 Cells/ml0 Cells/ml0 volume0by0 count0Moxi0 count0Moxi0 (millions)0 (millions)0 Moxi0Flow0 Flow0&0 Flow0&0 Moxi0Flow0 Moxi0Flow0 Measured0 (ul) VESTIGO Vestigo and0Vestigo &0VESTIGO CD34+0Error 27.5 0000000024,558 00000000005,319 00000000000.893 0.193 1.05% Conclusion: • Moxi Flow with ORFLO’s VESTIGO2D flow analysis sobware provides a highly accurate method for quan6ta6ng PE CD34+ Primary an6body stain • Note, an6body had expired in July 2012 • Shows about a 0.4 log separa6on which is sufficient to quan6tate with ~1.5% error Revolutionizing Life Science Moxi Flow EvaluaEon QuanEtaEng TransfecEon Efficiency Using PE labeled an( human an(body to aVb3 (expressed on melanoma cells) Biotech Customer, 9/25/13 Control, no stain Comments • Control, no PE an6 human an6body to specific target – Not transfec6on – Stained with PE-‐an6-‐aVb3 – Cell type: K562 (human erythroleukemia cell line) • Cell concentra6on 1.06 x 10^ cells/ml • Control popula6on centered at -‐1.8 log (fluorescence) • Red = debris • Grey = system noise Revolutionizing Life Science Stained sample 1 Moxi Flow & Orflo’s VESTIGO2D enables Instant quan6fica6on of transfec6on of efficiency Comments • Cell type: K562 (human erythroleukemia cell line) – Transfected with a human integrin aVb3 gen – Stained with PE-‐an6-‐aVb3 • Red = posi6ve for stain (0.778M cells/ml), -‐1.3 log fluorescence (0.5 log separa6on from non-‐transfected popula6on • Green = Nega6ve( 0.1M cells/ml), -‐1.8 log fluorescence • Yellow = non-‐stained debri popula6on • Orange = System noise Revolutionizing Life Science Control sample 2 Comments • Control, no PE an6 human an6body to specific target – Not transfec6on – Stained with PE-‐an6-‐MICA – Cell Type = Ba/F3 mouse pro-‐B cell line • Red = control popula6on 0.7M cells/ml (centered at -‐1.6 log of fluorescence) • Green = noise • Grey = debris Revolutionizing Life Science Control sample 2 Moxi Flow & Orflo’s VESTIGO2D enables Instant quan6fica6on of transfec6on of efficiency Sample Snapshot Count % + Transfected Cells (red) 6,426 59% Non transfected cells (green) 1,780 21% Unknown cell popula6on (yellow) 5,413 19% Comments • Control, no PE an6 human an6body to specific target – Transfected with human MICA – Stained with PE-‐an6-‐MICA – Cell Type = Ba/F3 mouse pro-‐B cell line • Green = nega6ve popula6on (1,780 cells), centered at -‐1.5 log of fluorescence • Red = posi6ve popula6on, centered at -‐0.4 log of fluorescence • Yellow (unknown popula6on) • Grey = cell debris Revolutionizing Life Science Revolutionizing Life Science Moxi Flow EvaluaEon QuanEtaEng IL2 & TLR2 Expression Using PE labeled an( human an(body to IL2 & TLR2 UCSD, 11/08/13 Mouse THP1 Cell, CONTROL, no staining Revolutionizing Life Science • These are the gated regions • + cells (0.0%) • All values for fluorescence intensity and size will be generated from events only occurring in the these two regions • The brighter the popula6on, the more concentrated, in other words this is a concentra6on heat-‐map • X-‐axis = direct size • Y-‐axis = fluorescence • Nega6ve or unstained cells (309K/ml), 15.5um mean diam) Mouse THP1 Cell, PE labeled an6-‐mouse TLR2 (CD2 282) • These are the gated regions • + cells (12.7% stained +) • All values for fluorescence intensity and size will be generated from events only occurring in the these two regions • The brighter the popula6on, the more concentrated, in other words this is a concentra6on heat-‐map • X-‐axis = direct size & morphology w/ 10nm resolu6on • Y-‐axis = fluorescence • Nega6ve or unstained cells Revolutionizing Life Science Mouse THP1 Cell, PE labeled an6-‐mouse IL2 (CD 122) • These are the gated regions • + cells (2.5% stained +) • All values for fluorescence intensity and size will be generated from events only occurring in the these two regions • The brighter the popula6on, the more concentrated, in other words this is a concentra6on heat-‐map • X-‐axis = direct size • Y-‐axis = fluorescence • Nega6ve or unstained cells Revolutionizing Life Science Revolutionizing Life Science Moxi Flow EvaluaEon QuanEtaEng ?? Using PE labeled an( human an(body to ?? Scripps Lab 11/11/13 ?? Cell, PE Labeled an6 XX to XX Revolutionizing Life Science • These are the gated regions • + cells (38.3%, 151K cells/ml, 16.21 mean diameter) • All values for fluorescence intensity and size will be generated from events only occurring in the these two regions • The brighter the popula6on, the more concentrated, in other words this is a concentra6on heat-‐map • X-‐axis = direct size • Y-‐axis = fluorescence • Nega6ve or unstained cells (61.7%, 244K/ml, 15.14um mean diameter) • Note the 1um shib in size for the stained cells


