1
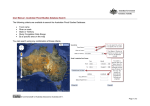
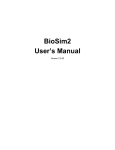
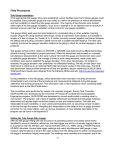
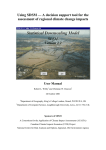
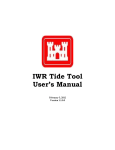
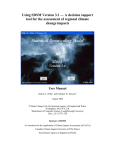
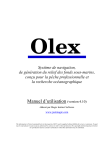
Coastal Flood Monitoring System Revision: 12/2010 Copyright Delaware Environmental Observing System Coastal Flood Monitoring System The Coastal Flood Monitoring System uses forecasts from water level forecast data provided by the NOAA National Center for Environmental Prediction (NCEP) Extratropical Surge (ET-Surge) model and interpolates these data for six coastal Delaware locations. All water level predictions are shown in units of feet relative to mean sea level (MSL) in the NAVD88 vertical datum. The first part of this system is forecast alerts. Users can set up alerts to be sent to their email whenever they want notices of forecasted water level being beyond their user set threshold. This feature can be accessed through the DEOS Alerts System, http://www.deos.udel.edu/dcf/login.html, and is discussed in section 1. The second part of the system is the website interface, which can be accessed at http://www.deos.udel.edu/coastal_flood. This website was designed to aid in high water level event planning. Composition of the site includes inundation maps, current water levels, tide data, water level predictions, and road profiles. Section 2 describes the methods used in making the water level predictions and discusses the website design and features. Funding Acknowledgment This project was funded, in part, through grants from the Delaware Coastal Programs with funding from the Office of Ocean and Coastal Resource Management, National Oceanic and Atmospheric Administration under award number NA08NOS4190464, the National Science Foundation through EPSCoR Grant No. EPS-0814251, and the State of Delaware. ________________________________________________________________________ User’s Guide: Costal Flood Monitoring System 2 TABLE OF CONTENTS Section 1 FORECAST ALERTS.................................................... 4 1.1 Account Set Up…………................................................ 4 1.2 Control Panel Reference.................................................. 4 1.2.1 Regular User Options.................................. 5 1.2.2 Additional Options for Teams.................... 5 1.3 Forecast Alerts Reference................................................ 6 1.3.1 Adding a Forecast Alert................................ 6 1.3.2 Modifying a Forecast Alert........................... 7 1.3.3 Disabling a Forecast Alert............................ 7 1.3.4 Deleting a Forecast Alert.............................. 8 2 COASTAL FLOOD MONITORING SYSTEM DESIGN............................................................................... 9 2.1 Inundation Maps.............................................................. 9 2.2 Forecast Model................................................................ 9 2.2.1 Tide Graph and Tide Data............................. 11 2.2.2 Road Profiles................................................. 11 2.3 Astronomical Tide Data.................................................. 12 2.4 Site and Data Disclaimer................................................. 13 ________________________________________________________________________ User’s Guide: Costal Flood Monitoring System 3 1 FORECAST ALERTS - http://www.deos.udel.edu/dcf/login.html The DEOS Alerts System includes a system of event driven triggers that can notify pagers and cell-phones when an extreme weather or hydrologic event (such as heavy rainfall, high stream flow, or excessive heat) occurs. 1.1 ACCOUNT SET UP On the login page, select Signup For An Account and fill in required fields (items in bold are required). You will receive an email with your initial password to access the DEOS Alerts System. Upon logging in, you can change your password and other user information. Usernames and passwords are case sensitive. Make sure you enter your username and password exactly as it was given to you. 1.2 CONTROL PANEL REFERENCE After logging in, a site control panel will appear on the left. In the screen capture below, the control panel is circled in red. Use the scroll buttons to see all of the options on the control panel. A brief overview of the panel options and links are given below. ________________________________________________________________________ User’s Guide: Costal Flood Monitoring System 4 1.2.1 REGULAR USER OPTIONS User Settings: Individual user information and alerts are accessed and altered here. Most Users will only use this part of the control panel. -My Account View: See current User settings. Mod: Modify User settings: - Password - must type it is twice - First and Last Name - Schema Preference - the units that will be displayed when in the system and when you receive an alert from the system. Either SI units (e.g., Celsius) or English units (e.g., Fahrenheit). - Time Zone - Address Information - Contact Information - Where the alerts will be sent: Email, mobile, pager, or phone† . The ‘enabled’ box must be checked to receive alerts. -Forecast Alerts Add: Set up an Alert to be sent to you. This form is further described in Section 1.3.1: ADDING AN ALERT. View: See any Alerts that have already been set up. Mod: Modify an already existing Alert. This is described more in Section 1.3.2: MODIFYING AN ALERT. Del: Delete an Alert. This is described more in Section 1.3.4: DELETING AN ALERT. -Realtime Alerts Alerts for stations with realtime data can be modified here. These alerts include all other data types except for the predicted water level which is a Forecast Alert. A PDF describing the realtime alerts can be downloaded by clicking on the User Manual button on the top of the page. 1.2.2 ADDITIONAL OPTIONS FOR TEAMS Team Settings In the below descriptions, 3 asterisks (***) are used when referring to where there would be team name if you were part of a team. A Team is a group of users (defined by the Team Leader) who will all receive the same Team Forecast Alerts. To set up a Team and become the Team Leader, contact the DEOS systems administrator (http://www.deos.udel.edu/feedback). -Team ***: Shows the number of teams defined in the whole system. View: See information about a team you are included in. Mod: Modify a team’s profile. Only the team administrator can enter information into the fields and add members to the team. † At this time, e-mail is the only option that works; however, Verizon users can get text messages by sending an e-mail to [email protected] (e.g., [email protected]). For other wireless service providers, please refer to this URL: http://en.wikipedia.org/wiki/List_of_SMS_gateways. ________________________________________________________________________ User’s Guide: Costal Flood Monitoring System 5 -Team *** Forecast Alerts: Shows the number of alerts defined in the whole system. Add: Set up a Forecast Alert to be sent to your team. Each team member must have their contact information enabled for them to receive Alerts. The next section, ‘FORECAST ALERTS’, describes how to fill out this form. Only the team administrator can modify this information. View: See any Team Forecast Alerts that have already been set up. Mod: Modify an already existing Forecast Alert. Only the team administrator can modify this information. Del: Delete a Team Forecast Alert. Only the team administrator can modify this information. 1.3 FORECAST ALERTS REFERENCE To add, view, modify, or delete a Forecast Alert for an individual User, click on the respective link under User SettingsForecast Alerts (Add, View, Mod, Del). To add, view, modify, or delete a Forecast Alert for a Team, click on the respective link under Team SettingsTeam *** Forecast Alerts (Add, View, Mod, Del). Only Team Administrator can add, modify, or delete Team Forecast Alerts. Forecast Alerts work the same way regardless if they are for an individual or a team. Each User (individual or tram member) must have their contact information enabled (do this under User SettingsMy AccountMod) to receive Forecast Alerts. The image below shows the ‘Add’ Forecast Alert screen. Red numbers and arrows have been added to the image as reference points. 1.3.1 ADDING A FORECAST ALERT 1. Main Settings: Name of Forecast Alert, Description, Enabled? The new Forecast Alert must be given a unique name. Entering in a Description for the Forecast Alert is optional. If you want the Forecast Alert to be sent to you (or your Team members), be sure to check the box next to Enabled? or else the Forecast Alerts will not be sent. 2. Location Settings: Location A Location must be selected in order to set up a Forecast Alert. Under Station List, select the station(s) for which you want to receive the Forecast Alerts†. Upon selecting a station, it will be highlighted in blue. To select more than one station, hold down the Ctrl key while clicking the stations. 3. Data Settings Values: Data Type, Comparison, Threshold Select the Data Type for which you want to receive a forecast alert for. Upon selecting the data type, it will be highlighted in blue. Predicted Water Level is the only option available for forecast alerts. Upon selecting the data type, the units used for that data type will appear in the grey unit boxes. For reference, the below screen capture shows the box with a red arrow. The units will be in the form that you selected in the User Settings for Schema Preference (either SI or English). † Only some locations in the station list are available for forecast alerts: Atlantic City, NJ (NOS), Cape May, NJ (NOS), Ocean City, MD (NOS), Lewes, DE (NOS), Reedy Point, DE (NOS), and Philadelphia, PA (NOS). Forecast alerts configured for other stations will not function properly. ________________________________________________________________________ User’s Guide: Costal Flood Monitoring System 6 Select the Comparison scheme you want to use by selecting the button next to Greater Than or Less Than. For example, if you want to receive Forecast Alerts for when the predicted water level is above a certain value (indicating flood), then you would want the Greater Than comparison scheme. On the other hand, if you want to receive Forecast Alerts for blow out tide prediction, then you would probably want the Less Than comparison scheme. Set a value for the Threshold level. Forecast Alerts will be sent when the predicted water level (anytime during the notification window) exceeds the comparison threshold. 4. Time Settings: Notification Window, Time Limit, Duration Notification Window is how far in advance the user wants to be notified about a potential event. For example, 3 days would mean that if any forecast alert condition is met within 3 days of the present time, then a forecast alert will be sent. Otherwise, no notification will be sent. Time Limit and Duration are not valid for Forecast Alerts; leave default values Click on the Submit button for the Alert to be saved. 1.3.2 MODIFYING A FORECAST ALERT Upon clicking on Mod (under User SettingsForecast AlertsMod for an individual User or under Team SettingsTeam *** Forecast AlertsMod for a Team) select the button next to the Forecast Alert name you want to modify and then click Submit. The same page will appear that you used to Add the Alert, although all of the fields will be filled with the options that were set when the Forecast Alert was added. You may clear all of the fields by clicking on the Reset button found on the bottom of the form. Fill in or change the desired fields according to the directions given in Section 1.3.1: Adding An Alert. Click on the Submit button to save any changes to the Alert. 1.3.3 DISABLING A FORECAST ALERT Disabling a Forecast Alert will stop it from being sent, but not delete it. Upon clicking on Mod (under User SettingsForecast AlertsMod for an individual User or under Team SettingsTeam *** Forcast AlertsMod for a Team) select the button next to the Forecast Alert name you want to disable and then click Submit. Uncheck on the box next to Enabled? so that there is no longer a check mark in the box. Click on the Submit button to save any changes to the Alert. 1.3.4 DELETING A FORECAST ALERT Upon clicking on Del (under User SettingsForecast AlertsDel for an individual User or under Team SettingsTeam *** Forecast AlertsDel for a Team) select the button next to the Forecast Alert name you want to Delete and then click Submit. You will be asked ‘Are you sure you want to delete this alert?’. Upon clicking Yes, the Alert will be deleted. ________________________________________________________________________ User’s Guide: Costal Flood Monitoring System 7 1. 2. 3. 4. ________________________________________________________________________ User’s Guide: Costal Flood Monitoring System 8 2 COASTAL FLOOD MONITORING SYSTEM DESIGN http://www.deos.udel.edu/coastal_flood Upon selecting a location and sending the request on the Coastal Flood Monitoring System Station Retrieval page (link provided above), inundation maps, current water level information, water level predictions, and road inundation maps are generated. Location can be changed under the Change Community dropdown box. Under Current Information, any active watches or warnings are displayed for the selected location. In addition, current water levels from nearby stations and other helpful links are provided. 2.1 INNUNDATIONS MAPS The base land surface elevation dataset used to generate the flood inundation maps in the Delaware Coastal Flood Monitoring System is the LIDAR data collected by Sanborn, Inc. in early Spring 2007. The LIDAR data provided by Sanborn was collected at 0.25 meter horizontal resolution for the entire State of Delaware. Please note that bridges and other man-made objects were removed from the LIDAR data, thus the elevation data products in the system reflect only bare earth values. Water body points were not removed. As stated by Sanborn, vertical accuracy of the LIDAR data is RMSE +/- 18.5 cm for well defined points and +/- 37 cm for heavily vegetated areas. No information was officially provided on horizontal accuracy but generally assumed to be on the order 0.25 meters. To generate the flood inundation maps, the predicted water level at the coast was assumed to be constant throughout the study area. This method is termed a single value surface, or "filling the bathtub" model. Elevation values was added to the LIDAR elevation DEM at each grid cell and categorized into 1 foot increments/layers. Each layer is coded in shades of blue; the higher the number, the deeper the water depth, the darker the shade of blue used. To see the water level values, click on Show Legend on the top of the map. The dropdown menu under Map Display, shown in the below screen capture, can be used to change the map inundation level. Controls for this map interface (zoom in, zoom out, etc...) are part of the Google Maps package. For more information on how to use these controls refer to the Google Maps help page. 2.2 FORECAST MODEL Forecast water levels provided by the Delaware Coastal Flood Monitoring System are derived from water level forecasts provided by the NOAA National Center for Environmental Prediction (NCEP) Extratropical Surge (ET-Surge) model. This model is run operationally four times a day and is driven by basin scale winds (i.e., winds in the Atlantic basin) from the NCEP Global Forecast System (GFS) model and astronomical tide conditions. ET-Surge water level predictions are available at two locations within Delaware: Reedy Point and Lewes. Predictions at those points are then linearly interpolated using an inverse distance weighting method to predict water levels at the coastal communities available through the system or at the mouths of the rivers that flow to those communities, in the case of Leipsic and Little Creek. All water level predictions are shown in units of feet relative to mean sea level (MSL) in the NAVD88 vertical datum. ________________________________________________________________________ User’s Guide: Costal Flood Monitoring System 9 2.1 2.2 ________________________________________________________________________ User’s Guide: Costal Flood Monitoring System 10 2.2.1 Tide Graph and Tide Data The Tide Graph is the default tab when the page is loaded. Astronomical tide height data (further discussed in section 2.3) are shown in green and the predicted water height data are shown in blue. A table of the data used to generate the Tide Graph can be accessed by clicking on the Tide Data tab. 2.2.2 Road Profiles The road elevation profiles are available for the major roadways in the selected community. Once a roadway tab is selected, the inundation map will center over the roadway and show the mapped cross section in red. The cross section starts at the green balloon and concludes at the red balloon. An example inundation map associated with a selected road profile can be seen in the below screen capture labeled 2.2.2. In the road elevation profile the purple line denoted the maximum predicted water level height over the next 4 days and the green line is the mapped water level height, which can be adjusted by the user using the Map Display dropdown box (discussed in section 2.1). ________________________________________________________________________ User’s Guide: Costal Flood Monitoring System 11 2.2.2 2.3 ASTRONOMICAL TIDE DATA The astronomical tide data provided by the Delaware Coastal Flood Monitoring System are produced using XTide (http://www.flaterco.com/xtide/xtide.html). XTide uses the National Ocean Service’s (NOS) algorithm to predict tides based on the gravitational relationships between the earth, sun, and moon. Tide predictions are enhanced by using local tidal harmonic data. All astronomical tide predictions are shown in units of feet relative to mean sea level (MSL) in the NAVD88 vertical datum. ________________________________________________________________________ User’s Guide: Costal Flood Monitoring System 12 2.4 SITE AND DATA DISCLAIMER Potential inundation levels displayed on this website are provided for planning purposes only. Predicted water level data are provided by the National Weather Service's Extratropical Water Level Forecast System (http://www.nws.noaa.gov/mdl/etsurge). They are released for limited public use as preliminary data to be used only with appropriate caution. The predicted water level data on this website are purely computer generated and serve only as guidance. A general disclaimer applied to all DEOS data, including but not limited to the data provided on this page, can be found at: http://www.deos.udel.edu/disclaimer.html ________________________________________________________________________ User’s Guide: Costal Flood Monitoring System 13