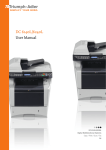
1
RecordBase
View
User Manual
Version v4.0 Rev 0
Preface
Information in this document is subject to change without notice.
© 2015 ERLPhase Power Technologies Ltd. All rights reserved.
Reproduction in any manner whatsoever without the written permission of
ERLPhase Power Technologies Ltd. is strictly forbidden.
This manual is part of a complete set of product documentation that includes
detailed drawings and operation. Users should evaluate the information in the
context of the complete set of product documentation and their particular
applications. ERLPhase assumes no liability for any incidental, indirect or
consequential damages arising from the use of this documentation.
While all information presented is believed to be reliable and in accordance
with accepted engineering practices, ERLPhase makes no warranties as to the
completeness of the information.
All trademarks used in association with B-PRO, B-PRO Multi Busbar, F-PRO,
iTMU, L-PRO, ProLogic, S-PRO, T-PRO, TESLA, I/O Expansion Module,
TESLA Control Panel, Relay Control Panel, RecordGraph and RecordBase are
trademarks of ERLPhase Power Technologies Ltd.
Windows® is a registered trademark of the Microsoft Corporation.
Contact Information
ERLPhase Power Technologies Ltd.
74 Scurfield Blvd.
Winnipeg, Manitoba, Canada
R3Y 1G4
Website: www.erlphase.com
Email: [email protected]
Technical Support
Email: [email protected]
Tel: 1-204-477-0591
D02225R04.00
RecordBase View User Manual
i
Using This Guide
This User Manual describes the installation and operation of the RecordBase
View application. It is intended to support the first time user and clarify the details of the software.
The manual uses a number of conventions to denote special information:
Example
Describes
Start>Settings>Control Panel
Choose the Control Panel submenu in the Settings submenu on the Start menu.
Right-click
Click the right mouse button.
Recordings
Menu items and tabs are shown in italics.
Service
User input or keystrokes are shown in bold.
Text boxes similar to this one
Relate important notes and information.
..
Indicates more screens.
Indicates further drop-down menu, click to display list.
Indicates a warning.
D02225R04.00
RecordBase View User Manual
iii
Table of Contents
Preface ......................................................................................i
Contact Information ...................................................................i
Using This Guide ..................................................................... iii
Table of Contents .....................................................................v
Version Compatibility .............................................................. vii
System Requirements and Software Installation ..................... ix
1 Starting RecordBase View .................................... 1-1
Overview .......................................................................... 1-1
Launching RecordBase View........................................... 1-2
Components of RecordBase View ................................... 1-6
Viewing Records from Windows Explorer...................... 1-13
2 Graphing Records.................................................. 2-1
Getting Started................................................................. 2-1
RecordGraph Menu Items................................................ 2-3
Views ............................................................................. 2-30
Graphs ........................................................................... 2-32
Templates ...................................................................... 2-57
View and Graph Titles.................................................... 2-63
Readouts and Measurements........................................ 2-65
Calculated Channels...................................................... 2-72
Exporting Views ............................................................. 2-74
Exporting Channel Data................................................. 2-75
Record Summary ........................................................... 2-77
Digital Channel Status Indicator..................................... 2-78
Time Sync Input Status.................................................. 2-78
Derived External and Virtual Input Channels for TESLA
Swing Recordings .......................................................... 2-79
Derived Channels for L-PRO, F-PRO High Speed
Recordings..................................................................... 2-79
Derived Channels for B-PRO, L-PRO Swing
Recordings..................................................................... 2-79
COMTRADE Import ....................................................... 2-80
Print Options .................................................................. 2-82
3 Record Export ........................................................ 3-1
D02225R04.00
RecordBase View User Manual
v
Table of Contents
Launch the Export Utility .................................................. 3-2
Index ..........................................................................................I
vi
RecordBase View User Manual
D02225R04.00
Version Compatibility
RecordBase View Compatibility
RecordBase
View
Installation
Works with records produced by (specified version and below):
LPRO
2100
LPRO
4000
TPRO
8700
TPRO
4000
FPRO
5100
FPRO
215
FPRO
235
FPRO
4000
BPRO
8700
BPRO
8701
BPRO
4000
BPRO
MBB
SPRO
4000
SPRO
4001
TESLA
2000
TESLA
3000
TESLA
4000
TESLA
4003
TESLA
LITE
v4.0 Rev 0
v5.0
v2.5
v4.2
v1.2
v3.0
v1.0
v1.0
v1.0
v3.1
v2.0
v2.0c
v1.0
v1.0a
v2.0
v4.1
v2.7
v1.8a
v1.0
v1.0
v3.4 Rev 1
v4.0
v2.5
v4.2
v1.2
v3.0
v1.0
v1.0
v1.0
v3.1
v2.0
v2.0a
v1.0
v1.0a
v2.0
v4.1
v2.7
v1.8
v1.0
v1.0
v3.4 Rev 0
v4.0
v2.5
v4.2
v1.2
v3.0
v1.0
v1.0
v1.0
v3.1
v2.0
v2.0a
v1.0
v1.0a
v2.0
v4.1
v2.7
v1.7
v1.0
v1.0
v3.3 Rev 0
v4.0
v2.5
v4.2
v1.2
v3.0
v1.0
v1.0
v1.0
v3.1
v2.0
v2.0a
v1.0
v1.0a
v1.0
v4.1
v2.7
v1.7
v1.0
v1.0
v3.2 Rev 0
v4.0
v2.4a
v4.2
v1.1
v3.0
n/a
n/a
v1.0
v3.1
v2.0
v2.0a
v1.0
v1.0a
n/a
v4.1
v2.7
v1.7
v1.0
v1.0
v3.1 Rev 0
v4.0
v2.2
v4.1
v1.0
v3.0
n/a
n/a
n/a
v3.1
v2.0
v2.0
n/a
v1.0
n/a
v4.1
v2.6
v1.5
v1.0
v1.0
v3.0 Rev 0
v4.0
v2.2
v4.1
v1.0
v3.0
n/a
n/a
n/a
v3.1
v2.0
v2.0
n/a
v1.0
n/a
v4.1
v2.5
v1.3
v1.0
v1.0
v2.5 Rev 0
v4.0
v2.1
v4.1
n/a
v3.0
n/a
n/a
n/a
v3.1
v2.0
v1.0b
n/a
v1.0
n/a
v4.1
v2.4
v1.2
n/a
v1.0
v2.4 Rev 0
v4.0
v2.0
v4.1
n/a
v2.0a
n/a
n/a
n/a
v3.1
v1.0b
v1.0b
n/a
v1.0
n/a
v4.1
v2.4
v1.2
n/a
n/a
v2.3 Rev 0
v4.0
v2.0
v3.5
n/a
v2.0a
n/a
n/a
n/a
v3.0
v1.0b
v1.0a
n/a
v1.0
n/a
v4.1
v2.3d
v1.1
n/a
n/a
v2.2 Rev 0
v3.5
v2.0
v3.5
n/a
v2.0a
n/a
n/a
n/a
v2.3
v1.0b
v1.0
n/a
n/a
n/a
v4.0a
v2.0a
v1.0
n/a
n/a
v2.1 Rev 1
v3.5
v1.0
v3.5
n/a
v2.0a
n/a
n/a
n/a
v2.2
v1.0b
v1.0
n/a
n/a
n/a
v4.0a
v2.0a
n/a
n/a
n/a
v2.1 Rev 0
v3.5
v1.0
v3.5
n/a
v2.0a
n/a
n/a
n/a
v2.2
v1.0b
v1.0
n/a
n/a
n/a
v4.0a
v2.0a
n/a
n/a
n/a
v2.0 Rev 1
v3.5
v1.0
v3.5
n/a
v2.0a
n/a
n/a
n/a
v2.2
v1.0b
v1.0
n/a
n/a
n/a
v4.0a
v2.0a
n/a
n/a
n/a
v2.0 Rev 0
v3.5
v1.0
v3.5
n/a
v2.0a
n/a
n/a
n/a
v2.2
v1.0b
v1.0
n/a
n/a
n/a
v4.0a
v2.0a
n/a
n/a
n/a
Please contact ERLPhase Customer Service for complete Revision History.
D02225R04.00
RecordBase View User Manual
vii
System Requirements and Software
Installation
Hardware
The minimum hardware requirements are:
• 1 GHz processor
• 2 GB RAM
• 20 GB available hard disk space
Operating
System
The following software must be installed and functional prior to installing
RecordBase View software:
• Microsoft Windows XP Professional Service Pack 3 or
• Microsoft Windows 7 Professional Service Pack 1 32-bit or 64-bit
Software
Installation
The CD-ROM contains software and the User Manual for the RecordBase
View.
Software is installed directly from the CD-ROM to a Windows PC.
The CD-ROM contains the following:
• RecordBase View interface software
• RecordBase View User Manual in PDF format
To Install
Software on the
Computer
Insert the CD-ROM in the drive. The CD-ROM should open automatically. If
the CD-ROM does not open automatically, go to Windows Explorer and find
the CD-ROM (usually on D drive). Open the ERLPhase.exe file to launch the
CD-ROM.
To install the software on the computer, click the desired item on the screen.
The installation program launches automatically. Installation may take a few
minutes to start.
To view the RecordBase View User Manual the user must have Adobe Acrobat
on the computer. If a copy is needed, download a copy at www.adobe.com.
Anti-virus/Anti-spyware Software
If an anti-virus/anti-spyware software on your local system identifies any of
the ERLPhase applications as a “potential threat”, it will be necessary to configure your anti-virus/anti-software to classify it as “safe” for its proper operation. Please consult the appropriate anti-virus/anti-spyware software
documentation to determine the relevant procedure.
D02225R04.00
RecordBase View User Manual
ix
1 Starting RecordBase View
1.1 Overview
RecordBase View is a Windows-based software tool for displaying and managing records from ERLPhase relays. RecordBase View features include:
• Record displays and analysis
• Storage and management of records in database
• Record summaries including event lists and user annotation
• COMTRADE, PTI and MS Excel export
• Windows Explorer integration
• Compatibility with RecordBase Server database
RecordBase View makes use of a Microsoft Access database file. You do not
need to have your own copy of Access.
Record Summary
- information about
the record selected
Main Menu Tool Bar
Record Search
- uses Product, Unit ID and time
range to search for records
Record List
- displays a list of found records sorted
by Trigger Time, Unit ID or Type
Figure 1.1: RecordBase View Opening Window
D02225R04.00
RecordBase View User Manual
1-1
1 Starting RecordBase View
Anti-virus/Anti-spyware Software
If an anti-virus/anti-spyware software on your local system identifies any of
the ERLPhase applications as a “potential threat”, it will be necessary to configure your anti-virus/anti-software to classify it as “safe” for its proper operation. Please consult the appropriate anti-virus/anti-spyware software
documentation to determine the relevant procedure.
1.2 Launching RecordBase View
There are two methods to launch RecordBase View:
Method 1:
Desktop
Double-click the icon
Method 2:
Windows Start
Menu
Start>Programs>ERLPhase>RecordBase View
labelled RecordBase View on your desktop.
RecordBase View Icon
Method 1: Click on the
icon to launch
RecordBase View
Method 2: Open
Windows Explorer to
launch RecordBase
View
Figure 1.2: Launch RecordBase View
1-2
RecordBase View User Manual
D02225R04.00
1 Starting RecordBase View
Main Menu Tool
Bar
File
Edit
Record
Options
Help
About
Transfer Records
Email Records
Export Records
Delete Records
Add Records
Save Settings
View Settings Summary
View Graph
Undo
Paste
Copy
Cut
Print
Save To
Open
Figure 1.3: Main Menu Tool Bar
Table 1.1: Menus
D02225R04.00
Icon
Restore
Move
Size
Minimize
Maximize
Close
Next
File
Open.. opens selected database.
Close
Print Summary
Print Summary Preview
Print Record List
Print Record List Preview
Print Setup .
Edit
Undo
Cut
Copy
Paste
Record
Graph
View Settings Summary
Save Settings
Add
Records
Delete Records
Save To
Export To COMTRADE
Send
Options
Add Record
Record Classification
RecordBase View User Manual
1-3
1 Starting RecordBase View
Table 1.1: Menus
Help
User Manual
About RecordBase View
Table 1.2: Toolbar Buttons
1-4
Open
Select a database to open (can be a RecordBase View or a RecordBase Central Station database).
Save To
Highlight a record, then select this option to save the record to folder/
disk.
Print
Prints a record summary of the highlighted record.
Cut
Cuts the highlighted text.
Copy
Copies highlighted text to the clipboard.
Paste
Pastes clipboard text to cursor position.
Undo
Undo the previous cut/copy/paste operation.
View Graph
Select a record(s) from the record list, then select the View Graph
button to launch RecordGraph, a tool used to display and analyze
records. Alternatively, double-click a record to launch RecordGraph.
View Settings
Summary
If Offliner Settings is installed on your system, view the setting file (as
read-only) of the selected record using the View Settings tool.
Save Settings: Extract the settings from the selected record and save
the settings to a file for later use (viewing/editing). If Offliner Settings
is installed on your system, use it to view and edit the setting file.
Add Records: Adds records to RecordBase. Browse to select a
record. Alternatively, drag-and-drop records from Windows Explorer
into the RecordBase View window.
Delete Records
Removes selected records from the database.
Export Records
Exports the selected records to different data formats.
Email Records
Emails the selected records.
Transfer Records
Transfers the selected records to a different database.
RecordBase View User Manual
D02225R04.00
1 Starting RecordBase View
Add
Select the Add button...Alternatively, drag-and-drop records
from Windows Explorer into the RecordBase View window.
Select a valid record.
Figure 1.4: Add Records to RecordBase
Select toolbar button Add to add records to RecordBase. Browse to select a particular record.
Transfer
Records
Figure 1.5: Transfer Records
Use this option to transfer records between two distinct database files.
D02225R04.00
RecordBase View User Manual
1-5
1 Starting RecordBase View
1.3 Components of RecordBase View
Record Search
The bottom portion of the RecordBase window has controls to determine
which records are displayed in the list.
Figure 1.6: Record Search
Table 1.3: Record Search
Name
Function
Product
Choose the product name of the record from the drop-down list.
Unit ID
Limit the record list to a specified set of records.
In the past
Indicates how far back the list should go.
For example, if today is Tuesday, January 1, 2001 and you specify
“All Units in the past 2 years” then the RecordBase View lists all
records dated between Tuesday, January 1, 1999 to Tuesday, January 1, 2001.
Between
Select the time frame of the records to be displayed.
Refresh
Search and update the record list.
The search specification is remembered so that the next time you
start RecordBase, the last-used search is automatically run and the
record list reflects the results.
Record Sort
Click column heading
to sort.
Figure 1.7: Sort by Trigger Time
By default the record list is sorted by Trigger Time, and then by Unit ID which
emphasizes when the records occurred. Click the column title to sort the list.
1-6
RecordBase View User Manual
D02225R04.00
1 Starting RecordBase View
Table 1.4: Record Sort
Record
Summary
Information
Name
Function
Trigger Time
Select Trigger Time to sort the list by date beginning with the most toggle the sort order by date.
Unit ID
Select the Unit ID to sort the records by Unit ID and then by Trigger
Time, emphasizing where the records are from.
Type
Indicates whether the record contains high-speed transient fault data,
low speed dynamic swing data or both.
The right side of the screen displays information about the selected record.
When a record is
highlighted on the
LHS, the RHS
displays related
record information
Select the record you
wish to display
information.
Figure 1.8: Record Summary
Use the up and down cursor keys to move through
the list to select a record. Information about the
record highlighted is displayed on the RHS.
If multiple records are selected, summary information is unavailable.
D02225R04.00
RecordBase View User Manual
1-7
1 Starting RecordBase View
Table 1.5: Record Summary
View Settings
Name
Function
Record Name
Associate a descriptive name with a record. You can edit this text. The
text must conform a valid file name (alphanumeric characters, dot ‘.’,
underscore ‘_’, minus sign ‘-‘, and spaces).
Trigger Time, Start
Time, Stop Time
Show the time of the record’s first trigger and the time period of data
covered by the record.
Unit ID, Station
Name
Identify the source of the record — read-only fields. The values come
from the Unit ID and Station Name settings in the unit.
Serial Number,
Product
Identifies the unit.
Active Group/Setting Group
Indicates group used at the time the record was created. This is only
visible for records with multiple setting groups.
Trigger Event and
Event List
Portion of the unit’s Event Log that occurred during the recorded time
period.
The event list shows the unit’s detector activity such as external digital
input state changes and internal analog detector pickups.
User Comments
Editable text field to store comments about the record.
These comments are associated with the record and are always displayed with it. The comment field is large (up to 64k).
Standard Windows cut and paste functions can be used with the Comments field. (Ctrl + V for paste, Ctrl + C for copy, Ctrl + X for cut.)
View Settings opens Offliner Settings directly from RecordBase View.
The appropriate Offliner has to be installed to view settings.
1-8
RecordBase View User Manual
D02225R04.00
1 Starting RecordBase View
View Settings - opens
F-PRO Offliner Settings
in settings Summary
window.
F-PRO Record
F-PRO Offliner Settings
- Settings Summary
Figure 1.9: View Settings from RecordBase View
Setting
Summary
In RecordBase View, select record and the View Setting button to display the
Setting Summary in Offliner.
If the record contains Setting Groups, the Offliner displays all Setting Groups
in the summary. Bold text in the tree view indicates an active Setting Group
(the Setting Group used at the time the record was captured). The setting summary is read-only. To edit the setting file associated with the summary, you
must use File/Save As to save the summary to a file. Then close the summary
screen and open the setting file for editing.
Figure 1.10: View Setting Summary in RecordBase View
D02225R04.00
RecordBase View User Manual
1-9
1 Starting RecordBase View
Save Settings
Save Settings extracts the relay settings from the record.
Save Settings - opens
Save As window to
choose save location.
F-PRO Record
Choose location to
Save As.
Figure 1.11: Save Settings from RecordBase View
Note: TESLA configuration files can also be stored in this manner.
Reports
There are two reports available in RecordBase View:
• Record List
• Record Summary
Access reports through the File menu near the top of the window.
Figure 1.12: Record List Drop Down Menu
1-10
RecordBase View User Manual
D02225R04.00
1 Starting RecordBase View
Record List
Figure 1.13: Record List
A list of the records found by the current search organized like the record list
in the main display window, but contains the Record Name field for reference.
Record Summary
Figure 1.14: Record Summary
A report of all the information about a single record, including the event list
and comments.
To produce summary reports on multiple records:
1. Select multiple records from the record list (i.e. highlight the records you
wish to create a report for).
2. Click File > Print Summary.
The resulting report consists of multiple pages, one for each record. Use the
page control at the bottom of the report to display each page.
D02225R04.00
RecordBase View User Manual
1-11
1 Starting RecordBase View
Figure 1.15: Record Summary
The computer must have a default printer defined for the reports to
be generated. Refer to your Windows Help for details.
1-12
RecordBase View User Manual
D02225R04.00
1 Starting RecordBase View
1.4 Viewing Records from Windows Explorer
Use Windows Explorer to add records to RecordBase View database or to view
the records graphically without adding them to the database.
1. Start Windows Explorer.
2. Locate the desired record and select them. Multiple records can be selected
using the standard Windows Ctrl or Shift keys in conjunction with the left
mouse button.
3. Use the right mouse button to bring up the context menu.
4. Select the RecordBase View menu item to activate the sub menu.
Figure 1.16: Add Record with Windows Explorer
Table 1.6: Add Record with Windows Explorer
Add Record
Adds the selected record(s) to the RecordBase View database. Note that
you can control how records are added, “Add” on page .
Launch Graph
Brings up the graphics display with the selected record(s).
Export
Launches the export utility to convert the selected record to formats such
as COMTRADE.
The context menu is shown only for valid record types with the following extensions: *.lpr, *.lpl, *.lpe, *.tpr, *.tpt, *.tlr, *.bpr, *.bpl, *.fpr, *.fpe,
*.fpt, *.mbr, *.mbe, *.spr, *.spl, *.spe.
D02225R04.00
RecordBase View User Manual
1-13
2 Graphing Records
2.1 Getting Started
RecordGraph is a tool that is used to display and analyse records from
ERLPhase relays and recorders. Use it to graphically view the data recorded
during fault, swing and trend modes. RecordGraph can be launched from
RecordBase View software.
RecordGraph
Components
• Main menu items
• Tool bar buttons
• A drop-down box lists the templates associated with the current record’s
IED
• A left-hand side pane (LHS) or tree view lists the names of records to be
displayed or analysed
• A right-hand side pane (RHS) displays the graphs in various views. Initially
a single blank screen appears.
• A right-click context menu on both the LHS and RHS pane.
• RecordGraph version is displayed in the Help>About RecordGraph.
Main Menu
Template List
Tool Bar
LHS pane
(Tree View)
lists records
RHS Pane shows graphic display
Figure 2.17: Components of RecordGraph Window
D02225R04.00
RecordBase View User Manual
2-1
2 Graphing Records
Menus
RecordGraph
File View Graph
Measure
Scale
Options
Help
Graph
View
File
Save Template
Save Template As...
Template Manager...
Print...
Print Direct
Print All
Print Preview...
Export...
Delete
Show Record Summary.
Import...
Exit
Add...
Delete
Rename Tab
Titles...
Copy to Clipboard
Save as Metafile...
Show Channel List
Line
Toolbar
Set Graphs Per Page
Add Analog Graph
Add Digital Graph
Delete Graph
Move
Copy Trace
Paste Trace
Delete All Traces
Copy Trace Data to
Clipboard
Change Trace Color...
Active Trace Information...
Measure
Markers
CrossHairs
Primary
Secondary
Time Alignment
Absolute Time
Fundamental RMS
True RMS
Harmonics
Symmetrical Components
Help
User Manual
About RecordGraph...
Show Hotkeys...
Scale
Zoom X Axis +
Zoom X Axis Zoom Y Axis +
Zoom Y Axis Undo Zoom
Reset Zoom
Change Scale (Y-Axis)
Options
Calculate Derived Channels Now...
Show Grid
Show X Axis Ticks
Show Legends
Show Trigger Markers
Lock Markers
Extend Print Range
Set Phase Colors...
Set Phase Rotation
Set Precision
Figure 2.18: Menus
2-2
RecordBase View User Manual
D02225R04.00
2 Graphing Records
2.2 RecordGraph Menu Items
File Menus
File>Save Template
Figure 2.19: Save Template
Use this option to save the current graphical layout information to a file (see
“Templates” on page 2-57 for further explanations on templates and their role
in graphical analysis).
When this option is chosen and if there are no templates in the template list,
then a Save As Template dialog box is displayed. Otherwise, the current layout
information is saved in a file as shown in the template list box.
File>Save Template As…
Figure 2.20: Save Template As
D02225R04.00
RecordBase View User Manual
2-3
2 Graphing Records
Save the current graphical layout information in a different file. A dialog box
is displayed to choose the template file name. The check box, save as default
template, if checked, saves the current template as a user-defined default template (for more explanation see “Templates” on page 2-57).
File>Template Manager
Figure 2.21: Template Manager
Rename, duplicate, save as, import or delete template files. A dialog box is displayed to manage the template files (for more explanation see “Templates” on
page 2-57).
File>Print
Figure 2.22: Print
2-4
RecordBase View User Manual
D02225R04.00
2 Graphing Records
Print the active (visible) view. Use this option to select the type of the printer
and other configurations associated with it through the standard print dialog
box options.
File>Print Direct
Figure 2.23: Print Direct
Send the active view directly to the default printer. When this option is chosen,
the standard print dialog box is not displayed. The active view is sent directly
to the default printer for printing, but you can cancel the printing if the print
status dialog box is displayed.
File>Print All
Multiple Views
Figure 2.24: Print All
Send all the pages of all the views to the default printer. Select this option to
print multiple views (visible and invisible) to the default printer.
D02225R04.00
RecordBase View User Manual
2-5
2 Graphing Records
File>Print Preview
Figure 2.25: Print Preview
Display the print preview window of the active view page.
File>Export
Figure 2.26: Export
Export the selected record to a user-defined format, for more details see “Record Export” on page 3-1.
File>Delete
Delete the currently selected record from the tree view. This option does not
clear the view associated with the record.
2-6
RecordBase View User Manual
D02225R04.00
2 Graphing Records
File>Show Record Summary
Figure 2.27: Show Record Summary
Display the record summary and the event list of the active record in a dialog
box.
File>Import
Figure 2.28: Import
Choose this option to import a COMTRADE file and display a standard open
file dialog box to select *.cfg COMTRADE files. Alternately, *.cfg and ERLPhase records may be displayed through a drag-and-drop operation into the RecordGraph application.
File>Exit
Exit the RecordGraph application. Save your graphical layout information before selecting this option.
D02225R04.00
RecordBase View User Manual
2-7
2 Graphing Records
View Menus
View>Add
Create a new view and add it to the existing layout, for more details refer to
“Views” on page 2-30.
View>Delete
Figure 2.29: Delete
Delete an active view from the layout. When you select this option, a dialog
box appears to confirm the deletion of the view. If accepted, the current view
is deleted from the layout.
View>Rename Tab
Renames this tab
Figure 2.30: Rename Tab
Replaces the name on the active view tab with one of your choice. A dialog box
appears to enter the name.
2-8
RecordBase View User Manual
D02225R04.00
2 Graphing Records
View>Titles
Figure 2.31: Titles
Select graph and view titles options to compile titles and various options, for
more details refer to “View and Graph Titles” on page 2-63.
View>Copy to Clipboard
Copy an active view to the clipboard for import to another program such as MS
Word or Excel, for more details see “Record Export” on page 3-1.
View>Save As Metafile
Save an active view page as a Windows metafile, for more details see “Record
Export” on page 3-1.
D02225R04.00
RecordBase View User Manual
2-9
2 Graphing Records
View>Show Channel List
Figure 2.32: Show Channel List
Hide or show the channel list displayed in the tree view.
View>Line
Figure 2.33: Line
Place a reference line on the graph (for Impedance and Differential views only). Use Line in conjunction with the CrossHair measurement for quick readouts. When you choose this option free form zooming is disabled. Clear the
line to enable free form zooming.
View>Tool Bar
Show or hide tool bar from the main window.
2-10
RecordBase View User Manual
D02225R04.00
2 Graphing Records
Graph Menus
Graph>Set Graphs Per Page
Figure 2.34: Set Graphs Per Page
Set up the number of graphs per view; up to eight graphs are allowed using the
Set Graphs Per Page option. Timeline, Overlay and Trend Views allow a maximum of 36 graphs. Use Add Analog Graph or the Insert key to add one graph
at a time.
Graph>Add Analog Graph
Figure 2.35: Add Analog Graph
Add an analog graph to the existing view or use the Insert key.
D02225R04.00
RecordBase View User Manual
2-11
2 Graphing Records
Graph>Add Digital Graph
Figure 2.36: Add Digital Graph
Add a digital graph to the existing view. This graph shows the digital status information in the form of thick or thin stacked traces. You can plot up to 32 traces in a single graph.
Graph>Delete Graph
Figure 2.37: Delete Graph
Delete an active graph (click any graph to make it active) from the existing
view or use the Delete key.
2-12
RecordBase View User Manual
D02225R04.00
2 Graphing Records
Graph>Move
Figure 2.38: Move
Rearrange the relative position of the graphs in the active view page. First select the graph and use either the Move>Up or Move>Down option to change
the position of the graph.
Graph>Copy Trace
Copies this trace
Figure 2.39: Copy Trace
Copy an active trace from the selected graph. Use this option in conjunction
with the paste trace option. You need at least one channel on a graph to use the
copy operation.
D02225R04.00
RecordBase View User Manual
2-13
2 Graphing Records
Graph>Paste Trace
Trace copied
Trace pasted
Figure 2.40: Paste Trace
Add or replace an existing trace in the selected graph. In Timeline View an analog graph supports one trace per graph. In an Overlay View you can select up
to 32 traces per graph. If you use the paste operation in Timeline View, and if
the graph has a trace, it is replaced with the one just copied or adds the trace if
there is no trace. In Overlay View it adds the trace to the existing graph.
Graph>Delete Trace
Delete Trace removes
this trace from the graph
Figure 2.41: Delete Trace
Select a graph and the trace to be deleted and use Delete Trace to delete from
the active graph. In the case of Overlay View a graph can have multiple traces.
You can select a trace by clicking on the channel name and use delete trace option to delete the selected trace.
2-14
RecordBase View User Manual
D02225R04.00
2 Graphing Records
Graph>Delete All Traces
All traces are removed
from the graph
Figure 2.42: Delete All Traces
Deletes all the traces from the active graph. In an Overlay view this action removes all the traces.
Graph>Copy Trace Data to Clipboard
Copy trace data from the active graph to the clipboard, for further explanation
see “Exporting Channel Data” on page 2-75.
Graph>Change Trace Color
Color of this trace is changed
Figure 2.43: Change Trace Color
Change the trace color of the selected trace. In the Overlay View this option
only changes the color of the active trace.
D02225R04.00
RecordBase View User Manual
2-15
2 Graphing Records
Graph>Active Trace Information
Figure 2.44: Active Trace Information
Display the trace information of the active graph.
Measure Menus
Measure>Markers
Amplitude readouts
corresponding to X & O
Time display corresponding
to X & O
Figure 2.45: Markers
Set or clear markers X and O on all graphs in the active view. If the markers
are out of range, double-click the time axis to bring them back into the view.
When markers are placed, depending on the type of measurements option,
readouts appear on the right hand side as shown corresponding to the positions
of X and O marker. In case of multiple traces, the readout refers to the currently
active (selected) trace.
2-16
RecordBase View User Manual
D02225R04.00
2 Graphing Records
Measure>CrossHair
CrossHair
measurements
Figure 2.46: CrossHair
Set or clear crosshair cursor measurement by dragging the mouse (left-click
and move) anywhere on the graph to display the readout. The difference between the marker and crosshair readout is that the marker values correspond to
the data values, whereas the crosshair measurement corresponds to the x and y
coordinates. When this option is selected, you can measure coordinates of any
graph in the active view.
Measure>Primary
Primary Scale
Figure 2.47: Primary
Set scale to primary values (depending on the scale factors CT/PT ratios) on all
the graphs in the currently active view. The current choice (primary or secondary) is displayed on the status bar.
D02225R04.00
RecordBase View User Manual
2-17
2 Graphing Records
Measure>Secondary
Secondary Scale
Figure 2.48: Secondary
Set scale to secondary values (depending on the scale factor of CT/PT ratios)
on all the graphs in the currently active view. The current choice (primary or
secondary) is displayed on the status bar.
Measure>Time Alignment
Offset X axis (trigger time alignment) for the currently active trace on the
graph, for more explanation see “Readouts and Measurements” on page 2-65.
Measure>Absolute Time
Display absolute time (actual recorded time) measurements for the active trace
of the graph, for more explanation see “Readouts and Measurements” on
page 2-65.
Measure>Fundamental RMS
Display fundamental RMS measurement for the active trace of the graph, for
more explanation see “Readouts and Measurements” on page 2-65.
Measure>True RMS
Display true RMS measurement for the active trace of the graph, for more explanation see “Readouts and Measurements” on page 2-65.
Measure>Harmonics
Display harmonics measurement – up to 5th order and THD expressed in percent with reference to the fundamental (up to 25 harmonics depending on the
sample rate) for the active trace of the graph, for more explanation see “Readouts and Measurements” on page 2-65.
Measure>Symmetrical Components
2-18
RecordBase View User Manual
D02225R04.00
2 Graphing Records
Display symmetrical components measurement for the active graph.You must
select a, b and c phase quantities in Overlay View to enable this option, for
more explanation see “Readouts and Measurements” on page 2-65.
Scale Menus
Scale>Zoom X Axis +
Figure 2.49: Zoom X Axis +
Select this option to decrease the x axis range by 25% of the current zoom
range.
Scale>Zoom X Axis -
Figure 2.50: Zoom X Axis -
Select this option to decrease the x axis range by 25% of the current zoom
range.
D02225R04.00
RecordBase View User Manual
2-19
2 Graphing Records
Scale>Zoom Y Axis +
Figure 2.51: Zoom Y Axis +
Select this option to decrease the y axis range by 25% of the current zoom
range.
Scale>Zoom Y Axis -
Figure 2.52: Zoom Y Axis -
Select this option to increase the y axis range by 25% of the current zoom
range.
2-20
RecordBase View User Manual
D02225R04.00
2 Graphing Records
Scale>Undo Zoom
Figure 2.53: Undo Zoom
Display the previous zoom level.
Scale>Reset Zoom
Reset zoom levels
Figure 2.54: Reset Zoom
Reset the graphs to the initial zoom level.
D02225R04.00
RecordBase View User Manual
2-21
2 Graphing Records
Scale>Change Scale (Y axis)
Figure 2.55: Change Scale (Y axis)
Change Y axis to a desired minimum and maximum value using the dialog box
to set the new values. If the manual scale option is checked, the y axis is not
rescaled to new data values; the trace is displayed within the selected range.
You can set the desired scaling, save the options in the template and recall the
template for other recordings, for further explanation refer “Templates” on
page 2-57.
2-22
RecordBase View User Manual
D02225R04.00
2 Graphing Records
Options Menus
Options>Calculate Derived Channels Now
Use this option to calculate the derived channels and append to the record as
virtual channels. For TESLA records the data is written back to the original record so that the next time the record is viewed all the derived channel information is readily available, for further explanation see “Calculated Channels” on
page 2-72.
Options>Show Grid
Figure 2.56: Show Grid
Turn grid on or off on all graphs.
Options>Show X Axis Ticks
Figure 2.57: Show X Axis Ticks
Show X axis ticks on all graphs.
D02225R04.00
RecordBase View User Manual
2-23
2 Graphing Records
Options>Show Legends
Figure 2.58: Show Legends
Show or hide legends on all the graphs.
Options>Show Trigger Marker
Figure 2.59: Show Trigger Marker
Show or hide trigger marker on the active graph and active curve.
2-24
RecordBase View User Manual
D02225R04.00
2 Graphing Records
Options>Lock Markers
X and O markers
are locked
Figure 2.60: Lock Markers
Lock or unlock X and O markers.
Options>Extend Print Range
Entire data is printed in multiple
pages at the current zoom level
Figure 2.61: Extend Print Range
Print all the channels of the view for the entire data range in the current zoom
level.
D02225R04.00
RecordBase View User Manual
2-25
2 Graphing Records
Options>Set Phase Colors
Figure 2.62: Set Phase Colors
Use this option to select user-defined colors for A, B and C phase voltages and
currents. When the colors are selected, the channels are automatically identified based on the color. The default values for A, B and C phase quantities are
red, blue and green respectively.
Options>Set Phase Rotation
Figure 2.63: Set Phase Rotation
Use this option to select ABC or ACB phase rotation. Note that this is used in
Symetrical Component View.
2-26
RecordBase View User Manual
D02225R04.00
2 Graphing Records
Options>Set Precision
These readouts have
4 decimal places
Figure 2.64: Set Precision
Set the precision (number of decimal places) for the readouts. In Symmetrical
Component and Harmonic Views, the phase angle readout precision is always
zero (no decimal places are used).
Help Menus
Help>User Manual
Select to display an electronic version of the user manual.
Help>About RecordGraph
Display program information, version number and copyright.
Help>Show Hot Keys
Lists the available hot keys or short cuts.
D02225R04.00
RecordBase View User Manual
2-27
2 Graphing Records
Tool Bar
Buttons
Titles
Markers
Set Graphs Per Page
Add Digital Graph
Zoom X Axis +
Zoom Y Axis +
Reset Zoom
Move Graph Down
Change Scale (Y-Axis)
Line
Paste Trace
Trace Information
Increase Left Margin
Show Record Summary
Print
RecordGraph
File View Graph Measure Scale Options Help
<Default>
Export...
Save Template
Decrease Left Margin
Show/Hide Tree View (Channel List)
Show/Hide Legends
Copy Trace
CrossHair
Time Alignment
Move Graph Up
Zoom Y Axis Zoom X Axis Delete Graph
Add Analog Graph
Show/Hide Trigger Marker
Relay Data and Impedance Options
Add a View
Figure 2.65: Tool Bar Buttons
In the Tree View, you can expand a loaded record to identify the recorded and
calculated channels (if configured). A right-click menu is available to manipulate the tree items. Most of the tool bar buttons work in a similar way to that
of the menu items explained in the previous sections.
Table 2.1: Tool Bar Buttons
2-28
Save Template
Save template file on the disk.
Show Record Summary
Displays record summary (events, trigger time, etc.)
Export
Brings up export module.
Print
Prints record.
Add a View
Adds a graph view that displays the fault information.
Titles
Places a title above graph for all views, “View Title Options” on
page 2-64.
Impedance
Creates an R-X plot before, during and after fault.
RecordBase View User Manual
D02225R04.00
2 Graphing Records
Table 2.1: Tool Bar Buttons
D02225R04.00
Markers
Displays vertical lines "x" and "o" to find the coordinate values
on the graph.
Show/Hide Trigger Marker
Displays/hides zero trigger marker.
Set Graphs Per Page
Sets number of graphs per page.
Add Analog Graph
Add an analog graph.
Add Digital Graph
Add a digital graph.
Delete
Delete a graph.
Zoom X Axis +
Enlarges the trace range on X axis.
Zoom X Axis -
Reduces the trace range on X axis.
Zoom Y Axis +
Enlarges the trace range on Y axis.
Zoom Y Axis -
Reduces the trace range on Y axis.
Reset Zoom
Resets zoom control.
Move Graph Up
Vertically moves graph upwards.
Move Graph Down
Vertically moves graph downwards.
Time Alignment
Offset X axis time value.
Change Scale (Y Axis)
Scale Y axis minimum and maximum range.
CrossHair
Displays X and Y coordinate values.
Line
Available only for impedance view, draws a reference line.
Copy Trace
Copies a trace to another location.
Paste Trace
Pastes a trace.
Show/Hide Legends
Displays/hides legends the traces.
Trace Information
Displays/hides channel information: Date, Station Name,
RecordName, Channel Name.
Show/Hide Tree View
Channel List
Expands and minimizes RHS of the screen.
Decrease Left Margin
Decreases left margin.
Decrease Right Margin
Decreases right margin.
RecordBase View User Manual
2-29
2 Graphing Records
2.3 Views
The view screen graphically displays information from the record. A view is
associated with a tab at the bottom of the screen which can be renamed using
the Rename tab. You can create a maximum of 15 view tabs.
Add a View
Add new view to layout.
1. Select the View>Add... from the top menu bar or the Add... button from the
tool bar.
2. Select the desired view from the pop-up dialogue box.
3. Click OK.
Select desired view
and select OK.
Select View>Add... or
click the Add button
to create a view type.
View Tabs
Figure 2.66: Add a View
The Add View… option lists Impedance View only if the selected
record is from an L-PRO, TESLA or COMTRADE record.
Delete a View
Clears active view from layout.
1. Select the View>Delete from top menu bar. A pop-up window asks you to
confirm the deletion.
2. Click OK to confirm. Click Cancel to stop deletion.
2-30
RecordBase View User Manual
D02225R04.00
2 Graphing Records
Rename a View
Use this option to rename the active tab which is displayed at the bottom of the
view.
1. Select the View>Rename Tab from top menu bar or right-click on the graph
to bring up the context menu and select Rename Tab.
2. A dialogue box appears with the old name. Modify and click OK to rename
the view.
Figure 2.67: Rename Dialogue Box
Show Channel
List
Displays or hides the channel list on the left-hand side of the screen to allow
more space for the graphs.
Toolbar
Displays or hides the toolbar on the left-hand side of the screen to allow more
space for the graphs.
D02225R04.00
RecordBase View User Manual
2-31
2 Graphing Records
2.4 Graphs
The graph is an area or space in a view where each channel of analog or digital
information is shown. The information is shown as X-Y data with X = time and
Y = magnitude.
Adding Graphs
1. Select Graph>Set Graphs Per Page or right-click on the graph to bring up
the context menu and select Set Graphs Per Page to add selected number of
graphs to the Timeline View.
2. Select Graph>Add Analog Graph or right-click on the graph to bring up the
context menu and select Add Analog Graph to add an analog graph to the
Timeline View.
3. Select Graph>Add Digital Graph or right-click on the graph to bring up the
context menu and select Add Digital Graph to add an digital graph to the
Timeline View.
A maximum of 36 graphs (analog and digital) can be created for each Timeline
View, Overlay View and Trend View.
Adding
Channels
1. Click the desired channel to be displayed on the graph.
OR
2. Drag a channel and drop it onto the desired graph.
3. Depending on the view type following action takes place:
• In a Timeline View the existing channel is replaced and only one channel
is allowed per graph.
• In an Overlay View up to 32 traces can be placed per graph.
• In a Trend View the existing channel is replaced and only one channel is
allowed per graph.
• External or digital channel should be placed on a digital graph to stack the
traces. A maximum of 32 traces can be specified per graph.
Channel Tooltip
When the cursor is moved over the channel name, following information is displayed in the tool-tip window.
• Device – name of the device (example, TESLA)
• Record – name of the record
• Max – channel maximum value along with the unit
• Min – channel minimum value along with the unit
• X – Offset-whether the x-axis has offset (time alignment)
• Samples – number of samples
• Sample rate – samples /second (for trend channels it is seconds per sample)
• Time Sync – time source type and synchronization status
2-32
RecordBase View User Manual
D02225R04.00
2 Graphing Records
Tool-tip window
Figure 2.68: Tool-tip
Zoom Using the
Mouse
1. Left-click on any graph and drag to form a small box around the graph area.
2. When you release the mouse, the trace assumes new zoom position determined by the area of the zoom coordinates.
Drag a box around the
graph area to be
zoomed.
Figure 2.69: Select a Section of the Graph to Zoom
D02225R04.00
RecordBase View User Manual
2-33
2 Graphing Records
Figure 2.70: Portion of Zoomed Graph
Follow the procedure 1 and 2 for further zooming.
Zoom Using the
Tool Buttons
You can also use Zoom X axis +, Zoom X axis -, Zoom Y axis + and Zoom Y
axis - on the tool bar buttons to quick zoom in and zoom out (25%).
Repeat step 1 to zoom further.
Zoom only X or
Y Axis
To zoom only the X axis, select Ctrl key and use the mouse to draw a box on
the graph.
To zoom only the Y axis, select shift key down and use mouse to draw a box
on the graph.
Undo Zoom on
Graphs
2-34
1. Right-click on the graph to the context menu.
2. Select the UndoZoom option.
3. Graphs are redrawn to the previous zoom level.
4. Select Reset Zoom option to reset the graphs to the initial zoom level. This
can be chosen at any stage.
RecordBase View User Manual
D02225R04.00
2 Graphing Records
Pan Graph
Zoom the graph (if not zoomed) to a required zoom level.
You should hold the “Thumb track” and move it along the scroll bar. To have
fine control click on the right arrow scroll bar button or press Ctrl and click on
the right arrow scroll button.
Thumb Track - move right/left to pan graph
Figure 2.71: Thumb Track
Keyboard
Functions
The keyboard is also available for zooming, setting markers and positioning
graphs. To display the keyboard hot key menu right-click on the graph and
bring up the context menu, select Show Hotkeys option.
Figure 2.72: Hot Keys
D02225R04.00
RecordBase View User Manual
2-35
2 Graphing Records
Right-click
Context Menu
Figure 2.73: Right-click Context Menu
2-36
RecordBase View User Manual
D02225R04.00
2 Graphing Records
Timeline View
Channel Information
Record Information
Read-out Markers
Tool Tip
Figure 2.74: Timeline View
• Timeline View is designed to “stack” channels and has single time line axis
common for all the graphs.
• Each analog graph in this view can hold only one trace.
• Each digital graph in this view can hold 32 traces (8 traces are preferred).
• Selecting a channel from the LHS tree view while the same graph is active
replaces the existing channel with the currently selected one.
• A maximum of 32 graphs (analog and digital) can be added per view.
• You can mix and match channels from different records and/or IEDs.
• Time line view displays read-out (if markers are on) on the RHS and channel information on its LHS.
• Read-out corresponds to the currently selected channel type and the scale
(primary/secondary) which is displayed on the status bar.
D02225R04.00
RecordBase View User Manual
2-37
2 Graphing Records
Overlay View
Channel Information
Record Information
Figure 2.75: Overlay View
• Overlay View is designed to “overlay” channels and has single time line
common axis for all the graphs.
• Each analog graph in a overlay view can hold 32 traces.
• Each digital graph in this view can hold 32 traces (8 traces are preferred).
• Selecting a channel from the LHS tree view while the same graph is active
overlays the channel on the selected graph.
• A maximum of 32 graphs can be added per view.
• You can mix and match channels from different records and/or IEDs. Time
line view displays read-out (if markers are on) on the RHS and channel information on its LHS.
• Read-out corresponds to the currently selected channel type and the scale
(primary/secondary) which is displayed on the status bar.
2-38
RecordBase View User Manual
D02225R04.00
2 Graphing Records
Symcom View
Record Title
Channel Names
Instantaneous Channel
Amplitude Display
A, B, C Phase Analog Channels
Time Display
Markers locked one cycle apart
Phasor and Symmetrical
Component Graph
Diplay of Phases (A, B, C)
Figure 2.76: Symcom View
• Symcom View is designed to analyse symmetrical components of voltage
or current channels.
• You must load 3 voltage or current channels to view the components and
associated phasor plots from the same record.
• The view displays: analog channels, positive, negative, zero sequence
phasors and corresponding table which contains numerical values of these
components and phase angle.
• All the components are calculated in RMS values.
• Channel instantaneous values are displayed on the RHS of the analog
graph.
• Markers are permanently set on the graph one-cycle apart.
• Grab the marker and move (on the time line axis) to display new set of components and phasor values.
• Phase rotaton can be selected by right-clicking and selecting the Set Phase
Rotation option. Select ABC or ACB.
D02225R04.00
RecordBase View User Manual
2-39
2 Graphing Records
Harmonic View
Record Title
Channel Names
Instantaneous Channel
Amplitude
Analog Graph
Time Display
Markers locked one cycle apart
Bar Graph of
Harmonics
Amplitude
Table displays
Harmonic Amplitude
with corresponding
Phase Angles
Figure 2.77: Harmonic View
• Harmonic View is designed to analyse harmonics associated with analog
channels.
• A maximum of 3 traces can be analysed per view.
• The view displays: analog channels, a bar graph of harmonics and a table
which contains RMS values of the harmonics with phase angle.
• A maximum of 25 harmonics (order) can be displayed.
• Channel instantaneous values are displayed on the RHS of the analog
graph.
• Markers are permanently set on the graph one-cycle apart.
• Grab the marker and move (on the time line axis) to display a new set of
harmonics.
All harmonic phase angles are compensated and referenced with respect to "A" phase voltage in relays and a configured channel in TESLA recorder. For COMTRADE records phase voltage is the first
analog channel considered as the reference phase.
2-40
RecordBase View User Manual
D02225R04.00
2 Graphing Records
Impedance
View
Impedance View is an R-X plot. The R-X quantities are calculated over the entire data range from the recorded analog voltage and current channels. R-X plot
is useful in analyzing the performance of L-PRO relays and swing disturbances
from the TESLA recorders. Since the information to be displayed involves
time as a third dimension, this view provides meticulous cursor and zoom control over the data points being viewed. Optionally it supports superimposition
of the relay characteristics (Zone 1, Zone 2, Line, Blinders, etc.) from L-PRO
records or files generated from any L-PRO Offliner settings program.
The following table summarizes the types of channels from which impedance
(R and X values) is derived along with the supported product. RecordGraph
displays these channels on the left hand side in the tree view. Depending on the
product, the following basic quantities are used the respective impedance channels.
In impedance calculation, a threshold limit is used based on the fundamental
RMS value of the current to include or exclude the R and X values for plotting.
This limit depends on the CT module used for the relay or recorder application.
For 1A CT module, 0.02 A is the limit whereas for a 5A CT module, 0.1 A is
used as the limit. When the data is copied to the clipboard, the discarded values
of R and X values are not exported.
Table 2.2: Impedance View
D02225R04.00
Sl. No.
Channel Types
Quantities
Supported Products
1
High Speed (HS)
Voltage and Current
B-PRO, L-PRO, TESLA,
COMTRADE
2
High Speed (HS)
Positive Sequence Voltage and
Current
TESLA
3
Low Speed (LS)
Voltage and Current
TESLA
4
Low Speed (LS)
Watts, Vars and Voltage
(Phase and Sequence)
B-PRO, L-PRO, TESLA
5
Low Speed (LS)
Positive Sequence Voltage and
Current
B-PRO, L-PRO, TESLA
6
Low Speed (LS)
Impedance (Phase and
Sequence)
B-PRO, L-PRO, TESLA
RecordBase View User Manual
2-41
2 Graphing Records
To add an Impedance view select View>Add.. or the Add a View tool bar button. From the dialog box select Impedance View.
Figure 2.78: View>Add> Impedance
The Add View… dialog box lists the Impedance View only if the selected record is from B-PRO, L-PRO, TESLA or COMTRADE records
depending on the record type.
When the Impedance View option is selected, following initial screen is displayed.
(2) Basic channel names
and derived impedance type
(1) View Title
(3) Graph Zoom control
(x-y axis zooming)
(4) Time Window
(5) Time Window width
and position control
(6) X and O markers
Figure 2.79: Opening Impedance Screen
2-42
RecordBase View User Manual
D02225R04.00
2 Graphing Records
Components and Controls
1. A text component displays the title at the top of the Impedance View shown
in Figure 2.79: Opening Impedance Screen. The title is compiled from items
in the Title Options dialog box. Default title is the file name and trigger
event.
2. The basic channel names are displayed below the title, refer to table “Channel Types” on page 2-41.
3. The graph zoom is controlled using the sliding control on the right side of
the window. The R-X plot aspect ratio is maintained under all zooming
tools. The graph zoom control offers a 10x zoom factor between minimum
and maximum amplitude of the data (R and X coordinates).
4. The Time Window control provides a means to select the range of data for
better presentation of R-X values. For example, if the voltage and current
channels are recorded from 0.0 to 0.2 seconds with 1000 data points, using
this control, you can choose to view only 0.1 second data (500 points).
5. Time window width and position control can be used for the precise data
analysis.
6. Control the X and O markers.
Create Impedance View with an L-PRO Record
1. Launch RecordGraph with an L-PRO high speed (fault) record and expand
the channels in the tree view.
2. Create an Impedance View using View>Add… or use the tool bar option.
3. Select line voltages A, B and C, and corresponding line currents A, B and C
from the tree view. Impedance (R and X) corresponding to Zab, Zbc and Zca
phase-phase are calculated internally and displayed.
Actual channel names
(as selected from the
tree view)
Phases of the basic
voltage and currents
Resolved impedance
name
Time Window
Figure 2.80: Create Impedance View with an L-PRO Record
D02225R04.00
RecordBase View User Manual
2-43
2 Graphing Records
Each channel name is divided into three parts:
• the basic quantity (voltage or current) used in the calculation of the impedance
• the name of the actual channel selected
• the resolved impedance name with the configuration (phase-phase or
phase-ground)
The Time Window control shows the minimum and maximum time of the data
viewed. In the above example, the full range data is viewed.
Use the graph zoom control to zoom the x and y axis.
The thumb track is moved
from top to the position
indicated and the traces
are zoomed in.
Figure 2.81: Example of graph zoom control
When you move the mouse near the edge of the Time Window control, the cursor shape changes from normal arrow to two headed arrow as shown in the diagram. Now you can resize the thumb track to a desired level of data range. In
the example, the data starts at position -0.1667 and ends at (-0.1667 + 0.0109),
where 0.0109 is the width (total data range). Therefore, only small portion of
the data can be viewed.
2-44
RecordBase View User Manual
D02225R04.00
2 Graphing Records
Time Window control
is resized to include
only portion of the data
Time Window enlarged
Figure 2.82: Example of using Time Window control
If you move the thumb track (not resize) to the extreme end, then the traces are
rendered in the new data range.
Time Window control is
moved to include
different range of the data
Time Window enlarged
Figure 2.83: Time Window control moved to new location
In the above case, the data is included from range -0.0619 to -0.0619 + 0.0109,
where 0.0109 is the data width. The 0.019 width remains same. If you resize
the thumb track, then the width can be controlled; or you can double-click near
the number 0.0109 to get a dialog box to enter the data range precisely.
D02225R04.00
RecordBase View User Manual
2-45
2 Graphing Records
A dialog box pops-up to enter
the width or data range
indicated by the size of the
thumb track. The scale
indicates the step by which
the data is incremented.
Figure 2.84: Indicate data range
A dialog box appears to enter the width or data range, which is indicated by the
size of the thumb track. The scale indicates the step by which the data is incremental. For example, when the spin control arrow is clicked (after closing the
dialog box), if an up arrow is clicked, the data is incremental from present position to present position + 5%. On the other hand, if the down arrow is clicked,
the data is detrimental by 5%.
Example to Superimpose the L-PRO Relay Characteristics
Click this button to
apply L-PRO relay
characteristics through
the options dialog box
Figure 2.85: Superimpose the L-PRO Relay Characteristics
When you select the Relay data & impedance options button, a dialog box appears. The parameter required, such as k0 factor, the line sequence impedance
values, the system voltage data and the other required information is initialized
through this dialog box initialization. All these values are read from the settings file associated with the record.
2-46
RecordBase View User Manual
D02225R04.00
2 Graphing Records
Table 2.3: Relay data and impedance options
L-PRO settings file
Radio button to select relay characteristics from the current record. If
an L-PRO record is selected, this button is enabled.
Current record
If a B-PRO, TESLA or COMTRADE record is selected, this button is
enabled.
File
Displays the settings file (full path name) from which the relay data is
extracted to plot the impedance characteristics.
Browse
Gives an option to select the settings file from any other location. The
file type filter reads or selects only *.lps file type, if L-PRO setting file
is selected..
Impedance Options
Impedance configuration option includes a number of other options,
such as, Phase-Phase, Phase-Neutral, radio button. Depending on
this option and the type of channel, different impedance options
(check buttons) are enabled.
Configuration
Zpos (positive sequence impedance 3 phase basis)
Zan, Zbn or Zcn
Zab, Zbc, or Zca
Other Impedance
Z-Line
Displays the line angle (can be checked or unchecked)
Z-Load
Displays the coordinate of the load impedance (can be checked or
unchecked)
Blinders
Available only if the Phase-Phase option is chosen.
Directional
Zones to display
Phase-Ground or Phase-Phase
Zone 1 to 4
Zone1-Zone4 displays the respective zones impedance characteristics (can be checked or unchecked)
Apply
Redraws the display with the currently selected options.
Launch
Launches the setting file through the Offliner settings program. Note
that the L-PRO Offliner setting program should be installed for this to
work successfully.
Close
Closes the dialog box.
In the Relay data and impedance options dialog box check the Zone 1 to Zone
4 boxes and select the Apply button. All the four zone characteristics are superimposed on the calculated phase impedances (note that the characteristics are
zoomed using free-form zoom to get a better resolution).
D02225R04.00
RecordBase View User Manual
2-47
2 Graphing Records
Figure 2.86: Example superimposing the zone characteristics
In the above example phase-phase impedances Zab, Zbc and Zca are selected,
indicated by a check mark, but only Zca is in the zoom range.
All the four zones mho characteristics are superimposed. You can see that the
Zca impedance has entered the Zone 2 and Zone 3. You can use a combination
of zoom and time window control to analyze the precise time at which the impedance enters the zones.
Line Impedance
Blinder Impedance
Figure 2.87: Example showing the Line and Blinder impedances
Check the Z-Line and Blinder boxes; then select the Apply button to superimpose the line and blinder impedances.
2-48
RecordBase View User Manual
D02225R04.00
2 Graphing Records
Select this button to
enable CrossHair
measurement feature
CrossHair
measurements
Figure 2.88: Example illustrating the use of the CrossHair measurement
Select the CrossHair button. When you drag the mouse (left button down and
move) on any point on the trace, the R, X and the Z corresponding values are
displayed.
You can move the cursor anywhere on the graph to get the measurement. When
this feature is enabled, free form zooming is disabled; but you can use the
graph zoom control to get a closer look at the trace.
Select this button to
set an arbitrary line
Arbitrary line for the
reference purpose
Figure 2.89: Example of the Line feature
Set a reference line to measure the data using the Line feature. This line is a
reference line and not associated with the data values.
D02225R04.00
RecordBase View User Manual
2-49
2 Graphing Records
When the line option is enabled, the free form box zooming is disabled. Disable the CrossHair measurement to resize and move the reference line; then enable the CrossHair option to measure the values.
Legend feature button
Legend box with all the
relay characteristics
impedance names
Figure 2.90: Example of the legends feature
Use the legend feature to distinguish relay characteristics from the calculated
impedances. You can move the legend box and resize to the desired level. You
can hide the legend box by re-selecting the legend option again.
Resized legend box showing
all the relay characteristics
impedance names
Figure 2.91: Legends features moved and enlarged
2-50
RecordBase View User Manual
D02225R04.00
2 Graphing Records
Marker button
Cursor corresponding
to marker O
Select channel name
Cursor corresponding
to marker X
Marker X and O
Marker X and O
readouts
Figure 2.92: Example illustrating the use of data markers
Select the marker option to set the markers. Select the desired channel name
for the required measurement. For example, the channel associated with Zca is
chosen (click this channel name for the selection). Move the marker by sliding
it to the desired location. When you change the data range (using Time Window control), the cursors may disappear from the traces indicating that the
markers are always associated with the data.
Positive sequence
impedance trajectory
Figure 2.93: Example of L-PRO swing record choosing positive sequence voltage and
current
Select an L-PRO swing record from RecordBase View and expand the channels. Click the positive sequence voltage and current; RecordGraph automatically calculates and displays the positive sequence impedance.
D02225R04.00
RecordBase View User Manual
2-51
2 Graphing Records
Positive sequence
impedance trajectory
Figure 2.94: Example of L-PRO swing record choosing watt, var and positive sequence
voltage channels
Select an L-PRO swing record from RecordBase View and expand the channels as shown. Click the watt, var and positive sequence voltage; RecordGraph
automatically evaluates and displays the positive sequence impedance.
Positive sequence
impedance trajectory
Figure 2.95: Example of L-PRO swing record choosing impedance channel
Select an L-PRO swing record from RecordBase View and expand the channels as shown. Click the impedance channel; RecordGraph automatically displays the positive sequence impedance trajectory.
As you select the desired channels, the impedance (R-X characteristics) are superimposed on the existing relay characteristics. To select new set of voltage
and current channels use the Delete trace(s) option from the right-click context
menu and select new channels. If desired, you can modify or re-apply the impedance options.
2-52
RecordBase View User Manual
D02225R04.00
2 Graphing Records
Drag the thumb track on the scroll bar to zoom in or zoom out the axis range.
In the Time Window control + click the arrow buttons or drag the thumb track
to scroll the window of visible data in the time domain.
To place the X and O markers use the tool bar or the right-click context menu
or the View>Markers option, dragging a marker to the right or left moves corresponding marker. If the Time Window control does not show the data, then
the markers are shown as small triangles on the left or right sides. If you click
the triangle, corresponding data cursor is displayed and the time range is automatically adjusted.
You can save all the impedance display options to a template file (File> Save t
Differential
View
Differential View displays the variation in operating current, Io and restraint
current Ir. This view is designed specifically for T-PRO and B-PRO (single
and 3 phase) relays. This view is designed with intuitive zoom, time range and
cursor controls similar to that of Impedance View.
The Add View dialog box is only available if the selected record is
from T-PRO or B-PRO.
Open a record from a T-PRO or a B-PRO relay; then use the View>Add.. button and choose Differential View.
Figure 2.96: Add Differential View
D02225R04.00
RecordBase View User Manual
2-53
2 Graphing Records
When you select the Differential View option, the following screen is presented.
Record Title
Channel Names
Zoom In
Zoom Out
Time Window
Figure 2.97: Differential View
In case of T-PRO and B-PRO 3-phase relays, the differential characteristics
corresponding to a, b and c phases are displayed, whereas in the case of single
phase B-PRO, the selected phase differential characteristics are displayed.
Note that in this view, you are not allowed to add/delete traces, but the zooming, panning, markers and other facilities which are available in the Impedance
View is also available with this view.
The differential characteristics are only displayed for those devices which are
enabled. If no devices are enabled, then a blank graph will be displayed.
2-54
RecordBase View User Manual
D02225R04.00
2 Graphing Records
Phasor View
Figure 2.98: Phasor View
• Phasor View is designed to display a phasor diagram of selected elements
within a data record using the RecordGraph application.
• It uses both rotational and time domain-graphs to demonstrate signal and
phasor data.
• A maximum of 12 channels can be added to the phasor view.
D02225R04.00
RecordBase View User Manual
2-55
2 Graphing Records
Trend View
Figure 2.99: Trend View
• Trend View is designed to display “trend” data.
• It has a special x-axis, common to all the graphs to display the data in the
“date” format. When zoomed, the scale automatically changes depending
on the date range. (For example: years/months or months/days or days/
hours or hours/minutes or minutes/seconds).
• Each analog graph in a trend view can display one trace.
• A maximum of 32 graphs can be added per view.
2-56
RecordBase View User Manual
D02225R04.00
2 Graphing Records
2.5 Templates
Templates associated with a record.
Left Margin
Figure 2.100: Template List
Template contains user-defined layout information including:
• Views – graphs and their location along with the traces (channels)
• Markers position (X, O and trigger marker, T)
• Views and graphs title options
• X axis scaling (zooming information)
• Y axis scaling (zooming information)
• X axis shift (time alignment) of each channel
• Measurement (readout) options
• Left Margin
Template stores the easy-to-manage layout information in a file based on product type (B-PRO, F-PRO, L-PRO, T-PRO, TESLA, COMTRADE).
When the template information is stored, it can be applied to any recording
(normally from same IED or product) for which the template is valid. For example, if a template has 3 views with 3 graphs per view, and has 1, 2 and 3 analog channels displayed with various options, this information can be applied
to any record with that common framework. The concept is to re-use the common layout information and update the data information with the new recorded
channels thus reducing the graph re-creation processing time.
These flexible and user-defined templates can be shared among different users.
Normally (under default installation options), templates are stored on the local
D02225R04.00
RecordBase View User Manual
2-57
2 Graphing Records
hard disk in a sub-folder where the RecordGraph application resides, for example, My Documents\ERLPhase\RecordGraph\Template.
The template graphical layout file contains information about fixed views,
graphs, traces, marker positions, read-out, scaling and zoom range. You can
analyse a system disturbance recorded at different times and at different locations using the template.
When a template is opened, the predefined layout information is automatically
applied based on the new record (or set of records). You can save time by viewing the data recorded without manually loading the traces again. Templates are
the first step in generating a visual report.
You automatically form a template when you create views and graphs. To reapply the template to a different recording from the same or different recorder,
you must save this layout information in a file. You can extend or alter templates by manipulating views, graphs and traces.
Templates are not saved automatically, but must be saved using the File>Save
Template option. Template files can be shared and customized. The list of templates is dynamically created and displayed in the tool bar. When a record is
added to RecordGraph, an automatic scan search is done to list the templates
corresponding to the record loaded. This list may have both single or multi-record templates, if the record loaded is a part of multi-recorder template. If no
match is found, a <Default> template is loaded. You can define any number of
templates based on a single recorder or multiple recorders.
Default
Templates
Hard coded, static default templates are created whenever you open the RecordGraph application. These are not stored in the file, but are dynamically
created and displayed as <Default> in the list box.
You can override this <Default> template by saving any other template as a default template.
The user-defined default template path is stored in the registry key based on the
product and the type of recording (applicable for all products).
For example:
• TESLA/HS - high speed
• TESLA/LS - low speed
• TESLA/Trend - slow recordings
2-58
RecordBase View User Manual
D02225R04.00
2 Graphing Records
Managing
Template Files
Whenever a new record file is loaded into the RecordGraph, it automatically
loads the relevant template file names in a list box attached to the main tool bar.
The template files are filled or updated based on certain rules:
• Templates are stored based on product type.
• If a user-defined default template is available, it is loaded as the first item
in the list box, otherwise, a static <Default> template is listed as the first
item.
• Template files are matched based on IED (serial number) in the case of
TESLA recorders and are common in case of relay products (B-PRO, FPRO, L-PRO, T-PRO.
If template files for a TESLA recorder are created and stored (for example,
with serial number TESLA-2000-981103-07), these template files can not be
applied to another recorder with different serial number such as TESLA-2000981103-08. On the other hand, if template files are created for relay products
such as L-PRO, this template can be applied to any relay IED B-PRO, F-PRO,
L-PRO or T-PRO). Hence, templates are IED-based (serial number-based) in
case of recorders and product-based in case of relays.
Double-click (or use the Enter key) on the currently active record in the RecordGraph tree list (displayed in bold) to apply the template or pick any desired
template from the template list box.
Templates can be renamed, duplicated or deleted using template manager from
within the RecordGraph.
There is no limitation on the number of template files used (as long as the hard
disk space is available).
Create New
Template File
1. Modify the existing template layout information and save the modified template into a new file.
2. Create new views and graphs by deleting the views from the existing layout
and saving new ones into a new the template file.
If the template file is created from multiple records, all the records should be
pre-loaded into RecordGraph to successfully apply the layout information.
Layout information is applied one at a time. If the template involves more than
one record, apply template (double-click on each record) to fill respective
channels. The name of the recorder IED in the template file are displayed in the
tool-tip list box window when the mouse cursor is moved over it. The tool-tip
also displays the product name and the user-defined default template file name,
if one exists.
D02225R04.00
RecordBase View User Manual
2-59
2 Graphing Records
Templates
Menus
Save Template
Displays a dialogue box only if <Default> template is currently displayed in
the template list box. Since <Default> template name is reserved for hard coded templates, you must save the template information with a new name. If any
other template file name is displayed, other than <Default>, the layout information is updated without the dialogue box being displayed.
Save Template As...
Displays a dialogue box to save the template. The option Save as default template, if checked, saves the template as user-defined default template. Refer
previous section for more explanation on the user defined default template.
Template Manager...
Figure 2.101: Template Manager
Brings up the template manager dialogue box which lists all the templates currently available.
Rename
Renames the currently selected template.
Duplicate
Copies the contents of the selected template into another file.
Delete
Deletes currently selected template.
2-60
RecordBase View User Manual
D02225R04.00
2 Graphing Records
Template - Tool
Tip
Template Tool Tip
Template tool tip information displays:
• IED name
• User-defined default template associated with that IED
• Serial number of the IED which is used as the unique feature to match the
templates.
Template Single IED
1. Open a record from the desired IED (B-PRO, F-PRO, L-PRO, T-PRO or
TESLA).
2. Create or modify the existing layout information.
3. Use Save Template as... option to save the new layout information with a desired template name.
A single IED template is saved/matched based on its serial number.
Any record from the IED with the same serial number can use or
share the template (layout) information.
D02225R04.00
RecordBase View User Manual
2-61
2 Graphing Records
Template Multiple IED
Figure 2.102: Multiple IEDs
1. Open records from two or more desired IEDs (different TESLAs or different
relays).
2. Create or modify the existing layout information (create graphs by selecting
channels from different IEDs).
3. Use Save Template as... option to save the new layout information with a desired template name.
When all IED records are pre-loaded into the RecordGraph, multiple
IED templates are saved/matched based on serial number. If the
record is loaded one at a time, then double-clicking on each record
reapplys the template filling the respective channels.
2-62
RecordBase View User Manual
D02225R04.00
2 Graphing Records
2.6 View and Graph Titles
When a new record is loaded, the information corresponding to the options selected is compiled and the updated information is displayed in the View Title.
GraphTitle
View Title
Figure 2.103: View and Graph Titles
View Title
View Title is the title on the top of each record view. When a new record is
loaded, the information corresponding to the options selected is compiled and
the updated information is displayed in the View Title. You can choose any of
four options by clicking the arrows to move the items in the list. The option is
saved into the template. This option is not available for the Symcom or Harmonic Views.
The option choices are:
• Record Name
• Station Name
• Location
• Trigger Time
• UnitID or Relay
• Product Type
• Serial Number
• Trigger Event
• System Frequency
• Priority
D02225R04.00
RecordBase View User Manual
2-63
2 Graphing Records
Figure 2.104: View Title Options
Graph Title
Graph Title is the information that appears on the left margin of each graph.
Graph Title is a combination of various options. When a new record is loaded,
the information corresponding to the options selected is compiled and the updated information is displayed in the Graph Title dialogue box. You can choose
any four options by clicking the arrows to move the items in the list. The option
is saved into the template. This option is not available for the Overlay View.
The option choices are:
• Channel name
• Trigger time
• Station name
• Record name
• Location
• UnitID or relay
• Sample rate
• Equipment ID
Figure 2.105: Graph Title Options
2-64
RecordBase View User Manual
D02225R04.00
2 Graphing Records
2.7 Readouts and Measurements
The Measure menu consists of the following:
• Markers
• Primary/Secondary
• Time Alignment
• Absolute Time
• Fundamental RMS
• True RMS
• Harmonics
• Symmetrical Components
Time Alignment
Absolute Time
Fundamental RMS
True RMS
Harmonics
Trigger
Markers
Figure 2.106: Readouts and Measurements
Markers
D02225R04.00
Selecting Measure>Markers or using the tool bar button places the “X” and
“O” markers on the graph, as well as, automatically placing markers on all new
graphs. If the markers are out of view range, double-click on the timeline graph
to bring back the markers to the desired location. Marker positions are saved
into the template. Readout corresponding to the option chosen is displayed on
the right side of the graph. Selecting trigger marker, T, displays the trigger time
of the record.
RecordBase View User Manual
2-65
2 Graphing Records
Primary
Selecting Measure>Primary multiplies the channel data by the primary scaling factor and redraws the y-axis for all graphs.
Secondary
Selecting Measure>Secondary multiplies the channel data by the secondary
scaling factor and redraws the y-axis of all graphs.
Time Alignment
Use this option to offset or align the trigger time of channels (normally from
different locations) or shift the x-axis time. This feature offsets the x-axis time
data by a precise value as desired.
1. A trace (channel) must first exist on the graph. Click the graph that you want
to show time alignment.
2. Select the Graph>Time Alignment menu option or the Time Alignment button on the tool bar.
3. Use the “spin” control (up and down arrows) to increase or decrease the offset.
4. Double-click the value to bring up a dialogue box to enter the new offset value and offset scale. Offset scale is the percent by which the increment is required.
5. Clear this option, by a second click on the Time Alignment button on the tool
bar or by selecting the Graph>Time Alignment menu option a second time.
Spin control to quickly
vary the offset value
Time alignment toolbar button
Edit box to change the offset value.
Note: Double-click here to change
the offset value and the offset
scale (increment)
Figure 2.107: Time Alignment
2-66
RecordBase View User Manual
D02225R04.00
2 Graphing Records
Absolute Time
This option displays the absolute time—the actual time of the recorded channels.
1. A trace (channel) must first exist on the graph. Click the graph that you want
to show absolute time measurement.
2. Select the Measure>Markers menu option or the Markers button on the tool
bar to place the markers on the graph. Markers are automatically placed if
not selected.
3. Select Measure>Absolute Time menu option.
4. Readout corresponding to the markers is displayed on the right-hand side of
the graph including:
• Year, Month, Day of the recording (yyyy/mm/dd)
• Absolute Time corresponding to marker X
• Absolute Time corresponding to markers O
• Difference in the Absolute Time between marker X and marker O
Absolute Time
Figure 2.108: Absolute Time
D02225R04.00
RecordBase View User Manual
2-67
2 Graphing Records
Fundamental
RMS
This option displays the RMS measurement of the fundamental (60 or 50 Hz)
between the two markers (X and O) of the selected channel.
1. A trace (channel) must first exist on the graph. Click the graph that you want
to show absolute time measurement.
2. Select the Measure>Markers menu option or the Markers button on the tool
bar to place the markers on the graph. Markers are automatically placed if
not selected.
3. Select Measure>Fundamental RMS menu option.
4. Readout corresponding to the markers is displayed on the right-hand side of
the graph including:
• RMS (fundamental frequency) Title
• Minimum RMS
• Maximum RMS
• Average RMS
Fundamental RMS
Figure 2.109: Fundamental RMS
2-68
RecordBase View User Manual
D02225R04.00
2 Graphing Records
True RMS
This option displays true RMS measurement values of all the harmonics (up to
25 order—including the fundamental), depending on the sample rate of the recorded channel.
1. A trace (channel) must first exist on the graph. Click the graph that you want
to show absolute time measurement.
2. Select the Measure>Markers menu option or the Markers button on the tool
bar to place the markers on the graph. Markers are automatically placed if
not selected.
3. Select Measure>True RMS menu option.
Readout corresponding to the markers is displayed on the right-hand side of the
graph including:
• True RMS Title
• Minimum True RMS
• Maximum True RMS
• Average True RMS
True RMS
Figure 2.110: True RMS
D02225R04.00
RecordBase View User Manual
2-69
2 Graphing Records
Harmonics
This option displays the harmonic contents (magnitude) of the desired channel
along with the Total Harmonic Distortion (THD) in percentage.
1. A trace (channel) must first exist on the graph. Click the graph that you want
to show absolute time measurement.
2. Select the Measure>Markers menu option or the Markers button on the tool
bar to place the markers on the graph. Markers are automatically placed if
not selected.
3. Select Measure>Harmonics menu option.
4. Readout corresponding to the markers is displayed on the right-hand side of
the graph including:
• Harmonics Title
• 2nd Harmonic
• 3rd Harmonic
• 4th Harmonic
• 5th Harmonic
• THD% of fundamental (up to 25 harmonics) depending on the sample rate.
Harmonics
Figure 2.111: Harmonics
2-70
RecordBase View User Manual
D02225R04.00
2 Graphing Records
Symmetrical
Components
This measurement option displays the magnitudes of the positive, negative and
zero sequence components of 3-phase voltage or current channel.
1. Create an Overlay View— you must have a 3-phase voltage or current channel.
2. Place three phase voltage or current channels on the graph.
3. Select the Measure>Markers menu option or the Markers button on the tool
bar to place the markers on the graph. Markers are automatically placed if
not selected.
4. Readout corresponding to the markers is displayed on the right-hand side of
the graph including:
• SymCom Title
• Positive sequence component magnitude
• Negative sequence magnitude
• Zero sequence magnitude
Symmetrical Components
Figure 2.112: Symmetrical Components
Phase Rotation is automatically determined based on relay setting information,
or is by default set to ABC; this can be changed by right-clicking on the view
and selecting "Set Phase Rotation", or from the Options Menu.
D02225R04.00
RecordBase View User Manual
2-71
2 Graphing Records
2.8 Calculated Channels
Calculated channels are virtual channels derived from the original recorded
channels. They are calculated based on the configuration information. In the
TESLA recorder, all the calculated channels are added to the original record
only once, but are available any time for the view with the RecordGraph application. Calculated channels differ widely depending on the product. They are
classified under high and low speed categories.
High Speed Calculated channels
• Summation
• Positive sequence
• Negative sequence
• Zero sequence
• Watts (single and three phase)
Low Speed Calculated channels
• Summation
• Positive sequence
• Watts (single or three phase)
• Vars (single or three phase)
• Impedance
• External
Type and number of channels available for the view depends on the configuration information.
Choose Options>Calculate Derived Channels Now to add the calculated channels. If this option is disabled, then the calculated channels are already available.
2-72
RecordBase View User Manual
D02225R04.00
2 Graphing Records
Calculated Channels
Figure 2.113: Calculated Channels
D02225R04.00
RecordBase View User Manual
2-73
2 Graphing Records
2.9 Exporting Views
Export active visible views to windows standard clipboard or to an enhanced
metafile. Following options are available:
• Copy To ClipBoard
• Save As MetaFile
Copy to Clipboard
Save to Metafile
Figure 2.114: Export Views
Copy to
Clipboard
Copies view to the clipboard in order to copy into another document, for example Microsoft Word.
1. To copy to clipboard select View>Copy to Clipboard or right-click on the
graph to bring up the context menu and select Copy to Clipboard.
2. Open any other software package, which supports the “pasting” facility from
the clipboard (for example Excel or Microsoft Word) and paste the view.
2-74
RecordBase View User Manual
D02225R04.00
2 Graphing Records
Save View as
Metafile
Saves the view to a Metafile format *.emf.
1. To save to as a Metafile select View>Save to Metafile... or right-click on the
graph to bring up the context menu and select Save to Metafile.
2. A dialogue box appears prompting you to save the file in a selected folder.
Figure 2.115: Save to Metafile
2.10 Exporting Channel Data
Any channel data can be exported to the clipboard from the active view. If a
graph has multiple channels, all the channel data is exported to the clipboard.
This option copies the trace data to the clipboard and using Edit>Paste to paste
into other applications like Microsoft Word or Excel.
Copy Trace Data to Clipboard
Figure 2.116: Copy Trace to Clipboard
D02225R04.00
RecordBase View User Manual
2-75
2 Graphing Records
Pasting exported data using Microsoft Excel
1. Open Microsoft Excel.
2. Choose Edit>Paste Special.
Figure 2.117: Paste Special using Excel
Pasting exported data using Microsoft Excel
Choose csv (comma separated variable) format and click OK.
Figure 2.118: Choose csv
Pasting exported data using Microsoft Excel
Domain: normally time data, it can be date YYYY/mm/dd in case of trend data.
2-76
RecordBase View User Manual
D02225R04.00
2 Graphing Records
Figure 2.119: Past to Excel
2.11 Record Summary
1 Click the record name to enable this feature.
2. Choose File>Show Record Summary… to display the record summary.
Figure 2.120: Show Record Summary
D02225R04.00
RecordBase View User Manual
2-77
2 Graphing Records
2.12 Digital Channel Status Indicator
Highlight digital channel which change state (with different icons), and list
only configured channels in the tree view. A mimic screen shot of the icons is
shown below. The <default> template automatically displays the digital channels which changes the state.
Icon with changes
in the digital status
Icon with no changes
in the digital status
Figure 2.121: Digital Channel Status Indicator
2.13 Time Sync Input Status
Time Sync input status (synchronized, unsynchronized or not available) is displayed in the tool tip window when you place the mouse on the channel name
or use Active Trace Information.
Additional information related to the time source (IRIG-B, SNTP, etc.) will
also be available as a portion of the Time Sync status.
IRIG-B status indicator
Figure 2.122: Time Sync Input Status Indicator
2-78
RecordBase View User Manual
D02225R04.00
2 Graphing Records
2.14 Derived External and Virtual Input Channels for
TESLA Swing Recordings
TESLA recordings do not record External Input and Virtual Input channels for
the swing records. A facility to view these channels in the RecordGraph is provided. RecordGraph automatically displays these channels (if configured) under low speed channel group. Events with the same element are grouped
together to form a channel. This facility is backward compatible.
2.15 Derived Channels for L-PRO, F-PRO High Speed
Recordings
For L-PRO and F-PRO high-speed records, Main and Aux individual phase
summation channels are added to the existing derived summation channels.
This facility is backward compatible.
2.16 Derived Channels for B-PRO, L-PRO Swing
Recordings
For B-PRO and L-PRO swing records, real power, reactive power, and impedance channels for the configured inputs are added.
D02225R04.00
RecordBase View User Manual
2-79
2 Graphing Records
2.17 COMTRADE Import
COMTRADE (Common Format for Transient Data Exchange) is an industry
standard record format used to share data between tools and to replay faults
through a test set. The import utility supports viewing of both ASCII and binary COMTRADE formats (1991 and 1999). When the COMTRADE file is imported into the RecordGraph, all its functionality can be seamlessly used to
analyze the record.
1. RecordGraph application must be running to access this facility. If not,
launch RecordGraph via TESLA Control Panel, RecordBase View or Windows Explorer.
2. Choose File>Import.
3. Browse to select desired file.
4. Double-click on the COMTRADE record to apply <Default> template or select it from the templates list box.
Import file
Figure 2.123: Import COMTRADE File
2-80
RecordBase View User Manual
D02225R04.00
2 Graphing Records
Choose COMTRADE File
Figure 2.124: Select COMTRADE File
Figure 2.125: Apply <Default> Template
D02225R04.00
RecordBase View User Manual
2-81
2 Graphing Records
2.18 Print Options
The following options are available:
• Print... – pops-up a print option dialogue box to select paper size, orientation and other options.
• PrintDirect – sends active view directly to the default printer.
• PrintAll – sends all the views directly to the default printer.
• Print Preview…– displays standard preview window.
2-82
RecordBase View User Manual
D02225R04.00
3 Record Export
The record export utility lets you convert records into a number of different
formats for use with other software tools.
COMTRADE
Common Format for Transient Data Exchange is an industry standard record
format used to share data between tools and to replay faults through a test set.
The export utility supports both ASCII and binary COMTRADE formats and
creates output that complies with the latest (1999) or older version (1991) of
the standard.
PTI
Power Technologies Incorporated produces widely used power system modelling tools. Records can be exported in a PTI-compliant format for import into
PTI tools. The export utility supports ASCII format and creates output that
complies with PTI version 1 or version 2 formats.
Excel (CSV)
Records can be exported in basic comma separated values (also known as comma-delimited) ASCII format suitable for importing into standard tools such as
Microsoft Excel.
All quantities are exported in secondary values.
D02225R04.00
RecordBase View User Manual
3-1
3 Record Export
3.1 Launch the Export Utility
To launch the export utility:
1. Double-click Recordings from the Main Menu.
2. Select a local record from the record list.
3. Select the Export button to launch the Export window.
4. Select the desired export output format and select OK.
Step 1: Double-click
Recordings from the
Main Menu
Step 2: Select a record
from the list.
Step 3: Click on the
Export button to
launch export window.
Step 4: Choose export
type and OK.
Figure 3.1: Select Export File Type
3-2
RecordBase View User Manual
D02225R04.00
3 Record Export
COMTRADE
Format
Figure 3.2: COMTRADE Settings
The COMTRADE format (IEEE C37.111) defines a common format for storing digital data records of transient and dynamic swing events.
COMTRADE export consists of up to four output files with the same base
name and different file extensions: configuration files (.cfg), header files
(.hdr), data files (.dat) and optional information files (.inf). COMTRADE export produces the configuration, header and data files.
With reference to “COMTRADE Settings” on page 3-3,
Table 3.1: COMTRADE Format
D02225R04.00
Name
Function
Export to.
The base file name and directory of the output files are set using
the Export to.. option.
By default the base filename is the same as the record you are
exporting.
You can edit this or use the Browse button to set a new directory
and/or base filename.
Station Name and
Identification
The Station Name and Identification fields are set by default using
the unit’s Station which are written as the first line in the.cfg output
file.
Header Text
The Header Text field contains the text written into the COMTRADE header (.hdr) file. By default, the field contains the Location, Name, Number and the Unit ID of the unit that produced the
record.
This text can be modified, deleted or extended as desired.
Version
The Version field lets you select the revision of COMTRADE
standard to produce. COMTRADE has been an evolving standard
and a number of changes have been made over the years.
1991 and 1999 COMTRADE versions are supported.
RecordBase View User Manual
3-3
3 Record Export
Table 3.1: COMTRADE Format
Format
The Format field specifies that the data in the COMTRADE file
(ASCII or BINARY format).
ASCII data has the advantage of being usable by simple text editor and spread sheet programs, but results in a significantly larger
record relative to binary format.
BINARY format is recommended if the software package you are
using for the data, supports binary format COMTRADE.
Selecting Channels
(Exported Channels)
You must select the channels from the record that you want to
include in the output file.
For convenience, the digital data recorded is classified into:
• High Speed (5760/sec): Analog and external digital input channels sampled at the high speed transient data rate.
• High Speed (480/sec): Analog and internal logic channels produced 8 times per cycle.
• Low Speed (60/sec): Analog input channels sampled at the low
speed swing data rate.
Select the desired channel from the list with a left-click.
Multiple channels can be selected using standard Windows selection actions (click + Ctrl or Shift keys).
Place selected channels in the Exported Channels list box.
>
Place all channels into the Exported Channels list box.
>>
Delete a channel from the Exported Channel list box.
<
Delete all channels from the Exported Channel list box.
<<
Offset negative
start times to begin at
zero
3-4
When checked, this option shifts the negative time to start from
zero.
RecordBase View User Manual
D02225R04.00
3 Record Export
PTI Format
Figure 3.3: PTI Settings
The PTI file format is used to import records into the Power Technologies Incorporated system modelling software.
Output File PTI export produces a single output file with an .asc extension.
Table 3.2: PTI Format
D02225R04.00
Name
Function
Export to..
The base filename and directory of the output files are set using the
Export to.. option.
By default the base filename is the same as the record you are
exporting.
You can edit this or use the Browse button to set a new directory and/
or base filename.
Station Name and
Identification
The Station Name field is set by default using the unit’s Station Name
setting. It is written as the first line after all the channel names. This
text can not be edited.
The Identification field is not written to the PTI output file.
Header Text
The Header Text field contains the text that is written as a single line
in the fourth line in the output file.
By default, the field contains the Location, Name, Number and Unit
ID of the recorder that produced the record.
This text can be modified, deleted or extended as desired.
Version
The Version field lets you select between PTI version 1 and version
2. Please refer to PTI documentation for details on the differences of
these versions.
Format Only ASCII format output files are available.
Format
ASCII is the only format option for PTI.
RecordBase View User Manual
3-5
3 Record Export
Table 3.2: PTI Format
Channel Selection
Use Channel Selection to select channels to export.
You must select the channels from the record that you want to
include in the output file.
For convenience, the digital data recorded is classified into:
• High Speed (5760/sec): Analog and external digital input channels
sampled at the high speed transient data rate.
• High Speed (480/sec): Analog and internal logic channels produced
8 times per cycle.
• Low Speed (60/sec): Analog input channels sampled at the low
speed swing data rate.
Select the desired channel from the list with a left-click.
Multiple channels can be selected using standard Windows selection
actions (click + Ctrl or Shift keys).
Place selected channels in the Exported Channels list box.
>
Place all channels into the Exported Channels list box.
>>
Delete a channel from the Exported Channel list box.
<
Delete all channels from the Exported Channel list box.
<<
When checked, this option shifts the negative time to start from zero.
Offset negative
start times to begin at
zero
3-6
RecordBase View User Manual
D02225R04.00
3 Record Export
Excel (CSV)
Format
Figure 3.4: Excel (CSV) Settings
The Excel CSV (Comma Separated Value) format is used to import records
into a Microsoft Excel spreadsheet. This format is also known as comma delimited ASCII and can generally be used by most programs that import data arrays.
Excel CSV export produces a single output file with a .csv extension, which is
recognized by Excel. Excel is automatically launched when you double-click
on file.
Table 3.3: Excel (CSV) Format
D02225R04.00
Name
Function
Export to..
The base filename and directory of the output files are set using the
Export to.. option.
By default the base filename is the same as the record you are
exporting.
You can edit this or use the Browse button to set a new directory
and/or base filename.
Station Name and Unit
ID
The Station Name and Identification fields are not written to the
Excel CSV format output file.
Header Text
There is no header text written to the Excel CSV format output file.
Version
There are no version options for the Excel CSV output.
Format
ASCII is the only format options for the Excel CSV output.
RecordBase View User Manual
3-7
3 Record Export
Table 3.3: Excel (CSV) Format
Channel Selection
Place selected channels in the Exported Channels list box.
>
Place all channels into the Exported Channels list box.
>>
Delete a channel from the Exported Channel list box.
<
Delete all channels from the Exported Channel list box.
<<
Offset negative
start times to begin at
zero
Exporting TPRO Through
Fault Events in
Excel (CSV)
Format
3-8
You must select the channels from the record that you want to
include in the output file.
For convenience, the digital data recorded is classified into:
• High Speed (5760/sec): Analog and external digital input channels
sampled at the high speed transient data rate.
• High Speed (480/sec): Analog and internal logic channels produced 8 times per cycle.
• Low Speed (60/sec): Analog input channels sampled at the low
speed swing data rate.
Select the desired channel from the list with a left-click. Multiple
channels can be selected using standard Windows selection actions
(click + Ctrl or Shift keys).
When checked, this option shifts the negative time to start from
zero.
Through fault event files (*.tpe) can be exported using Excel (CSV) format.
1. Open RecordBase View application and select a T-PRO event file as shown
below (if the event file does not exist in the database, you can simply click
on the "Add" button and select T-PRO event file to add it to the existing database).
RecordBase View User Manual
D02225R04.00
3 Record Export
Figure 3.5: RecordBase View main window with T-PRO Event records
2. Click on "Export" toolbar button which displays "Select export file type" dialog and select Excel (CSV) file type.
Figure 3.6: Export file type selection Excel (CSV) format
3. Once you select Excel (CSV) file export type, the following dialog will be
displayed to select the file name. Choose the desired location and file name
and click OK to export the event data.
D02225R04.00
RecordBase View User Manual
3-9
3 Record Export
Figure 3.7: File and Location selection through CSV Export settings
4. Double click on the exported Excel (CSV) file to view the events arranged
in descending order. A typical example of the csv file is depicted below.
Figure 3.8: Example of converted through fault events as depicted in Microsoft Excel
You can also export the event file using right context menu from the explorer
and follow Steps 2 and 3.
Note that selecting any export file other than the Excel (CSV) for TPRO event file will result in "No data was selected, nothing eas exported" dialog and the export process will be terminated.
3-10
RecordBase View User Manual
D02225R04.00
Index
Index
A
I
absolute time 2-18
active trace information 2-16
add 2-8
add analog graph 2-11
add digital graph 2-12
import 2-7
C
calculate derived channels now 2-23
calculated channels 2-72
change scale (Y axis) 2-22
change trace color 2-15
channel tool-tip 2-32
COMTRADE import 2-80
copy to clipboard 2-9
copy trace 2-13
copy trace data to clipboard 2-15
cross hair 2-17
launch RecordGraph
from RecordBase View 1-2
line 2-10
lock markers 2-25
M
delete 2-6, 2-8
delete all traces 2-15
delete graph 2-12
delete trace 2-14
markers 2-16, 2-17, 2-18, 2-65
measure
absolute time 2-67
fundamental RMS 2-68
harmonics 2-70
markers 2-65
primary 2-66
secondary 2-66
symmetrical components 2-71
true RMS 2-69
measure menus 2-16
measurements 2-65
menus 2-2
move 2-13
E
O
D
exit 2-7
export 2-6
COMTRADE 3-1, 3-3
Excel (CSV) 3-1, 3-7
launch 3-2
PTI 3-1, 3-5
exporting channel data 2-75
exporting views 2-74
extend print range 2-25
F
file menus 2-3
fundamental RMS 2-18
G
graph 2-32
adding 2-32
adding channels 2-32
copy to clipboard 2-74
keyboard functions 2-35
panning 2-35
save as meta file 2-75
time alignment 2-66
zooming 2-33
graph menus 2-11
H
harmonics 2-18
help menus 2-27
D02225R04.00
L
RecordBase View User Manual
options menus 2-23
P
paste ttrace 2-14
primary 2-17, 2-66
print 2-4
print all 2-5
print direct 2-5
print options 2-82
print preview 2-6
R
readouts 2-65
record
list 1-11
search 1-6
sort 1-6
summary 1-7, 1-11
record summary 2-77
RecordGraph
components 2-1
graphs 2-32
menus 2-2
tool bar buttons 2-28
rename tab 2-8
report 1-8
summary 1-11
reset zoom 2-21
I
Index
S
save as metafile 2-9
save template 2-3, 2-4, 2-5, 2-6
save template as 2-3
scale menus 2-19
secondary 2-18, 2-66
set graphs per page 2-11
set phase colors 2-26
set precision 2-26, 2-27
show channel list 2-10
show grid 2-23
show legends 2-24
show record summary 2-7
show trigger marker 2-24
show X axis ticks 2-23
system requirements
hardware vi-ix
operating system vi-ix
zoom X axis - 2-19
zoom X axis + 2-19
zoom Y axis - 2-20
zoom Y axis + 2-20
T
template manager 2-4
templates 2-57
create new 2-59
default 2-58
manager 2-60
managing 2-59
menus 2-60
multiple IED 2-62
single IED 2-61
tool tip 2-61
time alignment 2-18, 2-66
titles 2-9
graph 2-64
view 2-63
tool bar 2-10
tool bar buttons 2-28
true RMS 2-18
U
undo zoom 2-21
V
version descriptions v-vii
view 2-30
adding 2-30
deleting 2-30
differential 2-53
exporting 2-74
harmonic 2-40
impedance 2-41
overlay 2-38
renaming 2-31
symcom 2-39
timeline 2-37
trend 2-56
view menus 2-8
Z
zoom 2-33, 2-34
II
RecordBase View User Manual
D02225R04.00