1
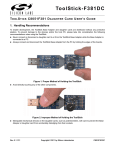
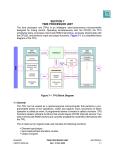
Lab 5: Debugging and More on Interrupts COEN-4720 Embedded Systems Cristinel Ababei and Nathan Zimmerman Dept. of Electrical and Computer Engineering, Marquette University 1. Objective The objective of this lab is to learn about the different features of the debugger of uVision. We’ll also reemphasize some aspects about interrupts. 2. uVision Debuger The ARM CoreSight technology [1] integrated into the ARM Cortex-M processor-based devices provides powerful debug and trace capabilities. It enables run-control to start and stop programs, breakpoints, memory access, and Flash programming. Features like PC sampling, data trace, exceptions including interrupts, and instrumentation trace are available in most devices. Devices integrate instruction trace using ETM, ETB, or MTB to enable analysis of the program execution. Refer to [1] for a complete overview of the debug and trace capabilities. MDK contains the μVision Debugger that connects to various Debug/Trace adapters, and allows you to program the Flash memory. It supports traditional features like simple and complex breakpoints, watch windows, and execution control. Using trace, additional features like event/exception viewers, logic analyzer, execution profiler, and code coverage are supported. The μVision Debugger is completely integrated into the μVision IDE. It provides many features, including the following [2]: --Disassembly of the code on C/C++ source- or assembly-level with program execution in various stepping modes and various view modes, like assembler, text, or mixed mode --Multiple breakpoint options including access and complex breakpoints --Review and modify memory, variable, and register values --List the program call tree including stack variables --Review the status of on-chip microcontroller peripherals --Debugging commands or C-like scripting functions --Code Coverage statistics for safety-critical application testing --Various analyzing tools to view statistics, record values of variables and peripheral I/O signals, and to display them on a time axis --Instruction Trace capabilities to view the history of executed instructions The μVision Debugger offers two operating modes: 1) Simulator Mode - configures the μVision Debugger as a software-only product that accurately simulates target systems including instructions and most on-chip peripherals (serial port, external I/O, timers, and interrupts; peripheral simulation capabilities vary depending on the device you have selected.). In this mode, you can test your application code before any hardware is available. It gives you serious benefits for rapid development of reliable embedded software. 2) Target Mode - connects the μVision Debugger to real hardware. Several target drivers are available that interface to a: -ULINK JTAG/OCDS Adapter that connects to on-chip debugging systems -Monitor that may be integrated with user hardware or that is available on many evaluation boards 1 -Emulator that connects to the microcontroller pins of the target hardware -In-System Debugger that is part of the user application program and provides basic test functions -ULINKPro Adapter a high-speed debug and trace unit connecting to on-chip debugging systems via JTAG/SWD/SWV, and offering Cortex-M3ETM Instruction Trace capabilities Debug Menu The Debug Menu of uVision IDE includes commands that start and stop a debug session, reset the CPU, run and halt the program, and single-step in high-level and assembly code. In addition, commands are available to manage breakpoints, view RTOS Kernel information, and invoke execution profiling. You can modify the memory map and manage debugger functions and settings. Note: In this lab we’ll only study the Simulator Mode of the debugger. Among the different ways of debugging the actual hardware target, one could use JTAG interface based debugging options. One such example include the use of the Keil ULINK2 Debug Adapter [3], which connects the PC’s USB port to the target system (via JTAG, SWD, or OCDS) and allows us to program and debug embedded programs on target hardware; with a JTAG speed up to 10MHz. The LandTiger 2.0 has a JTAG connector, and if you get your own ULINK2 Debug Adapter (you can also borrow one from your instructor), you are encouraged to study more debugging features on your own. If you do that, first, please read the Chapter titled “Debug Applications” from the uVision IDE Getting Started Guide [4]; this guide was included as file 7_mdk5_getting_started_YOU_SHOULD_READ_IT.pdf in the files archive of lab#2. This is optional for this lab. 3. Example1 – Blinky Revisited The files necessary for this example are located in example1/ folder as part of the downloadable archive for this lab. As mentioned earlier, the μVision Debugger can be configured as a Simulator or as a Target Debugger. In this example, we’ll use the Simulator. Go to the Debug tab of the Options for Target dialog to switch between the two debug modes and to configure each mode. Configure to Use Simulator. Before running the simulation, replace the following two lines inside blinky1.c: delay( 1 << 24 ); with: delay( 1 << 14 ); This is to make the blinking of P1.29 faster inside the simulator; otherwise, we’d need to wait too long to actually see the corresponding bit turning 1 or 0. Simulation Debug Use all the provided files under example1/ to create a new uVision project and Build it. 1. Click Debug menu option and select Start/Stop Debug Session. A warning about the fact that this is an evaluation version shows up; click OK. 2. Then, a new window appears where we can see the simulation of the program. 3. This window has several different supportive panels/sub-windows where we can monitor changes during the simulation. The left hand side panel, Registers, provides information regarding the Registers of LPC17xx with which we are working. 4. Again, click on the Debug menu option and select Run. The code starts simulating. 5. It is good practice that before going ahead with the actual hardware implementation to perform a debug/simulation session to make sure that our program behaves according to the design requirements. 2 6. 7. 8. 9. In our example, we use PORT2. Go to Peripherals menu option then select GPIO Fast Interface followed by Port 2. You should get the window that shows P2.1 blinking. Stop the simulation: Debug->Stop or hit the Stop icon from the Toolbar. Breakpoints 1. Let’s set two breakpoints on lines: LPC_GPIO2->FIOPIN |= 1 << 1; // make P2.1 high LPC_GPIO2->FIOPIN &= ~( 1 << 1 ); // make P2.1 low inside blinky1.c. To set a breakpoint, right-click on each of these lines, on the left margin of the panel that displays this file and then select Insert/Remove Breakpoint. 2. Go to Peripherals menu option then select GPIO Fast Interface followed by Port 2. 3. Debug->Run. Notice that the simulation starts and runs till the first breakpoint where it stops. Notice that P2.1 is 0. To continue the simulation click the icon “Step (F11)” once. What happens? P2.1 is turned 1 and we stepped with the simulation to the next instruction inside our program. 4. Step (F11) again more times. Observe what happens each time. While stepping inside the delay() function, observe the value of local variable “i” inside the panel labeled Call Stack + Locals on the bottom right side of the uVision IDE. Notice how “i” is incremented. To get out from within the delay() function click the icon “Step out (Ctrl-F11)”. 5. Once you get a hang of it, stop the simulation. Logic Analyzer The debugger includes a logic analyzer which allows us to study the relative timing of various signals and variable changes. It’s activated using the button in the debugger. Note that you can only use the logic analyzer when you’re running in the simulator, not on the board. The logic analyzer is mostly self-explanatory. Use the Setup button to add channels. You can use symbolic names such as FIO1PIN to determine what registers or variables to watch, and you can specify a mask value (which is ANDed with the contents of the register or variable) and a right shift value (which is applied after the AND operation). You can view the result as a numeric value (“analog”) or as a bit value. At any point you can stop the updating of the screen (and/or stop the simulation itself), and change the resolution to zoom in or out. You can also scroll forward and backward in time using the scrollbar below the logic analyzer window. There are also “prev” and “next” buttons to move quickly from one transition to another. 1. Open the Logic Analyzer by clicking the icon Analysis Windows->Logic Analyzer 2. Click Setup… in the new window of the logic analyzer. Then, click New (Insert) icon and type FIO2PIN. Type in 0x00000002 as “And Mask” and select Bit as the Display Type. 3. Go to Peripherals menu option then select GPIO Fast Interface followed by Port 2 to show the GPIO2 Fast Interface. 4. Run simulation and observe how the signal changes inside the Logic Analyzer window. 4. More on Interrupts The LPC1768 microprocessor can have many sources of interrupts. All the internal peripherals are capable of generating interrupts. The specific conditions that produce interrupts can be set individually for each peripheral. The individual interrupts can be enabled or disabled using a set of registers (think of memory locations in the “memory space”). 3 Selected GPIO pins can also be set to generate interrupts. For instance, the push-button marked INT0 on the LandTiger 2.0 board is connected to pin P2.10 of the LPC1768 microprocessor (see page 6 of the schematic diagram, provided as file 0_HY_LandTiger_SCH.pdf in the archive of lab#2). This pin can be a source of external interrupts to the MCU. The table below shows different functionalities that can be assigned to P2.10 pin (based on the information in the user manual, page 119). If you plan to use P2.10 as GPIO, then you should also enable this source of interrupt as described in section 9.5.6 of the LPC17xx user manual. Note that you can set the P2.10 pin to be sensitive to either the rising edge or the falling edge. More information on clearing the interrupt pending bit can be found in table 123 in section 9.5.6.10, page 147 of the user manual. To write an interrupt handler in C we need to describe/create a function with an appropriate name and it will automatically be used (it will be called automatically via the pointers stored inside the vector table). The name of this function consists of the prefix from the table below plus the keyword “Handler” appended to it (e.g., TIMER0_IRQHandler). --------------------------------------------------------------------------------------Int# Prefix Description --------------------------------------------------------------------------------------0 WDT_IRQ Watchdog timer 1 TIMER0_IRQ Timer 0 2 TIMER1_IRQ Timer 1 3 TIMER2_IRQ Timer 2 4 TIMER3_IRQ Timer 3 5 UART0_IRQ UART 0 6 UART1_IRQ UART 1 7 UART2_IRQ UART 2 8 UART3_IRQ UART 3 9 PWM1_IRQ PWM 1 (not used on MCB1700) 10 I2C0_IRQ I2C 0 (not used on MCB1700) 11 I2C1_IRQ I2C 1 (not used on MCB1700) 12 I2C2_IRQ I2C 2 (not used on MCB1700) 13 SPI_IRQ SPI (used for communicating with LCD display) 14 SSP0_IRQ SSP 0 (not used on MCB1700) 15 SSP1_IRQ SSP 1 (not used on MCB1700) 16 PLL0_IRQ PLL 0 (interrupts not used by our labs) 17 RTC_IRQ Real-time clock 18 EINT0_IRQ External interrupt 0 19 EINT1_IRQ External interrupt 1 (not used on MCB1700) 20 EINT2_IRQ External interrupt 2 (not used on MCB1700) 21 EINT3_IRQ External interrupt 3 (not used on MCB1700) & GPIO interrupt 22 ADC_IRQ ADC end of conversion 23 BOD_IRQ Brown-out detected (not used) 4 24 USB_IRQ USB 25 CAN_IRQ CAN 26 DMA_IRQ DMA 27 I2S_IRQ I2S (not used on MCB1700) 28 ENET_IRQ Ethernet 29 RIT_IRQ Repetitive-interrupt timer 30 MCPWM_IRQ Motor control PWM 31 QEI_IRQ Quadrature encoder 32 PLL1_IRQ USB phase-locked loop 33 USBActivity_IRQ USB activity 34 CANActivity_IRQ CAN activity --------------------------------------------------------------------------------------- A particular peripheral can generate its interrupts for a variety of reasons, which are configured within that peripheral. For example, timers can be configured to generate interrupts either on match or on capture. The priorities of the interrupts can be set individually. See sections 6.5.11 to 6.5.19 of the user manual for details. A set of functions is available for enabling and disabling specific interrupts, setting their priority, and controlling their pending status (find them inside core_cm3.h file, which is the so called CMSIS Cortex-M3 Core Peripheral Access Layer Header File): void NVIC_EnableIRQ(IRQn_Type IRQn) void NVIC_DisableIRQ(IRQn_Type IRQn) void NVIC_SetPriority(IRQn_Type IRQn, int32_t priority) uint32_t NVIC_GetPriority(IRQn_Type IRQn) void NVIC_SetPendingIRQ(IRQn_Type IRQn) void NVIC_ClearPendingIRQ(IRQn_Type IRQn) IRQn_Type NVIC_GetPendingIRQ(IRQn_Type IRQn) The IRQn names are just the prefix from the table above with an “n” appended (e.g., TIME0_IRQn). We can also enable or disable interrupts altogether using __disable_irq() and __enable_irq(). We can also trigger any interrupt in software (inside our C programs) by writing the interrupt number to the NVIC->STIR register (values up to 111 are permitted). We must clear interrupt conditions in the interrupt handler. This is done in different ways, depending on what caused the interrupt. For example, if we have INT0 configured to generate an interrupt, you would clear it by setting the low-order bit of the LPC_SC>EXTINT register. For detailed descriptions of all interrupts, you should read Chapter 6 of the NXP LPC17xxx User Manual. 5. Example2 – Blink LED using Timer 0 Interrupt The files necessary for this example are located in example2/ folder as part of the downloadable archive for this lab. Use all the provided files to create a new uVision project and then Build and Flash->Download it. Observe operation and comment. Please read the source code to understand how it works; it contains lots of comments. 5 6. Example 3 – Drawing circles on the 240x320 pixels LCD display of the LandTiger 2.0 board You are given two versions of this example: Version 1 files are located in lab5_circles1 and Version 2 files are located in lab5_circles2. Both versions do the same thing: plot randomly sized circles at random locations and of random colors on the 240x320 LCD display of the board. Create two different uVision projects for each version of this example. Build and download each of the projects. Observe their operation. You should observe a simplified (in that circles are not filled) operation as shown in Fig.1. Figure 1 Drawing filled circles on the LCD display of the LandTiger 2.0 board. Read and compare the source code from main_circles1.c and main_circles2.c. Which version do you think is better and why? Is there anything that you would change to make this example more efficient? 7. Lab Assignment You must implement required programming assignment and also answer the questions. Description of your programming solutions as well as answers to the questions below must be included in the lab report. a) Lab5 programming assignment 1. Write a program that uses the LCD screen to display a smiley face in the center of the screen. In your program, you should use the Timer 0 Interrupt to trigger the change of color for the smiley face every other second or so. The smiley face’s color should alternate between yellow and red. The size of the face should be approximately the size of a dime. The background can be any other color different from yellow and red. Hint: Start with modifying any of the projects from Example 3 above. This example has already functions for drawing empty circles and lines. I have included 6 already place holders for functions that you would need to describe/write (inside GLCD.c and GLCD.h). Then, you also need only to implement the logic of the main program by changing the main() function. The Timer 0 interrupt is already set up in the Example 3. 2. Demonstrate to the TA setting a breakpoint and viewing the value of a variable. 3. Use Timer 0 as well to measure the time it took to draw your smiley face. Read the count register before and after your draw command. Display the time it took to draw your smiley face in milliseconds on the LCD. b) Lab 5 questions 1. Using a debugger and breakpoints is incredibly useful for tracking down problems. However, breakpoints freeze a programs execution which can be problematic for some type of programs. Give an example of a real world embedded c program in which using breakpoints would not be practical/safe. Give an alternative solution to using break points. 2. What was the frames per second (FPS) of the smiley face that you drew? How would you improve the FPS? 3. Assume the LandTiger display has a resolution of 320 by 240 pixels. Assume display uses 16 bit color. Assume the display is connected with an 8 bit bus. Assume our processor clock speed is at maximum. Assume our processor can write 8 bits in 1 clock cycle. Optimistically, what would be the maximum FPS that our processor could achieve on the screen? Would this be fast enough to display a movie that appears in real time to the human eye? 8. Credits and references [1] ARM CoreSight technology; http://www2.keil.com/coresight/ [2] uVision IDE and Debugger; http://www.keil.com/uvision/debug.asp [3] Keil ULINK2 Debug Adapter (costs about $150 if purchased from ARM or about $20 if purchased elsewhere); --http://www.keil.com/ulink2/ --http://www.hotmcu.com/ulink2-debug-adapter-with-usb-interface-p-9.html?cPath=3_25 --http://www.amazon.com/ULINK2-Emulator-Original-FirmwareSupport/dp/B00MFY27QO/ref=sr_1_fkmr0_3?ie=UTF8&qid=1407427505&sr=8-3fkmr0&keywords=ULINK2+Debug+Adapter [4] Keil ARM, Getting Started, Creating Applications with μVision; http://www2.keil.com/docs/default-source/default-document-library/mdk5-getting-started.pdf?sfvrsn=0 7