1
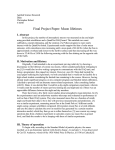
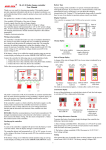
SLAC-TN-03-004
August 15, 2003
CRAnE: A JAS-based Data Acquisition System for
Cosmic Rays*
Jennifer Docktor, Manuel Reyes,
Tom Glanzman, Willy Langeveld
Stanford Linear Accelerator Center
Stanford University
Stanford, CA
ABSTRACT
Cosmic Ray Analysis Environment (CRAnE) is a software tool designed to
collect and plot data from a cosmic ray telescope (CRT) connected to a computer
serial port. As a plugin to Java Analysis Studio (JAS), CRAnE provides visual
displays of incoming cosmic ray rates as they are detected. In an effort to make
the program user-friendly, it operates through a graphical user interface. This
paper describes the features of CRAnE and includes installation and operation
instructions in the appended user’s manual.
*
Work supported in part by the Department of Energy contract DE-AC03-76SF00515
1. Introduction
1.1
HISTORY
In the 1990’s efforts were started to design and build a simple and inexpensive cosmic
ray detector apparatus for use by high school physics teachers. The first such devices were
manufactured from materials commonly available at accelerator laboratories, and they were
simple and safe enough to be used in the classroom setting.
One program that became involved in building cosmic ray detectors is QuarkNet, which
is based at Fermi National Accelerator Laboratory (Fermilab) [1]. The QuarkNet project is an
endeavor supported by the National Science Foundation and the U.S. Department of Energy to
educate high school students and teachers about high-energy physics and involve them in
research [2].
The Stanford Linear Accelerator Center (SLAC) hosted a QuarkNet workshop from June
19 to July 3, 2003, during which high school science teachers met with the goal of integrating the
experience they received at SLAC into their science courses. Throughout one week of the
workshop the QuarkNet participants helped to build ten cosmic ray telescopes (CRTs) that will
be used to conduct experiments in their classrooms. A photograph of a completed CRT is shown
in Figure 1.
1.2
COSMIC RAYS
The CRT devices are capable of detecting secondary subatomic particles such as muons,
the charged decay products of pions which are produced when high-energy protons from outer
space collide with air molecules in the Earth’s upper atmosphere and create an air shower [3].
The origin of these high-energy primary cosmic ray protons is not fully understood, but the
prevailing theory suggests they are accelerated in the magnetic fields surrounding supernova
remnants [4]. Muons in particular reach the Earth’s surface because they can penetrate large
amounts of matter without interacting, and have a sufficiently long lifetime.
2. Cosmic Ray Telescope (CRT)
In the present design the SLAC QuarkNet CRTs are constructed from scintillators,
photomultiplier tubes (PMTs), high voltage converters, and a QuarkNet coincidence logic
board [5]. The scintillator plastic produces a small flash of light when a charged particle passes
through it. Each scintillator panel is connected to a photomultiplier tube by a polished Lucite
“light guide” bonded at each end with optical glue, and this segment of the CRT is wrapped in
several layers of opaque materials for light shielding [6]. The PMTs convert light pulses into
amplified electrical pulses, which are transmitted to the logic board. Attached to each PMT is a
base, which converts low voltage (5VDC) from the logic board to high voltage for the PMT.
The logic board has four input channels to receive electrical signals from the PMT base
circuit. These signals are processed and sent to a serial port for communication with a computer.
The logic board has the ability to either interpret single pulses from each individual PMT as
triggering events or to interpret a coincidence between multiple incoming signals as a triggering
event. It also has built-in temperature and pressure sensors that can send readings to the serial
port upon request. In addition, the logic board has the ability to receive absolute time
information from a GPS unit.
Each CRT consists of two scintillator-PMT-base “paddles” held some fixed distance
apart on a rotatable arm of ABS plastic affixed to a plastic post supported by a wooden base, as
shown in Figure 1. The paddles are aligned to generate coincident triggering events when a
cosmic ray passes through them. A principal classroom experiment with a CRT involves
measuring the angular distribution of the cosmic ray flux through the paddles.
3. Cosmic Ray Analysis Environment (CRAnE)
3.1
INTRODUCTION
For the purposes of using these CRTs in the classroom, it is necessary for the data
received from the detectors to be translated into a more manageable and accessible format. To
this specific end, we designed a computer program called Cosmic Ray Analysis Environment
(CRAnE) that acts as a plug-in to Java Analysis Studio (JAS) [7], a data analysis package
developed within the high-energy physics community. CRAnE reads the serial port output of the
detectors, collects relevant information, and saves it as a computer file. The program also
maintains a plot of incoming cosmic ray rates in real-time.
3.2
FEATURES
CRAnE provides a simple method of configuring and running an experiment with the
CRT (see Figure 2). It allows the user to start and stop data collection upon request, specify a
location for the stored data file, specify a serial port, select the logic board channels in use, and
set the time interval over which to bin data. Once the data acquisition process has begun,
CRAnE reads the data stream from the serial port, selects the data corresponding to cosmic ray
events, and displays the data in graphical form.
In version 1.0 the program creates two graphs in real-time that analyze the data received
from the detector. The first graph displays the observed cosmic ray rate vs. time. The second
graph is a histogram of time intervals between consecutive cosmic ray events (see Figure 3). In
the interest of preserving data for future analysis, CRAnE saves the raw information received
from the logic board to a file along with the computer clock time in milliseconds from the start of
the data acquisition period.
4. VERSION 1.0 NOTES
In version 1.0 of CRAnE, the time processed for a cosmic ray event is the internal clock
time of the computer. Future versions of CRAnE could acquire a more precise time of data
acquisition from the GPS unit in conjunction with the internal clock time of the board. In
addition, version 1.0 is compatible with logic board firmware dated 6/27/03. Firmware output
formats are subject to change with each new version.
CRAnE software will be distributed on CDs and packaged with the CRTs, and it will also
be available on the Internet for download. The CRTs will be distributed to various involved
schools and travel between classrooms in the near future, on their quest educate students and
teachers about cosmic rays and delve deeper into understanding the mysteries of the cosmos.
5. Acknowledgments
We thank the U.S. Department of Energy, the Office of Science, and the SULI program
for the opportunity to participate in this research internship. We acknowledge Tony Johnson and
Max Turri for their help with Java Analysis Studio.
REFERENCES
[1]
“QuarkNet”, May 13, 2002 http://quarknet.fnal.gov
[2]
T. Glanzman, “QuarkNet”, January.20, 2003 http://www.slac.stanford.edu/quarknet/
[3]
I. Semeniuk, “Astronomy’ s Phantom Foul Balls: Ultrahigh-Energy Cosmic Rays”, Sky
& Telescope, March 2003
[4]
W. Langeveld, “High Energy Cosmic Rays from Supernovae”, July 8, 2002
http://www2.slac.stanford.edu/vvc/cosmicrays/crsuper.html
[5]
D. Balick, “QuarkNet Cosmic Ray Detection System Manual”, Fermi National
Accelerator Laboratory, July 2001
[6]
E. Harpell, W. Langeveld, D. McShurley, S. Shapiro, J. Venuti, “The CRT: an
inexpensive cosmic ray muon detector”, Stanford Linear Accelerator Center SLAC-TN95-1, 1995
[7]
T. Johnson, “Java Analysis Studio”, Oct. 29, 2001 http://jas.freehep.org
FIGURES:
Figure 1: Photograph of a CRT setup
Figure 2: Screen shot of CRAnE
Figure 3: Examples of the graphs produced by CRAnE
Written by Manuel Reyes and Jennifer Docktor
under the direction of Tom Glanzman and Willy Langeveld.
Stanford Linear Accelerator Center, Stanford University
August 2003 (Version 1.0)
Table of Contents
I. Introduction ................................................................. 3
II. Installation .................................................................. 3
A. Installing Java and JAS3 ................................ 3
B. Installing CRAnE ............................................ 4
III. Operation................................................................... 4
A. Configuration Settings .................................... 4
i. Serial Port ........................................... 5
ii. Channel Selection................................ 5
iii. Bin size ................................................ 5
iv. File Name ............................................ 6
B. Collecting Data................................................. 6
C. Graph Options ................................................. 7
i. Plot Display Options ............................ 7
ii. Saving a Plot Image ............................ 8
D. File Saving ........................................................ 8
2
I. Introduction
Welcome to the Cosmic Ray Analysis Environment (CRAnE) User’ s Manual!
CRAnE is a software tool developed for use with the cosmic ray telescope (CRT). It is a plug-in
to Java Analysis Studio (JAS), a data analysis system developed at SLAC for use in high energy
physics. This plugin extends the operation of JAS to include cosmic ray data acquisition.
This manual provides detailed information on the installation and operation of CRAnE.
Installation examples are specific to the Windows environment.
II. Installation
A. Installing Java and JAS3
Step 1:
• Go to the website http://java.sun.com and click on the J2SE link.
• Click on the J2SE Downloads tab.
• Click on the J2SE 1.4.1 link.
• Download the J2SE v 1.4.1_0x JRE for your computer’ s operating system.
• Follow the instructions to install the Java run-time environment.
Step 2:
• Go back to the website http://java.sun.com and click on the Downloads link.
• Under the J2SE heading browse the drop-down list for Java Communications API (JCA)
2.0 and click to select it. Press Go.
• Follow the instructions to download.
• Unzip the file to some location on your computer.
• Copy the file win32com.dll from the commapi folder to the JRE bin directory (this is
probably found in a location such as C:\Program Files\Java\j2re1.4.1_0x\bin).
• Copy the file comm.jar from the commapi folder to the JRE lib directory.
• Copy the javax.comm.properties file to the JRE lib directory.
Step 3:
• Go to the website http://jas.freehep.org/ and click the JAS3 link.
• Click the Download link.
• Follow instructions to download JAS3.
Step 4:
• Find the jas.ini (“ Configuration Settings” ) file in the JAS3 folder (this is probably
found in a location such as C:\Program Files\JAS3\jas.ini).
• Open the file. After the last line of text in the file, enter a new line starting with the
capital letter “ C” followed by the file path of the comm.jar file copied in Step 2 (i.e.,
3
enter a new line that says Cc:\Program Files\Java\j2re1.4.1_0x\lib\comm.jar if
comm.jar is located at c:\Program Files\Java\j2re1.4.1_0x\lib\comm.jar). Save
the changes made to the file.
B. Installing CRAnE
•
•
Go to the CRAnE website http://www.slac.stanford.edu/quarknet/crane and follow
the downloading instructions or insert the CRAnE CD.
Move the crane.jar file to the extensions folder for JAS3 (this is probably found
in a location such as C:\Program Files\JAS3\extensions).
III. Operation
A. Configuration Settings
To begin using CRAnE, open JAS and click on the CRAnE tab to activate the CRAnE main
window.
Double check the following in your set-up:
• The photomultiplier tube bases are switched on (check the yellow LED lights)
• The RS-232 serial port connector ribbon cable is plugged in to the logic board and a
serial port of the computer.
• All other cables are correctly connected.
4
• The GPS must remain connected to the logic board at all times.
Click the “ Set Configuration” button on the CRAnE main window to begin. The following
window will pop up:
i. Serial Port
The first item on the configuration settings popup window is a drop-down box to select
the serial port name. The selected item displayed in the text field should correspond to
the place that the RS-232 serial port connector ribbon cable is affixed to the computer.
Choices are determined by the serial ports available on the computer itself, and may vary
from machine to machine. Some examples include COM1, COM2, etc. The default
setting for this feature is the first item from the list.
ii. Channel Selection
The next item on the configuration settings popup window is a set of checkboxes to select
the active channels. The selected item(s) should correspond to the channel(s) connected
to the logic board. The channels are numbered 1-4 such that when the channels are
closest to you, channel 1 is on the left and channel 4 is on the right. Selecting any
number of channels will require that all those channels fire in coincidence in order to
trigger an event. Any deselected channels will be disabled. The present model of the
CRT only has two paddles, so selecting more than two channels at a time will not
produce any data. The default setting for this feature is channels 1 and 2 selected.
iii. Bin size
Another item on the configuration settings popup window is a text field for the bin size in
integer minutes. This sets the time interval in minutes over which to collect data for the
plot of counts-per-minute detected over time. For example, a bin size of 5 minutes will
5
collect data for 5 minutes and compute and plot the average number of events per minute
during this time interval. A new data point or bar is added to the count plot after a bin
size time interval passes. The default setting for this text field is 1 minute, meaning that
the graph refreshes with the newly added counts every minute.
iv. File Name
The final item on the configuration settings popup window is a text field for the file
name. This represents the location to which the data processed by the program is saved
for future reference. CRAnE will only function properly if there is a valid entry in this
text field; a file by the given name must not already exist and the directory in which the
file is to be created must already exist. The default setting is a file located in the user’ s
home directory named with the current date followed by “ Cosmic Data” , an index, and
the suffix “ .txt” . For more information refer to section D: File Saving.
B. Collecting Data
Start/Stop Data Collection
Once the configurations have been set, press the “ OK” button in the Configuration
Settings window. Do not close the window by clicking the “ X” in the upper corner;
doing so will not enable the “ Start Data Collection” button.
Press the “ Start Data Collection” button. Two graphs should open which will update as
the logic board receives signals:
6
Upon completion of data collection, press the “ Stop Data Collection” button.
C. Graph Options
i. Plot Display Options
Once data collection has ceased, the plot display can be edited from options in JAS.
Right click on the plot area for a list of available options, as shown in the following
illustration:
7
For example, you could deselect the histogram bars and show the data as points and/or
lines, toggle the error bars, display statistics, modify the axes, disable the suppression of
zeros, change the color scheme, print, etc. Right click on the title area for a list of options
for the title space.
The “ Print” function of the options list is identical to the “ Print” option from the File
menu. To view and/or change the printer settings click File on the menu bar and select
“ Print Setup” .
The “ Copy plot” item on the options list allows you to copy the graph image and paste it
as a picture into another environment, such as Microsoft Word.
ii. Saving a plot image
The “ Save Plot As” selection on the options list produces a window requesting the file
save location for the plot. The default format is .cmg (Computer Graphics Metafile) but
this can be changed to more familiar formats such as .gif or .jpg from the drop-down
list.
D. File Saving
For each cosmic ray event observed, CRAnE writes two pieces of information to the save file.
The main component is the raw data from the logic board preserved in its original format. The
other component is the time in milliseconds from the beginning of data collection that a cosmic
ray event was processed by CRAnE. This time is annexed to the logic board data line of the
corresponding event.
8