1
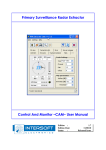
Radar Interface Module - RIM782
User Manual
Edition: 002
Date: 26-Mar-10
Status: Released Issue
Radar Interface Module - RIM782
Edition Date: 26-Mar-10
DOCUMENT CHARACTERISTICS
General
Radar Interface Module - RIM782
User Manual
Edition:
002
Edition Date:
26-March-2010
Status:
Released Issue
Keywords:
User manual, RIM782, Radar Interface Module
Abstract:
This user manual describes the use of the RIM782.
Contact Information
Author:
Elke Vanuytven
Editor:
Elke Vanuytven
Contact Person:
Niels Van Hoef
Tel:
+32 14 23 18 11
E-mail Address:
[email protected]
Document Control Information
Document Name:
IE-UM-00168-003 RIM782 User Manual.odt
Path:
C:\Documents and Settings\elke\Desktop\RASS-S User
Manuals\RIM782\
Host System:
Mac OS X 10.6.1
Software:
OpenOffice.org 3.1.1
Size:
4 600 040Bytes
IE-UM-00168-003 RIM782 User Manual.odt
2/53
Radar Interface Module - RIM782
Edition Date: 26-Mar-10
DOCUMENT CHANGE RECORD
Revision
Date
Reasons for change
Pages
Affected
Approved
by
001
13-Oct-09
New Document
All
EV
002
9-Nov-09
Minor changes during review
18, 21
NVH
003
26-Mar-10
Data recording section added
39-47
EV
IE-UM-00168-003 RIM782 User Manual.odt
3/53
Radar Interface Module - RIM782
Edition Date: 26-Mar-10
TABLE OF CONTENTS
1. TECHNICAL MANUAL RIM782.....................................................................................10
1.1. General Introduction.........................................................................................................................10
1.2. Hardware Description.......................................................................................................................11
1.2.1. Block Diagram.............................................................................................................................11
1.2.2. Connectors..................................................................................................................................11
1.2.2.1. Video Board.............................................................................................................................12
1.2.2.2. USB Data Recorder (UDR)......................................................................................................13
1.2.2.3. Global Positioning System (GPS450)......................................................................................16
2. DOWNLINK MEASUREMENT...........................................................................................17
2.1. Theory................................................................................................................................................17
2.2. Software.............................................................................................................................................17
2.2.1. Getting Started............................................................................................................................17
2.2.2. Making a Recording....................................................................................................................18
2.2.3. Analysis.......................................................................................................................................20
2.2.4. View HPD Logfiles......................................................................................................................20
2.2.5. User Defined OTD Limits............................................................................................................22
3. SECTORIAL VIDEO RECORDING.....................................................................................24
3.1. Theory................................................................................................................................................24
3.2. Software.............................................................................................................................................24
3.2.1. Getting Started............................................................................................................................24
3.2.2. Making a Recording....................................................................................................................25
3.2.3. Advanced Settings......................................................................................................................26
3.2.3.1. Graph Palette: Zoom/Select function.......................................................................................26
3.2.3.2. General Settings......................................................................................................................27
3.2.3.3. Display Settings.......................................................................................................................28
3.3. Analysis: Sectorial SSR Video Viewer............................................................................................29
3.3.1. Introduction.................................................................................................................................29
3.3.2. Getting Started............................................................................................................................29
3.3.3. Sectorial Video Viewer................................................................................................................30
3.3.4. Advanced Settings......................................................................................................................31
3.3.5. Different Viewing Modes/Processing/Analysis Methods.............................................................32
3.3.5.1. X Window – X Video View/Y Video View.................................................................................32
3.3.5.2. X Window – Interrogation View................................................................................................33
3.3.5.3. Y Window – Y Video View........................................................................................................33
3.3.5.4. Y Window- Reply View.............................................................................................................34
4. SECTORIAL EXTRACTOR..............................................................................................35
4.1. Theory................................................................................................................................................35
4.2. Software.............................................................................................................................................35
4.2.1. Getting Started............................................................................................................................35
IE-UM-00168-003 RIM782 User Manual.odt
4/53
Radar Interface Module - RIM782
Edition Date: 26-Mar-10
4.2.2. Sectorial Extractor Software.......................................................................................................36
5. DATA RECORDING USING THE RIM782..........................................................................39
5.1. Introduction.......................................................................................................................................39
5.2. Recording Software..........................................................................................................................39
5.2.1. Getting Started............................................................................................................................39
5.2.2. Making a Recording....................................................................................................................40
5.3. Conversion Software........................................................................................................................42
5.3.1. Convert Bit Recording.................................................................................................................42
5.3.1.1. Single Conversion....................................................................................................................43
5.3.1.2. Batch Conversion....................................................................................................................45
5.3.2. Convert Data Recording.............................................................................................................46
5.3.2.1. Single Conversion....................................................................................................................46
5.3.2.2. Batch Conversion....................................................................................................................47
6. DATA ANALYSIS.........................................................................................................47
7. ANNEXES.................................................................................................................48
7.1. Annex 1: Critical Parameters of SSR Antennas.............................................................................48
7.2. Annex 2: Downlink Connection Diagram........................................................................................49
7.3. Annex 3: Sectorial Video Recording Connection Diagram...........................................................50
7.4. Annex 4: Sectorial Video Mode-S Recording Connection Diagram..............................................51
7.5. Annex 5: RIM782 Data Recording Connection Diagram................................................................52
7.6. Annex 6: Configuration List: RIM782..............................................................................................53
IE-UM-00168-003 RIM782 User Manual.odt
5/53
Radar Interface Module - RIM782
Edition Date: 26-Mar-10
TABLE OF FIGURES
Figure 1: Block Diagram RIM782.................................................................................................................11
Figure 2: Rear panel RIM782 – Video Board connectors..........................................................................12
Figure 3: Rear panel RIM782 – UDR connectors........................................................................................14
Figure 4: Downlink software........................................................................................................................17
Figure 5: Load Receiver calibration file window........................................................................................18
Figure 6: Scope Window..............................................................................................................................18
Figure 7: Downlink example of Didactical Test Interrogator....................................................................19
Figure 8: Downlink HPD example................................................................................................................20
Figure 9: Layer tabs and selectors.............................................................................................................21
Figure 10: Antenna diagram data in TAB-separated file...........................................................................21
Figure 11: Calculate OTD Parameters window...........................................................................................22
Figure 12: OTD Definition File.....................................................................................................................22
Figure 13: Make Default File checkbox.......................................................................................................22
Figure 14: Sectorial Video Recorder software...........................................................................................24
Figure 15: Sector settings...........................................................................................................................25
Figure 16: Recording settings.....................................................................................................................25
Figure 17: Example sectorial recording of scenario.................................................................................26
Figure 18: General Settings window...........................................................................................................27
Figure 19: Display Settings window...........................................................................................................28
Figure 20: Sectorial Video Viewer - example..............................................................................................30
Figure 21: X Video View...............................................................................................................................32
Figure 22: Y Video View in X window..........................................................................................................32
Figure 23: Interrogation View......................................................................................................................33
Figure 24: Y Video Display...........................................................................................................................33
Figure 25: Reply data extracted from video...............................................................................................34
Figure 26: Sectorial Extractor software......................................................................................................36
Figure 27: Source Folder Info......................................................................................................................36
Figure 28: Destination Folder Info..............................................................................................................37
Figure 29: Load Rx Calibration File window..............................................................................................37
Figure 30: Preview Window.........................................................................................................................38
Figure 31: Converting Sectorial Recording to Pulses...............................................................................38
Figure 32: UDR Control software................................................................................................................39
Figure 33: UDR Control software................................................................................................................40
Figure 34: UDR Recording...........................................................................................................................42
Figure 35: Convert Bit Recording software................................................................................................43
Figure 36: PPI Display..................................................................................................................................44
Figure 37: Hexadecimal display of converted data...................................................................................45
Figure 38: Batch Process section of Convert software............................................................................45
Figure 39: Convert Radar Data software....................................................................................................46
Figure 40: Hexadecimal display of converted data...................................................................................47
Figure 41: Downlink Connection Diagram.................................................................................................49
Figure 42: Sectorial Video Recording Connection Diagram.....................................................................50
Figure 43: Sectorial Video Mode-S Recording Connection Diagram.......................................................51
Figure 44: RIM782 Data Recording Connection Diagram.........................................................................52
IE-UM-00168-003 RIM782 User Manual.odt
6/53
Radar Interface Module - RIM782
Edition Date: 26-Mar-10
TABLE OF TABLES
Table 1: Video Board Connectors...............................................................................................................12
Table 2: Differential ACP/ARP DB9 connectors pin layout.......................................................................12
Table 3: RASS DB15HD connector pin layout............................................................................................13
Table 4: UDR Connectors............................................................................................................................14
Table 5: Serial Data 1/2 DB15 connectors pin layout................................................................................15
Table 6: RS 232 C Receivers (compatible with RS232C standard)...........................................................15
Table 7: RS 232 C Drivers (compatible with RS232C standard)...............................................................15
Table 8: RS422 Receivers (compatible with RS422 standard)..................................................................15
Table 9: RS422 Drivers (compatible with RS422 standard)......................................................................15
Table 10: GPS Connectors...........................................................................................................................16
Table 11: Zoom/select functions sector recording....................................................................................26
IE-UM-00168-003 RIM782 User Manual.odt
7/53
Radar Interface Module - RIM782
Edition Date: 26-Mar-10
CONVENTIONS USED
G
Note: This icon to the left of bold italicized text denotes a note, which alerts you to
important information.
%
Caution: This icon to the left of bold italicized text denotes a caution, which alerts you to
the possibility of data loss or a system crash.
M
Warning: This icon to the left of bold italicized text denotes a warning, which alerts you to t
he possibility of damage to you or your equipment.
IE-UM-00168-003 RIM782 User Manual.odt
8/53
Radar Interface Module - RIM782
Edition Date: 26-Mar-10
GLOSSARY OF TERMS
ACP
ARP
ATC
CPU
CW
dB
Downlink
FRUIT
GPS
HPD
IE
IF
I/O
LAN
LVA
Monopulse
MSSR
OTD
Plot extractor
PPI
PRF
PSR
Radar
Radome
RASS-R
RASS-S
RF
RTQC
RX
SLS
SSR
STC
Uplink
Azimuth Change Pulse
Azimuth Reference Pulse
Air Traffic Control
Computer Processing Unit
Continuous wave
Decibel
The signal path from aircraft to ground
False Replies Unsynchronized In Time, unwanted SSR replies
received by an interrogator which have been triggered by other
interrogators
Global Positioning System
Horizontal Polar Diagram
Intersoft Electronics
Intermediate Frequency
Input/Output
Local Area Network
Large Vertical Aperture (antenna)
Radar-receiving processing technique used to provide a precise
bearing measurement
Monopulse Secondary Surveillance Radar
Out of Tolerance Detection
Signal-processing equipment which converts receiver video into
digital target reports suitable for transmission by land lines
Plan Position Indicator
Pulse Repetition Frequency
Primary Surveillance Radar
Radio Detection And Ranging
Radio-transparent window used to protect an antenna principally
against the effects of weather
Radar Analysis Support Systems – Real-time measurements
Radar Analysis Support Systems – Site measurements
Radio Frequency
Real Time Quality Control
Receiver
Side Lobe Suppression, a technique to avoid eliciting transponder
replies in response to interrogations transmitted via antenna
sidelobes
Secondary Surveillance Radar
Sensitivity Time Control
Ground-to-air signal path
IE-UM-00168-003 RIM782 User Manual.odt
9/53
Radar Interface Module - RIM782
Edition Date: 26-Mar-10
1. TECHNICAL MANUAL RIM782
1.1. General Introduction
The Radar Interface Module RIM782 can be divided in two parallel running systems: data recorder and
video recorder. The RIM782 contains all the necessary hardware to digitize the radar video and/or data, and
provide this data to the PC over a standard USB interface.
The video recorder functionality of the hardware interface is performed by 6 video channels, 2 trigger signals
and 2 rotation interfaces (ARP-ACP signals both single ended and differential). The RIM782 can sample 2
analog video inputs simultaneously. The digitized video will be sent over a USB connection to a PC (USB
Video) and can be used in several RASS-S applications. For instance, the RIM782 can record all types of
SSR or Mode S radar video signals using the sectorial recording software.
The data recorder has two bidirectional digital RS232/RS422 synchronous serial data ports for inputting or
outputting serial data. The RIM782 can both record and replay data. If more than two channels are required,
multiple RIM782s can be "stacked" (or combined with a RDR803). The additional inputs azimuth and time
(GPS450) make it a real radar evaluation tool.
IE-UM-00168-003 RIM782 User Manual.odt
10/53
Radar Interface Module - RIM782
Edition Date: 26-Mar-10
1.2. Hardware Description
1.2.1.
Block Diagram
Figure 1: Block Diagram RIM782
1.2.2.
Connectors
Based on the functioning, we can split up the RIM782 in 3 main parts:
• The video recorder functionality or Video Board
• The data recorder functionality or simply USB Data Recorder (UDR)
• The GPS connection
The different connectors are described in the next paragraphs, according to their functionality as explained
above.
IE-UM-00168-003 RIM782 User Manual.odt
11/53
Radar Interface Module - RIM782
Edition Date: 26-Mar-10
1.2.2.1. Video Board
The Video Board in the RIM782 has 6 analogue video signal inputs. These are suitable for PSR video
signals, SSR video signals and weather radar video signals. The connectors are described in the following
table:
Table 1: Video Board Connectors
Name
Specification
Connector Type
Value
Ch1/2/3/4 Video
Video input
4x BNC
-2V, +2V, 10kΩ
I/Q Video
I/Q input
2x BNC
-2V, +2V, 10kΩ
ACP1/2 , ARP1/2
Single ended ACP or ARP input
2x BNC
TTL
Differential ACP1/2 , ARP1/2
Differential ACP/ARP input
2x DB-9 female
TTL
Trigger 1/2
Trigger input
2x BNC
TTL
RASS
Input: Mode-S Clock, Mode-S
Data, trigger
Output: ACP, ARP, event, trigger
DB15HD female
TTL
USB Video
USB Video
USB
USB2.0
The separate USB video connector is intended for dedicated video stream bandwidth. The above listed
connectors correspond to the following parts of the rear panel :
Figure 2: Rear panel RIM782 – Video Board connectors
The pin layout of the differential ACP/ARP DB9 connectors is shown in the table below:
Table 2: Differential ACP/ARP DB9 connectors pin layout
Name
DB9(f) on RIM782
NC (not connected)
1
ACP +
2
NC
3
ACP -
4
NC
5
ARP +
6
NC
7
ARP -
8
NC
9
IE-UM-00168-003 RIM782 User Manual.odt
12/53
Radar Interface Module - RIM782
Edition Date: 26-Mar-10
The pin layout of the RASS DB15HD connector is shown in the table below:
Table 3: RASS DB15HD connector pin layout
Name
DB15HD(f) on RIM782
RASS ARP (output)
(red connector on Intersoft DB15HD male cable to 5xBNC)
1
RASS ACP (output)
(green connector on Intersoft DB15HD male cable to 5xBNC)
2
RASS PPS (output)
(blue connector on Intersoft DB15HD male cable to 5xBNC)
3
Reserved for future use
4
Reserved for future use
5
GND
6
GND
7
GND
8
-12V
9
GND
10
Reserved for future use
11
RASS Mode-S data (input)
12
RASS Trigger (output)
(grey connector on Intersoft DB15HD male cable to 5xBNC)
13
RASS Trigger (input)
(black connector on Intersoft DB15HD male cable to 5xBNC)
14
RASS Mode-S Clock (input)
15
1.2.2.2. USB Data Recorder (UDR)
The RIM782 has 2 serial communication channels for active and passive recording. They can handle
transmission speeds up to 128 Kb/s. Two electrical standards are supported: RS232 (single ended) and
RS422 (differential). The serial data is fed to the recorder using a female DB15 connectors (alike X.21
connections) on the rear panel of the RIM782. The unit is supplied with 2 RS232 Probe modules for
connection of the DB15 to DB25 standard RS232 connection. A whole range of synchronous protocols is
supported and others can be programmed upon request.
The following passive protocols (up to 128k) can be handled by the RIM782:
• HDLC: Passive recording of HDLC bases protocols, including Lap-B and X25.3 Passive monitoring.
(E.g. ASTERIX, RDIF)
• LINK 1: Passive recording of Military LINK 1 protocol
• SYNC 13: Passive recording of most bit protocols as implemented on US radars (CD1, CD2, ASR9,
etc...)
• Aircat 500: passive recording of Thales specific protocol
• TVT2 military protocol
• EV760 protocol
• Output U-HDLC and bit protocols
• Bit Recording Protocols (9600 BAUD):
IE-UM-00168-003 RIM782 User Manual.odt
13/53
Radar Interface Module - RIM782
◦
◦
◦
◦
◦
◦
◦
◦
◦
◦
◦
Edition Date: 26-Mar-10
AIRCAT 500
ALENIA
AUSTRO
BMIL
ERICSSON
EUROCONTROL
FPS 117
HUGHES
SVE
TOSHIBA
CUSTOMER SPECIFIC
As mentioned above, the UDR in the RIM782 has 2 serial synchronous ports. They can be used either as
input or output. The connectors are described in the following table:
Table 4: UDR Connectors
Connector Type Value
Name
Specification
Serial Data 1/2
Serial Data 1/2
2x DB15 female
Synchronous serial input
RS232/RS422
USB Data
USB data
USB
USB2.0
The above listed connectors correspond to the following parts of the rear panel :
Figure 3: Rear panel RIM782 – UDR connectors
Radar data passed over LAN (TCP, UDP) will be fed directly into the PC via the Ethernet adapter, without the
need of the RIM782.
IE-UM-00168-003 RIM782 User Manual.odt
14/53
Radar Interface Module - RIM782
Edition Date: 26-Mar-10
The pin layout of the Serial Data 1/2 DB15 connectors is shown in the table below:
Table 5: Serial Data 1/2 DB15 connectors pin layout
Name
DB9(f) on RIM782
Gnd
1,8
TxD+
9
TxD-
2
RxD+
11
RxD-
4
RxC+
13
RxC-
6
TrxC+
14
TrxC-
7
TxC+
/
TxC-
/
-10Volt
12
+10Volt
5
+5Volt (USB4.2V)
15
The specifications of the serial inputs/outputs are listed in the following tables:
Input resistance
Table 6: RS 232 C Receivers (compatible with RS232C standard)
3kΩ min. , 5kΩ typ. , 7kΩ max.
Low threshold
1.2V typ. , 0.8 min.
High threshold
1.7V typ. , 3.0 max.
Impedance
5kΩ typ. (+15V to -15V)
Table 7: RS 232 C Drivers (compatible with RS232C standard)
High Level Output
+5V min. , +15V max.
Low Level Output
-15V min. , -5V max.
Short Circuit Current
± 100mA
Power off Impedance
300Ω
Slew Rate RL=3K, CL=50pF
30V/µs
Table 8: RS422 Receivers (compatible with RS422 standard)
Input resistance common mode
15kΩ typ. (-7 to +12V)
Receiver sensitivity
± 0.2V typ.
Common mode range
-7.0V min. , +7.0V max.
Table 9: RS422 Drivers (compatible with RS422 standard)
Short Circuit Current
150mA
Transition Time
40ns max. (10-90%)
Output Current
28mA min. (RL=54Ω)
IE-UM-00168-003 RIM782 User Manual.odt
15/53
Radar Interface Module - RIM782
Edition Date: 26-Mar-10
1.2.2.3. Global Positioning System (GPS450)
Intersoft Electronics’ GPS450 can be connected to the RIM782 so that the recordings made will be UTC time
stamped. There is one GPS450 connector on the rear panel foreseen:
Name
Specification
GPS450
GPS
Table 10: GPS Connectors
Connector Type Value
RJ45
Intersoft proprietary
The GPS data is distributed to the UVR and UDR sections of the RIM782.
IE-UM-00168-003 RIM782 User Manual.odt
16/53
Radar Interface Module - RIM782
Edition Date: 26-Mar-10
2. DOWNLINK MEASUREMENT
2.1. Theory
The Downlink measurement enables the user to measure the HPD antenna pattern at reception. It uses the
Radar Interface Module to sample the video level signals of the input channels. The measurement uses a
sampling window which is selected by the user. In this sampling window, the software determines the mean
amplitude of the CW signal (or synchronous pulses) received from the uplink (field) setup. The sampling
window can be shown at all times, continuously updated with the sampled data.
The measured amplitudes are then converted to the received RF power at coupler level, using the receiver
calibration file. The receiver calibration file is a table describing the radar receiver output voltage vs. the RF
input power, and needs to be measured before the downlink measurement can be performed.
2.2. Software
2.2.1.
G
Getting Started
Note: First of all make sure the receiver calibration file is available in the active campaign
folder. After the receiver calibration was performed with the RFA641, the file should be
copied to the computer used for the downlink measurement. It must be present in the
(M)SSR\CALIB subdirectory of the selected campaign folder.
Once it is sure the calibration file is present, the RFA641 can be packed for the field setup to be prepared at
the uplink site. The RFA641 field set-up is explained in the RFA641 User Manual. Make the RIM782
Downlink connections as shown in the connection diagram (Annex 7.2. ).
The RASS-M Downlink application can be loaded using the Downlink
button on the RASS-S Toolbox.
Figure 4: Downlink software
IE-UM-00168-003 RIM782 User Manual.odt
17/53
Radar Interface Module - RIM782
2.2.2.
Edition Date: 26-Mar-10
Making a Recording
1. The first step is to load the receiver calibration file (which can be created using the RFA641, this
calibration is described in the RFA641 User Manual). Click the Load Rx Calibration Table
button to be able to select the correct calibration file.
Figure 5: Load Receiver calibration file window
The calibration file is used to convert the measured voltages to the received RF power at coupler
level. When the user chooses not to select a Rx Calibration File, the default curve will be used.
Select Done to return to the main Downlink window or cancel to return without making changes.
2. Click the Scope Preview
measurement window.
button to open the Scope window allowing you to select the
Figure 6: Scope Window
3. Select the preferred trigger method.
4. Set the cursors of the measurement window outside the STC period and within the range (as shown
in figure 6). The HPD signals in the polar diagram of the main downlink window are updated
automatically each time a cursor is moved. The mean value between the cursors will be calculated
and used for the measurement.
5. Set the parameters on the front panel according to the radar type and connections.
6. Before logging the measurement data, you can enter some comments in the Info field. These
IE-UM-00168-003 RIM782 User Manual.odt
18/53
Radar Interface Module - RIM782
Edition Date: 26-Mar-10
comments are stored with each scan, so in case you make changes between successive ARPs, the
new info entered is stored together with the recorded HPDs. E.g. if the recording is intended for a 3D
measurement, the beam elevation can be entered.
7. Depending on the Absolute/Relative switch, the graph is shown in an absolute dBm scale or a
relative dB scale.
8. Verify normal operation of the measurement:
◦
ACPR should correspond to the number of ACPS according to the resolution of the encoder.
◦
IPR indicates the number of interrogations per revolution.
9. Now set-up the RFA641 as CW source (both set-up and software are described in the RFA641
user manual but will be described briefly in this paragraph as well). The set-up of the RFA641 is also
shown in the Downlink set-up (annex 7.2. ). When the RFA641 is set-up, open the Uplink software
program and switch the running tool to Transmit mode. The HPD Preferences window will open
automatically, change the Tx type to CW and click OK. As soon as the CW signal is available, the
downlink antenna diagram will be visible in the polar diagram on the front panel.
10. The HPD signals are shown in the polar diagram. The antenna diagram window should be at the
noise level of the receiver as long as no signal is sent from the uplink side. The two (or single)
channel(s) to be recorded can be selected with the parameters on the Downlink front: Σ, Δ, Ω, are
respectively shown in red, blue and green.
Figure 7: Downlink example of Didactical Test Interrogator
IE-UM-00168-003 RIM782 User Manual.odt
19/53
Radar Interface Module - RIM782
Edition Date: 26-Mar-10
11. Start recording using the Record
button.
12. When the recording is stopped (Stop
button) a dialog box will pop up to select a logging file. The
software will suggest a default file name (Downlink-yyyymmdd-time). One can also save the data to
file using the Save
button.
2.2.3.
Analysis
2.2.4.
View HPD Logfiles
To view the measured antenna diagrams, RASS-S contains a universal tool, called View HPD Logging. The
program is capable of reading, recognizing and displaying Uplink and Downlink HPD logfiles of both (M)SSR
and PSR measurements.
1. Open the View HPD Logfiles program from the Downlink button on the RASS-S toolbox.
2. Use the Load
button to select a downlink logfile, select the file of interest and click the OK
button. The selected file will be displayed in the active layer and its file name will be presented in the
Layer info sub-window, the date and time of the recording is shown and diagram parameters of the
selected logging are displayed.
Figure 8: Downlink HPD example
IE-UM-00168-003 RIM782 User Manual.odt
20/53
Radar Interface Module - RIM782
Edition Date: 26-Mar-10
3. It is possible to overlay antenna diagrams for comparison in up to five layers: Select a layer by
clicking on a layer tab. The View HPD Logfiles program allows to overlay up to 5 layers. Each of the
layers can be temporarily hidden. This is done by means of the check box selectors to select the
displaying of the curves. The Empty
button allows clearing the active layer. It is even possible to
superimpose SSR Uplink, SSR Downlink, PSR Uplink or PSR Downlink curves on top of each other.
Any combination is possible.
Figure 9: Layer tabs and selectors
4. Click the OTD
Return
button to calculate the OTD parameters. The OTD window will appear. Click the
button after inspection. In case you have antenna diagram data available in a TAB-
separated file, the Import
function can be used to load this file type into the selected layer. The
software expects a diagram defined in four columns: Azimuth [deg], Sum [dB], Delta [dB], SLS [dB].
The data points must be defined equidistant in azimuth.
Figure 10: Antenna diagram data in TAB-separated file
5. An existing logfile might consist of multiple measurements, from which you may want to select the
best ones to be kept in a separate logfile. This operation can easily be performed using the Save
button. Select the diagram you want to transfer to a new or existing logfile using the standard
procedure. (Start program and select a curve with the Index control.) Use the Save button to evoke
the Log panel. If no logfile has been selected yet: Open an existing logfile with the Open logfile
button or create a new logfile with the New Logfile button. In both cases a file dialog will appear.
The name of the newly selected logfile will be indicated in the Current Logfile string indicator. Use
the Add logging button to add the current data.
If a logfile has already been selected: In this case the logfile string indicates the selected file name.
Use the Add Logging button to append the current data to the logfile. Use the Cancel button to
cancel the operation.
6. If you recorded multiple HPD diagrams from different elevations, you can stack these on top of each
other and create VPD diagrams or 3D diagrams using the following buttons: 3D
and VPD
is also possible to view the data in a polar view mode by clicking the Polar View
display the layers in polar mode.
button to
. It
7. The HPD data can be exported using the Export
button. This will evoke a save file dialog,
pointing to the “Exports” subdirectory of the active campaign folder. The resulting file consists of a
text file containing a table. This table is TAB separated and can be imported by any Spreadsheet
program. The file consists of four columns: Azimuth [deg]; Sum Amplitude [dB]; Delta Amplitude [dB];
SLS Amplitude [dB]. The numerical data is converted in a string format with a 3-digit precision.
IE-UM-00168-003 RIM782 User Manual.odt
21/53
Radar Interface Module - RIM782
2.2.5.
Edition Date: 26-Mar-10
User Defined OTD Limits
The OTD Limits section displays the OTD Limits applied to the calculated antenna parameters, the OTD
section can be called using the OTD
button. Whenever the program is called, it will first read the limits
from an OTD Definition file. The OTD error messages will be displayed accordingly.
Figure 11: Calculate OTD Parameters window
OTD Definition files are present in the GENERAL\OTD subdirectory of the CAMPAIGN directory. Currently
the file ‘EC.OTD’ is the only file available. This file contains the EC defined parameter limits according to the
description in Annex 1: Critical Parameters of SSR Antennas.
The loaded OTD definition file is indicated on the program front panel.
Figure 12: OTD Definition File
The user can change any of these parameters and save the set of limits to a new file in order to create a new
OTD definition file. This can be done by clicking the Save
definition file, click the Load
button. In case you want to change the OTD
button.
In some cases you might want to set your OTD definition as default calculation. Check the Make Default file
checkbox upon closing the OTD program, the active OTD definition file will be set as the default file to be
loaded whenever the OTD program is called.
Figure 13: Make Default File checkbox
IE-UM-00168-003 RIM782 User Manual.odt
22/53
Radar Interface Module - RIM782
Edition Date: 26-Mar-10
The following list describes the OTD limits that can be set by the user. Please note that all limits are defined
as relative to the SUM/PSR max power level.
1. SUM/PSR 3dB Beamwidth Min, Max [deg]: Allowed min. and max. for the 3dB beam width
2. SUM/PSR 10dB Beamwidth Min, Max[deg]: Allowed min. and max. for the 10dB beam width
3. Sum/PSR Max sidelobe level [dB(m)]: Allowed max. for the Sum/PSR max. Sidelobe level.
4. Sum/PSR Max Backlobe level [dB(m)]: Allowed max. for the Sum/PSR Backlobe level.
5. Omega Notch Depth [dB(m)]: Allowed max. for the Omega Notch Depth.
6. Sum, Omega Crossovers: Power [dB] min, max: Allowed range for the crossover level.
7. Delta Az [deg] Max: Allowed max. azimuth difference for the crossovers to be recognized as
symmetrical.
8. Delta Notch Depth [dB(m)]: Allowed max. for the Delta Notch Depth.
9. Sum, Delta Crossovers
10. Power [dB] Min, Max: Allowed range for the crossover level
11. Azimuth [deg]: Allowed max. azimuth for the crossover position.
12. Delta Az. [deg] Max: Allowed max. azimuth difference for the crossovers to be recognized as
symmetrical.
For each of the limits defined the corresponding parameter is checked. In case the calculated antenna
parameter is outside the set limits an error message is created in the OTD Error Messages window. This
contains the statements that the parameters are outside specification and displays the parameters result and
the set limits. In case of punch-throughs, a list of the punch-throughs is created indicating level and azimuth
of each punch-through.
Using the Export
separated file.
button you can export the OTD parameters, limits and error messages to a tab-
IE-UM-00168-003 RIM782 User Manual.odt
23/53
Radar Interface Module - RIM782
Edition Date: 26-Mar-10
3. SECTORIAL VIDEO RECORDING
3.1. Theory
The Sectorial Video Recorder is based on the RIM782 hardware and introduces a new revolution in radar
video recording. Previous recording tools had either the disadvantage of being limited in range/azimuth
(RASS-S windowed recording) or were difficult to setup and limited to MSSR video pulses (RASS-S pulse
recording). The sectorial video recorder will combine the advantages of the RASS-S window based recording
as well as pulse recording into one single tool. Because of the high data throughput required for this
recording, we can no longer support the RVRxxx plus RVI299 hardware for the sectorial video recording. The
sectorial video recorder has been designed to create highly detailed video recordings, unlimited in both
range as azimuth.
3.2. Software
3.2.1.
Getting Started
The Sectorial Video Recorder tool can be opened from the Video
button on the RASS-S toolbox.
Figure 14: Sectorial Video Recorder software
Create the set-up shown in Annex 3: Sectorial Video Recording Connection Diagram.
IE-UM-00168-003 RIM782 User Manual.odt
24/53
Radar Interface Module - RIM782
3.2.2.
Edition Date: 26-Mar-10
Making a Recording
1. When the Select folder button
is clicked the user will be prompted to select a folder which will
contain the sectorial recording. By default the folder Campaign\VIDEO\SECTOR will be selected.
The user is encouraged to create a new folder for each recording.
%
Caution: If an existing folder is selected the previous recording will be overwritten. A
warning will be issued to make sure this does not happen accidentally.
2. With the Sector Settings the user can select a part of a scan to reduce the amount of disk space
needed for the recording. The window width can be set between 0deg and 360deg and largely
depends on the throughput capability to the PC hard disk and processing power of the computer
used. A 360 degree window will result in a continuous 32MB/sec data stream to disk.
Figure 15: Sector settings
3. Using the Record Settings the user can control the amount and size of the files used during a
recording. The Recording Size control controls the amount of disk space that will be allocated for
this recording. The recording will be chopped into smaller pieces; the size of the pieces can be set
with the Chunk Size control.
Figure 16: Recording settings
4. The recording is started by clicking the Record
button. Clicking it again or clicking the Stop
button will halt the recording. If the allocated space is full the recording will stop automatically.
IE-UM-00168-003 RIM782 User Manual.odt
25/53
Radar Interface Module - RIM782
Edition Date: 26-Mar-10
Figure 17: Example sectorial recording of scenario
3.2.3.
Advanced Settings
3.2.3.1. Graph Palette: Zoom/Select function
The graph palette can be found in the right bottom corner of the main window and is used to zoom in or
select a part of the data. The following buttons are available:
Table 11: Zoom/select functions sector recording
Button
Usage
Pan
Switch the display to pan mode, use the cursor to move the display area around
Select
Switch the display to select mode, use the cursor to select targets
RBL
Enables the Range Bearing Line on the display
Erase all
Clear all display data
Zoom
Switch the display to Zoom mode, use the cursor to zoom into areas of interest
Zoom out
Zoom out progressively until maximum viewing area is visible
Zoom in
Zoom in progressively until maximum zoom (highest level of detail) is reached
Home
Switch back to default zoom (-500) and center (or press the home button)
IE-UM-00168-003 RIM782 User Manual.odt
26/53
Radar Interface Module - RIM782
Edition Date: 26-Mar-10
3.2.3.2. General Settings
The General Settings window can be opened by pressing the Settings
general tab using the General
button and selecting the
button on the left.
Figure 18: General Settings window
The left part of the General Settings tab contains the most frequently used settings and therefore has been
repeated on the sectorial video recorder main window.
G
Note: In order for changes to take effect, the Apply or OK button in the settings window
needs to be pressed.
If the Apply button is pressed the changes will be saved and the General Settings window remains open. In
this case one can return to the main window using the OK button or by closing the window. If the OK button
is pressed the changes will be applied and the General Settings window will close. In case no changes need
to be made, one can close the General Settings window by pressing the Cancel button or closing the
window.
In the right part of the General Settings you can control the recorder settings and the data source selection:
1. Recorder Settings: The Recorder Settings control which video input(s), encoder (ACP/ARP) input
and trigger input are sampled and recorded. The video input selected for Analog 1 will be displayed.
If only one video input is selected for recording, it will be sampled at 16MSPS. If two video inputs are
selected, they will be recorded at 8MSPS.
2. Data Source Selection: This optional setting allows the user to connect to any DHM session running
on the local network. The DHM session should be configured to have a digital D6 output. Refer to
the RASS-R user manual on the Data Handler Module (DHM) for more details on this.
IE-UM-00168-003 RIM782 User Manual.odt
27/53
Radar Interface Module - RIM782
Edition Date: 26-Mar-10
3.2.3.3. Display Settings
The Display Settings window can be opened by pressing the Settings
tab using the Display
button and selecting the Display
button on the left.
Figure 19: Display Settings window
The settings on the left control the video layer display. The following video settings can be set:
• Video color: The video color graph allows you to set different colors for different voltages being
sampled and displayed. Sliding the values up and down will change them, clicking the color boxes
allows the user to change the color. A new level can be dragged out of the color ramp as well.
• Brightness: The brightness knob will determine the intensity of which the different levels are
displayed.
• Interpolate: The interpolate check box allows the user to switch between discrete voltage levels or a
more gradual color ramp.
• Video fading: The video fading control allows you to have a fading effect on the video being
displayed.
• Digital trailing: The digital trailing control allows you to set a number of scans that the digital data will
remain on the display.
• Display range: The display range control limits the amount of data drawn on the PPI display.
G
Note: The Display Range control will not limit the data range in the recordings. All sector
recordings will cover full range!
The center part settings control the optional digital part of the display. In order to have digital data present on
the display the user needs to connect to a DHM session having a D6 digital output running. This can either
be on the local computer or any other computer on the network.
• Digital label: The digital label settings allow the user to control which digital information is displayed.
Optionally font, font size and rotation can be changed.
• Digital symbols: Digital symbols control how a specific target is displayed. Both symbol and color can
be changed.
The right part of the Display Settings controls some more general display settings.
• Rings & Spokes: control the amount of rings and spokes drawn on the display, and the color of the
rings and spokes.
• Visible: The visible check boxes control which data is drawn on the display. This way some parts of
data can be temporarily disabled.
IE-UM-00168-003 RIM782 User Manual.odt
28/53
Radar Interface Module - RIM782
•
Edition Date: 26-Mar-10
Sector Indicator: This control allows setting the width of the sector indicator.
3.3. Analysis: Sectorial SSR Video Viewer
3.3.1.
Introduction
This user manual describes the functionality of the Sectorial Viewer program. The sectorial video viewer
provides a detailed view of the video inputs and timing signals recorded with the Sectorial Video Recorder.
The benefit of the Sectorial Video Recording is that (with the exception of the sector selection in azimuth) it
does a continuous recording of all selected input data.
Where the Sectorial Video Recorder displays the data in a PPI window for basic viewing during the
recording, the Sectorial Viewer is more analysis oriented and therefore provides an XY view of the video
data. The following data is shown:
• Video Display: consists of a Range-Azimuth view of the selected video signal, which is displayed in
an intensity graph. The range reference is selectable from different interrogation types as found in
the recording.
• Timing: The interrogation signal (trigger) is analyzed during an indexing stage and processed in
order to detect the known interrogation modes according to Annex 10 timing. The different modes
are categorized and provide a range reference selection for the video display. The Interrogation View
window displays the timing of the detected interrogations. Obviously the ARP/ACP timing is used to
calculate azimuths.
• X View/Y View: An X View and a Y view window are available to view the video signal as it is
sampled, sliced at the position of the Video Display cursor either in X or Y direction.
• Reply Info: The video data is decoded into A/C/S replies. The detected replies are then linked to the
corresponding interrogation. This information is displayed in the Reply window in textual format.
3.3.2.
Getting Started
The Sectorial Video Viewer tool can be opened from the Video
is called View Sector Recording in the list).
IE-UM-00168-003 RIM782 User Manual.odt
button on the RASS-S toolbox (the tool
29/53
Radar Interface Module - RIM782
Edition Date: 26-Mar-10
Figure 20: Sectorial Video Viewer - example
3.3.3.
Sectorial Video Viewer
1. Click the Select Folder
button to select a folder which contains the sectorial recording.
2. Click the Automatic Indexing
button to start the indexing process. This process decodes all
recorded interrogations and creates an interrogation index file. Since it has to page through the
complete recording it can take up to 10% of the recording time. If no indexing was performed before
this process will start automatically. The user can abort the indexing using the Stop button, but only
the revolutions that were processed can be viewed then.
The indexer runs detached. As soon as the first scan is processed, the user can start analyzing the
data. Once indexing is done the video display will show the data of the first scan, relative to the
default range reference.
3. When the file is loaded, the Video Window controls determine the section of the data to be
displayed. The video data which is shown in the graph is decimated to minimize memory
requirements upon loading the file. Full resolution is achieved by zooming in or adjusting the window
size.
4. Next to the window size controls you can find the properties of the recording:
◦ Recording info (user comments)
◦ Scan # (default at 0)
◦ Recording Scan #
◦ Time of recording
◦ Start and Stop Azimuth
◦ ACPR
IE-UM-00168-003 RIM782 User Manual.odt
30/53
Radar Interface Module - RIM782
3.3.4.
Edition Date: 26-Mar-10
Advanced Settings
1. Color Map Control: The Video Display shows the video data in a Range (Y) – Azimuth(X) intensity
graph. The Z scale represents the signal voltage and the color mapping is selectable using the color
map control. The horizontal scale is always Azimuth in degrees; the vertical scale is Range,
selectable in µs or Nm.
2. Channel Selector: Upon loading the data file the viewer reads the properties of the recording. The
channel selector will indicate the names of the channels selected in the recording. The example in
this case has two channels; the Ch1 Video is currently being displayed.
3. Range Reference Control: The Range Reference control sets the reference timing for both the
video window and the interrogation window.
The timing can be set relative to A/C interrogations, All Call interrogations, Roll Call interrogations or
all of the above. In case the user selects ‘Roll Call’, the S-Address Filter needs to be filled. The
software will only display the data with the corresponding S-Address. To view all data, one should fill
in “FFFFFF” as S-Address.
4. Display Cursor: The data available at the cursor is also shown into separate graphs as Voltage vs
Azimuth (X View) or Voltage vs Time (Y View) (explained more thoroughly in the next section). The
cursor displays shows the numerical Azimuth, Range and Voltage values at the cursor position. The
lock next to the cursor display allows locking the X position of the cursor to the interrogation selected
in the Interrogation window.
IE-UM-00168-003 RIM782 User Manual.odt
31/53
Radar Interface Module - RIM782
3.3.5.
G
Edition Date: 26-Mar-10
Different Viewing Modes/Processing/Analysis Methods
General Note: Please note that the X scale can be locked to the X/Y scale of the Video
Display.
3.3.5.1. X Window – X Video View/Y Video View
The X/Y Video viewing mode is determined by the Slow Time Display Mode Selector:
In X/Y Video view the data can be viewed in two ways:
•
X Video: A horizontal data slice is shown of the video signal available at the Y cursor position of the
Video Display cursor. This is normally used to view SUM and DELTA modulation of the replies (or
SUM/OBA).
Figure 21: X Video View
•
Y Video: A vertical data slice at the Video Display X cursor position is taken and displayed. This
allows you to view the sampled data in oscilloscope view.
Figure 22: Y Video View in X window
When the Receiver Calibration Table
is loaded, the data can be shown in absolute power (dBm).
IE-UM-00168-003 RIM782 User Manual.odt
32/53
Radar Interface Module - RIM782
Edition Date: 26-Mar-10
3.3.5.2. X Window – Interrogation View
Set the Slow Time Display Mode selector in Interrogations mode to view the interrogations vs. azimuth:
Figure 23: Interrogation View
In this viewing mode the interrogation trigger is classified according to the graph legend.
The cursor allows viewing the data of a specific interrogation. This textual data of the interrogation is visible
as part of the Y View Reply/Interrogations window and as a label on the cursor (see figure above).
3.3.5.3. Y Window – Y Video View
The Y Window has two video modes. Select the Y Video option of the Fast Time Display Mode selector.
This mode allows the user to view the video data at the X cursor position of the Video Display cursor.
Figure 24: Y Video Display
IE-UM-00168-003 RIM782 User Manual.odt
33/53
Radar Interface Module - RIM782
Edition Date: 26-Mar-10
3.3.5.4. Y Window- Reply View
The Y Video window also allows viewing the reply data extracted from the video pulses, when the Slow
Time Display Mode selector is switched to the Replies option.
To decode the reply correctly one needs to:
• Zoom in on the reply which you want to decode; only the part which is inside the window (zoomed-in
area) will be decoded. This means that in the case of a Mode S reply, the entire reply needs to be
encapsulated in the window.
• Place the Y cursor before the reply which you want to be decoded (below the reply).
• Place the X position cursor: The software will decode the reply at the X-position, therefore by moving
the X cursor you can decode the entire reply. Each time the X cursor is moved, you will see that the
information in the Reply Display is updated.
The Reply Display gives 3 types of information for the reply selected with the cursor in the video window:
• Interrogation detail
• Reply detail
• Datalink detail (if applicable)
Figure 25: Reply data extracted from video
IE-UM-00168-003 RIM782 User Manual.odt
34/53
Radar Interface Module - RIM782
Edition Date: 26-Mar-10
4. SECTORIAL EXTRACTOR
4.1. Theory
The Sectorial Extractor is used to convert a Sectorial Recording to the RASS-S Video Pulse format.
With the introduction of the RIM782 the concept of video recording has changed drastically. The Sectorial
Recording provides continuous sampling of the connected video and timing channels in order to provide full
range, full revolution recording of radar video and timing, and this without performing any thresholding or
data reduction.
The previous generation of RASS-S video recorders were limited in capability due to the technologies
available at that time. The only method of performing full range, full revolution recording of radar video and
timing, was by performing pulse detection and only log the most important pulse characteristics. The
resulting recording is a .pls video recording containing the detected pulses.
A lot of RASS-S Analysis tools are based on the pulse recording. In order to be able to use these well known
tools on the Sectorial Recording, a convert function was needed to convert the Sectorial Recording into a
Video Pulse Recording file.
The Sectorial Extractor provides a (user-selectable) threshold and performs the video pulse detection in
software. It saves the resulting pulses to a .pls video pulse file.
4.2. Software
4.2.1.
Getting Started
The Sectorial Extractor provides the basic selection for the source folder containing the Sectorial Recording,
the destination folder that will contain the .pls video pulse file, and optionally it is possible to select a Rx
Calibration file to allow selection of the threshold level at a specific Rx input level in dBm.
The Preview window provides a scope view of the recorded video channels, and is used to set the threshold
level. It is possible to page through scans/interrogations and view the sampled video signals.
Once all selections are made the conversion can be started. The progress indicator gives detailed info on the
conversion progress and the size of the resulting pulse file.
The Sectorial Extractor tool can be opened from the Video
IE-UM-00168-003 RIM782 User Manual.odt
button on the RASS-S toolbox.
35/53
Radar Interface Module - RIM782
Edition Date: 26-Mar-10
Figure 26: Sectorial Extractor software
4.2.2.
Sectorial Extractor Software
1. First select a folder containing a sectorial recording using the Select Source Folder
button. The
folder contents will be checked and you will be prompted if no valid sectorial recording can be found
in the selected folder. The file info of the selected recording is shown.
Figure 27: Source Folder Info
IE-UM-00168-003 RIM782 User Manual.odt
36/53
Radar Interface Module - RIM782
M
Edition Date: 26-Mar-10
Warning: It is important to select a full revolution recording as source for a convert to
pulses.
2. Before a convert can be started, a destination folder must be created or selected (loaded) using the
Select Destination Folder
button.
Figure 28: Destination Folder Info
3. Load the Rx Calibration File using the Select Rx Calibration File
button: The calibration file is
used to convert the measured amplitudes to the received RF power at coupler level. When the user
chooses not to select an Rx Calibration File, the default curve will be used. If no Rx Calibration is
selected, the preview window will only allow you to set the threshold level in V. Select Done to return
to the Sectorial Extractor window.
Figure 29: Load Rx Calibration File window
4. Open the Preview Window using the Scope Preview
button. In the preview window the user
sets the threshold level used for the conversion to pulses. The threshold level can be set by using
the slider at the right of the video graph or by entering the value in the Threshold control. The unit is
selectable in V or dBm.
The preview is scan and interrogation based. When first opened it uses the first scan available in the
recording and parses the data for interrogations. The interrogations are used as reference to display
the video versus time [µs] or range [Nm].
Using the navigation buttons from the toolbar, it is possible to view the video data at successive
interrogations or scans or by entering the Scan# or Azimuth one can navigate to a specific scan or
azimuth. The maximum range of the video display can be set with the Range control.
Close the window to return to the Sectorial Extractor window.
IE-UM-00168-003 RIM782 User Manual.odt
37/53
Radar Interface Module - RIM782
Edition Date: 26-Mar-10
Figure 30: Preview Window
5. Once source, destination and threshold level are selected, the conversion to pulses can be started
. Since this can be a process of hours it is possible to stop the convert at any time by pressing
the Stop
button. The size of the output file is continuously monitored and the convert will
automatically stop when the end of the source file is reached or when the output file size reaches
2GB.
Figure 31: Converting Sectorial Recording to Pulses
IE-UM-00168-003 RIM782 User Manual.odt
38/53
Radar Interface Module - RIM782
Edition Date: 26-Mar-10
5. DATA RECORDING USING THE RIM782
5.1. Introduction
The UDR board of the RIM782 works very similar to the UDR600 (USB Data Recorder), more technical
information regarding the UDR part of the RIM782 can therefore be found in the UDR600 manual.
The RIM782 supports 2 types of recording:
1. Bit Recording: format independent bitwise recording
2. Serial Protocol Recording
Both recording types can be selected through the Serial Data button of the RASS-S toolbox. The user will
notice that the same recording software will open up, however a different software is loaded into the UDR
board of the RIM782. The conversion of the recorded files depends on this selection as well (bit recording or
serial protocol recording).
5.2. Recording Software
5.2.1.
Getting Started
The Bit Recorder and the Serial Protocol Recorder tool can be opened from the Serial Data
on the RASS-S toolbox. Both selections will open the same UDR Control vi.
button
Figure 32: UDR Control software
IE-UM-00168-003 RIM782 User Manual.odt
39/53
Radar Interface Module - RIM782
Edition Date: 26-Mar-10
Create the set-up shown in Annex 5: RIM782 Data Recording Connection Diagram.
As soon as RASS-S detected the UDR inside the RIM782, the following message will pop up:
Figure 33: UDR Control software
Click OK and follow the on-screen instructions to reboot the UDR type 2 (RASS-R) inside the RIM782 to a
UDR type 1 (RASS-S). The UDR inside the RIM782 will now behave in the same way as a normal UDR600.
One more difference with the normal UDR600:
In case you connected the timing signals but the dial of the data recording tool is not rotating, check whether
the RIM782 is using the correct timing signal channels:
1. Connect the USB Video port to the computer (the setting of the timing signals is done by the video
board)
2. Open up the Downlink tool (see also chapter 2. Downlink Measurement)
3. Verify the settings of the timing selector ACP/ARP. When the selectors are set to the channels to
which you connected the timing signals, the dial should be rotating.
5.2.2.
Making a Recording
1. The RIM782 has a factory default transport layer protocol configuration. Yet at any time the UDR
board in the RIM782 can be reprogrammed by the user to any of the following transport layer
protocols: HDLC, SYNC-13, AIRCAT, LINK1.
To perform a format independent bit recording you select here 'Bit Recording' from the list.
Now reprogram the UDR transport layer protocol (if necessary) by clicking the Reboot
and following the instructions .
G
button
Note: Notice that upon power loss the UDR board will always return to its default transport
layer protocol configuration.
2. Upon startup of the UDR Recording tool, the preferences window will automatically pop up. This
window can also be called by clicking the Preferences
button. Three tabs are selectable. The
tab General is used to specify the number of ACP pulses per revolution connected to the RIM782.
Notice that ACP/ARP signals are not strictly required for the UDR recording tool.
◦
12 bit = 4096 ACP per revolution
◦
14 bit = 16384 ACP per revolution
IE-UM-00168-003 RIM782 User Manual.odt
40/53
Radar Interface Module - RIM782
◦
Edition Date: 26-Mar-10
16 bit = 65536 ACP per revolution
The preferences window is also used to configure the different channels individually. Each of the two
channels can have its own settings. Select a channel by clicking on its respective tab. According to
the Line settings, some controls can be disabled.
It is most convenient to enter the settings left to right, starting with the Line Settings:
◦
Specify the Type of recording: None or Passive. None means that this channel is not used. No
further settings need to be entered. Passive means that this channel is recorded in spy mode
(listening only).
◦
Select the Line Type (electrical standard): RS 232 or RS 422.
◦
Select the Rx and Tx Clock generation: internal or external. If internal is chosen for one of both,
specify the Baud rate .
◦
Select the Data format and Layer. This is important, since it will allow the serial convert program
to automatically perform a convert with the correct data format setting. Notice that some
transport layer protocols can handle several data formats.
Click OK to save these settings (or click Cancel to discard them) and return to the recording tool.
3. Click the Record
button to start the actual recording. The recorded data is stored in a temp file.
Beware, a new recording will always overwrite the data stored in the temp from a previous
recording. While recording, the HD position indicator will count the Kilobytes file size used. A time
indication shows the current time. The PPI indicator will show the radar timing information
(ACP/ARP) during the recording (if connected). This timing information is also recorded together with
the serial data and can be used for analysing the data in a later stage.
4. The Connection panel indicates the integrity of the recording for each of the channels and the GPS
information individually (if connected). For each hardware channel and for the timing information
(GPS, ACP, ARP) there is a LED display that indicates the general status of the recording for that
particular channel:
◦
grey: hardware channel NOT IN USE
◦
red: channel NOT OK
◦
yellow: intermitted failure
◦
green: the channel is OK.
Notice that a red or yellow LED does not necessarily mean that the recording has failed. A poor line
quality also results in a temporary red/yellow light. A green light indicates that the recording is
functioning in an optimal way for the respective hardware channel. The synoptic text displays more
details of the current status of the recording. For each channel the number of transmitted frames and
the number of good and bad received frames are counted. These counters are updated continuously
during the recording.
IE-UM-00168-003 RIM782 User Manual.odt
41/53
Radar Interface Module - RIM782
Edition Date: 26-Mar-10
During the recording the raw data is logged to disk (temporary file), displayed and updated in the
Data Messages window.
Figure 34: UDR Recording
5. Once the recording has been stopped using the Stop
button, the tool will automatically prompt
the user to save the temporary file to disk. One can also use the Save
button to save the data.
In case a GPS450 is used for UTC time stamping, the GPS450 can be directly connected to
the RJ45 GPS input port of the RIM782. In the Preferences window one should check the
“Use the GPS for time stamping” selector in the “General” tab, to activate the GPS time
stamping function. The UDR GPS init window will pop-up when you push the OK button of
the preferences window. Next you have to wait until the GPS450 is synchronized (OK button
is enabled), then push the OK button to return to the UDR Control software. More information
regarding the use of the GPS450 can be found in the GPS450 User Manual.
6. By opening the Auto Save
window, the Auto Save function is automatically enabled. The auto
save function is a kind of endless loop recording function with a limited archive size. The Period
setting defines the length of each individual file and the Archive setting defines how many of these
files are kept on the disk. Once the archive size is reached, each new recording will replace the
oldest one. The auto save function is disabled by closing the auto save window.
5.3. Conversion Software
5.3.1.
Convert Bit Recording
The Convert Bit Recording tool can be opened from the Serial Data
IE-UM-00168-003 RIM782 User Manual.odt
button on the RASS-S toolbox.
42/53
Radar Interface Module - RIM782
Edition Date: 26-Mar-10
Figure 35: Convert Bit Recording software
The recorded data can be converted to another format using the Convert tool. The convert program also
allows you to see the data in a PPI or Hex format. This comes in handy to check the recording process while
it is being performed.
5.3.1.1. Single Conversion
1. Load the recorded file (source file) using the Select Folder
using the Browse Folder
button and select destination file
button. The destination file format can be one of the following:
◦
S4RD : the convert tool will create a .S4RD file which can be visualised in the Inventory tool and
further analysed in RASS-S. The use of the Inventory tool is explained in the Data Analysis User
Manual.
◦
IOSS: the recording is converted into a SASS-C compatible Mayer-IOSS or FINAL format (IOSS
format selector).
◦
None: no file outputs is required.
2. Verify the Site File settings or Load a Site File using the Site File
IE-UM-00168-003 RIM782 User Manual.odt
button.
43/53
Radar Interface Module - RIM782
Edition Date: 26-Mar-10
3. When the PPI selection is clicked the user can see the converted data in a PPI display.
Figure 36: PPI Display
The positions of the aircraft can be viewed in the PPI graph. The history length of the track is fixed at
5 scans. A small checkbox in the upper right corner of the window ( default True) enables labeling
on all tracks.
In the right hand side of this window, a list is presented with the A codes of all the aircraft present on
the PPI. There are 3 ways to select a target:
◦
By clicking one of these items in the rigth list, a query is performed on this particular aircraft.
◦
The user can also enter manually a particular A code to be searched for in the AC ID field. To do
this first unlock the field, fill in the A code and lock the field again.
◦
The last way to select an aircraft is to move the red cursor using the cross mouse pointer.
The data (Range, Azimuth, A code, Altitude, Track number, etc...) of the selected target is presented
in a text field in the right upper corner of the PPI graph. Also the red cursor will be positioned on the
current position of this aircraft. The selected A code will be copied in the AC ID field. When the user
zooms around a selected target, the X and Y scales will automatically be updated such that the
selected target always remains in the middle of window.
The selected A code will be tracked continuously by the red cursor if the lock selector is set .
By clicking the Pause
button the PPI screen will be “frozen”.
4. Use the Info checkbox to enable the information field.
IE-UM-00168-003 RIM782 User Manual.odt
44/53
Radar Interface Module - RIM782
Edition Date: 26-Mar-10
5. Check the Hex checkbox to view the hexadecimal display of the current conversion process.
Figure 37: Hexadecimal display of converted data
6. The Scan
button scans a few blocks from the data source and colours the line check boxes in
the Line Selection field green if the recording holds data from that line. Make sure to check the
correct line as source for the data convert. If multiple lines are checked, the converted data from
those lines will be merged into the same output file.
7. Click the Start
button to start the conversion. The progress bar will show the status of the
conversion process. The converted file is stored at the destination location and can now be further
analysed.
5.3.1.2. Batch Conversion
The user can also run a batch of multiple conversions by following these instructions:
1. Press the triangular button
Process section.
in the lower left corner of the Convert vi to show or hide the Batch
Figure 38: Batch Process section of Convert software
2. Running a conversion can be a time consuming process therefore if you want to run several
conversions in a row you may wish to put them in a batch process. The following buttons are
available:
◦
◦
◦
◦
Copy the single conversion selected by the green rectangle in the “Batch List” to the
controls in the “RDR functions” section.
Load a "Batch list" from disk.
Add a single conversion at the position of the green rectangle to the "Batch list" or
remove a single conversion at the position of the green rectangle from the "Batch list".
Run the batch, this will successively starts the specified conversion.
IE-UM-00168-003 RIM782 User Manual.odt
45/53
Radar Interface Module - RIM782
Edition Date: 26-Mar-10
◦
Abort a running batch procedure.
◦
Save the "Batch list" to disk for later use or reference.
Once the required data is converted in to the same format it can be used for comparison or analysis
in the selected radar analysis tool.
5.3.2.
Convert Data Recording
The Convert Data Recording tool can be opened from the Serial Data
button on the RASS-S toolbox.
Figure 39: Convert Radar Data software
The recorded serial data can be converted to another format using the Convert tool. The convert program
also allows you to see the data in a PPI or Hex format. This comes in handy to check the recording process
while it is being performed.
5.3.2.1. Single Conversion
1. Load the recorded file (source file) using the Select Folder
using the Browse Folder
button and select destination file
button. The destination file format can be one of the following:
◦
RASS-S S4 file: the convert tool will create a .S4RD file which can be visualised in the Inventory
tool and further analysed in RASS-S. The use of the Inventory tool is explained in the Data
Analysis User Manual.
◦
SASS-C data: the recording is converted into a SASS-C compatible Mayer-IOSS or FINAL
format
◦
None: no destination is required
◦
Replay of EDR: the recording is converted into an EDR replay file such that it can be replayed
using the RDR or the LAN replay tool (outside the scope of this manual)
2. Open up the Preferences window using the Preferences
button to check the settings of the
recording and to set the conversion settings. Click OK to return to the Convert program.
3. Select the line to be used as source for the data convert. If multiple lines are checked, the converted
data from those lines will be merged into the same output file.
IE-UM-00168-003 RIM782 User Manual.odt
46/53
Radar Interface Module - RIM782
4. Verify the Site File settings or Load a Site File using the Site File
Edition Date: 26-Mar-10
button.
5. When the PPI
button is clicked the user can see the converted data in a PPI display. In fact the
Inventory tool is opened when the PPI button is clicked (more information regarding the Inventory
tool can be found in the Data Analysis User Manual).
6. Use the Stats
button to view the converted data statistics such as number of messages,
number of errors, etc...
7. Check the Hex checkbox to view the hexadecimal display of the current conversion process.
Figure 40: Hexadecimal display of converted data
8. Click the Start
button to start the conversion. The progress bar will show the status of the
conversion process. The converted file is stored at the destination location and can now be further
analysed.
Note: When you selected the PPI button, the data can be viewed in the Inventory tool. You
G
need to load the converted file in the Inventory first (by clicking the Load
Inventory does not display the converted date in a live manner.
button) as the
5.3.2.2. Batch Conversion
See section 5.3.1.2. Batch Conversion for more information.
6. DATA ANALYSIS
More information regarding the possible data analysis functions of RASS-S can be found in the Data
Analysis User Manual.
IE-UM-00168-003 RIM782 User Manual.odt
47/53
Radar Interface Module - RIM782
Edition Date: 26-Mar-10
7. ANNEXES
7.1. Annex 1: Critical Parameters of SSR Antennas
Critical Parameters of SSR Antennas that should be included in the Out-of-Tolerance Detection (OTD):
Facility of the Polar Diagram Plotter developed by Intersoft Electronics NV (copied from document 3E/T/322
Eurocontrol Directorate, 6/11/91).
Critical parameters that should be monitored by the OTD are :
• the presence of sidelobe punch-through (position and level) ;
• the level of the highest ∑ sidelobe (other than the backlobe) (typically <-22 dB)
• the ∑ / Ω cross-over levels (dB) and positions (degrees) (typical level ,-18 dB ± 3 dB)
• the ∑ mainlobe -3 dB beam width (degrees) (typically -2.35° ± 0.25°)
• mean ∑ sidelobe level (typically <-24 dB)
• Ω pattern notch depth , or the highest point within the notch (typically <-24 dB) ;
• the ∑ backlobe level (typically <-24 dB) ;
• the ∑ / ∆ cross-over levels (dB) and positions (degrees), (typically -3 dB ± 0.5 dB, ±1.25° from
mainlobe axis ) ;
Since there are many different types of SSR antennas (LVAs, hog-through, integrated with PSR, conformal
phased array) and different sizes (9 m, 4.5 m, even 2 m) and also variation in parameters between
manufacturers, it is expected that a “footprint” is made for each secondary radar site and a given
measurement point and that when later measurements show a significant deviation (to be defined for each
parameter), than an “alarm” indication is given for the out-of -tolerance parameter(s).
This will also allow the effect on OTD of radar siting and eventual changes in propagation conditions
(weather, ground conductivity, local obstructions) to be minimized .
It should be noted that the typical figures given above for levels, beamwidths, positions, etc. are only
provisional and might be updated according to experience.
IE-UM-00168-003 RIM782 User Manual.odt
48/53
Radar Interface Module - RIM782
Edition Date: 26-Mar-10
7.2. Annex 2: Downlink Connection Diagram
Figure 41: Downlink Connection Diagram
IE-UM-00168-003 RIM782 User Manual.odt
49/53
Radar Interface Module - RIM782
Edition Date: 26-Mar-10
7.3. Annex 3: Sectorial Video Recording Connection Diagram
Figure 42: Sectorial Video Recording Connection Diagram
IE-UM-00168-003 RIM782 User Manual.odt
50/53
Radar Interface Module - RIM782
Edition Date: 26-Mar-10
7.4. Annex 4: Sectorial Video Mode-S Recording Connection Diagram
Figure 43: Sectorial Video Mode-S Recording Connection Diagram
IE-UM-00168-003 RIM782 User Manual.odt
51/53
Radar Interface Module - RIM782
Edition Date: 26-Mar-10
7.5. Annex 5: RIM782 Data Recording Connection Diagram
Figure 44: RIM782 Data Recording Connection Diagram
IE-UM-00168-003 RIM782 User Manual.odt
52/53
Radar Interface Module - RIM782
Edition Date: 26-Mar-10
7.6. Annex 6: Configuration List: RIM782
Check
Qty
Description/Item List
Radar Interface Module
O
1
Radar Interface Module RIM782
O
1
Mains power cable
O
2
USB cable A to B
RIM Accessories - P808
O
1
2m BNC-BNC cable blue RG223
O
1
2m BNC-BNC cable red RG223
O
2
5m BNC-BNC cable RG59
O
4
2m BNC-BNC cable RG59
O
1
DB15HD (m) to 5 BNC(m) cable 1.8m
O
2
RJ45 to DB15(m) cable
O
2
Cat 5 FTP patch cord RJ45-RJ45 5m
O
2
RS232 Probe Module
2
10dB Attenuator BNC 50Ohm
O
2
3dB Attenuator BNC 50Ohm
O
2
Low pass filter 50Ohm 5MHz BLP-5+
O
4
BNC T adaptor f / f / m
O
2
BNC(f) straight adaptor DC-4GHz
O
2
In line terminator 75Ohm BNC
O
2
RJ45 8 way coupler
O
1
Extraction tool for crimo'D' pins
IE-UM-00168-003 RIM782 User Manual.odt
53/53