1
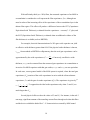
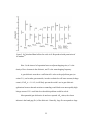
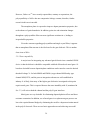
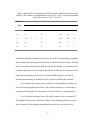
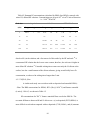
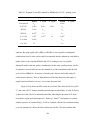
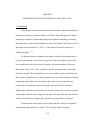
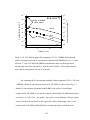
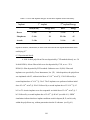
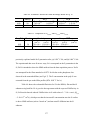
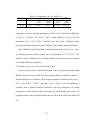
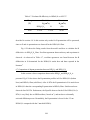
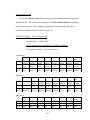
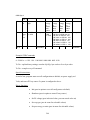
Table 4.1 Remnant Zr concentrations (calculated by RBS) after ZrSix Oy removal with
stirred 1% HF solutions. Concentrations are given in 1015 at/cm2 . For these experiments
Limit of detection is ~ 5x10¹³ Zr at/cm2 .
Etch time
700 o C
As-deposited
1100 oC
Range
Avg.
σ
Range
Avg.
σ
Range
Avg.
σ
5
LD -5
3
2
0.7-14
6
5
36-3710
1298
1089
15
LD
LD
8-36
20
11
30
LD -11
LD
2-690
188.4
259
60
LD
LD
8-18
15
6
120
LD
LD
1-6
4
3
(min)
6
4
interdiffusion into the Si substrate occurs after extreme RTA N2 annealing for uncapped
films, similar to the annealing performed on the Zr silicate films reported here. Therefore,
the Zr concentration determined by RBS described in this chapter is a combination of Zr
remnant at the surface and Zr incorporated within the Si substrate. As mentioned earlier,
significant concentrations of detected Zr is located within the top 0.6 nm of the Si
substrate, demonstrating an incomplete ZrSix Oy removal with dilute HF solutions.17
In is important to note that a large variation (i.e. non reproducible etching) was
observed when using diluted HF solution. This variation (noted as Ave. in the table) is
associated with the higher OH- concentration in the HF solution. As explained below.
It is well known that the etch rate of Si in HF solution is low, but measurable. 19
The etching of silicon can be explained as follows: the etching proceeds in two steps, a
slow oxidation of the hydrogen-terminated silicon surface by water molecules (or
93