1
64
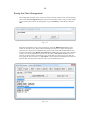
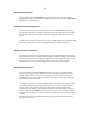
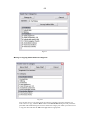
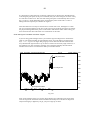
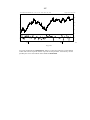
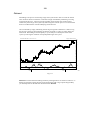
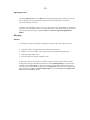
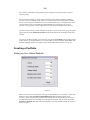
Latest Data Window
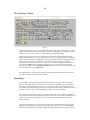
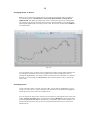
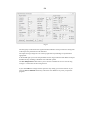
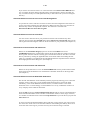
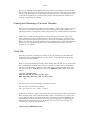
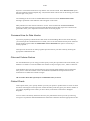
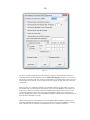
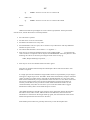
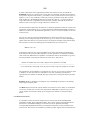
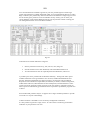
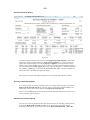
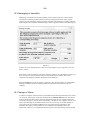
Click Display data box (button 3 of Data display on the
floating toolbar) or the speedkey F12 to obtain the data
relevant to the last date in the file and the background to
the box will be grey. If the F7 or F8 keys are pressed (or
the mousewheel rolled) to scroll the display then the data
box will instead show data relevant to the last period
shown on screen and the background colour will change to
the tooltip background colour. The data window will be
shown in the upper left hand corner of the screen. This is a
toggle which will be switched off by clicking this button
again.Note that Turnover will be described as 'today', 'this
week', 'this month' depending on the compression state of
the file.
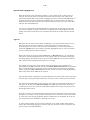
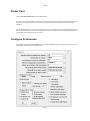
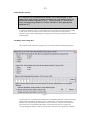
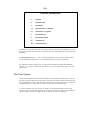
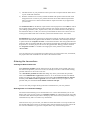
Apart from the price, volume, change and turnover data
the global indicators of Velocity and Behaviour are also
shown below and if you have chosen to display Portfolio
trades and other portfolio information you may see listed
the value of your holdings, the profit you are currently
recording as well as the additional purchase you could
make without violating the risk criteria you have set in the
Risk Calculator.
If ESC is pressed then the window will be removed but
the toggle is still on and any subsequent charts which are
plotted will have the latest data window activated. Click
this button at any time to toggle it off.
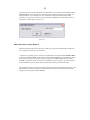
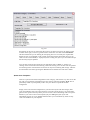
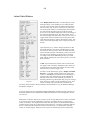
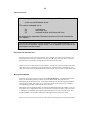
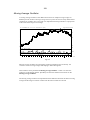
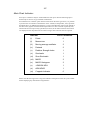
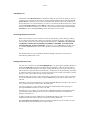
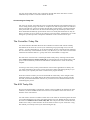
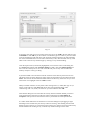
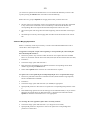
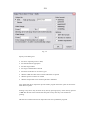
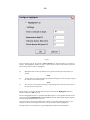
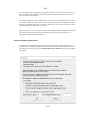
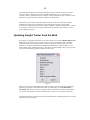
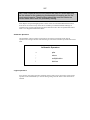
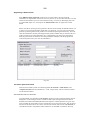
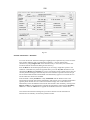
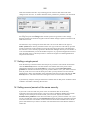
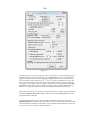
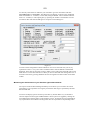
If button 4 of the Data display group - Display extended
data box – is clicked instead (or button 38 on the main
toolbar, or Ctrl F12 is pressed) then extra information is
supplied. This extra information is the DividendYield,
Earnings Yield, NTA Yield, P/E Ratio, Price/NTA, %
Franking, Market Cap, Moneyflow/day (proxy for average
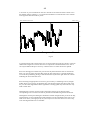
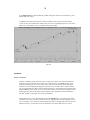
Fig 2.19
daily $ turnover), Debt to equity and Debt to assets. This
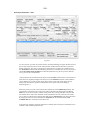
will be available only if the relevant information has
previously been inserted in the F2 notepad as described below or by the Database Manager
described in Chapter 8.
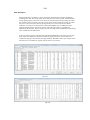
If you are employing User Supplied Extended Fundamental Information using CSV files as
described elsewhere in this manual then additional information will be displayed in the last
two sections.
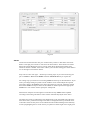
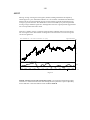
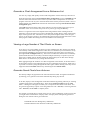
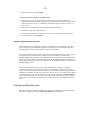
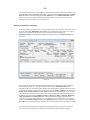
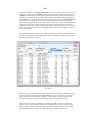
Moneyflow on the F12 data box is a good proxy for average daily turnover and is calculated
as an average of the last 20 traded days irrespective of whether the file is compressed to
weekly or monthly. Also displayed in brackets after this figure is the minimum MoneyFlow
recorded for any single day in that 20 day period. However, if it used as a subchart indicator
then it is affected by the compression state of the file where it is calculated by summing
weekly or monthly figures. Money Flow for a period is measured as period volume times