1
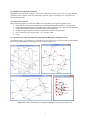
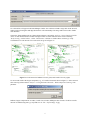
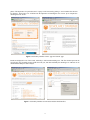
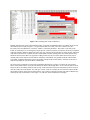
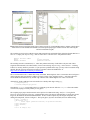
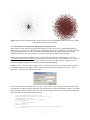
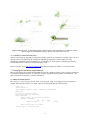
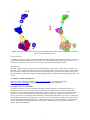
in support of natural language processing (NLP), classification/mining, and graph algorithms for the
analysis of business and governmental text corpuses with an inherently temporal component (Kampis,
Gulyas, Szaszi, & Szakolczi, 2009). TEXTrends recently adopted OSGi/CIShell for the core architecture
and the first seven plugins are IBMs Unstructured Information Management Architecture (UIMA)
(http://incubator.apache.org/uima), the data mining, machine learning, classification and visualization
toolset WEKA (http://www.cs.waikato.ac.nz/ml/weka), Cytoscape, Arff2xgmml converter, R
(http://www.r-project.org) via iGgraph and scripts (http://igraph.sourceforge.net), and yEd. Upcoming work
will focus on integrating the Cfinder clique percolation analysis and visualization tool
(http://www.cfinder.org), workflow support, and web services.
Several of the tools listed in the table above are also libraries. Unfortunately, it is often difficult to use multiple
libraries, or sometimes any outside library, even in tools that allow the integration of outside code. Network
Workbench, however, was built to integrate code from multiple libraries (including multiple versions of the same
library). For instance, two different versions of Prefuse are currently in use, and many algorithms use JUNG (the
Java Universal Network/Graph Framework). We feel that the ability to adopt new and cutting edge libraries from
diverse sources will help create a vibrant ecology of algorithms.
Although it is hard to discern trends for tools which come from such diverse backgrounds, it is clear that over time
the visualization capabilities of scientometrics tools have become more and more sophisticated. Scientometrics tools
have also in many cases become more user friendly, reducing the difficulty of common scientometrics tasks as well
as allowing scientometrics functionality to be exposed to non-experts. Network Workbench embodies both of these
trends, providing an environment for algorithms from a variety of sources to seamlessly interact in a user-friendly
interface, as well as providing significant visualization functionality through the integrated GUESS tool.
The reminder of this section compares the Scientometrics functionality in NWB Tool with alternative and
complementary tools.
7.8.2 HistCite by Eugene Garfield
Compiled by Angela Zoss
HistCite was developed by Eugene Garfield and his team to identify the key literature in a research field. As stated
on the Web site, HistCite analyzes ISI data retrieved via a keyword based search or cited author search and
identifies: important papers, most prolific and most cited authors and journals, other relevant papers, keywords that
can be used to expand the collection. It can also be used to analyze publication productivity and citation rates of
individuals, institutions, countries. By analyzing the result of an author search, highly cited articles, important coauthor relationships, a time line of the authors’ publications, and historiographs showing the key papers and timeline
of a research field can be derived. A trial version of the tool is available at http://www.histcite.com. An interactive
version of the “FourNetSciResearchers.isi” analysis result is at http://ella.slis.indiana.edu/~katy/outgoing/combo.
Subsequently, we compare paper-paper citation networks created by NWB Tool and HistCite for the
“FourNetSciResearchers.isi” dataset.
HistCite identifies 360 nodes in this network, while NWB identifies 361 unique records. The discrepancy is the
result of two records that have identical “Cite Me As” values: “ANDERSON CJ, 1993, J MATH PSYCHOL, V37,
P299 0 0”. NWB is able to distinguish these two records, which have unique ISI IDs but are both book reviews by
the same reviewer on the same page in the same journal issue.
HistCite identifies 901 edges between the 360 papers. NWB Tool originally identified 5335 nodes and 9595 edges,
as not only linkages between papers in the set but also linkages to references are extracted. The latter nodes can be
excluded by removing nodes with a globalCitationCount value of -1 (see section 7.6.1.1 Paper-Paper (Citation)
Network). The resulting network has 341 nodes and 738 edges (or 276 nodes and 738 edges after deleting isolates).
This network can be visualized in HistCite using Tools > Graph Maker. The Graph Maker inputs the nodes of the
network, which are then laid out chronologically from the top of the screen to the bottom. The size of the nodes
relates to the value of either the Local Citation Score (LCS) or the Global Citation Score (GCS), depending on the
66