1
5. Analyzing Data in an OLAP Report
Sorting Data
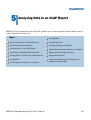
In this section:
Sorting Measures
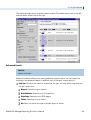
Sorting Dimensions
Grouping Numeric Data Into Tiles
You can sort the data in an OLAP report based on the values of dimensions in the hierarchy
and/or the values of the quantitative measures that constitute the body of the report. Sorting
options vary depending on the nature of the data being sorted. For details, see Sorting
Measures on page 143 and Sorting Dimensions on page 150.
You can also group numeric data into any number of tiles (percentiles, quartiles, deciles,
etc.). See Grouping Numeric Data Into Tiles on page 168.
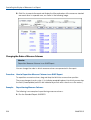
Sorting Measures
How to:
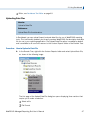
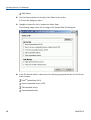
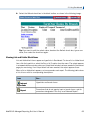
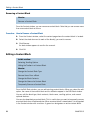
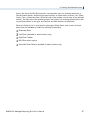
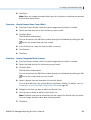
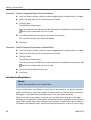
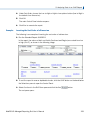
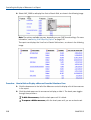
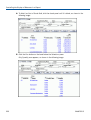
Sort Measures High to Low/Low to High in an OLAP Report
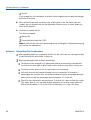
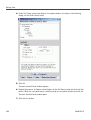
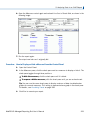
Sort Measures High to Low/Low to High From the Control Panel
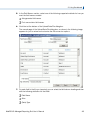
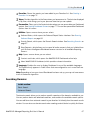
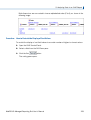
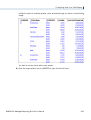
View a Subset of Data for Sorted Measures
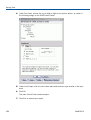
Remove Sorting Criteria for a Measure
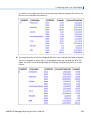
You can apply aggregation and sorting simultaneously to a numeric measure in an OLAP
report, and sort the data from high to low (descending order) or from low to high (ascending
order). All other columns are sorted correspondingly.
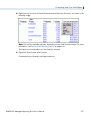
For the measure being sorted, you can restrict the report to a specified number of highest
values (when sorting high to low) or lowest values (when sorting from low to high).
When you sort a measure, any subtotals, subheadings, or subfootings in the report are
automatically suppressed since these elements relate to a specific sort field and are not
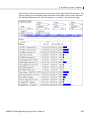
meaningful when the report is resorted by the values in a measure column. For an illustration,
see Applying a Percent Calculation to a Measure on page 173.
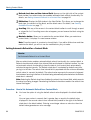
Note: Sorting by measures is not available in a report in which measures have been stacked.
See Hiding and Displaying Measures on page 216.
WebFOCUS Managed Reporting End User's Manual
143