1
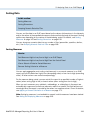
Sorting Data
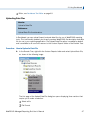
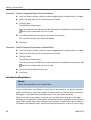
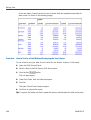
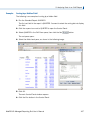
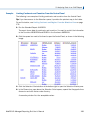
Procedure: How to Group Data Into Tiles in an OLAP Report
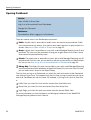
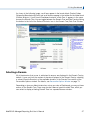
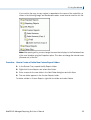
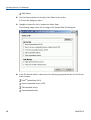
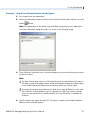
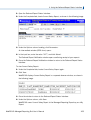
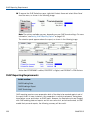
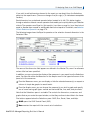
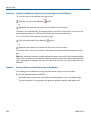
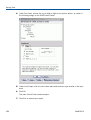
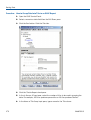
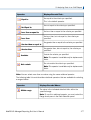
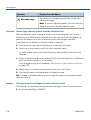
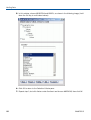
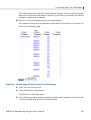
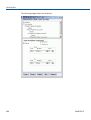
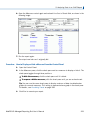
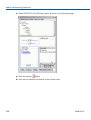
1. Open the OLAP Control Panel.
2. Select a numeric or date field from the Drill Down pane.
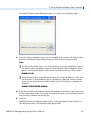
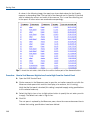
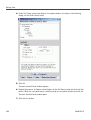
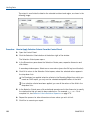
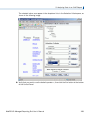
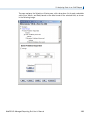
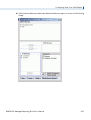
3. Click the Sort button. Click the Tiles tab.
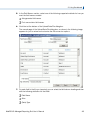
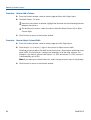
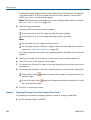
4. Click the Tile the Report check pane.
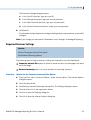
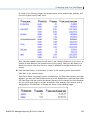
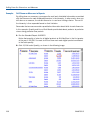
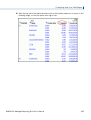
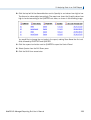
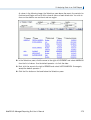
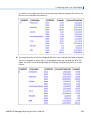
5. In the In Groups Of input area, select the number of tiles to be used in grouping the
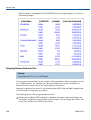
data. For example, 100 tiles produces percentiles or 10 tiles produces deciles.
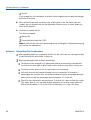
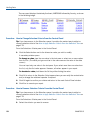
6. In the Name of Tile Group input pane, type a name for the Tile column.
170
WebFOCUS