1
Getting Started
VSA-186 Debugger
Getting Started
VAutomation System Analyzer, VSA-186
January 16, 2013
MIPS Technologies, Inc.
955 East Arques Avenue
Sunnyvale, CA 94085-4521
Copyright (c) 2005-2013 MIPS Technologies, Inc. All rights reserved.
Page 1 of 27
Getting Started
VSA-186 Debugger
Copyright (c) 2010-2013 MIPS Technologies, Inc. All rights reserved.
Unpublished rights (if any) reserved under the copyright laws of the United States of America and other countries.
This document contains information that is proprietary to MIPS Technologies, Inc. ("MIPS Technologies"). Any
copying, reproducing, modifying or use of this information (in whole or in part) that is not expressly permitted in
writing by MIPS Technologies or an authorized third party is strictly prohibited. At a minimum, this information is
protected under unfair competition and copyright laws. Violations thereof may result in criminal penalties and fines.
Any document provided in source format (i.e., in a modifiable form such as in FrameMaker or Microsoft Word
format) is subject to use and distribution restrictions that are independent of and supplemental to any and all
confidentiality restrictions. UNDER NO CIRCUMSTANCES MAY A DOCUMENT PROVIDED IN SOURCE
FORMAT BE DISTRIBUTED TO A THIRD PARTY IN SOURCE FORMAT WITHOUT THE EXPRESS
WRITTEN PERMISSION OF MIPS TECHNOLOGIES, INC.
MIPS Technologies reserves the right to change the information contained in this document to improve function,
design or otherwise. MIPS Technologies does not assume any liability arising out of the application or use of this
information, or of any error or omission in such information. Any warranties, whether express, statutory, implied or
otherwise, including but not limited to the implied warranties of merchantability or fitness for a particular purpose,
are excluded. Except as expressly provided in any written license agreement from MIPS Technologies or an
authorized third party, the furnishing of this document does not give recipient any license to any intellectual
property rights, including any patent rights, that cover the information in this document.
The information contained in this document shall not be exported, reexported, transferred, or released, directly or
indirectly, in violation of the law of any country or international law, regulation, treaty, Executive Order, statute,
amendments or supplements thereto. Should a conflict arise regarding the export, reexport, transfer, or release of the
information contained in this document, the laws of the United States of America shall be the governing law.
The information contained in this document constitutes one or more of the following: commercial computer
software, commercial computer software documentation or other commercial items. If the user of this information,
or any related documentation of any kind, including related technical data or manuals, is an agency, department, or
other entity of the United States government ("Government"), the use, duplication, reproduction, release,
modification, disclosure, or transfer of this information, or any related documentation of any kind, is restricted in
accordance with Federal Acquisition Regulation 12.212 for civilian agencies and Defense Federal Acquisition
Regulation Supplement 227.7202 for military agencies. The use of this information by the Government is further
restricted in accordance with the terms of the license agreement(s) and/or applicable contract terms and conditions
covering this information from MIPS Technologies or an authorized third party.
MIPS, MIPS I, MIPS II, MIPS III, MIPS IV, MIPS V, MIPSr3, MIPS32, MIPS64, microMIPS32, microMIPS64,
MIPS-3D, MIPS16, MIPS16e, MIPS-Based, MIPSsim, MIPSpro, MIPS Technologies logo, MIPS-VERIFIED,
MIPS-VERIFIED logo, 4K, 4Kc, 4Km, 4Kp, 4KE, 4KEc, 4KEm, 4KEp, 4KS, 4KSc, 4KSd, M4K, M14K, 5K, 5Kc,
5Kf, 24K, 24Kc, 24Kf, 24KE, 24KEc, 24KEf, 34K, 34Kc, 34Kf, 74K, 74Kc, 74Kf, 1004K, 1004Kc, 1004Kf,
1074K, 1074Kc, 1074Kf, R3000, R4000, R5000, Aptiv, ASMACRO, Atlas, "At the core of the user experience.",
BusBridge, Bus Navigator, CLAM, CorExtend, CoreFPGA, CoreLV, EC, FPGA View, FS2, FS2 FIRST SILICON
SOLUTIONS logo, FS2 NAVIGATOR, HyperDebug, HyperJTAG, IASim, interAptiv, JALGO, Logic Navigator,
Malta, MDMX, MED, MGB, microAptiv, microMIPS, OCI, PDtrace, the Pipeline, proAptiv, Pro Series, SEAD,
SEAD-2, SmartMIPS, SOC-it, System Navigator, and YAMON are trademarks or registered trademarks of MIPS
Technologies, Inc. in the United States and other countries. All other trademarks referred to herein are the property
of their respective owners.
Copyright (c) 2005-2013 MIPS Technologies, Inc. All rights reserved.
Page 2 of 27
Getting Started
VSA-186 Debugger
1. Introduction
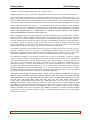
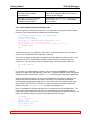
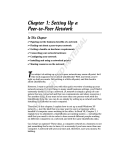
The VAutomation System Analyzer for the 186 is a JTAG-based debugger for the VAutomation
V80x86 processor cores with DEICE. System Navigator is a family of JTAG-based debugging
solutions. There are currently two hardware/software solutions:
System Navigator
System Navigator, Original Edition (OE)
System Navigator, pictured on the left, communicates with USB (1.1 and 2.0). System Navigator OE,
pictured on the right, communicates with a parallel port and does not support USB.
.
2. Installing the Software
The Paradigm debugger CDROM also installs FS2 driver software. No further action is required to
use VSA-186 with Paradigm DEBUG. However, from time to time, FS2 software updates may be
available before they are included on Paradigm’s CDROM.
FS2 software is supplied on a CDROM. To install the software, insert the CDROM and run the
setup.exe program found in the root directory on the CDROM. Software updates are supplied
electronically via the FS2 website to licensed users. To install an update, download the appropriate
exe file, and then execute it
When installing, you have the choice of updating the Paradigm DEBUG installation or installing only
the command-line interface.
3. Command-Line Interface (CLI)
The CLI can be used as both a user interface and as a means of automating sequences of tasks. It is
based on Tcl/Tk, a widely-used command language and GUI builder. VSA-186 uses Tcl/Tk version
8.4. CLI users may wish to get more information about Tcl at http://dev.scriptics.com. There are a
number of excellent books about Tcl available; FS2 recommends Practical Programming in Tcl and
nd
Tk, 2 edition by Brent Welch.
A number of command primitives and Tcl procedures have been added to customize Tcl for this
application. Commands are included for system configuration, emulation control, memory access
including an assembler and disassembler, register access, trace and trigger access, file download,
and status indication. The commands are detailed in Appendix A.
Copyright (c) 2005-2013 MIPS Technologies, Inc. All rights reserved.
Page 3 of 27
Getting Started
VSA-186 Debugger
A shortcut is installed in the Start Menu, but if you would like to create your own shortcut, the
invocation command line for the CLI is “cliv86.exe initv86.tcl”. The CLI is run from the FS2 installation
directory, typically C:\Program Files\FS2\v86\bin.
4. Configuring Hardware
4.1. System Navigator Hardware
This section details hardware specifications for the System Navigator probe.
4.1.1. Target Connection
The System Navigator uses a 10-position flat ribbon cable with standard 0.100” square post
headers. A connector with an orientation key such as 3M 2510-6002UB is recommended. The
pinout of the target connector is described in the following table.
TCK
TDO
TMS
NC
TDI
Pin
1
2,10
3
4
5
6
Signal
TCK
GND
TDO
NC
TMS
VIO
I/O
O
-I
Active
H
-H
O
I
H
--
7
8
NC
RESET
I/O
H/L
9
TDI
O
H
1
3
5
7
9
2
4
6
8
10
GND
NC
VIO
RESET
GND
Comments
JTAG test clock
Signal reference. Both pins must be connected.
JTAG test data output
Probe does not connect to this pin.
JTAG test mode select
Used by probe to configure output driver level and
determine target power-on state.
No connection
Bidirectional reset. Asserted from probe to force target
®
reset and asserted by target to indicate an OCI reset.
JTAG test data input
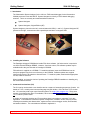
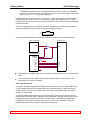
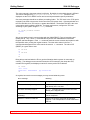
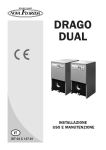
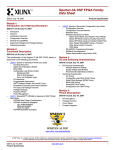
A typical system implementation of the probe interface is shown in the following schematic.
Copyright (c) 2005-2013 MIPS Technologies, Inc. All rights reserved.
Page 4 of 27
Getting Started
VSA-186 Debugger
R ES ET S U PERV IS OR
V 86 DEIC E A SIC
R ES ET*
R ES ET*
D EB UG CO NN EC TO R
R ES ET*
1K
V IO
V CC
TCK
TM S
TCK
TM S
TD I
TD O
TD I
TD O
GN D
TCK is an edge-sensitive signal and should be routed carefully to avoid problems with
transmission-line effects or crosstalk.
An optional 10 pin to 20 pin adapter cable may be used to connect the System Navigator to
targets utilizing the System Navigator OE probe 20 pin connector. This adapter cable does
not connect the Reset return signal from target to probe.
RESET may be active-high or active-low. The console config command configures the logic
sense and drive characteristics of this signal. The default is active high. The target must provide
any necessary pullups/pulldowns.
4.1.2. Host Connection
USB communication may be used under Windows 2000, Windows XP and Windows 7. Because
the System Navigator is powered by the USB cable, a direct connection to the host or a powered
hub is required. The probe is compatible with USB 2.0 and USB 1.1. System Navigator probes
with Ethernet interfaces can also connect to the host PC through an Ethernet switch, hub, or
crossover cable.
With the power to your target off, connect the 10 pin target cable from the probe to the target
JTAG connector.
To connect the probe and the host PC using USB, connect the USB cable to the host PC and
then to the probe. When you first power on the unit with the USB cable connected, you may see a
series of dialog boxes appear (i.e. “USB 2.0 Device”, followed by “MIPS System Navigator
Firmware Loader”, followed by “MIPS System Navigator Probe”). On Windows XP, you may see
the Found New Hardware Wizard, in which case you should choose to install the software
automatically. Also on Windows XP, if you see a warning box stating that the driver you are
installing for MIPS System Navigator Probe has not passed Windows logo testing, it is safe to
choose the Continue Anyway option. As a confirmatory step to ensure that the driver has been
installed successfully, it may be useful to open the Windows Device Manager and verify that
“MIPS System Navigator Probe” shows up under “Universal Serial Bus controllers” section.
Once the USB connection has been established, you will see the POWER LED turn on and the
COMM LED flash once. The target system should then be powered on. Before starting up the
Copyright (c) 2005-2013 MIPS Technologies, Inc. All rights reserved.
Page 5 of 27
Getting Started
VSA-186 Debugger
software to interact with the probe, always ensure that the USB connection has been established
(as indicated by the LEDs).
There are a number of port-related error messages that can occur during the USB setup process
and operation:
Error message
Meaning
Communication has not been
established with remote unit.
At initialization, the debugger attempts to reopen
the port used in the previous session (stored in
\windows\fs2.ini). If this fails or there is no previous
port, the communication is left uninitialized. Use
openport <port> to establish communication.
Communication port must be specified.
Attempted to open a port with a null name.
Specified port is not installed.
This parallel port does not exist on the PC.
Communication port must be lpt[1|2|3]
sysnav-usb or sysnav-net.
Attempted to open a port with a name other than
lpt1, lpt2, lpt3, sysnav-usb or sysnav-net.
Device on parallel port is not an FS2
debugger.
Based on write/read tests of the remote device, it
does not appear to be an FS2 debugger. Check
that you have specified the correct port and that the
debugger is powered up.
No HID-class devices found on USB
port.
In enumerating the devices attached to the USB
port, no HID-class devices were found. Check your
connection and be sure the COMM LED is
illuminated before starting the software.
No FS2 products found on USB port.
In enumerating the devices attached to the USB
port, no FS2 devices were found. Check your
connection and be sure the COMM LED is
illuminated before starting the software.
No FS2 products with matching serial
number found on USB port.
In enumerating the devices attached to the USB
port, at least one FS2 unit was found but the unit
with the specified serial number was not found.
Check the serial number (be sure to enter it exactly
as shown on the serial number sticker), then check
your connection and be sure the COMM LED is
illuminated before starting the software.
Port has not been opened.
An attempt was made to access the USB device
before it was opened. This can occur if the device
is power-cycled or unplugged without restarting the
software.
Unable to retrieve pathname for USB
device.
This is an internal error. Please contact FS2.
USB communication error.
A communication error not covered by another
message was encountered. Check connections
and COMM LED status.
USB communication timeout.
No response was received from the FS2 device
within a timeout period. Check connections and
COMM LED status. This error can also occur if the
unit is unplugged or powered down.
Copyright (c) 2005-2013 MIPS Technologies, Inc. All rights reserved.
Page 6 of 27
Getting Started
VSA-186 Debugger
Unable to load hid.dll. One or more
exported functions missing.
The Windows library hid.dll could not be loaded
because its interface was incompatible. This is an
internal error. Please contact FS2.
Can't open setupapi.dll: <reason>
Windows could not open setupapi.dll. The error
string returned from Windows follows.
Can't open hid.dll: <reason>
Windows could not open its USB driver file hid.dll.
The error string returned from Windows follows.
USB communication is not supported in
this version of Windows.
USB is not supported in Windows 95 or Windows
NT.
USB read error. <reason>
The Windows driver returned an error from a read
operation. The Windows error text follows. This
error can occur if the unit is powered down or
unplugged during operation.
USB write error. <reason>
The Windows driver returned an error from a write
operation. The Windows error text follows. This
error can occur if the unit is powered down or
unplugged during operation.
To connect the probe and the host PC using Ethernet (in System Navigator probes that have an
Ethernet interface), first configure the probe’s TCP/IP settings (using a USB connection) as
described in section 4.1.3. Then, if a USB cable is attached to the probe, disconnect it. Connect
the Ethernet interfaces of the probe and host PC using an Ethernet switch, hub, or crossover
cable. Connect the 5V power supply to the probe connector labeled +5V DC. The COMM LED
will blink until the probe’s TCP/IP settings have been initialized. If the COMM LED continues to
blink for more than 10 seconds, then this indicates that the probe is set up to acquire its TCP/IP
settings through DHCP, but DHCP negotiation has not succeeded. In this case, verify that you
have a working DHCP server on the local subnet, or re-configure the probe using static TCP/IP
settings as described in section 4.1.3. Once the COMM LED stops blinking, then the probe is
ready to be used.
If there is more than one probe connected to your host PC, you can specify which probe is to be
connected by specifying the probe serial number in the openport command, e.g. openport
usb40124” where 40124 is the 5-digit serial number of your probe. The serial number may be
found on the bottom of the unit. For Ethernet-connected probes whose TCP/IP settings have
been set up as described in section 4.1.3, use openport net40124, where 40124 is the probe
serial number. For Ethernet probes that are located in a different subnet than the host PC, use
the probe’s IP address in the openport command, e.g. openport net:192.245.121.10. You can
use a valid DNS name in place of the numeric IP address.
Copyright (c) 2005-2013 MIPS Technologies, Inc. All rights reserved.
Page 7 of 27
Getting Started
VSA-186 Debugger
4.1.3. Getting Started with System Navigator
Once the system is connected and powered on, you may want to verify some of the most basic
functions. First, start the System Navigator software and verify the connection.
VAutomation System Analyzer for V8086 DEICE
Serial number
Version 3.0.0 build 0
Copyright (C) 1998-2013 MIPS Technologies, Inc.
Communication port must be specified.
Use openport <port> to configure the communication port
1> openport sysnav-usb
sysnav-usb
You may want to verify your target connection using the status command:
2> status
Chassis type= sysnav
Host comm
= usb-hs
3>
You need to configure the debugger to correspond to the bus width of the CPU you have. If you
are using a 16-bit CPU (80186 mode), configure V188 to off (this is the default if you don’t
configure it). If you are using an 8-bit CPU (80188 mode), you must configure V188 to on:
3> config V188 on
on
4>
If you have a non-standard target connection, you can configure the RESET signal to be either
active-high (default) or active-low. The probe’s RESET driver may also be configured to opencollector mode. Use the config command options described in Appendix A.
Another configuration parameter you may need is AddressSize. Normally, the debugger can
automatically determine whether your system uses 20-bit or 24-bit physical addresses by
monitoring the first program fetch after reset. If your system uses a non-standard reset vector
(other than 0FFFF0, FFFF00, or FFFFE0), you need to override the automatic address size
detection using the config AddressSize command (see Appendix A).
One more parameter should be set before proceeding further. The TCK clock in the JTAG port is
required by the CPU to be at most 1/8 the rate of the CPU system clock. If the target board runs
the CPU at 4 MHz, then TCK can be no greater than 500kHz. The default TCK rate is the most
conservative speed available, 62500 Hz. For better performance, configure the TCK rate
according to your system using the config command:
4> config TckRate 500000
500000
5>
The debugger reset command issues a jtag reset instruction, then stops the CPU, unloads CPU
registers, and displays contents of memory at the CS:IP address.
5> reset
User reset.
FFFF:0000 EA000000FC
6>
jmp 0xfc00:0x0
Copyright (c) 2005-2013 MIPS Technologies, Inc. All rights reserved.
Page 8 of 27
Getting Started
VSA-186 Debugger
If your probe includes an Ethernet interface, and you wish to use Ethernet as the host/probe
transport in subsequent sessions with the probe, configure the probe Ethernet interface’s TCP/IP
settings. If your local network includes a DHCP server, the probe can be configured to obtain its
TCP/IP settings from DHCP (Ethernet probes ship with DHCP as the default, so this step is not
necessary when using the probe right out of the box):
6> netsetup dhcp on
dhcp on ip 255.255.255.255 netmask 255.255.255.255 gateway
255.255.255.255
7>
To integrate an Ethernet-enabled probe into a network that does not have a DHCP server, specify
the TCP/IP settings manually (substituting the values appropriate for your network):
7> netsetup dhcp off ip 192.168.0.7 netmask 255.255.255.0 gateway
192.168.0.1
dhcp off ip 192.168.0.7 netmask 255.255.255.0 gateway 192.168.0.1
8>
Changes in the TCP/IP settings do not take effect until the next time that the probe is powered on
in Ethernet mode. The TCP/IP settings are stored persistently in the probe flash memory, so
configuring these settings is typically something that needs to be performed only once.
4.2. System Navigator, Original Edition (OE) Hardware
This section details hardware specifications for the System Navigator, Original Edition (OE) probe.
4.2.1. Target Connection
The target connection is made with a 20-position flat ribbon cable with an AMP System 50
connector. This mates to AMP connector 104549-2 (vertical surface mount), 104069-1 (rightangle through-hole), or 104068-1 (vertical through-hole). The pinout of the target connector is
described in the following table.
Pin
2
Signal
DBRESET
I/O
O
Active
(1)
High
3
RESET
I
High
6
VCC
I
--
12
13
14
16
18
19
20
4, 8,
10, 15,
17
1, 5, 7,
9, 11
TDI
TDO
TMS
TCK
TRST#
DBINST#
BSEN#
GND
O
I
O
O
O
O
O
--
High
High
High
High
Low
Low
Low
--
N/C
--
--
(1)
Comments
Driven high by debugger to reset target system.
Typically hooked into the target power-on reset
circuitry.
Input to probe informs debugger that a target reset
has occurred.
Used by debugger to determine target power-on
state. Probe does not draw significant current from
this pin.
JTAG signal
JTAG signal
JTAG signal
JTAG signal
JTAG signal (optional)
Driven low by the probe.
Driven low by the probe.
Signal reference
Target should not connect to these pins.
Copyright (c) 2005-2013 MIPS Technologies, Inc. All rights reserved.
Page 9 of 27
Getting Started
VSA-186 Debugger
(1)
DBRESET and RESET may be configured either active-high or active-low. DBRESET
may also be configured with an open-collector driver (i.e. does not actively drive to the high
state). See the config command in Appendix A.
Interface levels on the probe connector are 3.3V TTL. Probe inputs must be driven below 0.8V
for logic 0 and above 2.0V for logic 1. Probe outputs actively drive signals up to 3.3V. ASIC
inputs must be able to accept 3.3V input levels or the target needs to have level shifters between
the probe and ASIC.
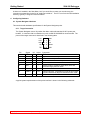
There is a keying notch on the connector to prevent mis-insertion, and the pins are numbered
sequentially along the short axis of the connector, as follows (top view):
19
1
20
2
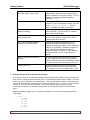
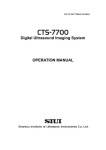
A typical system implementation of the probe interface is shown in the following schematic.
RESET SUPERVISOR
V86 DEICE ASIC
RESET
RESET
DEBUG CONNECTOR
DBRESET
RESET
1K
VCC
VCC
TCK
TMS
TDI
TDO
TCK
TMS
TDI
TDO
GND
The OR gate in the RESET path can be part of the reset supervisor or can be included in the
ASIC.
TCK is an edge-sensitive signal and should be routed carefully to avoid problems with
transmission-line effects or crosstalk.
4.2.2. Host Connection
The System Navigator, Original Edition (OE) probe connects to the host PC via an IEEE-1284
A-C type parallel cable and to the target system via a flat ribbon cable. A wall-mount power
supply provides DC power for the probe. There are no user serviceable parts in the system
analyzer or power supply.
Connect the parallel cable between your PC and the probe. Be sure the connectors are fully
seated and the connector latch is engaged. During initialization, debugger software checks for a
compatible port type and sets the port to EPP or ECP mode. It then follows the IEEE-1284
negotiation protocol to set the remote device to EPP or ECP mode. Meanwhile, the probe
initializes and waits for the negotiation information from the host.
Copyright (c) 2005-2013 MIPS Technologies, Inc. All rights reserved.
Page 10 of 27
Getting Started
VSA-186 Debugger
If the probe is power-cycled during operation, it will drop out of EPP or ECP mode and thus will
no longer be able communicate with the host. The next operation done on the host that requires
access to the probe will report this condition and allow the user to reestablish communication.
Connect the DC power supply to the receptacle on the back panel of the probe and insert into a
wall outlet.
Power on the probe, then the target. You should see the POWER LED illuminated indicating that
the probe is receiving power, and you may see the COMM LED illuminated, indicating that the
probe is waiting for the host PC to establish communication. The COMM LED will turn off when
the host establishes communication and will flash whenever there is communication traffic from
the PC. The BUSY LED flashes when the probe is communicating with the target. The RUN
LED is on when the target CPU is running.
If the probe is communicating correctly with the target, skip to section 4.2.3 otherwise review
setup procedures for the parallel port and the target connection.
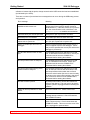
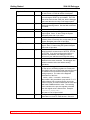
There are a number of port-related error messages that can occur during the parallel port setup
process and operation:
Error message
Meaning
Communication has not been
established with remote unit.
At initialization, the debugger attempts to reopen
the port used in the previous session (stored in
\windows\fs2.ini). If this fails or there is no previous
port, the communication is left uninitialized. Use
openport lptn to establish communication.
Communication port must be specified.
Attempted to open a port with a null name.
Specified port is not installed.
This parallel port does not exist on the PC.
Communication port must be lpt[1|2|3].
Attempted to open a port with a name other than
lpt1, lpt2, or lpt3.
Failed to open communication port.
The dynamic device driver lptacces.vxd is used to
open the port. This message will appear if
lptacces.vxd cannot be found or if Windows returns
an error from the open API call.
Failed to acquire communication port.
Another application has reserved the port. This
could be another window or it could be the
Windows port enumerator which runs periodically.
Parallel port device does not support
IEEE-1284 negotiation protocol.
The remote device does not respond to the
negotiation protocol. Either nothing is connected to
the port, the connected device is not a VSA
debugger, or the debugger is turned off.
Could not execute child process; check
installation.
Software attempts to run the child process
portloc.exe during initialization. This error occurs if
the program cannot be found. Reinstall the
software.
Device on parallel port is not an FS2
debugger.
Based on write/read tests of the remote device, it
does not appear to be a VSA debugger. Check
that you have specified the correct port and that the
debugger is powered up.
Copyright (c) 2005-2013 MIPS Technologies, Inc. All rights reserved.
Page 11 of 27
Getting Started
VSA-186 Debugger
Timeout in EPP transfer; check power
and cabling, then reinitialize
communications.
The built-in EPP timeout has been triggered. This
can be due to a parallel cable fault or a result of
powering off the debugger.
Debugger no longer in EPP mode;
check power and cabling, then
reinitialize communications.
If the debugger is power-cycled, it drops out of EPP
or ECP mode. Use openport to reestablish
communication.
4.2.3. Getting Started with System Navigator OE
Once the system is connected and powered on, you may want to verify some of the most basic
functions. First, initialize VSA-186 software and configure the port.
VAutomation System Analyzer for V8086 DEICE
Serial number 00102
Version 3.0.0 build 0
Copyright (C) 1998-2013 MIPS Technologies, Inc.
Communication port must be specified.
Use openport <port> to configure the communication port
1> openport lpt1
lpt1
2>
Substitute the port you are using for the “lpt1” above. If openport reports errors, refer back to
section 4.2.2 for details about the parallel port connection.
You need to configure the debugger to correspond to the bus width of the CPU you have. If you
are using a 16-bit CPU (80186 mode), configure V188 to off (this is the default if you don’t
configure it). If you are using an 8-bit CPU (80188 mode), you must configure V188 to on:
2> config V188 on
on
3>
If you have a non-standard target connection, you can configure the DBRESET and RESET
signals to be either active-high (default) or active-low. The probe’s DBRESET driver may also be
configured to open-collector mode. Use the config command options described in Appendix A.
Another configuration parameter you may need is AddressSize. Normally, the debugger can
automatically determine whether your system uses 20-bit or 24-bit physical addresses by
monitoring the first program fetch after reset. If your system uses a non-standard reset vector
(other than 0FFFF0, FFFF00, or FFFFE0), you need to override the automatic address size
detection using the config AddressSize command (see Appendix A).
Next, it is worthwhile to verify that the target Vcc is connected and is at a reasonable level. The
probe continuously samples the target Vcc and if it falls below a preprogrammed threshold,
output drivers from the probe are turned off to avoid driving signal pins of unpowered chips on the
target. This allows the target to be power-cycled with the probe connected.
3> status
tvcc = 5000 mV
cpurev = 0x9
address size = 20 bits
trace size = 256
trig count = 4
4>
Copyright (c) 2005-2013 MIPS Technologies, Inc. All rights reserved.
Page 12 of 27
Getting Started
VSA-186 Debugger
The value returned is the target voltage in millivolts. By default, the threshold voltage is 2500mV.
This can be changed using config TvccThreshold <millivolts> if desired. Also
displayed are the CPU’s DEICE version and several implementation-specific parameters.
One more parameter should be set before proceeding further. The TCK clock in the JTAG port is
required by the CPU to be at most 1/8 the rate of the CPU system clock. If the target board runs
the CPU at 4 MHz, then TCK can be no greater than 500kHz. The default TCK rate is the most
conservative speed available, 62500 Hz. For better performance, configure the TCK rate
according to your system using the config command:
5> config TckRate 500000
500000
6>
We are now ready to begin communicating with the V8086 DEICE. First, try just writing and
reading the IR. The IR and DR commands directly access the V8086 DEICE’s Instruction
Register and Data Register. Each IR command reads the current contents and replaces it with
the specified value, printing the original contents. Thus the value written in the first IR
command should appear as the value read in the second IR command. The value 0x75
(RESET) is a good value to test.
6> IR 0x75
01
7> IR 0x75
75
8>
Being able to read and write the IR is a good confirmation that the system is connected up
correctly. The debugger reset command issues the 0x75 instruction, then stops the CPU,
unloads CPU registers, and displays contents of memory at the CS:IP address.
8> reset
User reset.
FFFF:0000 EA0000E0FF
9>
jmp 0xffe0:0x0
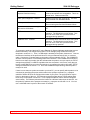
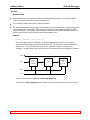
As a guide, here are the error messages you may see and what they mean.
Error message
Meaning
canceled
User pressed ESC before command completed.
Processor is already running.
A go or step command was given but the CPU
was already in the run state.
Processor is already stopped.
A halt command was given but the CPU was
already in the stopped state.
Operation cannot be performed while
emulating.
The CPU must be stopped before the operation
can be completed.
Minimum TckRate is 62500 Hz.
62500 is the slowest speed that the debugger
supports. This corresponds to a CPU clock rate of
500 kHz.
Copyright (c) 2005-2013 MIPS Technologies, Inc. All rights reserved.
Page 13 of 27
Getting Started
VSA-186 Debugger
Memory verify error. Address: %06X,
Expected: %04X, Actual: %04X
Attempting to write memory at the specified
address failed. Often this is due to attempting to
write to nonexistent or read-only memory. You can
disable the automatic verification using the
command verify 0.
RESET to CPU stuck in asserted state.
The debugger RESET input is continuously
asserted. If you are using the IPS board, you need
to use config IgnoreReset on because
there is no RESET available on this board.
Failed to complete transaction; check
power and cabling.
A command issued to the debugger from the host
never completed. This may be due to a cable or
power fault at the debugger.
CPU does not respond to stop requests.
CPU could be hung.
The debugger used the 0x11 STOP command but
the CPU never stopped. Most likely the CPU is
hung and will need to be reset.
There are not enough hardware
breakpoints to satisfy request.
The debugger determines whether to use a
hardware or software breakpoint based on the
writability of the program memory at the breakpoint
address. If not writable, a hardware breakpoint is
used. If the CPU doesn’t have enough free
breakpoint registers to handle all of the hardware
breakpoints set by the user, this message will
appear.
Cable to target is not connected
properly.
The cable SENSE pin (brown wire on IPS cable,
pin 4 on target connector) is not being pulled to
GND by the target. The cable may be disconnected
or loose or the connector pinout may be incorrect.
Target power is off.
A command requiring access to the target was
attempted while the target power was below the
Tvcc threshold. Power on the target and try again.
5. Getting Results with the Command-Line Interface
In the Console window, informational messages and command output (stdout channel) are shown in
blue, and error messages (stderr channel) in red. Command input (stdin channel) is black. Like Unix
shells, the Console maintains a command history. The command history number is shown as part of
the prompt and previous commands can be reexecuted using the form “!1” where “1” is the command
number, or “!!” for the previous command. You can also use the uparrow to recall previous
commands, and the last 10 commands are available for execution through the console’s History
menu.
Examine registers by typing “regs”. Note that the registers are in their reset configuration (CS:IP =
FFFF:0000):
2> regs
ax
bx
cx
dx
si
di
0000
0000
0000
0000
0000
0000
Copyright (c) 2005-2013 MIPS Technologies, Inc. All rights reserved.
Page 14 of 27
Getting Started
bp
sp
cs
ds
es
ss
ip
flags
VSA-186 Debugger
0000
0000
FFFF
0000
0000
0000
0000
0002
3>
You can always return to the reset condition by typing “reset”:
3> reset
User reset.
FFFF:0000 EA0000E0FF
4>
jmp 0xffe0:0x0
You may need to configure chip-selects before memory will be accessible. For the VAutomation
TIPS board, the command sequence to do this is usually:
4> size 2
2
5> word 0xffa2i 0x8038
6>
Not all TIPS boards are alike, however, so your system may be different. Now assemble a program
into memory.
4>
1
5>
1
6>
1
7>
3
8>
asm 0:0x1000 {inc ax}
asm {push ax}
asm {pop bx}
asm {jmp 0x1000}
The asm command returns an integer indicating the number of bytes that were written to memory.
Note that only the first asm command in a sequence needs to have an address specified; the asm
address is automatically updated after each command. Now disassemble memory to verify that the
correct data is present:
8> dasm 0:0x1000..+5
0000:1000 40
0000:1001 50
0000:1002 5B
0000:1003 E9FAFF
9>
inc ax
push ax
pop bx
jmp 0x1000
There are several things to note here. To enter an address range, you use the “..” operator followed
by either the ending address in the range (e.g. 0x1000..0x1007) or a length denoted by “+” (e.g.
0x1000..+5). All numbers entered on the command line default to decimal unless preceded by “0x”
for hexadecimal or “0” for octal. Command output does not always include the “0x” prefix when
showing hexadecimal values. We can also show the same memory range in a number of other
formats:
Copyright (c) 2005-2013 MIPS Technologies, Inc. All rights reserved.
Page 15 of 27
Getting Started
VSA-186 Debugger
9> dump 0:0x1000..+0x8 byte
0000:1000 40 50 5B E9 FA FF 00 00
10> dump 0:0x1000..+0x8 word
0000:1000 5040 E95B FFFA 0000
11> dump 0:0x1000..+0x8 long
0000:1000 E95B5040 0000FFFA
12> dump 0:0x1000..+0x8 byte decimal
0000:1000
64 80 91 233 250 255
0
0
13> dump 0:0x1000..+0x8 byte octal
0000:1000 100 120 133 351 372 377 000 000
14> dump 0:0x1000..+0x8 byte binary
0000:1000 01000000 01010000 01011011 11101001 11111010 11111111
00000000 00000000
15> dump 0:0x1000..+0x8 byte ascii
0000:1000 @P[éúÿ
16>
Execution is controlled using the reset, go, halt, bkpt, and step commands. You can set registers
using the Tcl command or Tcl variable:
16> cs 0
0
17> set ip 0x1000
0x1000
18>
The program can be single-stepped using the step command.
18> step
Single step.
0000:1001 50
push ax
19> ax
1
20> bx
0
21> step
Single step.
0000:1002 5B
pop bx
22> step
Single step.
0000:1003 E9FAFF
jmp 0x1000
23> ax
1
24> bx
1
25> step
Single step.
0000:1000 40
inc ax
26>
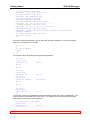
Tcl provides a rich set of commands to test and manipulate results and control command flow. Two
of the most useful commands are “if” and “while”. For example, we can set up a simple loop that
single steps the processor until ax reaches 4:
27> while {$ax != 4} {step}
Single step.
0000:1001 50
push ax
Single step.
Copyright (c) 2005-2013 MIPS Technologies, Inc. All rights reserved.
Page 16 of 27
Getting Started
0000:1002 5B
Single step.
0000:1003 E9FAFF
Single step.
0000:1000 40
Single step.
0000:1001 50
Single step.
0000:1002 5B
Single step.
0000:1003 E9FAFF
Single step.
0000:1000 40
Single step.
0000:1001 50
28> ax
4
VSA-186 Debugger
pop bx
jmp 0x1000
inc ax
push ax
pop bx
jmp 0x1000
inc ax
push ax
Note that the registers can be accessed either using the register name command (e.g. “ax”) or the
register name variable (e.g. “$ax”). Tcl allows you to build up expressions combining variables and
command results. The “byte”, “word”, and “long” commands return the contents of memory at the
specified address, so target variable values can also be included in expressions. The Tcl square
bracket operators are used around a command to use the command result in an expression. Here is
an example that steps the processor until the value at the top of the stack is 6:
55> while {[word $ss:$sp] != 6} {step}
Single step.
0000:1003 E9FAFF
jmp 0x1000
Single step.
0000:1000 40
inc ax
Single step.
0000:1001 50
push ax
Single step.
0000:1002 5B
pop bx
Single step.
0000:1003 E9FAFF
jmp 0x1000
Single step.
0000:1000 40
inc ax
Single step.
0000:1001 50
push ax
Single step.
0000:1002 5B
pop bx
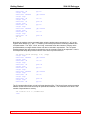
The CLI accepts either binary or Intel hex format download files. The binary format requires a starting
address and the hex format can accept an optional base address. The command return value is the
number of bytes written to memory.
56> load bin 0:0 "../readme.txt"
1249
Copyright (c) 2005-2013 MIPS Technologies, Inc. All rights reserved.
Page 17 of 27
Getting Started
VSA-186 Debugger
6. ESD Handling Precautions
The electronic components installed on the printed circuit board (PCB) are extremely sensitive to
Electro-Static Discharge (ESD). Ordinary amounts of static from your clothing or work
environment can damage or degrade electronic equipment. You should wear a grounding wrist
strap whenever you handle a printed circuit board. The grounding strap provides a conductive
path between your body and ground for discharging static electricity to ground.
When operating the FS2 System Navigator, ESD precautions must be observed to insure that the
unit continues to function correctly. These precautions would include but are not limited to:
Using ESD mats and wrist strap with the unit in a bench top configuration.
The use of an ESD strap connected, with a 50ohm resistor in series, to any attachable
metallic surface on the unit in any situation where ESD is a hazard.
In the unlikely event that the equipment may be subjected to power source surges, additional
surge protection in the form of a surge protected power strip is recommended.
Copyright (c) 2005-2013 MIPS Technologies, Inc. All rights reserved.
Page 18 of 27
Getting Started
VSA-186 Debugger
Appendix A. Debugger CLI Commands
Command syntax descriptions in Tcl use the “?” character to indicate optional parameters. Note that
the commands listed in this section are in addition to the built-in Tcl commands. A more detailed list
of debugger commands may be found in the online Debugger User’s Manual included with the VSA186 software. Detailed descriptions of built-in Tcl commands may be found in the online Tcl/Tk
Reference Manual included with VSA-186 software.
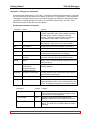
Configuration and Status Commands
command
syntax
purpose
version
version ?silent?
Display product type and version information. If
<silent> is specified, return a list of strings containing
the system type, version, copyright, and serial
number. This option might be useful to configure a
script based on the product version number.
openport
openport ?port?
Attempt to establish communication with debugger via
specified port. Save port in fs2.ini as the default.
help
help ?option?
Display syntax and brief description of commands.
status
status
Print host and target connection information.
test
test
Run the system selftest. Connect the flat cable to the
Loopback Board supplied with the debugger.
IR,DR
IR bytes…
DR bytes…
Access JTAG IR and DR. Write the specified
sequence and return the original IR/DR contents.
usblist
usblist
Return a list of available USB and network probes and
their port names.
netsetup
netsetup ?dhcp on|off?
?ip N.N.N.N?
?netmask N.N.N.N?
?gateway N.N.N.N?
Display or set the TCP/IP configuration for use with
Ethernet interface.
dropowner
dropowner <probename>
Forcibly disconnect the current probe owner from the
probe (network probes only).
getowner
getowner <probename>
Report the current probe owner (network probes only).
config
config <key> ?value?
Set or display specified configuration parameter.
Saves parameter in fs2.ini to be used as default in the
future. Configurable parameters are described below.
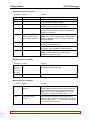
Parameter
Default
Purpose
TckRate
62500
Speed of JTAG TCK in Hertz. The CPU requires that
TCK be at most 1/8 of the CPU clock speed. 62500
is the slowest TCK rate supported.
TvccThreshold
2500
Target Vcc threshold in millivolts below which
debugger output drivers to the target are turned off.
TrigOutActiveState
0
Active logic state for the debugger’s TRIG OUT
signal. The TRIG OUT is asserted when the CPU is
emulating.
Copyright (c) 2005-2013 MIPS Technologies, Inc. All rights reserved.
Page 19 of 27
Getting Started
VSA-186 Debugger
TrigInActiveState
0
Active logic state for the debugger’s TRIG IN signal.
An active level on TRIG IN causes a breakpoint.
IgnoreReset
0
When 1, the RESET input from the target is ignored.
In some targets, RESET is not available. The CPU
can still be reset via the JTAG port, but the debugger
can’t reset the other circuitry on the target system.
Flash
{}
Sets the device type to use with the built-in target
flash programming feature. See the flash command
for details.
V188
off
Set to on for 8-bit (80188) systems, off otherwise.
DBRESETActiveState
1
Active logic state for the debugger’s DBRESET
output signal. Set to “0” when using the System
Navigator probe with 10 pin cable.
DBRESETOpenCollector
off
Set to on to configure the DBRESET driver to opencollector (does not actively drive to high state) for the
System Navigator probe with 10 pin cable.
RESETActiveState
1
Active logic state for the debugger’s RESET input
signal. Set to “0” when using the System Navigator
probe with 10 pin cable.
AddressSize
{}
If set, overrides the automatic address size algorithm
which checks for a reset vector of 0FFFF0, FFFF00,
or FFFFE0. If you have configured the V86 for a
different reset address, the debugger must be
informed of your address size through this setting.
ResetDuration
100
Length of time in milliseconds that DBRESET is
asserted in the reset command. The debugger also
waits this duration after reset before starting
operations.
RegHack
{}
Supplies the debugger with a series of port bits to set
or clear prior to unloading registers at a breakpoint.
The Classic V86 core requires that external interrupts
be disabled to avoid interference with the register
saving sequence. The value of the RegHack
parameter is of the form
<addr>, <size>, <or-mask>, <and-mask>, …
where addr is the port address (may include "i" or "u"
suffix to denote I/O or memory space), size is the
number of bytes, or-mask is OR'ed into the value and
and-mask is ANDed with the value. The resulting
value is written to the port, the registers unloaded,
then the original value is written back. Example:
0x1363i,1,0x00,0xF7
will clear bit 3 of I/O port 0x1363.
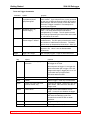
JtagChain
{}
Configures the debugger so it can address a CPU
embedded in a chain of JTAG devices. See next.
Copyright (c) 2005-2013 MIPS Technologies, Inc. All rights reserved.
Page 20 of 27
Getting Started
VSA-186 Debugger
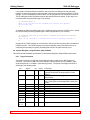
JtagChain
RESTRICTIONS
Each device in the JTAG chain must support the JTAG Bypass instruction. As specified in IEEE1149.1, the Bypass instruction encoding must be all 1’s.
The IR length of each device must be a known constant.
No device may depend on the number of clocks used to shift IR or DR contents. Only the initial value
of the shift register at CAPTURE_IR/DR and the final value of the shift register at UPDATE_IR/DR
may be relied upon. For example, a device which counts DR clocks to decide what type of action to
perform may not exist on the JTAG chain when using multiple cores.
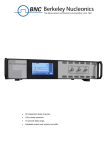
SYNTAX
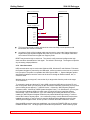
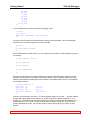
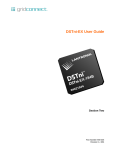
config JtagChain [n|X [,n|X...]]
The configuration value for JtagChain is a comma-separated list of devices. Each device is
represented by the length of its Instruction Register (IR). The V86 device is represented by the
character “X”. The first device in the list is the one closest to the TDO pin leading to the
debugger. The last device is the one closest to the TDI pin leading from the debugger. Example:
TD O
TD I
O ther
c ore
(IR= 8)
V 86
O ther
c ore
(IR= 4)
TMS
TC K
This circuit should use the command config JtagChain 4,X,8.
The default is config JtagChain X which means that only the V86 is present in the JTAG chain.
Copyright (c) 2005-2013 MIPS Technologies, Inc. All rights reserved.
Page 21 of 27
Getting Started
VSA-186 Debugger
Emulation Control Commands
command
syntax
purpose
reset
reset ?all|cpu|target?
Reset the target and/or CPU. Stops emulation.
go
go
Start emulation at the current execution address.
gr
gr
Start emulation directly from reset.
halt
halt
Stop emulation immediately. Displays next execution
address and one instruction disassembly.
step
step ?count?
Execute <count> instructions, then display next
execution address and one instruction disassembly.
Default is 1 instruction.
bkpt
bkpt ?set <addr> | setsw
<addr> | sethw <addr> |
clear <addr> | clear all?
Manipulate the breakpoint list. Set or clear individual
breakpoints, or clear all breakpoints. Breakpoints are
stored by their linear address. Returns a list of all
active breakpoints.
running
running
Return 1 if CPU is emulating, 0 if stopped. Also
available as variable $running.
brktype
brktype
Return numeric code for the type of the most recent
breakpoint. Also available as variable $brktype.
brktext
brktext ?type?
Return descriptive string for the type of the most
recent breakpoint (default), or another type of
breakpoint specified by <type>.
Register Access Commands
command
syntax
purpose
ax, bx, cx,
dx, si, di,
bp, sp, cs,
ds, es, ss,
ip, flags
ax ?value?, bx ?value?,
etc.
Set or return the value of a CPU register. Also
available as variables $ax, $bx, …
regs
regs ?hex|decimal|octal?
Display all CPU registers in specified radix.
Memory Access Commands
command
syntax
purpose
byte
byte <addr-range>
?bytes…?
Set or return the contents of CPU memory or I/O.
Can be used to fill large memory areas with patterns
(byte 0..0xffff 0), write an enumerated list of values
(byte 0:0 1 2 3 4 5), or read memory for use in an
expression ( if { [byte 0:0x1000] == 0x41 } {…} ).
word
word <addr-range>
?words…?
Set or return the contents of CPU memory or I/O.
Values to write or read are interpreted or returned as
words (16 bits). Use size to control the type of bus
cycle used to access memory.
Copyright (c) 2005-2013 MIPS Technologies, Inc. All rights reserved.
Page 22 of 27
Getting Started
VSA-186 Debugger
long
long <addr-range>
?longs…?
Set or return the contents of CPU memory or I/O.
Values to write or read are interpreted or returned as
longs (32 bits). Use size to control the type of bus
cycle used to access memory.
dump
dump <addr-range>
?byte|word|long?
?hex|decimal|octal|binary|
ascii?
Display contents of memory in tabular format. Can
format as bytes (8-bit), words (16-bit), or longs (32-bit)
and in any of the listed radices.
copy
copy <from-addr-range>
<to-addr>
Copy memory from <from-addr-range> to <to-addr>.
Number of bytes copied is determined by the length of
<from-addr-range>. Copy works correctly even for
overlapping ranges. Return number of bytes copied.
search
search <addr-range>
<bytes…>
Find byte pattern in <addr-range>. Return address of
start of byte pattern if found or null string if not found.
compare
compare <from-addrrange> <to-addr>
Compare memory in <from-addr-range> to <to-addr>.
Number of bytes compared is determined by the
length of <from-addr-range>. Return {} if ranges are
identical, the mismatch address if not.
sum
sum <addr-range> ?byte |
long?
Return checksum of memory range. Sum is done
either by byte or long (ignoring overflows).
flash
flash ?set <addr-range> |
clear <addr-range> | clear
all | reset <addr> | erase
sector <addr> | erase
chip <addr>?
Set, clear, or display ranges of memory specified as
occupied by flash memory instead of RAM. Writes to
this range are subsequently done using flash write
algorithm. Returns the cumulative list of flash address
ranges. This command also has option for resetting
or erasing a flash device, or erasing a single flash
sector. Most flash devices must be erased before
reprogramming. The flash device type is configured
with the config flash command.
load
load <hex ?base-addr? |
bin <addr>> <filename>
Download bytes from a host file into target memory.
File may be either Intel hex or binary. Hex allows an
optional offset to be added to the address; binary
requires specification of the beginning address.
Returns the number of bytes loaded into memory.
dasm
dasm ?-noupdate? ?addrrange?
Display CPU instructions read from memory. Update
dasm address to next address unless –noupdate
specified.
asm
asm ?addr? “instruction”
Convert <instruction> text into bytes and write into
memory at <addr>. Update addr to next location in
memory.
verify
verify ?0 | 1?
Set or display whether memory writes are followed by
a read to verify that the write completed correctly.
Default=0. Also available as variable $verify.
size
size ?0 | 1 | 2 | 4?
Set or display type of bus cycle used to access
memory. 1=byte, 2=word, 4=long, 0=don’t care.
Default=0. Also available as variable $size.
Copyright (c) 2005-2013 MIPS Technologies, Inc. All rights reserved.
Page 23 of 27
Getting Started
VSA-186 Debugger
Trace and Trigger Commands
command
syntax
purpose
tracemode
tracemode
?cycle|branch|timer?
?pre|center|post?
Set or display trace collection parameters for the next
trace session. Cycle collects all bus cycles generated
by the core or DMA unit; Branch collects all execution
path changes; and timer records a frame with a timer
each time a trigger is satisfied. Pre/center/post is
currently not supported.
showtrace
showtrace [info | all |
<frame-range>]
Return a list of strings representing the last collected
trace. The result can be stored in variables or
manipulated by Tcl scripts. The info option returns a
list of strings representing the trace mode and number
of valid frames in the trace.
printtrace
printtrace ?info | all |
<frame-range>? ?dasm?
Display a formatted representation of the last
collected trace. The info option prints the trace mode
and number of valid frames in the trace. The dasm
option saves as disassembled instructions. Alias=”pt”.
savetrace
savetrace ?w|a? ?dasm?
Save trace buffer to file. “w”: overwrite file. “a”:
append to file. “dasm”: save as disassembled
instructions.
trigger
trigger ?id? ?flags?
Set or display triggers. Flags are described below.
flag
values
purpose
-mode
off, arm, mask, range, cycle,
execution
Set mode for trigger:
Off=trigger is not used.
Arm=sequence of trigger 1-2 or trigger 3-4.
Mask=value/mask pair in trigger 1/2 or 3/4.
Range=addr range in trigger pair 1/2 or 3/4.
Cycle=addr and cycle type match.
Execution=addr executed.
-addr
<address>
Address for trigger.
-data
<data>
Data for trigger. Used only in mask mode.
-cycle
intack, iord, iowr, halt, fetch,
memrd, memwr, any
Cycle type for trigger. Used only in arm and
cycle modes. V86 Turbo also uses this in
Range mode.
-count
<8-bit value>
Trigger occurs when satisfied <count>
times. A count of zero disables the trigger.
-trace
--
Trigger is configured as a trace qualifier.
Will cause the satisfying cycle to be
recorded in the trace but will not break
emulation.
-break
--
Trigger is configured to break emulation.
-clear
--
Clear trigger to default (off) state.
Copyright (c) 2005-2013 MIPS Technologies, Inc. All rights reserved.
Page 24 of 27
Getting Started
VSA-186 Debugger
Trigger examples:
trigger 1 -mode cycle -addr 0x1234 -cycle memwr -break
Break emulation when a write occurs to memory address 0x1234.
trigger 1 -mode execution -addr 0x1234 -break
Break emulation when the instruction at address 0x1234 is about to be executed.
trigger 1 -mode arm -addr 0x1234 -cycle memwr -break
trigger 2 -mode arm -addr 0x5678 -cycle memrd -break
Break emulation when a write to memory address 0x1234 is followed by a read from
memory address 0x5678.
trigger 1 -mode cycle -addr 0 -cycle intack -count 4 -break
Break emulation when the fourth interrupt acknowledge cycle (IACK1) occurs.
trigger 1 -mode cycle -addr 0xff80 -cycle iowr -trace
Record only writes to I/O address 0xff80 in the trace.
trigger 1 -mode cycle -addr 0xff80 -cycle iowr -trace
trigger 2 -mode cycle -addr 0xff82 -cycle iord -trace
Record writes to I/O address 0xff80 and reads from address 0xff82 in the trace.
trigger 1 -mode mask -addr 0xff80 -data 0x0041 -break
trigger 2 -mode mask -addr 0xffff -data 0x00FF -break
Break emulation when a write to I/O address 0xff80 occurs with 0x41 on the lower data
bus.
trigger 1 -mode mask -addr 0x00000 -data 0x0000 -trace
trigger 2 -mode mask -addr 0xFFC00 -data 0x0000 -trace
Record all writes to the interrupt vector table (memory address range 0..0x3FF).
trigger 1 -mode range -addr 0x001434 -trace
trigger 2 -mode range -addr 0x001833 -trace
Record all writes to a 1K block of memory starting at 0x1434.
trigger 1 -mode range -addr 0x000000 -break
trigger 2 -mode range -addr 0x0003FF -break
trigger 3 -mode range -addr 0x013468 -break
trigger 4 -mode range -addr 0x0FFFFF -break
Break emulation if the program branches outside the range of the program (in this
example the program occupies 0x00400..0x13467).
Copyright (c) 2005-2013 MIPS Technologies, Inc. All rights reserved.
Page 25 of 27
Getting Started
VSA-186 Debugger
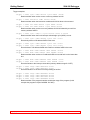
Appendix B. System Navigator OE Probe AC/DC Parameters
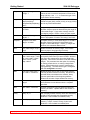
DC Characteristics
Description
Symbol
Min
Max
Unit
Input low voltage
VIL
-0.5
0.8
V
Input high voltage, TDO, RESET, TriggerOut
VIH
2.0
5.5
V
Input current, TDO, RESET, TriggerOut (VIN 3.6V)
IIL, IIH
-10
+10
A
Input voltage, VCC
VVCC
5.5
V
Input current, VCC
IVCC
5.0
mA
Input capacitance
CIN
10
pF
Output low voltage
VOL
0.0
0.4
V
Output high voltage
VOH
2.4
3.5
V
Output current
IOL, IOH
-12
+12
mA
JTAG Switching Characteristics
Description
Symbol
Min
Max
Unit
5.0
ns
Output delay from TCK falling to TDI, TMS
TTCKTDI
-5.0
TDO Setup time before TCK rising
TTDOTCK
25
TDO Hold time after TCK rising
TTCKTDO
0
TCK period
TTCK
ns
ns
(1)
125
DC
(2)
ns
(1)
The TCK frequency is required to be less than the CPU clock frequency. The 125ns period
specification is the fastest TCK that the probe can generate.
(2)
TCK toggles only during JTAG transactions. When TCK stops, it is held in the low state. During
JTAG transactions, the maximum TCK period generated by the debugger is 16 s. The TCK
period is controlled using the config TckRate command.
TC K
TT C K
TMS , TD I
TT C K T D I
TD O
TT D O T C K
TT C K T D O
Copyright (c) 2005-2013 MIPS Technologies, Inc. All rights reserved.
Page 26 of 27
Getting Started
VSA-186 Debugger
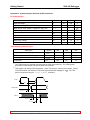
Appendix C. System Navigator Probe AC/DC Parameters
DC Characteristics
Description
Condition
Symbol
Min
Max
Units
Input low voltage
1.5
VVIO < 5.0
VIL
-0.5
0.7
V
Input high voltage
1.5
VVIO < 2.5
VIH
0.7 * VVIO
5.5
V
2.5
VVIO < 5.0
1.7
5.5
V
VVIO
1.5
5.0
V
Input current
IIL, IIH
-10
+10
A
Input current, VIO
IIL, IIH
5.0
mA
Output low voltage
VOL
0.0
0.45
V
VOH
0.85 * VVIO
VVIO + 0.3
V
Input voltage, VIO
when stable
Output high voltage
1.5
VVIO < 2.8
2.8
VVIO < 3.3
2.4
VVIO + 0.3
V
3.3
VVIO < 5.0
2.4
3.6
V
-12
+12
mA
Min
Max
Units
1.0
ns
Output current
IOL, IOH
JTAG Switching Characteristics
Description
Symbol
Output delay from TCK falling to TDI, TMS
TTCKTDI
-1.0
TDO Setup time before TCK rising
TTDOTCK
4.5
TDO Hold time after TCK rising
TTCKTDO
0
TCK period
(1)
TTCK
15
ns
ns
DC
(1)
ns
TCK is active only during JTAG transactions. When TCK stops, it is held in the low state. During
JTAG transactions, the maximum TCK period generated by the probe is 983 s. The period is
controlled using the config tckrate command.
TCK
T TC K
TM S , T D I
T TC K TD I
TDO
T TD O TC K
T TC K TD O
Copyright (c) 2005-2013 MIPS Technologies, Inc. All rights reserved.
Page 27 of 27