1
gemiusExplorer 5.6
User’s guide
Copyright © Gemius SA 2012
Contents
1
Introduction ......................................................................................................................... 4
1.1 Basic information..................................................................................................................... 4
1.2 Installation and updates .......................................................................................................... 4
2
First steps ............................................................................................................................. 5
2.1 Opening the dataset ................................................................................................................ 5
2.2 GEM Library ............................................................................................................................. 8
2.3 Application view .................................................................................................................... 10
2.4 Research results analysis ....................................................................................................... 12
3
Modes of analysis ............................................................................................................... 15
3.1 Audience analysis .................................................................................................................. 15
3.2 Ranking by selected metric ................................................................................................... 15
3.3 Duplication analysis ............................................................................................................... 18
3.4 Defining default mode and ranking parameters ................................................................... 19
3.5 Mobile analysis ...................................................................................................................... 21
3.6 Pausing data recalculation .................................................................................................... 21
3.7 Undo/Redo option................................................................................................................. 22
4
Metrics selection and data presentation.............................................................................. 23
4.1 Metrics selection ................................................................................................................... 23
4.2 Cost Per Mille ........................................................................................................................ 25
4.3 Data sorting ........................................................................................................................... 26
4.4 Metrics summary................................................................................................................... 26
4.5 Selection and deselection of groups of nodes ...................................................................... 27
4.6 Site searching ........................................................................................................................ 29
4.7 Table view.............................................................................................................................. 29
4.8 Website names presentation ................................................................................................ 31
4.9 Presentation of nodes below minimum rating ..................................................................... 32
4.10 Presentation of nodes with different colours ....................................................................... 32
5
Target group definition ....................................................................................................... 34
5.1 Defining a target group ......................................................................................................... 34
Basic information about target groups.................................................................................. 34
Defining new target groups ................................................................................................... 34
Options available when defining target groups .................................................................... 35
Buttons for adding and deleting target groups ..................................................................... 36
Introduction
2
Saving and loading target group definitions.......................................................................... 36
Defining age intervals ............................................................................................................ 36
5.2 Reference group editor ......................................................................................................... 38
Basic information about the Reference group editor ........................................................... 38
Defining the reference group ................................................................................................ 38
5.3 First nodes selection .............................................................................................................. 41
5.4 Target groups cross tables..................................................................................................... 42
Application of target groups cross tables .............................................................................. 42
Creating target groups cross tables ....................................................................................... 43
6
Periods definition ............................................................................................................... 45
6.1 Defining periods .................................................................................................................... 45
6.2 Saving and loading the periods definitions ........................................................................... 46
7
Aggregates tree .................................................................................................................. 47
7.1 Defining a new aggregates tree............................................................................................. 47
7.2 Operations on aggregates trees ............................................................................................ 48
7.3 Sorting nodes of an aggregates tree ..................................................................................... 49
7.4 Saving an aggregates tree ..................................................................................................... 50
8
Data saving and exporting ................................................................................................... 51
8.1 Data export ............................................................................................................................ 51
8.2 Saving an analysis .................................................................................................................. 52
9
Definition of terms.............................................................................................................. 54
10
Contact............................................................................................................................... 58
Introduction
3
1
Introduction
1.1 Basic information
This user’s guide describes the possibilities and methods of using the gemiusExplorer 5.6
application.
gemiusExplorer is special analytical software that enables the analysis of a website audience research
results.
1.2 Installation and updates
gemiusExplorer can be installed on computers working under Windows operating system. It is also
adapted to work under other operating systems using Windows emulator like Wine (platforms:
FreeBSD, Linux, Solaris) or CrossOver (platforms: Mac OS 10, selected Linux distributions) . During
opening application checks whether it is launched on Windows or Wine/CrossOver and adapts the
user interface.
Double click on the application installation file to install gemiusExplorer.
In the application automatic update is enabled by default. To disable this option go to the Tools
menu, gemiusExplorer options... and uncheck the Check for updates at start up checkbox in the
Miscellaneous tab. In order to download the application update manually, one should choose Check
for updates... in the Help menu.
Introduction
4
2
First steps
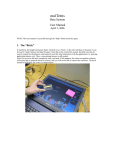
2.1 Opening the dataset
In order to analyse a website audience, one has to use the option Open... in the File menu. The
dataset can also be opened with the icon
, or the shortcut Ctrl+O.
While opening the site with audience files the authorization process is being conducted – one has to
enter login and password and then press the button Send. Data is sent to the authorization server
where it is verified. If the user is approved to get access to a particular dataset, the file is loaded.
Figure 1
Login window
NOTE: during authorisation of the licence, a user’s computer has to be able to connect to the
internet. If you connect to the internet through a proxy server, you should configure the settings in
the File menu, the Proxy settings... option.
In the application, a few files can be opened within one analysis. This option enables analysis of
trends in an easy way. In order to open more than one file within one analysis, choose the Open in
one analysis... option in the File menu, or choose the icon as shown below, or type Ctrl+Shift+O.
First steps
5
Figure 2
Opening a few files in one analysis
By choosing the Add files to the analysis... option in the File menu, or clicking the icon
additional files can be added to the analysis.
, the
As the media tree within a few files can differ, one can switch between tree views. By default, the
tree from the latest period of time is shown. To change the view of the tree, choose the proper tab.
Figure 3
Tabs with different media trees
In the picture above the view of Media tree from the file marked as “12.2008” has been chosen.
Using the option Remove files from the analysis... in the File menu opens the dialogue window
where files to be closed and excluded from the analysis can be chosen.
First steps
6
Figure 4
Removing files from analysis
It is also possible to open more than one file at the same time, but in separate analysis. To do that,
one should press and hold the Ctrl key when choosing the files.
Moreover, the application can automatically load the recently opened file at the start of the
application. In order to do so, one should choose the appropriate option from the Tools menu, submenu gemiusExplorer options… , Miscellaneous tab.
Changing a password
To change the password to your login, go to the Tools menu, gemiusExplorer options... and choose
the gA password tab.
First steps
7
Figure 5
Changing password window
2.2 GEM Library
Gem library displays the list of the files that user is granted licenses to, allows to download the new
files from the Internet and to search for the files by different filters within the library. The basic
advantage of this feature is the transparent structure of the file list and the simple possibility of
selecting the files for analysis.
In order to display .gem library window choose My .GEM library from File menu and log in using your
standard login and password to gemiusExplorer. Files available for the user are going to be displayed.
First steps
8
Figure 6 My .GEM Library window
There are a few columns available in My .GEM Library window (see Figure 6):
1 – Study informs about study names which .gem files refer to.
2 – Period presents date periods available in .gem files.
3 – Fines shows the range of data periods available in .gem files.
4 – Version serves to choose the way of downloading new .gem files from the Internet
(client-server or regular - if possible for the file). Choosing auto option means that in the first step
program will choose the version which is already available on the local disc. In the second step, if
both or none of the versions are available on the local disc, the program will choose the preferred
version, which can be set by the user in My .GEM Library window.
5 – Status column informs whether the .gem files are already present in the local directory set as
Default database files location (the location of the directory can be easily changed in Tools menu,
gemiusExplorer options… sub-menu, Miscellaneous tab) or are ready to be downloaded from the
Internet.
In My .GEM Library window the Update button serves to update the list of the files available for
gemiusExplorer user. The list is automatically updated during the launch of the program, but one can
manually update the list also when the program is running. On the other hand, the Stocktake button
serves to update the information (Present/Download in Status column) about the files stored in the
Default database files location. E.g. if one removes some of the files from the Default database, the
column status will be updated after pressing the Stocktake button – the status of removed files will
change from Present to Download.
Gem library allows also to filter the files shown on the list by studies, periods and fines. In order to
set the filter one should click on the
icon near the appropriate column in My .GEM Library
window and define the desired filter. Additionally, by clicking on the headline of each column one
can sort the files ascending or descending.
First steps
9
To select a few files to open tick
on the left side of the window. It is possible to tick only the files
which are already downloaded (status Present).
In order to open selected files press the Open button
in the right bottom. All selected files will be
opened in one analysis. When opening My .GEM Library the next time (during the same
gemiusExplorer session) it will be possible to either open the next selected files in other analysis
(Open button
) or add these files to the analysis already opened (Add button
).
2.3 Application view
Basic information
Data can be presented in three navigation panels. On the left side, there is a panel with the media
tree (on the top of the figure shown below) and a panel with the aggregates tree (on the bottom),
whereas on the right side, there is a panel with the table presenting the research results.
First steps
10
Figure 7
Application view
Types of nodes
The media tree panel presents nodes of websites (icon
can be divided into different sections (icon
(icon ).
). A website can be presented as a whole or
). Websites can be also grouped into some categories
The aggregates tree panel enables one to load or define any alternative trees. The aggregates nodes
are marked with the icon . Detailed information about defining the aggregates trees is provided in
chapter 7 “Aggregates tree” on page 47.
Changing panel size and position
The panels can be moved and their position or size can be changed. It is also possible to close the
media tree or aggregates tree panel – one only has to click the closing button “x”. In order to switch
on any of these two panels, one has to use the options Media tree or Aggregates tree in the View
menu.
Media tree and aggregates tree panels can be hidden as well. In order to do that, the icon
should
be clicked. To unhide a panel, a proper tab (Media trees or Aggregates trees) on the left should be
chosen and icon
clicked.
First steps
11
Application language version
One can choose one of the following application language versions: Polish, English, Czech, Russian,
Hungarian, Slovak, Danish or Bulgarian.
It is possible to change the language of the application by clicking the appropriate position from the
Languages bar pull-down menu, or choose it from the Application language sub-menu in the
Language menu. By default, the Languages bar is turned off (one can change it by selecting the
Languages bar option in the View menu).
Data language version
It is possible to choose the language version of the target groups parameters and values:
Default – the local language of the country that the research was conducted for;
English.
Application theme
Changing the application theme is possible by choosing a proper theme from the Windows theme
sub-menu, in the View menu.
2.4 Research results analysis
In order to check what the audience of a website we are interested in is, one should select that site in
the left panel (Media trees or Aggregates trees). After that, in the right panel the table with basic
statistics is presented: number of visitors (real users), number of page views, average time spent on
the site per visitor (real user), reach and audience composition in the given target group.
The nodes from the media tree and aggregates tree can be analysed at the same time – one just has
to select particular nodes from each tree.
By default, the right panel presents top 20 of the websites. To display only the websites one needs to
choose the Deselect all nodes option and then select the ones of interest.
First steps
12
Figure 8
Presentation of data for nodes from the media tree and aggregates tree
The operations carried out most frequently are as follows:
selection of presented metrics (e.g. the display of data for the “average page view duration”
metric) – see chapter 4.1: “Metrics selection” on page 23;
data sorting (e.g. decreasingly by the number of page views) – see chapter 4.3 “Data sorting”
on page 26;
quick selection of nodes (e.g. selection of all websites from the collecting node) – see chapter
4.5 “Selection and deselection of groups of nodes” on page 27;
target group definition (e.g. data analysis for the target group defined as “men” or for the
group defined as “women with higher education”) – see chapter 5 ”Target group definition”
on page 34;
definition of age intervals in target group (e.g. definition of target group “persons aged 2030”) – see chapter ”Defining age intervals” on page 36;
definition of periods (e.g. analysis of data only for week days or for one selected day) – see
chapter 6 “Periods definition” on page 45;
definition of aggregates tree – see chapter 7.1 “Defining a new aggregates tree” on page 47;
exporting data to an Excel or CSV file – see chapter 8.1 “Data export” on page 51;
First steps
13
saving an analysis (e.g. in order to be able to analyse the results next day and have the right
websites selected in the application already, required metrics displayed, target groups
defined, etc.) – see chapter 8.2 “Saving an analysis” on page 52.
First steps
14
3
Modes of analysis
The data is available in the following modes of analysis:
audience analysis – this enables one to conduct any analysis according to the criteria defined
by the analyst; data for nodes that an analyst selects in the media tree or aggregates tree are
presented. For detailed information see chapter 3.1;
ranking by selected metric – data for nodes according to defined metrics (for example:
number of visitors (real users), page views, time). For detailed information see chapter 3.2.
NOTE: the default mode of analysis can be defined in the option gemiusExplorer options... in the
Tools menu – see chapter 3.4 ”Defining default mode and ranking parameters” below.
3.1 Audience analysis
In order to conduct one’s own audience analysis (e.g. a comparison of results for several websites)
the proper nodes should be selected in a tree.
The table panel with research results presents information about nodes selected in media tree or
aggregates tree – marked as . The easiest way of selecting one node is by clicking on the checkbox
on the left side of a node name. In that case, next to the node name icon
appears. The chosen
node can be deselected by clicking on the above-mentioned checkbox, or by hitting "Delete" button
on the selected row in the table. It is possible to speed-up marking nodes by holding the Ctrl key
when making the choice. Statistics will be calculated after releasing the Ctrl key.
It is also possible to carry out many analyses on one file at the same time. In order to do this, one has
to choose the Insert new analysis option from the Analysis menu. A new window with data will
appear (the windows are numbered). In order to close an analysis, one has to choose the Close
analysis option from the same menu or use the closing icon in the top right hand corner of the
window.
NOTE: closing the last analysis will cause the total closing of the file.
In order to remove all the parameters of an analysis (selected nodes in a tree, periods, target
groups), one has to either choose the Reset analysis option from the Analysis menu, or click the icon
, or use shortcut Ctrl+R.
3.2 Ranking by selected metric
In order to analyse data for selected nodes, one has to click the icon
(or choose the option
Ranking… from the Analysis menu, or type Alt+2) which opens the window where one can choose
parameters for the analysis. It is possible to choose:
metric;
target group;
Modes of analysis
15
period;
number of nodes to show;
type of a node;
attribute of a node.
Figure 9
Ranking parameters
In order to switch from ranking mode, one has to select (or deselect) any site in the tree, or click the
icon
(or choose the option Audience analysis in the Analysis menu, or type Alt+1).
EXAMPLE: to look for 10 websites with the highest number of visitors in the target group “women”:
first of all we define the target group “women” (see chapter 5.1 “Defining a target group” on
page 34);
we click the icon
in the dialogue window we choose reach as a metric and set the correct number of nodes
that are going to be presented (in this case: 10) and the type of nodes that should be
considered (in this case the option “sections” should be selected).
, or choose the option Ranking... in the Analysis menu;
Modes of analysis
16
Figure 10 Ranking parameters definition
As a result we receive the 10 websites visited by the highest number of women.
Figure 11 Ranking result
Modes of analysis
17
3.3 Duplication analysis
Duplication analysis allows to generate in a simple way a report about the audience duplication of
the websites in a given period of time. The results of analysis are generated in a form of cross table
where in rows and columns the names of chosen nodes are presented and in cells - the value of
audience duplication of each pair created upon the intersection of the nodes.
Definitions of indicators in duplication analysis are available in chapter 9 page 54.
In order to conduct the duplication analysis in gemiusExplorer choose the Duplication Analysis in
Analysis menu, click on the icon
available in the toolbar or press Alt+3.
The window for defining the duplication analysis will be displayed:
Figure 12 Duplication analysis window
To define nodes in rows and in columns press
button, then choose the desired nodes by
selecting or deselecting them in the media tree displayed on the left side in gemiusExplorer and next
press OK. Swap button
allows to exchange all nodes that were on the left list (rows) with all
nodes that were on the right list (columns). It means that nodes that were previously in rows will be
now in columns and vice versa. To displace nodes from one list (rows or columns) to the second one,
drag to select desired nodes and then press one of the buttons
or
. In order to remove a
few or all nodes from rows or columns list, drag to select nodes and then press Delete on your
keyboard. To finish press OK.
Modes of analysis
18
The cross table with selected nodes will be displayed in gemiusExplorer:
Figure 13 Cross table with Duplication analysis
In order to see cross tables for different metrics of Duplication Analysis one should change between
the tabs above the displayed table.
After conducting Duplication Analysis one can still remove nodes from the analysis by deselecting
them from the Media tree on the left side. One can also add new nodes to the analysis by selecting
them from the Media tree on the left side:
Figure 14 Adding / removing nodes to Duplication Analysis
3.4 Defining default mode and ranking parameters
In order to define the default mode of analysis or ranking parameters, one has to choose the option
gemiusExplorer options… in the Tools menu and then go to the Default ranking tab.
Modes of analysis
19
Figure 15 Ranking settings
It is possible to open the files in three modes:
reach ranking;
page view ranking;
no ranking.
The proper mode can be set with the use of the option Open mode.
The ranking presents the number of nodes that was defined in the option Number of nodes to show.
In order to change the default number, one has to choose it from the list, or simply type it in.
It is also possible to define the type of nodes that are to be taken into account in the ranking (the
option Consider):
sections – the nodes that are a part of a website;
domains – websites
domains groups – group nodes of domains
categories – collecting nodes with websites grouped into categories;
messengers – internet messengers;
other applications;
aggregates – collecting nodes that group many nodes, presented in aggregates tree.
Modes of analysis
20
Apart from types of nodes, it is also possible to determine their attributes:
weighted/not weighted;
reported consent for advertisement emission/other (option);
chats/other than chats (option).
3.5 Mobile analysis
Mobile analysis allows to generate a report presenting the views of the websites performed on
mobile devices in a given period of time. The table panel with analysis results presents information
about nodes selected in media tree or aggregates tree but only these for which mobile data are
available.
The indicators in presented in mobile analysis are the special mobile indicator available only for this
analysis.
In order to conduct the mobile analysis in gemiusExplorer choose the Mobile View in Analysis menu,
click on the icon
displayed:
available in the toolbar. The window for with the mobile analysis will be
Figure 16 Mobile analysis
3.6 Pausing data recalculation
By default, data is recalculated while making any change – selecting/deselecting a node,
adding/removing a target group. To pause data recalculation, use the icon Do not recalculate data
. After selecting all necessary nodes, define target groups and indicators, and press the icon
again.
This option is useful when making an analysis based on many nodes, target groups, indicators as it
can speed up the data calculation (data is calculated only once).
Modes of analysis
21
3.7 Undo/Redo option
The Undo/Redo option is a tool which allows to cancel the unwanted actions or repeat the
operations which were previously cancelled. It can be applied for all actions which are performed on
the data, e.g. selecting nodes from Media tree, defining periods or target groups, conducting the
Duplication Analysis, etc.
The Undo/Redo option cannot be applied for actions concerning the layout of gemiusExplorer, like
adding or removing metrics from the table, changing the appearance of the tables, adding or
removing the toolbars, etc.
In order to cancel or repeat action one should either choose the Undo/Redo in Edit menu, click on
the icon
in the toolbar or use the combinations Ctrl+Z / Ctrl+Y.
It is possible to cancel or re-perform up to 10 operations with the Undo/Redo tool.
Modes of analysis
22
4
Metrics selection and data presentation
4.1 Metrics selection
It is possible to present in the table information about many different metrics (e.g. number of page
views, reach, time share etc.) describing the audience of a particular node.
The fastest way of selecting the metrics which data will be presented for, is to right click on the head
of the table. The list of all available metrics will appear.
The metric of interest can be chosen by clicking on its name. The metrics which data is presented for
are marked with
. The column with the metric can be hidden by clicking on it using the middle
mouse button. Metrics can also be selected in the menu Analysis, the option Choose metrics to
show….
The analysis of the following metrics can be conducted:
Basic
No.;
Visitors (real users);
Page views;
Time;
Sessions;
Visitors Reach-Internet;
Basic – other averages
Avg. page view duration;
Avg. page views per visitor;
Avg. time spent per visitor;
Avg. working time per application
Avg. sessions per visitor;
Other
Type – information on what type (site, service, chat, messenger, category, aggregate) a given
node is.
Node id (optional)
Composition
Audience composition;
Audience composition (relative);
Page views composition;
Metrics selection and data presentation
23
Page view composition (relative);
Time composition;
Time composition (relative);
Affinity index
Affinity index-Internet;
Affinity index-Internet (relative);
Duplication
Min audience duplication;
Min audience duplication (%);
Population
Population-Internet;
Share
Audience share;
Page views share;
Time share;
Page views share in Internet;
Time share in Internet;
Cookies
Domestic cookies
Foreign cookies
All cookies
Application
Started application;
Visitors and started applications;
Started applications Reach-Internet;
Reach-Internet;
Working time;
In Analysis menu it is also possible to choose the option Enable extended average metrics which
adds to the above metrics list four additional metrics:
average daily visitors;
average daily page views;
average daily time;
average daily visits;
Definitions of metrics are provided in chapter 9 “Definition of terms” on page 54. The definition will
also appear on the screen in gemiusExplorer after pointing the metric name by cursor on the head of
the table.
Metrics selection and data presentation
24
4.2 Cost Per Mille
CPM option allows to calculate the cost of page views on selected websites in a given period. In order
to see the CPM metrics in gemiusExplorer choose Cost from the list of available metrics in Audience
analysis. Two additional columns – CPM and Cost - will be displayed (the definitions of metrics are
available in chapter 9 on page 54).
Figure 17 Filling the CPM values
In the CPM fields (1) one can manually introduce values for each of the chosen nodes by clicking in
desired row. Next, write down the CPM value and confirm by pressing ENTER on your keyboard.
It is also possible to set the same CPM value for more than one node at the time. There are a few
ways of doing this:
To select a few subsequent nodes click on one of the rows, than press Shift button on your
keyboard and use Up or Down arrows to select the desired nodes. Next, write down the CPM
value for selected nodes and press Enter. The CPM values will appear in all selected rows.
To select all nodes from one row up to the end of the list, press Shift+End. To select all nodes
from one row up to the top of the list, press SHIFT+HOME. Next, write down the CPM value
and press Enter.
To select a few nodes that do not appear one after another on the list, press Ctrl and choose
nodes by clicking on the rows. Next, write down the CPM value and press Enter.
After adding the CPM value, the Cost (2) will be automatically displayed.
Metrics selection and data presentation
25
4.3 Data sorting
Data presented in the table can be sorted by selected metric, or node name (“Site”) in ascending or
descending order after clicking on the head of the column of this metric. Clicking on a column’s head
again causes a change of sorting order.
Figure 18 Data sorting by selected metric
For example, data presented above was sorted in descending order according to the number of page
views.
In order to sort websites alphabetically, one has to click on the column “Site”.
4.4 Metrics summary
In the right panel, apart from the list of nodes and the values of metrics for those nodes, a summary
is also presented – value of metrics for selected group of websites.
Figure 19 Summary of metrics for selected websites
For example, the summary presented above (the “Selected nodes” row) can be interpreted as
follows:
visitors (real users) – total number of visitors (real users) for the five selected websites
amounts to 263 267. It is worth remembering that a visitor (real user) to a particular site can
also visit other sites (so called: audience duplication) – thus the number of visitors (real
users) for several websites is smaller than (or equal to) the sum of visitors (real users) to a
particular websites;
page views – number of page views generated on all five sites in the list.
Metrics selection and data presentation
26
The presentation of the summary can be disabled by unchecking the Show nodes summary option
from the list with metrics (which is available after right click on the head of the table with research
results) or from the View menu.
It is also possible to display the daily arithmetic averages in a summary. It can be done by selecting
the Show daily average in summary option from the metrics list (this option is visible after selecting
Show nodes summary). Such data is available only for several metrics:
page views;
time;
avg. page view duration;
page view composition;
page view share;
time share.
In example above, the average daily number of page views for the five selected websites (the
“Selected nodes (daily)” row) is 1 872 332.
4.5 Selection and deselection of groups of nodes
In order to analyse the audience of any node we are interested in, we have to click the checkbox
on the left side of a node name (in a media or aggregates tree). The icon
appears next to the
name of the selected node.
Thanks to the option of group selection, it is also possible to select easily whole groups of websites.
Figure 20 Group selection options
When highlighting a node in a media or aggregates tree with a left-click and then performing a rightclick (or choosing the option Select/deselect nodes from the menu Tree), one gets access to the
following commands:
Metrics selection and data presentation
27
Select nodes below (Ctrl+B shortcut) – selects nodes situated at the lower level
("descendant" nodes);
Select nodes on the same level (Ctrl+L shortcut) – selects nodes situated at the same level;
Select all nodes (Ctrl+A shortcut) – selects all nodes available in media or aggregates tree
(the weighted ones are displayed in red);
Select nodes… (Ctrl+D shortcut) – opens the window of advanced nodes selection (one can
also click on the icon
from the Toolbar). This window makes it possible to choose
nodes at any level of the tree (from the chosen node) and at the same time selected types of
nodes.
Select leaves below (Ctrl+K shortcut) – selects leaves (final nodes with no subordinate
nodes) one level below;
Figure 21 Advanced nodes selection
Deselect nodes below (Ctrl+Shift+B shortcut) – deselects nodes situated at the lower level
("descendant" nodes);
Deselect nodes on the same level (Ctrl+Shift+L shortcut) – deselects nodes situated at the
same level;
Metrics selection and data presentation
28
Deselect all nodes (Ctrl+Shift+A shortcut) – deselects all nodes media or aggregates tree.
This option can be also activated by the icon
;
Deselect nodes… (Ctrl+Shift+D shortcut) – opens the window of advanced nodes deselection.
This window makes it possible to limit the choice of nodes at any level of the tree (from the
chosen node) and at the same time selected types of nodes;
Deselect leaves below (Ctrl+Shift+K shortcut) – deselects leaves (final nodes with no
subordinate nodes) one level below;
Inverse nodes selection... – opens the window of advanced inverse nodes selection;
Copy node to new aggregates tree – copies the selected node (and its whole sub-tree) from
the media tree to a new aggregates tree;
Copy selected nodes to new aggregates tree – copies all selected nodes (and their sub-trees)
from the media tree to a new aggregates tree.
4.6 Site searching
In order to search for a node in a tree, based on part of its name, one has only to press Ctrl+F, or
choose Find node... from the Edit menu. Then the window, presented below, appears.
Figure 22 Searching for websites based on names
Part of the node name can be entered in the Search for text box. Choosing the Find next node option
in the Edit menu, or pressing F3 key will cause finding the next result of searching. One can also
switch between search results using the Next and Previous buttons.
If one selects the option Match case, then the case size in the name of website will be taken into
account. Selecting Match whole word causes searching for an exact name of a website.
The option Search in URL masks should be selected to search through URL masks of nodes. The
option Search in all opened documents allows searching through all opened datasets.
You can search within trees panels (trees option) or results panel (results option).
4.7 Table view
Pivot tables
A table structure can be set up and changed by dragging and dropping fields in one of the three
positions:
on tabs;
in columns;
in rows.
Metrics selection and data presentation
29
Fields in which positions can be changed are the following:
metrics;
time periods;
target groups;
selected nodes.
Moreover, their order in the rows or columns of a table can be swapped.
For example, having 3 files opened and presentation style defined as it is shown below, one can
analyse visitors (real users) and page views trend easily.
Figure 23 View of trend analysis
The presentation style of a table can be saved by choosing the icon
, or removed by choosing
the icon
. All saved presentation styles are available in the Presentation styles bar pull-down
menu in the Toolbar. The Presentation styles bar is available when a proper option in the View
menu is selected.
There are two pre-defined styles available:
Periods on tabs – moves time periods to the tabs;
Target groups on tabs – moves target groups to the tabs.
Using the icon
, one can place the first column from the table in the tabs.
Moreover, a column width can be changed by moving its right border line. A width can be also
adjusted to the column’s content by selecting the Refresh/Adjust column width option in the View
menu, or by using F5 key, or by double click on the right border line of a column.
Metrics selection and data presentation
30
Nodes URL masks
It is also possible to show URL masks of nodes. In order to do so, one has to click the icon
choose the option Nodes URL masks in the Analysis menu, or type Alt+5.
, or
In order to disable the URL masks view, one has to choose the adequate option in the Analysis menu,
or click the icon
.
4.8 Website names presentation
In the Tools menu there is the gemiusExplorer options... sub-menu available, that enables one to
define the mode of nodes’ names presentation. It is possible not only to present a name of a given
node, but also a name of a “parent” node. This can be defined in the Display tab.
Figure 24 Parameters of nodes names display
After selection of an adequate level it is possible to present the complete “path” of a node.
Metrics selection and data presentation
31
Figure 25 Presentation of parent nodes names
The figure above shows that the website bank.com is situated in the tree within the category
Business and Finances -> Banking, whereas city.com within News -> Regional and team.com within
Sport -> Football.
It is also possible to define an individual parent nodes name separator (by default it is ‘-‘).
The font size for both media or aggregates tree panels and results one can be changed
independently. Choosing Ctrl and + enlarges the font size in active panel. Using Ctrl and – makes the
font smaller.
One can also define the font size by choosing the Display tab in the gemiusExplorer options... submenu, in the Tools menu. The Table font size parameter defines the size of font used in panels with
results of an analysis, Trees font size – the size of fonts used in panels with media or aggregates trees
structures.
4.9 Presentation of nodes below minimum rating
If the audience size of the node is small and collecting a sufficient sample for a given target group
was not possible – then the sign “-“ (no data available) appears in the statistics for this node.
Figure 26 Nodes below minimum rating
In order not to present results for such websites, one has to deselect the option Show nodes below
minimum rating in the View menu, or in the list with metrics (which is available after right click on
the head of the table with research results).
4.10 Presentation of nodes with different colours
In the case of an analysis for population, the nodes are presented in red and black colours. In red are
marked those nodes that were included in the behavioural weighting (“weighted” nodes), while in
black are those that were not weighted behaviourally.
When conducting an analysis for target groups, some of the nodes are presented in a blue colour
(after exporting data to the Excel or CSV file they are in a separate column). This means that within
Metrics selection and data presentation
32
this target group for this particular node the panel size was not big enough. Statistics presented in
blue should be treated just as an approximation.
Figure 27 Weighted/not weighted nodes
On the basis of the figure above, one can notice that the behavioural weighting was conducted for
nodes: website1.com and website3.com (in the population analysis these nodes are marked in red) –
this means that there is a site-centric audit on these websites. Whereas the site website2.com is
shown with the population in black, so it was not weighted behaviourally. When analysing the target
group “Male”, we can also see that for website1.com and website2.com the number of panelists in
this target group was too small (so the nodes were marked in blue).
Metrics selection and data presentation
33
5
Target group definition
5.1 Defining a target group
Basic information about target groups
The gemiusExplorer application enables to define target groups for which we want to analyse
selected metrics, e.g. target groups “women with higher education”, “persons not older than 19”.
Defining target groups can be done by choosing the option Target group definition... from the Target
groups menu, or by clicking the icon
, or by pressing Ctrl+Shift+G.
Defining new target groups
Figure 28 Defining a target group
The target group can be defined by dragging and dropping selected characteristics available in the
lower panel to the matrix. The figure above shows the target group “men aged 25-44” defined –
therefore the parameter Male (from the Gender group) was dragged to the matrix and then, in the
Target group definition
34
next line, the parameter describing the age interval was placed: [25-34] and [35-44]. The name of
such a target group, assigned automatically, is: (Gender=Male) and (Age=[25-34] or Age=[35-44]).
It is possible to define a target group with the use of negation. For example – in order to define the
target group “men, aged other than 20-30”, one can simply drag and drop to the matrix
characteristics Gender=Male and Age=[20-30] and then double-click on the cell containing the age
characteristic (this causes a change in the condition for Age to Age<>[20-30], what means exactly
“Age different than interval [20-30]”).
Figure 29 Negation of a condition in target group definition
Options available when defining target groups
When defining target groups, the following options are available:
Name automatically – target groups are named automatically; this parameter can be
deselected if one wants to name the target group oneself;
Normal form – enables one to choose the logical character of the target group definition;
Figure 30 Matrix for creating target group definitions
Alternative of conjunction – in each of the lines at least one of the conditions has to be
fulfilled (for whichever cell of the line);
For example, in the figure above, the definition means exactly: (Gender=Male or Age=[1524]) and (Education=University or Personal net income=3001-4000).
Conjunction of alternatives – in whichever line where the conditions are entered, all of the
conditions have to be fulfilled. For the above mentioned example, the definition means
exactly: (Gender=Male and Age=[15-24]) or (Education=University and Personal net
income=3001-4000).
Available buttons:
Adjust – sorts the matrix, moving the selected cells to the left top corner of the matrix;
Clear cell – deletes the content of the currently selected cell of the matrix;
Clear entire definition – deletes the target group definition (clears the content of all cells of
the matrix).
Target group cardinality:
Period – the period of time that the research was conducted for;
Target group definition
35
Sample – sample size for the given target group for the time period selected in the Period
drop-down menu;
Population – the internet users’ population size in the target group for the time period
selected in the Period drop-down menu (concerns whole internet). The value in brackets
shows the percentage of the selected target group in the whole population.
Parameter and variable names – enables the choice of presentation of parameter and
variables names in the matrix.
Buttons for adding and deleting target groups
In order to define a new target group, one has to click the Add new definition button – this opens a
new tab. With the use of the Delete current definition button, a currently selected target group
definition can be deleted. The button Delete all definitions is used to delete all previously entered
definitions, and only one target group remains: Population.
The button Divide by selected characteristics enables one to quickly define some types of target
groups. For example – in order to define target groups of women with different levels of education,
one has to drag and drop the characteristic Gender=Female to the matrix field, then click on the
characteristic Education, and click the Divide by selected characteristic button. All required target
groups are defined automatically.
The button Create by selected characteristics enables one to define target groups based on the
values of selected metrics (e.g. target groups by all age intervals and gender). The selection of
desired characteristics can be made by pressing CTRL on the keyboard and by clicking on the names
of characteristics. It can also be done by pressing SHIFT and using arrows UP or DOWN on the
keyboard. After selecting desired target groups one should click the Create by selected
characteristics button.
In order to define target groups based on the values of all characteristics (i.e. target groups by all age
intervals, education levels, gender, etc.), one has to press the button Create by all characteristics.
Changes in target group definitions are confirmed by clicking the OK button; if we do not want to
confirm the changes in the target group definitions then we have to click the Cancel button.
Saving and loading target group definitions
In the target group definition window, the following options are available:
Load from file... – in order to load a target group definition from a file, one just has to click
the button. The same operation can be done by choosing the option Load target groups...
from the Target groups menu. It is possible to load more than one target group definition at
the same time. Recently opened definitions of target groups are also accessible (position
Recent files);
Save to file... – enables one to save target group definition to a file. The same operation can
be done by choosing option the Save target groups as... from the Target groups menu.
Defining age intervals
The application makes it possible to define any age interval for target groups.
For example – in order to define the target group “persons aged 20-30”, one has to:
Target group definition
36
open the target group definition window
right-click on the characteristic Age, and choose Define intervals...;
;
Figure 31 Defining age interval - step 1
the window with default age intervals opens. In order to add a new age interval, one has to
click Insert. Enter number 20 in the first field and number 30 in the other. Confirm changes
by clicking OK. The button Delete removes the highlighted line, while the button Default
enables one to enter the default definitions of age intervals;
Figure 32 Defining age interval – step 2
among the defined age intervals the new interval [20-30] has appeared. Now this interval can
be dragged and dropped, like other ones.
Target group definition
37
Figure 33 Defining age interval - step 3
5.2 Reference group editor
Basic information about the Reference group editor
Reference Group Editor allows gemiusExplorer user to present the composition statistics (Audience,
Page views and Time composition) and Affinity Index-Internet statistic in relation to the selected
reference group and to compare them with the standard composition indicators and Affinity IndexInternet metric.
The idea of the Reference Group Editor is to simplify the analysis where user wants to exclude some
less valuable, from his point of view, target groups (i.e. responses “I don’t know” or “Respondent was
not asked”) from the reference group.
Defining the reference group
In order to define the reference group in gemiusExplorer open the standard Target group definition
window (
icon or Target group definition in Target groups menu) and then press the Reference
Group Editor button in the top right corner.
Target group definition
38
Figure 34 Selecting the Reference Group Editor
After pressing the button you will be directed to the Reference Group Editor where you will be able
to define your desired reference group in relation to which the relative statistics (Audience
composition, Page Views composition, Time composition and Affinity Index-Internet) will be shown.
The rules of selecting the reference group are the same as in the standard target groups definitions.
In order to go back to the target group definition window press once again the Reference Group
Editor button.
The defined reference group will be displayed in the first cell of the target group definition and it will
be combined by conjunction with all target groups defined by the user (see the image below).
It means that selecting e.g. Female for the reference group will cause that all defined target groups
will include this definition.
Target group definition
39
Figure 35 Defining the target groups after selecting the reference group
After selecting the reference group and the target groups click OK in order to display the results.
To display the relative statistics select them from the standard metrics list (see chapter 4.1 on page
23).
Figure 36 Table with relative composition metrics
The definitions of relative metrics are available in chapter 9 on page 54.
Target group definition
40
5.3 First nodes selection
The application enables one to search the sites of which the audience is composed mostly from the
target group according to the selected metric (e.g. number of page views).
In order to find sites with the highest values of the selected indicator in the given target group, the
following steps have to be taken:
in the media tree and/or aggregates tree select the group of nodes among which the nodes
with optimum values will be chosen;
select the metric according to which optimization will be conducted – display the metric in
the right panel and sort data by that metric (click on the head of its column);
choose the option Filter selected nodes according to given criteria... from the Tools menu,
or click the icon
in Toolbar, or press Ctrl+Shift+F and define:
number of websites that we want to choose;
research period;
target group which the optimization is conducted for.
Figure 37 Selection of optimization parameters
OPTIMIZATION EXAMPLE: assume that we want to provide certain information to the largest
possible group of particular internet users. Our target group is: women aged 35 and younger. We
need to find those sites that are visited by users that fulfil our criteria the best – i.e. websites that are
Target group definition
41
visited mostly by women aged 35 and younger, and their audience in general is big enough. While
conducting the analysis we can take the following steps:
first of all, we define the target group of our interest (see chapter 5.1 “Defining a target
group” on page 34);
then, in media tree we select all sites (after clicking on the collecting node we choose option
Select nodes… and select sites checkbox);
we choose the metrics that we want to analyse, e.g. number of visitors (real users), number
of page views, audience composition etc.;
we choose the metric which the optimization is being conducted for – we click on the head of
the selected metric, e.g. audience composition;
then, we choose the option Filter selected nodes according to given criteria... in the Tools
menu (or click
icon, or press Ctrl+Shift+F). In the window that appears, we enter
number 15 as the number of presented websites, and choose the preferred research period
and selected target group. We confirm the choice with the OK button.
In this manner we have received the list of 15 websites whose users match the selected target group
(e.g. women aged 35 or younger) the best. Assume that we want to choose only the 5 websites that
generate the highest number of visits. In such a case we need to conduct another optimization based
on the previous results. Therefore we take the following steps:
choose the metric according to which the next optimization is being conducted – we click on
the head of the “Visits” column;
choose the option Filter selected nodes according to given criteria... from the Tools menu.
Limit the selection to 5 websites only, choose the correct research period, and click OK.
Thanks to the second optimization, we have received the list of the five websites with audience
composition matching our target group to the highest possible degree.
The application enables one to conduct many optimizations, one after another, the next optimization
being based on the results of the previous one. In order to conduct the optimization from the
beginning (without taking the previous results into account) all that has to be done is deselection of
all websites before conducting next optimization.
5.4 Target groups cross tables
Application of target groups cross tables
This function allows to cross target groups and to present the distribution of different metrics by
target groups and their combinations. It permits to define target groups both in rows as well as in
columns and to present the reports in a cross table form. The layout of the table, like in audience
analysis, can be easily changed.
Target group definition
42
Creating target groups cross tables
In order to create target groups cross tables in gemiusExplorer choose the Target groups cross tables
in Analysis menu, click on the icon
available in the toolbar or choose the combination Alt+4.
The window for defining target groups cross tables will be displayed:
Figure 38 Target groups cross table window
To define target groups click
button under either rows or columns list. The window for standard
Target group definition will be displayed. Define target groups and then press OK.
To exchange all target groups definitions between two lists press the swap button
. In order to
remove a few or all definitions from rows or columns list, drag to select target groups and then press
Delete on your keyboard. To finish press OK.
The cross table with selected target groups for different metrics will be displayed for all nodes that
were previously chosen.
Target group definition
43
Figure 39 Target groups cross table
In target groups cross tables, exactly like in standard Audience analysis, you can add or remove nodes
by selecting or deselecting them from the Media tree and also display different metrics by right
clicking on the metrics bar.
To change target groups in the cross table click on the
groups cross tables in Analysis menu or press Alt+4.
icon in the toolbar, choose Target
Target group definition
44
6
Periods definition
6.1 Defining periods
The application allows to define periods for which we want to count selected metrics. By the term
“period”, one should understand any number of days in a given month, e.g. all working days in the
second week of a month, the first day of a month, etc. Periods can be defined by selecting the
Periods definition... option in the Periods menu, by clicking on the icon
Ctrl+Shift+T shortcut.
or by choosing
Figure 40 Defining periods
In the Define periods window one can select several pre-defined periods, such as: weekends (total
number or separately), work days (total number or separately), one-day periods, and weekly periods.
It is also possible to define the period that is interesting for you alone. This can be done by marking it
in the calendar visible on the right side. When selecting a period longer than one day the keys Shift or
Ctrl need to be used. After clicking on the icon
, a period name should be entered (if the option
Name automatically is not checked). That name will be visible on the list of defined periods.
The list of defined periods is shown in the Defined periods frame. After selecting any of them, days
that it contains are highlighted in the calendar box. It is also possible to edit an already defined
period. In order to do this, one should select it from the list of defined periods, change the period in
the calendar and the click on the Update button.
Periods definition
45
In order to remove a chosen period one should click on the icon
one should click on the icon
. To remove all defined periods
.
To save definitions of periods one should click on the icon
. To load the definitions already saved
one should click on the icon
. The defined periods are confirmed by clicking on the OK button.
If for some reason you want to quit without saving changes in the period definition window, then you
should click Cancel.
6.2 Saving and loading the periods definitions
In the period definition window the following options are available:
Save to file… – enables one to save periods definitions in a file. The same operation may be
executed through selecting the option Save periods as… from the Periods menu;
Load from file… – enables one to load previously defined periods from a file. The same
operation may be executed by selecting the option Load periods… from Periods menu. It is
possible to load more than one file with periods definition at the same time. Also, recently
opened definitions of periods are accessible (option Recent files…).
Periods definition
46
7
Aggregates tree
The aggregates tree is an additional tree which any nodes from the media tree can be grouped in. It
is possible to use both trees at the same time when analysing the research results – media tree and
aggregates tree.
For example, in the aggregates tree we can place all websites and services concerning a certain topic
– in this case it will not be necessary to search for those sites in the media tree. The other example of
an aggregates tree is a tree presenting websites by their owner or advertising network.
It is possible to define one’s own aggregates tree, or load trees created before. In order to load an
aggregates tree, one has to choose the option Load aggregates tree... from the Tree menu, or make
a right click in the aggregates tree panel and choose the Load aggregates tree... option.
7.1 Defining a new aggregates tree
Assume that we want to define an aggregates tree grouping all websites concerning sport. We have
to:
make a right click in the aggregates tree panel and choose the option Create new aggregates
tree. (If the aggregates tree panel cannot be seen, it has to be opened – in order to do that,
the option Aggregates tree from the View menu has to be chosen);
enter the name of the tree, for example: sports services;
find the websites of our interest in the media tree. Click on a node name that we want to add
to the tree, and drag and drop it to the aggregates tree.
Aggregates tree
47
Figure 41 Defining an aggregates tree
7.2 Operations on aggregates trees
Different operations can be conducted on an aggregates tree after right clicking in the aggregates
tree panel, or choosing the proper option in the Tree menu:
group nodes selection – option Select/deselect nodes. This function is analogous to the
another one in media tree – for a detailed description see chapter 4.5 “Selection and
deselection of groups of nodes” on page 27;
sorting the nodes – option Sort nodes (find more information in chapter 7.3 “Sorting nodes
of an aggregates tree” on page 49);
creating an aggregates tree – option Create new aggregates tree;
opening an already existing aggregates tree – option Load aggregates tree…;
saving an aggregates tree to a file – option Save aggregates tree, Save aggregates tree as...,
Save all aggregates trees in one file..., Save tree node as an aggregates tree.... See more
information about saving aggregates tree below in chapter 7.4 “Saving an aggregates tree”;
adding a new node (catalogue) in a tree – option Add node, Add aggregates tree as a
node...;
deleting a node – option Delete node;
change a name of an aggregates tree node – option Change node name;
authorisation of an aggregates tree – option Authorise aggregates tree...;
Aggregates tree
48
creating an aggregates tree consisting of those nodes from the media tree, which were not
added to any other currently opened aggregates tree – option Complement all aggregates
trees...;
closing currently opened aggregates trees – option Close aggregates tree, Close all
aggregates trees.
Figure 42 Operations on aggregates tree
It is possible to move few nodes at the time from one aggregate tree to another. To do so one should
select nodes by choosing Shift+ Up/Down arrows or Ctrl+ left click and drop them in the desired
aggregate tree. The same operation can be done to add new nodes from Media tree to desired
aggregate tree.
7.3 Sorting nodes of an aggregates tree
By choosing a proper option in the Sort nodes sub-menu in the Tree menu, all nodes of an
aggregates tree can be sorted alphabetically in the following ways:
ascending order (Ascending option);
descending order (Descending option);
ascending, but nodes which are aggregates trees are sorted independently and placed at the
beginning of the main aggregates tree structure (Ascending, aggregates as first option);
ascending, but nodes which are aggregates trees are sorted independently and placed at the
end of the main aggregates tree structure (Ascending, aggregates as last option).
Aggregates tree
49
7.4 Saving an aggregates tree
Saving an aggregates tree can be done by using the following options:
Save aggregates tree – saving the aggregates tree;
Save aggregates tree as... - saving the aggregates tree as a new file;
Save all aggregates trees in one file... - saving all currently opened aggregates trees in one
file;
Save tree node as an aggregates tree... – saving the current node as an aggregates tree.
Aggregates tree can be saved as an authorised tree or unauthorised one.
Figure 43 Examples of authorised and unauthorised aggregates trees
In order to save the tree as an authorised tree one needs to select the option Authorise aggregates
tree…
While authorisation of an aggregates tree, the following window is displayed:
Figure 44 Authorisation form while saving aggregates tree
If you want to authorise an aggregates tree, insert your login and password (the same as used while
opening the dataset in the application). After pressing the Authorise button, data is sent to the
authorisation server, where it is verified.
Creating authorised aggregates trees is recommended to be able to see who the author of a given
aggregates tree is.
After modifying the authorised aggregates tree, one should authorise those changes.
Aggregates tree
50
8
Data saving and exporting
8.1 Data export
Data presented in the results panel can be exported to an Excel or CSV file by choosing the option
Export analysis results to file… in the Analysis menu. It can be also opened:
as an Excel file – option Open analysis results as XLS in the Analysis menu, or the icon
in
pull-down menu in the Toolbar, or Ctrl+E shortcut;
as a CSV file – option Open analysis results as CSV in the Analysis menu, or the icon
in
pull-down menu the Toolbar.
Such data can be easily analysed with the use of other tools. Moreover, it is possible to copy the
current analysis and paste it into the clipboard. In order to do that, one has to choose the Copy
analysis to clipboard option from the Edit menu, or click the icon
Ctrl+C keys.
in the Toolbar, or press
Data is exported in the form of values separated with commas. In order to change the field separator
into another character, one has to go to the Tools menu, gemiusExplorer options… sub-menu,
Export tab. It is also possible to change the decimal tab (used in a number to separate the whole part
from the fraction one).
Data saving and exporting
51
Figure 45 Export settings
The Export average time metrics option enables one to choose the expected format in which the
time will be saved: seconds or [hr:min:s].
Temporary files created while exporting data are stored in the folder defined in the Store temporary
files in text box. By default, data is exported in UNICODE format. To change the export format to
ASCII, one should uncheck the Use Unicode format to export data checkbox.
Please note that the data export to XLS file is related to certain restrictions. There is a limit in the
number of rows and columns in the exported file; the maximum number of rows is 65,536 while the
maximum number of columns is 256.
It is important that the tabs, columns, and rows in gemiusExpolorer are exported as tabs, columns,
and rows of in the XLS file respectively. Therefore, data should be so arranged in rows and columns in
gemiusExpolorer so it would not exceed the above limits.
8.2 Saving an analysis
It is possible to save analyses, preserving current settings concerning: the selected nodes, the
opened aggregate tree, target groups definitions, the selected indicators and definitions of periods.
This helps one to retrieve the analysis state on the next day without defining all the parameters again
(i.e. selection of metrics, target groups etc.)
Data saving and exporting
52
In order to save the analysis, one has to choose the option Save analysis as.... from the Analysis
menu. The option Load analysis... (from the Analysis menu) enables one to bring back previously
defined analyse.
Data saving and exporting
53
9
Definition of terms
This chapter contains definitions of key terms directly related to measuring websites’ audience,
including the definitions of metrics generated thanks to the application.
Definitions of basic terms:
Node in the media tree – each item from the media or aggregates tree (e.g. site, section, aggregate,
application), for which the audience analysis can be carried out.
Page view – loading of a WWW document of a given internet website. This event is assigned either
to the execution of a special tracking script or to an event registered by special software, both made
available by Gemius S.A.
Population – the number of the Internet users, who visited the Internet in a given month.
Time – time measured in seconds between page views made by the user within a given visit.
User – a person, who visited WWW pages at least once in the month.
Metrics in gemiusExplorer:
Time - total time spent by visitors in a given target group on the selected node(s) in a specified time
period. This indicator is expressed in hours.
Page views – the number of events when a web page with URL addresses assigned to the selected
node was viewed by the visitors in a given target group in a specified time period.
Visits – the number of visits generated by the visitors in a given target group on the selected node(s)
in a specified time period. A visit is defined as a series of page views generated by the same visitor on
a given website (domain) with a time of no more than 30 minutes between each two consecutive
page views.
Visitors (real users) – the number of internet users (visitors) in a given target group who visited
(generated at least one page view) the selected node(s) in a specified time period. This indicator
relates to the actual number of persons, and not computers, cookies or IP addresses.
Avg. time spent per visitor (real user) – the average amount of time spent by a real user in a given
target group on the selected node(s) in a specified time period.
Avg. page view duration – the average amount of time between two consecutive page views
generated by the visitors in a given target group on the selected node(s) in a specified time period.
Avg. page views per visitor (real user) – the average number of page views generated by a real user
in a given target group on the selected node(s) in a specified time period.
Avg. visits per visitor (real user) – the average number of visits generated by a real user in a given
target group on the selected node(s) in a specified time period.
Definition of terms
54
Reach-Internet – the ratio of the number of visitors in a given target group who visited the selected
node(s) in a specified time period to the number of Internet users in the given target group who
visited the Internet in a given month. This indicator is expressed as a percentage.
Audience composition - the ratio of the number of visitors in a given target group who visited the
selected node(s) in a specified time period to the total number of visitors who visited the selected
node(s) in the specified time period. This indicator is expressed as a percentage.
Page view composition - the ratio of the number of page views generated by the visitors in a given
target group on the selected node(s) in a specified time period to the total number of page views
generated by the visitors on the selected node(s) in the specified time period. This indicator is
expressed as a percentage.
Time composition - the ratio of amount of time spent by the visitors in a given target group on the
selected node(s) in a specified time period to the total amount of time spent by the visitors on the
selected node(s) in the specified time period. This indicator is expressed as a percentage.
Audience composition (relative) - the ratio of the number of visitors in a given target group who
visited the selected node(s) in a specified time period to the total number of visitors in a defined
reference group who visited the selected node(s) in the specified time period. This indicator is
expressed as a percentage.
Page view composition (relative) - the ratio of the number of page views generated by the visitors in
a given target group on the selected node(s) in a specified time period to the total number of page
views generated by the visitors in a defined reference group on the selected node(s) in the specified
time period. This indicator is expressed as a percentage.
Time composition (relative) - the ratio of time spent by the visitors in a given target group on the
selected node(s) in a specified time period to the total amount of time spent by the visitors in a
defined reference group on the selected node(s) in the specified time period. This indicator is
expressed as a percentage.
Affinity index-Internet- the ratio of the value of the audience composition for a given target group,
for the selected node(s), in a specified time period to the value of the audience composition for a
given target group, for the whole Internet (all websites covered by the research) in the specified time
period. This indicator is expressed as a percentage.
Affinity index-Internet (relative) - the ratio of the value of the relative audience composition for a
given target group, for the selected node(s), in a specified time period to the value of the relative
audience composition for a given target group, for the whole Internet (all websites covered by the
research) in the specified time period. This indicator is expressed as a percentage.
Audience share – the ratio of the number of visitors in a given target group who visited a given node
in a specified time period to the number of visitors in a given target group who visited at least one of
all selected nodes in the specified time period. This indicator is expressed as a percentage.
Page view share – the ratio of the number of page views generated by the visitors in a given target
group on the given node in a specified time period to the number of page views generated by the
visitors in a given target group on all selected nodes in the specified time period. This indicator is
expressed as a percentage.
Definition of terms
55
Time share – the ratio of time spent by the visitors in a given target group on the given node in a
specified time period to the total time spent by the visitors in the given target group on all selected
nodes in the specified time period. This indicator is expressed as a percentage.
Min audience duplication – the number of visitors in a given target group who visited each of the
selected nodes in a specified time period.
Min audience duplication (%) – the ratio of the number of visitors in a given target group who visited
each of the selected nodes in a specified time period to the number of visitors in a given target group
who visited a given node in the specified time period. This indicator is expressed as a percentage.
Max audience duplication – the number of visitors in a given target group who visited a given node
and at least one of other selected nodes in a specified time period.
Max audience duplication (%) – the ratio of the number of visitors in a given target group who
visited a given node and at least one of other selected nodes in a specified time period to the
number of visitors in the given target group who visited the given node in the specified time period.
This indicator is expressed as a percentage.
CPM – Cost Per Mile - defines the price for 1.000 page views generated on the selected node based
on which the value of the "Cost" indicator will be calculated. The value of the "CPM" indicator is
specified by a user of the gemiusExplorer application and can be different for different nodes.
Cost – the purchase cost of a given number of page views generated by the visitors in a given target
group on the selected node in a specified time period. This indicator is shown after defining the value
of the "CPM" indicator for the selected node.
Min audience duplication V% - the ratio of the number of visitors in a given target group who visited
the nodes selected in a given row and column in a specified time period to the number of visitors in
the given target group who visited the node selected in the given column in the specified time
period. This indicator is expressed as a percentage.
Min audience duplication H% - the ratio of the number of visitors in a given target group who visited
the nodes selected in a given row and column in a specified time period to the number of visitors in
the given target group who visited the node selected in the given row in the specified time period.
This indicator is expressed as a percentage.
Average daily visitors – the average daily number of visitors in a given target group who visited the
selected node(s) in a specified time period.
Average daily page views – the average daily number of page views generated by visitors in a given
target group on the selected node(s) in a specified time period.
Average daily time – the average daily amount of time spent by visitors in a given target group on
the selected node(s) in a specified time period.
Average daily visits – the average daily number of visits generated by visitors in a given target group
on the selected node(s) in a specified time period.
Stream views – the number of started runs by the visitor in a given target group on the selected
stream node(s) in a specified time period. A run in a sequence of streams which starts with loading
of a material into a player and finishes with user’s action leading either to closure or reload of the
material by the player.
Definition of terms
56
Stream visits – the number of visits generated by the visitors in a given target group on the selected
stream node(s) in a specified time period.
Average stream views per visitor – the average number of stream views generated by a visitor in a
given target group on the selected stream node(s) in a specified time period.
Average stream visits per visitor – The average number of stream visits generated by a visitor in a
given target group on the selected stream node(s) in a specified time period.
Average stream view duration [hr:min:s] – The average amount of time spent on generating a
stream view by a visitor in a given target group on the selected stream node(s) in a specified time
period.
Stream views composition – The ratio of the number of stream views generated by the visitors in a
given target group on the selected stream node(s) in a specified time period to the total number of
stream views generated by the visitors on the selected stream node(s) in a specified time period. This
indicator is expressed as a percentage.
Stream views share – The ratio of the number of stream views generated by the visitors in a given
target group on the given stream node in a specified time period to the number of stream views
generated by the visitors in a given target group on all selected stream nodes in a specified period.
This indicator is expressed as a percentage.
Definition of terms
57
10 Contact
Detailed information about using gemiusExplorer application is available in the Help menu, option
User’s guide (or by pressing F1).
Additional information about the gemiusExplorer application can be received by sending an e-mail to
the e-mail address [email protected].
Contact:
Gemius SA
Wołoska 7 Str
MARS Building, Entrance D
02-675 Warszawa
Poland
tel. (+48 22) 874 41 00
fax (+48 22) 874 41 01
www.gemius.com
e-mail: [email protected]
Contact
58