1
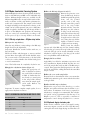
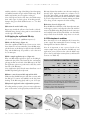
P A R T
I V .
V I S U A L I Z A T I O N
A N D
A N A L Y S I S
O F
R E S U L T S
Part IV
Visualization and
analysis of results
5.0 Visualization of results
Most detection methods used for SDS gels can be
applied to second-dimension gels.
Autoradiography and fluorography are the most sensitive detection methods. To employ these techniques, the
sample must consist of protein radiolabeled in vivo using
either 35S, 14C, 3H, or, in the case of phosphoproteins, 32P.
For autoradiographic detection, the gel is simply dried
and exposed to X-ray film or a storage phosphor screen.
Fluorography is a technique that provides extra sensitivity by impregnating the gel in a scintillant such as PPO
(2,4-diphenyloxazole) prior to drying.
Silver staining is the most sensitive nonradioactive
method. Silver staining is a complex, multistep process,
and many variables can influence the results. Highpurity reagents and precise timing are necessary for
reproducible, high-quality results. Impurities in the gel
and/or the water used for preparing the staining reagents
can give poor staining results.
Coomassie staining, although 50-fold less sensitive than
silver staining, is a relatively simple method and more
quantitative than silver. Coomassie blue binds to
proteins stoichiometrically, so this staining method is
preferable when relative amounts of protein are to be
determined by densitometry.
The Hoefer Automated Gel Stainer automates multistep
staining processes for increased convenience and reproducibility. Automated protocols #2 and #3, for example,
were developed to use the Amersham Pharmacia Biotech
PlusOne® Silver Staining Kit, Protein, to silver-stain proteins
in SDS gels. This convenient adaptation gives reproducible
results and sensitivity below 1 ng per band for most
proteins. Protocols #5 and #7 are recommended for
Coomassie staining of SDS gels. For complete details, please
refer to the Hoefer Automated Gel Stainer Protocol Guide.
5.1 Blotting
Second-dimension gels can be blotted onto a nitrocellulose or PVDF membrane for immunochemical detection
of specific proteins or chemical microsequencing.
Note: The plastic backing on ExcelGel products must be
removed with a film remover prior to electrotransfer (see
‘Ordering information’).
3 6
|
U S I N G
I M M O B I L I Z E D
P H
G R A D I E N T S
5.2 Evaluation
In theory the analysis of up to 15,000 proteins should be
possible in one gel; in practice, however, 5,000 detected
protein spots means a very good separation. Evaluating
high-resolution 2-D gels by a simple comparison of two
gels is not always possible. In large studies with patterns
containing several thousand spots, it may be almost
impossible to detect the appearance of a few new spots
or the disappearance of single spots. Image collection
hardware and image evaluation software are necessary
to detect these differences as well as to obtain maximum
information from the gel patterns.
Amersham Pharmacia Biotech ImageMaster 2D Elite
Software and 2D Database Software together with the
Sharp JX-330 Scanner comprise a system that allows the
user to capture, store, evaluate, and present information
contained in 2-D gels:
■
The Sharp JX-330 Desktop Scanner captures optical
information over a range from 0 to 3.0 OD from pixels
as small as 42 µm (600 dpi).
■
ImageMaster 2D Elite Software provides the essential
tools for analyzing complex protein samples separated
by 2-D electrophoresis. Protein spots are automatically
detected, background is corrected, spot density is
quantified, and spots are matched between up to 100
gels. The software can also detect and graphically
display quantitative amount changes in spot patterns.
■
ImageMaster 2D Database Software adds a database
search facility that searches and queries across experiments and images, and analyses experiments for quantitative pattern relationships.
5.3 Standardization of results
The 2-D electrophoresis technique is often used comparatively and thus requires a reproducible method for
determining relative spot positions. Because the precast
Immobiline DryStrip IPG strips are highly reproducible,
the pI of a particular protein can be estimated from its
focusing position along a linear pH gradient IPG strip.
The second dimension can be calibrated using molecular
weight marker proteins loaded to the side of the seconddimension gel. Often there are abundant proteins in the
sample for which the pI and molecular weight are
known. These proteins can serve as internal standards.
Note: The pI of a protein can depend on its chemical
environment and thus can differ depending on the experimental conditions used. Although marker proteins for
pI estimation are available, pI estimates based on their
use are therefore not necessarily valid.