1
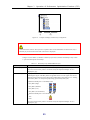
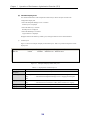
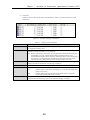
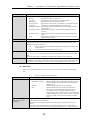
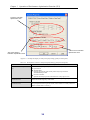
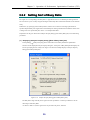
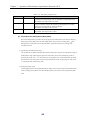
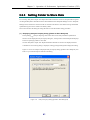
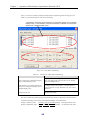
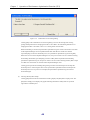
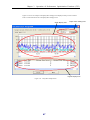
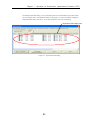
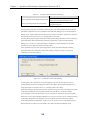
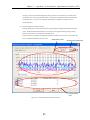
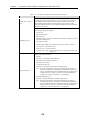
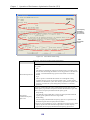
Chapter 3 Operation of Performance Optimization Function (GUI) 33..22..66 R Reep pllaacceem meen ntt E Effffeecctt P Prreed diiccttiio on n The performance optimization function is capable of estimating an effect of load distribution after logical disk movement. By executing this function, the changes of Busy Ratios for RANKs/pools to which source and destination logical disks belong are displayed in graphs. A volume that cannot be replaced is not displayed in a graph. If you log into the system to which the partitioning function is installed as a partition user, only the resources of the partitions the user can manage can be displayed in graphs. This section describes the dialog for displaying an effect of replacement and the displaying procedures. (1) Display Replacement Effect Prediction dialog For selecting the items for displaying graphs of replacement effect, the Graph Indicating Replacement Effect Prediction dialog must be displayed. Four procedures are provided for displaying the Displaying Replacement Effect Prediction graph dialog. Display the Replacement Effect Prediction dialog with one of the following procedures: Popup menu Select a work disk on Work Disk for Optimization Display Area, and display a popup menu by right clicking. Then select [Replacement Effect Prediction] on the popup menu. Menu Select a work disk on Work Disk for Optimization Display Area, and select [Operation] [Replacement Effect Prediction]. Tool button Select a work disk on Work Disk for Optimization Display Area, and select [Replacement Effect Prediction] on the toolbar. Replacement Plan dialog Click the [Replacement Effect Prediction] button on the Replacement plan dialog. Refer to 3.2.5 “Replacement Plan” for details on the Replacement Plan dialog. Figure 3-17 shows an example of displayed the Graph Indicating Replacement Effect Prediction dialog, and Table 3-16 provides descriptions of the areas in the dialog. 54