1
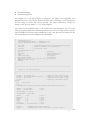
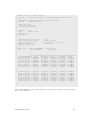
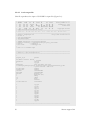
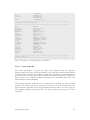
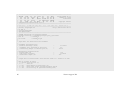
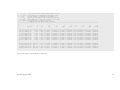
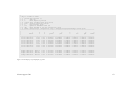
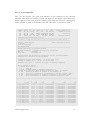
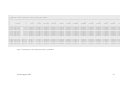
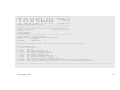
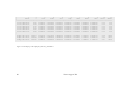
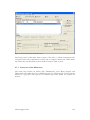
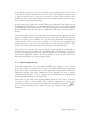
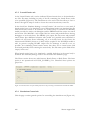
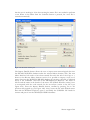
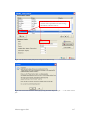
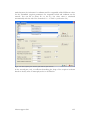
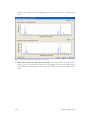
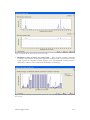
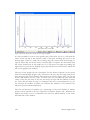
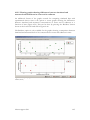
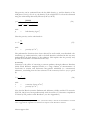
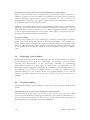
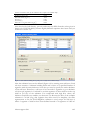
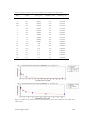
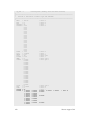
Figure 4.46 Example of the window containing graphs for comparing simulated and measured concentrations in
water and in sediment
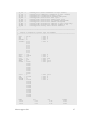
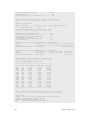
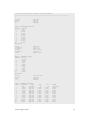
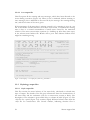
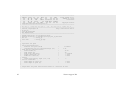
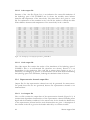
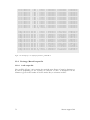
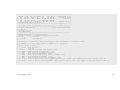
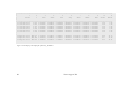
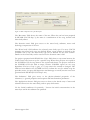
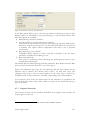
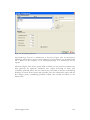
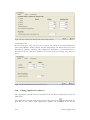
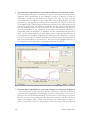
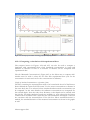
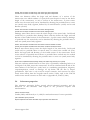
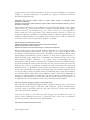
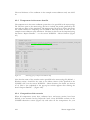
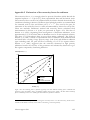
Figure 4.47 Example of the window containing graphs for comparing simulated and measured concentrations in
water as function of the distance in the water layer and in sediment as a function of depth.
Alterra-rapport 586
143