1
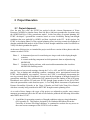
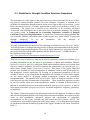
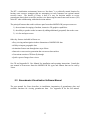
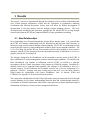
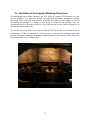
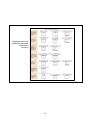
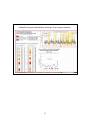
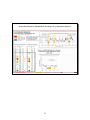
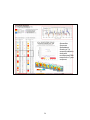
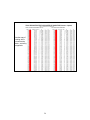
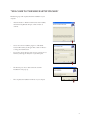
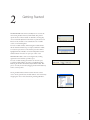
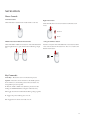
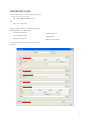
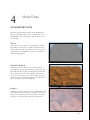
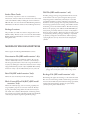
Improved Tools for Drought Planning Final Report Authors: Jessica Block, Project Manager, Co-Investigator, Decision Theater Dr. R F Shangraw, Principle Investigator, Vice President for Research and Economic Affairs Dr. Perry Miller, Co-Investigator, High Performance Computing Joseph Adams, Decision Theater Adam Kubach, High Performance Computing Jeffrey Conner, High Performance Computing Arizona State University Dr. Katherine Hirschboeck, Co-Investigator, Laboratory of Tree Ring Research University of Arizona Teresa Makinen, Co-Investigator East Valley Water Forum Copyright © 2008 For questions regarding this project contact: Jessica Block Senior Research Scientist [email protected] Decision Theater Arizona State University (480) 727-9753 www.decisiontheater.org 2 Table of Contents Table of Contents........................................................................................................................... 3 1 Introduction............................................................................................................................. 4 1.1 Project Description.......................................................................................................... 4 1.2 Statement of Need........................................................................................................... 4 1.3 Project Drought Scenario Planning Methodology .......................................................... 5 2 Project Execution .................................................................................................................... 7 2.1 Project Approach ............................................................................................................ 7 2.2 Project Presentations....................................................................................................... 8 2.3 Guideline for Drought Condition Scenarios Generation .............................................. 10 2.4 Groundwater Visualization Software............................................................................ 12 2.5 Groundwater Visualization Software Manual .............................................................. 13 3 Results................................................................................................................................... 14 3.1 New Relationships ........................................................................................................ 14 3.2 Facilitation of Groundwater Modeling Discussions ..................................................... 15 3.3 Future Work- Integration of Tree-Ring Information .................................................... 16 Appendix A................................................................................................................................... 17 Appendix B ................................................................................................................................... 28 3 1 Introduction 1.1 Project Description As research on climate variability and climate change continues to expand, cities and states in the western United States are setting guidelines for drought preparedness. And although the scientific community agrees that human-induced climate change is occurring, tree-ring research shows that in the last 780 years there have been 13 droughts in the Colorado River basin lasting from 15 to greater than 20 years1. There is potential for severe drought in the 21st century on the Colorado River and the Salt and Verde River watersheds, whether due to normal climatic variations indicated in the tree-ring record or due to human-induced climate change. Further, central Arizona has seen water shortages on the Colorado, Salt, and Verde Rivers in the last 9 years. It is essential for the long-term sustainability of municipalities and Indian communities in Arizona to address strategies for collective management of surface water and groundwater in the event of these conditions. This project brought together the East Valley Water Forum (EVWF), the Arizona State University Decision Theater (DT) and the University of Arizona (U of A) Tree-Ring Laboratory. The purpose was to integrate tree-ring research from the University into the EVWF drought scenario planning through the design of groundwater modeling scenarios in drought conditions. These scenarios could then be visualized through a tool developed by the DT. 1.2 Statement of Need Arizona’s water managers are well aware of the potential for severe drought. The EVWF is a partnership of 25 tribal, public, and private water agencies and interested stakeholders involved in water resource management in the East Salt River Valley of Arizona. The results of the first phase of their planning are compiled in their Management Plan and was completed in 2007. Even in the early stages of developing a regional groundwater management plan, East Valley water providers recognized that drought scenario planning was an important and necessary component. However, due to the many variables involved in this type of scenario planning, such as climatology, water conservation, and shifts in supply and demand related to drought conditions, the EVWF determined this would be better suited as a second phase to the regional planning effort. The development of drought scenarios, their next phase of regional planning, will consider climatology research dating back nearly 800 years to be incorporated to hydrologic groundwater modeling. The results of this modeling will enable the EVWF participants to discuss various responses to drought impacts through effective water resource management. 1 Gray, S.T., Bettancourt, J.L., Fastie, C.L., and Jackson, S.T., Patterns and sources of multidecadal ocillations in drought-sensivitve tree-ring records from the central and southern Rocky Mountains, Geophysical Research Letters, 30(6), pp.49-49, 2003. 4 Strategically, this project is important in the following areas: • Water Resource Management: Water infrastructure is expensive to build and maintain. Regional drought scenario modeling and planning will provide needed information to enable water managers to explore cooperative uses of existing infrastructure and water resource management during drought conditions. • Drought Scenario Planning Research: We are merging climatology, visualization, and hydrology into an integrated scientific solution for assessing drought issues. • Technical Assistance: The software toolkit and documentation will provide assistance to any regional planning group addressing drought issues in the CAP service area. 1.3 Project Drought Scenario Planning Methodology The diagram below illustrates the three steps in the Uof ATree-Ring Lab/EVWF/DT drought scenario planning methodology. Drought scenario planning begins with drought characterization. This step involves the water resource manager’s research and development of possible drought scenarios, including consideration of historic tree-ring research. These scenarios are in turn used to perform the next sequential step, groundwater modeling. In this step, the water resource managers determine appropriate water demand and estimate available groundwater supplies based on the drought scenarios, producing a time-stepped groundwater model output. The final step allows visualization of the groundwater model for the various time increments specified. The groundwater basin is displayed using Nimue, an open-source 3D visualizer developed by DT that accepts MODFLOW 2000 free-format files. Nimue was developed to allow groundwater modeling display within the DT, hosted on its high performance computers. But Nimue also provides a free, lightweight groundwater modeling desktop viewer that allows various water resource managers to quickly observe data without the need to purchase expensive MODFLOW viewing tools. 5 This figure depicts the project deliverables and the interaction of the water resource maangers at each phase. This final report describes the presentations, products, and collaboration between the U of A, ASU, and the EVWF with the deliverables listed in the attached CD and appendices. 6 2 Project Execution 2.1 Project Approach Over the past two years, the EVWF has worked with the Arizona Department of Water Resources (ADWR) to simulate future East Salt River Sub-basin groundwater elevations using the ADWR Salt River Valley groundwater model. In this first phase of regional planning, the EVWF developed 3 groundwater scenarios based on water availability during non-drought conditions that were modeled by ADWR, and then visualized at the DT. In this project, the EVWF is developing Phase II of the regional planning effort, involving scenario development of drought conditions and analysis of the effects of these drought conditions on the East Salt River Valley Sub-basin groundwater aquifer. At the onset of this project, we intended the project workflow to consist of three phases under the contract awarded 11/4/06: Phase 1. Phase 2. Phase 3. A documented process for considering tree-ring records in developing drought scenarios A scenario modeling component in which parametric data are adjusted using MODFLOW Creation of display software, with associated documentation, that visualizes MODFLOW modeling results. Our goal was to host several meetings wherein the U of A, ASU, and EVWF could develop the project. Due to budget and scheduling conflicts, continuous active participation between the EVWF and Hirschboeck was curtailed. However, the EVWF is considering incorporating the tree-ring research from Dr. Hirschboeck’s group into the development of drought scenarios for groundwater modeling. This collaboration will continue beyond the funding of this AWI grant. Hirschboeck met with the DT and some EVWF drought group members in the fall of 2007, where she presented the results from her report, “A Tree Ring Based Assessment of Synchronous Extreme Streamflow Episodes in the Upper Colorado and Salt-Verde-Tonto River Basins”, which are currently being considered in the EVWF drought scenario planning effort. As a result of these changes, the scope of the project was adjusted to provide water resource managers presentations both at the DT and off-site and also produced the following deliverables under MOU dated 1/31/07: 1. A guideline for generating scenarios of drought conditions using tree-ring information (See Appendix A). This product, designed by Dr. Katherine Hirschboeck from the University of Arizona Tree-Ring Laboratory, is contained in a website for easy access to the water resource managers of the EVWF as well as others. 7 2. Groundwater visualization software designed by Dr. Perry Miller of the ASU DT and his team (See attached CD). 3. A software manual that describes how to install and run the software package for water users (See Appendix B). A description of the project presentations and supporting deliverable products developed under funding by the Arizona Water Institute are described in the following sections. 2.2 Project Presentations The EVWF utilized Nimue to present the scenario results of their Management Plan to an educational forum, two East Valley city councils, and another water organization. (see pictures below). The visualization software’s versatility was demonstrated by its ability to display the groundwater modeling both within the DT drum as well as at off-site presentations. Visualizing the groundwater modeling proved to be a successful medium for generating scientific discussion that was facilitated by the improved tools funded through this grant. The EVWF management plan results were presented to water providers, which showcased the EVWF accomplishments and its standing as a progressive water resource management group. 8 9 2.3 Guideline for Drought Condition Scenarios Generation The main objective of this aspect of the project was to provide a framework for the use of treering data in creating drought scenarios for water managers. Originally, a standard set of guidelines for determining drought scenarios based on tree-ring records was envisioned. As the project developed, however, it became apparent that a single set of guidelines would be too constraining. The project was re-focused on the deliverable of an accessible web-based “framework” that could display one or more tools to use in scenario development. The resulting web resource titled "A Framework for Generating Exploratory Scenarios of Drought Conditions Using Tree-Ring Information" is meant to be viewed as an evolving platform that will eventually combine with similar efforts in other regions (e.g., under NOAA "Coping with Drought" initiatives). To see the information, visit the webpage at http://fp.arizona.edu/kkh/awi/awi.htm. Tree-ring reconstructions are most useful for generating so-called Exploratory Scenarios, which “describe the future according to known processes of change and extrapolations from the past by incrementally progressing through time. They rely on logical induction, by using clues from the past and present and working out the pathways that the future may take.” (SAHRA Scenario Development Group webpage: http://www.sahra.arizona.edu/scenarios/content/blogcategory/13/30/) There are two ways in which tree rings can be used in exploratory scenario development: (1) by providing information on the full range of past patterns of climate and streamflow behavior (projective scenarios), and (2) by using past climate and streamflow behavior as a baseline from which to construct alternative processes or patterns that significantly vary from the past, e.g., under future climate change (prospective scenarios). This phase of the project addressed possible ways in which tree-ring reconstructions of streamflow could be used in both projective and prospective scenario approaches. By focusing on reconstructed streamflow as the key variable of interest, it was assumed that the magnitude and variability of surface water supplies are key inputs needed in developing drought management scenarios and groundwater management plans. The approach used was to extract a series of multiyear sequences of flow from long term tree-ring reconstructions of streamflow. These streamflow sequences can then be used as possible input into surface/groundwater models to illustrate different modes or patterns of streamflow that have been experienced in the past (projected scenarios), or may be experienced in the future (prospective scenarios via altered magnitudes, frequency, persistence, or amplitude). The website’s framework organizes the information needed for this approach. In addition to links and relevant background material on tree rings and reconstruction methods, the website provides access to data spreadsheets, descriptive statistics and visualizations of streamflow reconstructions for the Upper Colorado and Salt-Verde-Tonto River Basins. (NOTE: The reconstructions were produced during an earlier project titled: A Tree-Ring Based Assessment of Synchronous Extreme Streamflow Episodes in the Upper Colorado & Salt-Verde-Tonto River Basin.”) 10 Seventeen multiyear sequences of past streamflow covering different time frames (30-year, 20year, 11-year, and 7-year) were selected from the reconstruction data for possible use by water mangers in exploratory scenario development and planning for future drought conditions. An effort was made to select sequences that represent the full range of past (and possible future) streamflow behaviors, including severe and sustained low flow sequences, high flow episodes, and periods with high amplitude variability. The sequences are displayed with suggestions for how they might be used as input for projective and prospective exploratory scenarios. A Streamflow Sequence Data Spreadsheet is available for downloading and contains the reconstructed flow data, quantile visualizations, and graphs for each sequence. Users can use the spreadsheet to select, plot, and/or analyze additional sequences if desired. Ongoing and future collaborations with water managers will provide the opportunity to evaluate the usability and applicability of this framework for drought scenario development. This webpage can be expanded to meet the needs of the EVWF in their examination of various management scenarios under drought conditions. See Appendix A for more details on the website. 11 2.4 Groundwater Visualization Software Software for Enhanced Understanding of groundwater data Nimue (pronounced nee-moo-ay) has been designed to view groundwater data produced by MODFLOW (MODular three-dimensional finite-difference ground-water FLOW model), a software modeling tool written by the USGS to simulate the flow of groundwater. Although there are several software products that are capable of viewing MODFLOW data, they are typically designed for use by hydrologists and engineers. Nimue is a lightweight application specifically designed for the visualization of the relevant scientific information needed by water resource managers. Additionally, Nimue is open source, free, and compatible with the DT such that groundwater data can be viewed immersively in 3D as well as on a user’s desktop. Open source software allows the executable and its source code to be freely distributed, allowing outside developers to update and enhance the existing code to meet their own needs. This promotes future, tailored development for visualization software that can view additional datasets. Screenshot of Nimue 12 The DT’s visualization environment, known as “the drum,” is a politically neutral location for hosting water resource managers that are attempting to reach consensus on regional natural resource issues. The benefit of Nimue is that it is easy for decision makers to review groundwater data in their own office and also view data using the same framework in stereo (3D) in the DT when collaborating with other decision makers. The principal features that set this software apart from other MODFLOW post-processors are 1) the maximum leveraging of modern, immersive 3D-graphics capabilities 2) the ability to put the results in context by adding additional (geospatial) data to the scene 3) it is free and open source. Other key features included in Nimue are: Easy viewing and navigation in three dimensions of MODFLOW data Ability to import geographic data Animation feature runs through time steps of data Interactive cross-section generation that cuts across data surfaces Convenient creation of 3D data fly-through Quick export of images from viewer See CD and Appendix B: User Manual for installation and operating instructions. Consult the user manual to learn more about the MODFLOW file types and formats that can be read by Nimue. 2.5 Groundwater Visualization Software Manual The user manual for Nimue describes its installation, importation of groundwater data, and available functions for viewing groundwater data. See Appendix B for the full manual. 13 3 Results This project’s success is demonstrated through the formation of new working relationships that were created through collaborative efforts and the facilitation of groundwater modeling visualization that fostered discussions. Future work will allow for further investigation of incorporation of tree-ring analysis into the drought scenario planning process. The tools developed under funding by this grant have equipped the DT and EVWF for viewing drought scenario data when the EVWF has completed Phase II of their groundwater modeling. 3.1 New Relationships New relationships were fostered through this Arizona Water Institute grant. It is expected that the EVWF will continue collaborating with Dr. Hirschboeck and her team when necessary to include tree-ring research in their drought scenario planning. The EVWF is considering tree-ring research into the creation of water management scenarios under various drought conditions. The U of A Tree-Ring Lab and the DT now work together to deliver their products to water resource managers, and the DT has benefited from the expanded knowledge of published as well as inprogress work by the Tree-Ring Lab. The webpage designed by Dr. Hirschboeck can be expanded to meet the needs of the EVWF in their examination of various management scenarios under drought conditions. Toward this end, Katie Hirschboeck will continue to collaborate with the EVWF as needed as a principle investigator with the Climate Assessment of the Southwest (CLIMAS) program. Designed as a platform which can be augmented and expanded, this webpage is also intended to serve as a regional resource for the Southwest and eventually become one of several components of a proposed “TreeFlow” webpage and paleo toolkit project that will cover the entire Western United States (in collaboration with Connie Woodhouse, Univ. of Arizona, WWA and CLIMAS). See Appendix A for more details on the website. The cooperation with Hirschboeck and DT has cultivated a setting for improved tools for drought scenario planning by first better understanding historical data and second through immersive visualization of scientific information, which allows water providers to better understand coupled relationships and impacts of water resource management decisions. 14 3.2 Facilitation of Groundwater Modeling Discussions The photograph shown below illustrates the DT’s ability to present 3D information to water resource managers in a politically neutral environment that facilitates thoughtful, scientific discussion. The screen real estate provides a medium that allows for the display of detailed information, but enough of a canvas to also frame a context for the problem. Thus the groundwater model of the entire Salt River Valley Sub-basin can be seen while still being able to examine individual model cells. The user-friendly nature of the Nimue software affords EVWF the ability to create data for future presentations. EVWF is comprised of a diverse group of water resource managers, each water provider and agency needing to demonstrate different aspects of the scenario results. They now can generate these views for themselves. 15 3.3 Future Work- Integration of Tree-Ring Information The outline of tree-ring scenario development generated in this project is the beginning of the practical use of this academic research by water resource managers. It is a template that can now be expanded through future funding. Although the EVWF drought scenario planning is a work in progress, these collaborations will continue beyond the time span of this grant. Additional inkind funds from the EVWF are reserved for the viewing and analysis of the drought scenarios within the DT using Nimue. This project has successfully improved collaboration among universities, agencies, and water resource managers in Arizona. Visualizing the science has enhanced collaboration through an understanding of the science coupled with water resource management. 16 Appendix A 17 18 The The basic basic framework framework for for using using tree tree ring ring information to information to provide provide input input on on past past events events to to develop develop exploratory exploratory scenarios scenarios 19 Suggested Suggested uses uses of of the the Streamflow Streamflow Sequences Sequences in in Exploratory Exploratory Scenarios Scenarios 20 Streamflow Streamflow Sequence Sequence Spreadsheet, Spreadsheet, showing showing aa 30-yr 30-yr sequence sequence selection selection 21 Streamflow Streamflow Sequence Sequence Spreadsheet, Spreadsheet, showing showing aa 20-yr 20-yr sequence sequence selection selection 22 Streamflow Streamflow Sequence Sequence Spreadsheet, Spreadsheet, showing showing an an 11-yr 11-yr sequence sequence selection selection 23 Streamflow Streamflow Sequence Sequence Spreadsheet, Spreadsheet, showing showing aa 7-yr 7-yr sequence selection, sequence selection, along along with with reconstructed reconstructed PDSI PDSI maps maps for for the the 7-year 7-year sequence sequence 24 RANK, RANK, RECURRENCE RECURRENCE INTERVAL, INTERVAL, && PROBABILITIES PROBABILITIES OF OF FLOWS FLOWS AA sample sample of of data data visualization visualization used used for for analyzing analyzing the the data data and and selecting selecting sequences sequences 25 Another Another way way of of looking looking at at the the reconstruction reconstruction data data –– sorted sorted by by magnitude magnitude 26 Streamflow Streamflow reconstruction reconstruction spreadsheet spreadsheet with with annotated annotated data data sets sets for for all all watersheds watersheds 27 Appendix B 28 Nimue 3D MODFLOW VISUALIZER beta Nimue - 3D MODFLOW Visualizer Project Lead and Author: Jessica Block Lead Developer and Author: Dr. Perry Miller Principal Investigator: Dr. R.F. Shangraw Technical Director: Dr. Daniel Stanzione, Jr. Software Engineer: Adam Kuback Software Engineer: Jeffrey Conner Editor: Joseph Adams Decision Theater 21 E 6th St Suite 126 A Tempe, AZ 85287-8409 This software was funded under the Arizona Water Institute Grant awarded November, 2006, and by additional funding from the East Valley Water Forum, Mesa, Arizona. Copyright © 2008, Arizona State University Decision Theater, Arizona State University High Performance Computing Center All rights reserved. Redistribution and use in source and binary forms, with or without modification, are permitted provided that the following conditions are met: Redistributions of source code must retain the above copyright notice, this list of conditions and the following disclaimer. Redistributions in binary form must reproduce the above copyright notice, this list of conditions and the following disclaimer in the documentation and/or other materials provided with the distribution. Neither the name of Arizona State University nor the names of its contributors may be used to endorse or promote products derived from this software without specific prior written permission. THIS SOFTWARE IS PROVIDED BY THE COPYRIGHT HOLDERS AND CONTRIBUTORS “AS IS” AND ANY EXPRESS OR IMPLIED WARRANTIES, INCLUDING, BUT NOT LIMITED TO, THE IMPLIED WARRANTIES OF MERCHANTABILITY AND FITNESS FOR A PARTICULAR PURPOSE ARE DISCLAIMED. IN NO EVENT SHALL THE COPYRIGHT OWNER OR CONTRIBUTORS BE LIABLE FOR ANY DIRECT, INDIRECT, INCIDENTAL, SPECIAL, EXEMPLARY, OR CONSEQUENTIAL DAMAGES (INCLUDING, BUT NOT LIMITED TO, PROCUREMENT OF SUBSTITUTE GOODS OR SERVICES; LOSS OF USE, DATA, OR PROFITS; OR BUSINESS INTERRUPTION) HOWEVER CAUSED AND ON ANY THEORY OF LIABILITY, WHETHER IN CONTRACT, STRICT LIABILITY, OR TORT (INCLUDING NEGLIGENCE OR OTHERWISE) ARISING IN ANY WAY OUT OF THE USE OF THIS SOFTWARE, EVEN IF ADVISED OF THE POSSIBILITY OF SUCH DAMAGE. 10 9 8 7 6 5 4 3 2 1 Table of Contents 1 Introduction to Nimue beta 1 Welcome to Nimue beta. . . . . . . . . . . . . . . . . . . . . . . . . . . . 1 Quick Facts . . . . . . . . . . . . . . . . . . . . . . . . . . . . . . . . . 1 Hardware Requirements. . . . . . . . . . . . . . . . . . . . . . . . . . . . 1 Installation Guide. . . . . . . . . . . . . . . . . . . . . . . . . . . . . . . 3 2 Getting Started 5 Docking Windows . . . . . . . . . . . . . . . . . . . . . . . . . . . . . . 6 Navigation. . . . . . . . . . . . . . . . . . . . . . . . . . . . . . . . . . 6 Importing Data. . . . . . . . . . . . . . . . . . . . . . . . . . . . . . . . 7 Modules . . . . . . . . . . . . . . . . . . . . . . . . . . . . . . . . . . . 8 3 Operations 11 Menus. . . . . . . . . . . . . . . . . . . . . . . . . . . . . . . . . . . 11 Frame Dump . . . . . . . . . . . . . . . . . . . . . . . . . . . . . . . . 11 Cameras. . . . . . . . . . . . . . . . . . . . . . . . . . . . . . . . . . 12 4 Model Data 15 Geographic Data. . . . . . . . . . . . . . . . . . . . . . . . . . . . . . . 15 MODFLOW File Descriptions. . . . . . . . . . . . . . . . . . . . . . . . . . 16 1 Introduction to Nimue beta Welcome to Nimue beta Nimue (pronounced nee-moo-wey) is an open source visualization software package designed to view groundwater modeling data outputted from MODFLOW, the hydrogeology industry standard software for groundwater modeling. Nimue is designed specifically for managers and decision makers. Today’s software products available for viewing MODFLOW data sets require the technical skills of a hydrologist. Usually this is not problematic because a hydrologist is using the same software for modeling groundwater scenarios as it is to present the results. Working with local and regional water managers in central Arizona has shown that a more intuitive viewer which facilitates policy decision making is important when a regional stakeholder group is looking at various scenarios. A user-friendly visualization can provide decision makers a flexible venue for investigating scientific information. Furthermore, the 3D capabilities provided in this framework allow stakeholders of all backgrounds to understand the information in ways that are not available in today’s commercial viewers. Nimue Quick Facts: Hardware Requirements • Easy viewing and navigation in three dimensions of MODFLOW data Nimue is a sophisticated software visualization package and therefore requires a computer with 3D rendering capabilities. • Ability to import geographic data Recommended system hardware: • Animation feature runs through time steps of data • Intel Dual Pentium 4 2.6GHz or faster • Interactive cross-section generation that cuts across data surfaces • 1GB RAM • • Convenient creation of 3D fly-through of data 256 MB 3D graphics card • • Quick export of images from viewer Microsoft Windows XP or later • CD-ROM drive (for installation disc) • 65 MB disk space (not including MODFLOW files) 1 Installation Guide The following steps detail the installation instructions for Nimue. • Insert the Nimue CD-ROM into your computer. • Double click “My Computer”, and then double click on your CD drive icon to view the disc contents. • Double click the “Nimue.exe” file to begin the installation process. • This will automatically launch the WinZip Self-Extractor program. • When prompted to install the “Visual C++ Runtime Libraries”, choose install. This is necessary to enable Nimue to run. 2 “Welcome to the Nimue Setup Wizard” The following steps will complete the Nimue installation on your computer. • After the Visual C++ Runtime Libraries have been installed, the Nimue Setup Wizard will open. Click on “Next” to continue. • Choose a location to install the program to. The default location will install to your Program Files. Click on “Browse” to change the install location. • You can also choose which accounts on your computer can use Nimue by switching the “Everyone” or “Just Me” option. • The final step is to choose “Next” when the “Confirm Installation” screen pops up. • This completes the installation of Nimue on your computer. 3 4 2 Getting Started The MODFLOW environment essentially has two sections: the main viewing window and many small modules that perform specific functions. These modules are “dockable”, meaning they can be moved and adjusted to fit the needs of a particular session. Because of this, modules can be scaled down to fit on smaller screens, or removed altogether. To move a module window, click and drag the module window title bar until the window snaps out of place. When the module is moved over space that it can dock to the space below will be highlighted in blue. Modules can remain independent of other docked windows if moved to an open space on the screen. MODFLOW modules can also be arranged in tabs, making organization easier and free up window space. To create a module tab, drag the window over the same space as another module until the space below is highlighted in blue. Releasing the window will automatically dock the module. This process can easily be reversed by dragging the desired module away Docked Un-docked Tabs from its current position. Closing module windows will remove them from the current session. At any point however, module windows can be returned by navigating the “View” menu and selecting “Docking Windows”. Docking Windows Menu 5 Navigation: Mouse Controls: Left mouse button: Click and hold to rotate the entire model around a center axis. Right mouse button: Click and hold, then move mouse forward or backward to zoom in/out. 1 Zoom in Zoom 2 Middle mouse button OR both mouse buttons: “S” key plus left mouse button: Click and hold the middle mouse button or click and hold both the left and right buttons to “grab” and move the model along a single axis. Push the “s” key then click and hold the left mouse button to define a new center location for the rotation axis. Press “f ” to return to the default center location. OR Key Commands: Arrow Keys - Rotates the scene 45 in the direction pressed. Spacebar - Resets the camera orientation to the default position. X axis will move to a horizontal position. The zoom level is not changed when spacebar is pushed. F – Returns model to default view. (Must be pressed once after loading new MODFLOW file to bring the model into view) H – Toggles the wire frame and shaded rendering settings together. P - Toggles the points rendering view on or off. W – Toggles the wire frame view mode on or off. 6 Importing Data: From the file menu you can open existing Nimue projects, or create a new project by choosing • or • File > New > MODFLOW Document File > Scene > Document Nimue models are built from a combination of different MODFLOW data sets. These include: • Discretization files (.dis) • • Basic Package files (.ba6) Recharge file (.rch) • • Head Level Output files Auxiliary Data • GIS Coordinate System Descriptions of each of these file types can be found in Chapter 4. 7 Modules MODFLOW Layers (Table of Contents): The “MODFLOW Layers” window allows you to toggle which data sets to view on and off. Top level layers can be expanded to view their contents by clicking on the + box. Each sub-layer can be turned on or off by clicking the box beside the name. MODFLOW Properties: Vertical Scale: Set the vertical scale for terrain in your model. Units correspond to settings found in the loaded MODFLOW data. Scale is from 1-99. MODFLOW Animation: The animation module serves as the controls for animation sets found in the loaded MODFLOW data. The buttons function much like a video player. Time steps for animations can be seen at the bottom left of the scene window. STEP BACKWARD REVERSE STOP PLAY STEP FORWARD Cross Section Tool: This function allows you to slice your models to create crosssectional views of your data. Choose the axis from which you want to cut the model using the radio buttons, then enter the appropriate UTM coordinate in the box or move the slide bar to create a rectangular plane that intersects the model. 8 Screen shot: This function will create a screen capture of the scene. Once you click “Screenshot”, a window will pop up that allows you to create a file name and navigate to the correct directory where you can save the document. You can save screen captures as .bmp, .jpeg, and .png files. The Frame Scale option will multiply the resolution by the selected factor. While you can choose a scale from 1-99, images scaled larger than a factor of 10 may be too large to export. Progress Bars: When loading a file, this window provides visual feedback on the progress. This can come in handy when dealing with particularly large data sets. When no files are being loaded, this window will appear empty. Text Output: This window provides program status. Examples of typical messages include: • MODFLOW data loading status • Software version information • Availability of plug-ins • Error messages 9 10 3 Operations File Menu New: • MODFLOW Document - This opens the import dialog. • Scene Document - Opens a blank scene. Drag and drop OSG files onto the new scene to load. Open: Use when loading existing MODFLOW documents. Save/Save As: Export: Render Loop: Render Loop allows for continuous redrawing of the scene. This function is only necessary when using Open Scene Graph documents, and therefore does not apply to MODFLOW data. Polygons: Specifies how polygons in the model will appear • Filled – the default setting where all features are visible • Hidden Lines – Turns off filled polygons to show hidden lines and removes shading • Image - Exports the scene as a raster. (.jp g, .bmp, .png, .rgba) • • Model - Exports all data into the native file formats for Open Scene Graph. (.ive, .osg) Wire Frame – Switches to viewing only polygon vertices and their connecting lines • Points – Switches to showing only polygon vector points. • Scene - If you are including a cross section that cuts your model data and wish to preserve this in the exported model, select “export scene”. This option exports model data in the native file formats for Open Scene Graph. (.ive, .osg) View Menu Background: Use this option to change the color shading of your background. Selecting different colors for different corners will create gradient shades between them. Modes: Navigate: The default navigation with mouse control. Pick: Enables the use of the right mouse button to bring up an options menu. Seek: Centers the scene where the mouse is clicked. Rendering Passes: This selection increases the resolution of the output screen shots from the Frame Dump option. A higher number will create more instances of exported frames. Shading: Changes the triangle size of the terrain layer. Smooth renders terrain polygons at a fine level, and flat will reduce the terrain to a course level. Size: Choose from several common resolution settings for the render window, or enter a custom window size. Frame Dump: Frame Dump will export an image continuously to a defined location on your computer. The Rendering Passes menu controls how often the scene image is saved. To begin the process, click “Frame Dump” in the View menu. The Text Output module will display the image file currently being written. To stop the process, choose “Frame Dump” again. It should be noted that if the Frame Dump process is left on, files will be written to the hard drive until no space remains. The appropriate location to save frames should be outside of the Nimue program folder. Additionally, make sure the folder you choose to save frames to does not contain spaces in the name. For example, “SaveFrames”, not “Save Frames”. 11 Show Axes: Toggles the view of the X, Y, and Z axis in the lower left corner of the scene. Cameras The camera menu functions allow the user to save specific views of their data loaded in the window. This function is useful for saving perspectives that highlight elements of your data. Each camera path can store many perspective views. The collection of perspective shots can further be used to generate flights between perspective views. These functions can be particularly useful for presenting data. New Path Creates a new blank camera file with the extension *.cpf. In order to create new camera paths, you must first click “New Path.” When you have set the correct perspective view in the window that you want to save, click “Append.” Clicking Append saves the first camera in your new Camera Path. Once you have appended a new view to the camera path, you can go back to that view by navigating to “Cameras” in the menu. The first perspective saved will be called “Camera 0”. The next camera view saved will be called “Camera 1”. Open Path If you have existing camera paths saved with the extension *.cpf, you may open that file by clicking “Open Path” and navigating to the directory where you have saved your *.cpf file. Save Path Once you have created a camera path using “New Path” it will not be saved unless you click “Save Path.” You may navigate to anywhere you would like to store your *.cpf file. Save Path As You may save your camera paths either by clicking “Save Path” or “Save Path As.” Using “Save Path As” allows the user to save a new camera path or existing camera path as another name or in another directory. Export Movie This function is currently grayed out and will be available in Nimue 2.0. Append Use Append to create a new camera view to be saved in your camera path. Each time you use Append, it will create a new camera view and append it to the list of cameras in the “Cameras” drop down. Prepend Use Prepend to create a new camera view to be saved in your camera path. Each time you use Prepend, it will create a new camera view and add it to the beginning of the list of cameras in the “Cameras” drop down. Close The Close function adds a camera to the end of your list of camera views that is identical to your first camera view, Camera 0. This function is useful when using the “Play Forward” and “Play Backward” functions. Play Forward When clicking on “Play Forward” the scene will animate by flying from camera to camera in your set of camera views. “Play Forward” will run from Camera 0 to the end of your list in order. Play Backward When clicking on “Play Backward” the scene will animate by flying from camera to camera in your set of camera views. “Play Backward” will run from your last Camera to Camera 0 in reverse order. Stop The Stop menu will only be active when Nimue is in Play Forward or Play Backward. It will stop the flight between camera views at any time. 12 Degree Degree determines the nature of flight between cameras when using Play Forward or Play Backward. For example, 1 = linear flight path, 3= cubic flight path. Experiment with these options to find your preference for flying between cameras. Step Size This function controls the speed of flight between cameras. The numbers represent relative speeds of flight between one camera to another. Camera Paths If you have opened more than one *.cpf document, you can switch between them by checking them in the Camera Paths drop down. Help The Help menu contains a link that will open this user manual. 13 14 4 Model Data Geographic Data The follow paragraphs identify and describe the MODFLOW file types recognized by Nimue. Nimue was developed to accept MODFLOW 2000 free-format files. Other file formats are not recommended. Terrain Included in this version of Nimue is the topographic of the Salt River Valley in central Arizona, originally obtained from the US Geological Survey Seamless website (http://seamless.usgs.gov) as a digital elevation model (DEM). It has been converted into an OpenSceneGraph file here. Subsurface Bedrock Included in this version of Nimue is the subsurface bedrock topography expressing the basin and range topography of the Salt River Valley. The data originates from Oppenheimer and Sumner (1980). This data was processed using ArcMap and ArcScene to convert vector contours into a raster surface, and then merged to the surface bedrock from the USGS DEM by Jessica Block. It was then converted into an OpenSceneGraph file. Imagery Included in this version of Nimue is the 2005 LANDSAT imagery from NASA’s Onearth website (http://onearth.jpl.nasa.gov/). It is being used as the texture for the terrain listed above. Overlaying the imagery are the major highways through central Arizona. 15 Surface Water Canals One of the key components to water use is water delivery infrastructure. Nimue includes vector line files for the surface water canals of the Salt River Valley including the canals for CAP and SRP. This data comes from the Arizona Water Banking Authority GIS Database for Phoenix and Tucson Active Management Areas. Recharge Locations This point data set includes most of the recharge locations in the Salt River Valley. This data set also comes from the Arizona Water Banking Authority GIS Database for Phoenix and Tucson Active Management Areas. Well File (SRV model extension *.wel) Simulates pumpage, recharge, and groundwater flux into and out of the model for each stress period. Negative values represent well pumpage that is distributed by cell and layer or estimated groundwater underflow out of the model along selected model boundaries. Positive pumpage values represent specified mountain front recharge, ephemeral stream recharge, and underflow into the model along some of the model boundaries. This file is known by Nimue as the “pumping” and is added to the MODFLOW layers view by listing in each layer that has associated. It is displayed in Nimue by vertical cylinders. Water being taken out of the ground is represented by cylinders pointing up. Recharge is represented by cylinders pointing below the land surface. When importing a pumping file, the user may choose which color to display the cylinders. MODFLOW File Descriptions Nimue supports the following MODFLOW documents: Discretization File (SRV model extension *.dis): Nimue reads the number of model layers and the cell rows and columns. Additionally it extracts a conversion constant that provides the appropriate distance units. It also assigns the thickness of every layer by defining the model surface elevation, bottom of layer 1 (Upper Alluvial Unit), bottom of layer 2 (Middle Alluvial Unit), and bottom of layer 3 (Lower Alluvial Unit) for every active cell. Basic File (SRV model extension *.ba6): Defines the active model array and the starting heads. Block-Centered Flow File (BCF) (SRV model extension: *.bc6) Defines the model layer type, turns on rewriting capability, and assigns hydraulic properties to each active model cell. The layer type flag in the BCF package defines how the transmissivity for each model cell is calculated. The hydraulic conductivity, primary and secondary storage (when applicable), and the vertical hydraulic conductivity (Vcont) are assigned using the BCF package. Example recharge and well data. The purple cylinders indicate well data pumpage volume and the yellow cylinders indicate recharge volume. Recharge File (SRV model extension *.rch) The Recharge file applies aerial recharge to cells within the model. The source of aerial recharge includes natural recharge (mountainfront and stream infiltration) and incidental recharge (agricultural, artificial, and urban). Recharge cylinders are represented by cylinders pointing below the land surface. 16 references Corkhill, E.F. and S. Corell, A Regional Groundwater Flow Model of the Salt River Valley – Phase I, Phoenix Active Management Area, Hydrogeologic Framework and Basic Data Report, Modeling Report No. 6, Arizona Department of Water Resources, 1993. Corell, S.W. and E.F. Corkhill, A Regional Groundwater Flow Model of the Salt River Valley – Phase II; Phoenix Active Management Area, Numerical Model, Calibration, and Recommendations, Modeling Report No. 8, Arizona Department of Water Resources, 1994. Gray, S.T., Bettancourt, J.L., Fastie, C.L., and Jackson, S.T., Patterns and sources of multidecadal oscillations in drought-sensitive tree-ring records from the central and southern Rocky Mountains, Geophysical Research Letters, 30(6), pp.49-49, 2003. Oppenheimer, J.M., and J.S. Sumner, Depth-to-Bedrock Map, Basin and Range Province, Arizona, scale 1:1,000,000, Laboratory of Geo physics, University of Arizona, 1980. US Bureau of Reclamation, Arizona Water Banking Authority GIS Database for Phoenix and Tucson Active Management Areas, 2004. US Geological Survey, 30-meter Digital Elevation Model, Seamless Website: http://seamless.usgs.gov 17