1
GMS User Manual (v8.3)
The Groundwater Modeling System
PDF generated using the open source mwlib toolkit. See http://code.pediapress.com/ for more information.
PDF generated at: Tue, 31 Jul 2012 20:55:45 UTC
Contents
Articles
1. Learning GMS
1
What is GMS?
1
The GMS Screen
1
Tool Palettes
4
Project Explorer
6
Tutorials
7
2. Set Up
8
64 bit
8
License Agreement
8
Registering GMS
9
Community Edition
10
Graphics Card Troubleshooting
11
Reporting Bugs
14
3. General Tools
15
3.1. The File Menu
16
The File Menu
16
3.2. The Edit Menu
17
The Edit Menu
17
Units
18
Preferences
19
Materials
23
Material Set
24
3.2.1. Coordinate Systems
25
Coordinate Systems
25
Coordinate Conversions
27
Projections
28
CPP Coordinate System
29
Geographic Coordinate System
30
Local Coordinate System
30
Coordinate Transformation
31
Transform
32
3.3. The Display Menu
33
The Display Menu
33
Contour Options
35
Animations
37
Color Ramp
39
3.3.1. Display Options
41
Display Options
41
Drawing Grid Options
42
Vectors
43
Lighting Options
44
Plot Axes
45
3.4. Other Tools
47
Annotations
47
CAD Options
51
Cross Sections
51
Data Sets
55
Data Calculator
58
Display Theme
60
XY Series Editor
61
4. Interpolation
62
4.1. Introduction
63
Interpolation
63
Interpolation Commands
64
3D Interpolation Options
65
Steady State vs. Transient Interpolation
66
4.2. Linear
Linear
4.3. Inverse Distance Weighted
67
67
68
Inverse Distance Weighted
68
Shepards Method
68
Gradient Plane Nodal Functions
69
Quadratic Nodal Functions
70
Subset Definition
71
Computation of Interpolation Weights
72
4.4. Clough-Tocher
74
Clough-Tocher
74
4.5. Natural Neighbor
75
Natural Neighbor
75
4.6. Kriging
78
Kriging
78
Kriging Options
81
3D Kriging
82
Variogram Editor
83
4.7. Jackknifing
Jackknifing
90
90
5. Modules
91
5.1. TIN Module
92
TIN Module
92
Creating a TIN
93
Editing a TIN
94
TIN Settings
97
TIN Display Options
97
TIN Tool Palette
99
Converting TINS to Other Data Types
100
Building Solids and 3D Meshes with TINs
101
Triangulation
102
TIN Files
103
5.2. Boreholes Module
106
Boreholes Module
106
Creating and Editing Boreholes
107
Borehole Display Options
108
Borehole Tool Palette
109
Borehole Hydrogeologic Units
110
Converting Borehole Data
111
Borehole Cross Sections
112
5.2.1. Horizons
116
Horizons
116
Horizon Conceptual Model
117
Horizons Applications
119
Horizons to HUF
121
Horizons Wizard
122
Horizons to Solids
123
Horizons to 3D Mesh
125
5.3. Solid Module
126
Solid Module
126
Solid Properties
127
Solid Primitives
128
Solid Display Options
129
Solid Module Tool Palette
129
Solids to Layered Mesh
130
Solids to HUF
131
Solids to MODFLOW Command
132
5.4. 2D Mesh Module
139
2D Mesh Module
139
Creating a 2D Mesh
140
Editing 2D Meshes
141
2D Mesh Settings
144
2D Mesh Display Options
145
2D Mesh Tool Palette
146
Converting a 2D Mesh to other types of Data
148
Element types
150
2D Mesh Polygon Attributes
152
5.5. 2D Grid Module
155
2D Grid Module
155
2D Grid Types
156
Creating and Editing 2D Grids
156
2D Grid Display Options
158
2D Grid Tool Palette
159
Converting 2D Grids
160
5.6. 2D Scatter Point Module
161
2D Scatter Point Module
161
Creating and Editing 2D Scatter Point Sets
162
2D Scatter Point Display Options
163
2D Scatter Point Tool Palette
164
Interpolating with 2D Scatter Points
164
Converting 2D Scatter Points to Other Types of Data
165
Gaussian Field Generator
165
Active/Inactive Points
168
2D Interpolation Options
169
5.7. 3D Mesh Module
171
3D Mesh Module
171
3D Element Types
171
Creating a 3D Mesh
172
Editing a 3D Mesh
174
3D Mesh Display Options
177
3D Mesh Tool Palette
178
Classify Material Zones
180
Iso Surfaces
181
Converting 3D Meshes to Other Data Types
184
Building the 3D Mesh from the FEMWATER Conceptual Model
185
5.8. 3D Grid Module
186
3D Grid Module
186
3D Grid Types
187
Creating and Editing 3D Grids
187
3D Grid Display Options
189
3D Grid Tool Palette
190
Classify Material Zones
191
3D Grid Viewing Modes
192
Converting 3D Grids to Other Data Types
193
Exporting Grids
195
Cell Properties
196
Active/Inactive Cells
197
Named Layer Ranges
198
Redistribute Grid Cells
198
Redistribute Layers
5.9. 3D Scatter Point Module
199
200
3D Scatter Point Module
200
3D Scatter Point Display Options
201
3D Scatter Point Tool Palette
202
Interpolating with 3D Scatter Points
202
Converting 3D Scatter Points to Other Data Types
203
Bounding Grid
203
5.10. Map Module
204
Map Module
204
Feature Objects
205
Conceptual Model
208
Feature Object Display Options
209
Feature Object Tool Palette
210
Coverages
211
Grid Frame
213
Clean Command
213
Temporal Discretization
214
Map to Models
215
Map to Modules
216
5.11. GIS Module
219
GIS Module
219
GIS Display Options
220
GIS Tool Palette
220
Enabling ArcObjects
221
GIS to Feature Objects
222
Add Data
223
Arc Hydro Groundwater
223
6. Models
224
6.1. FEMWATER
225
FEMWATER
225
6.1.1. FEMWATER Pre-Processing
Building a FEMWATER Model
226
226
FEMWATER Conceptual Model Approach
229
FEMWATER Flows
231
Point Source/Sink BC
231
Assign Node/Face BC
232
FEMWATER Point / Arc Properties
233
FEMWATER Model Input
235
FEMWATER Initial Conditions
238
Saving a FEMWATER Simulation
240
6.1.2. FEMWATER Post-Processing
241
FEMWATER Display Options
241
FEMWATER Post Processing Viewing Options
242
FEMWATER Particle Sets
243
6.2. MODAEM
244
MODAEM
244
MODAEM License Agreement
245
MODAEM Display Options
252
6.3. MODFLOW
253
MODFLOW
253
MODFLOW 2005
254
6.3.1. MODFLOW Packages
256
MODFLOW Packages Supported in GMS
256
BCF Package
260
CHD Package
262
DE4 Package
263
DRN Package
264
DRT Package
265
ETS Package
266
EVT Package
268
GHB Package
270
Global Options/Basic Package
271
GMG Package
274
HFB Package
275
HUF Package
276
LAK Package
278
LMG Package
278
LMG1 Package
280
LPF Package
281
MNW1 Package
283
MNW2 Package
284
NWT Package
285
PCG2 Package
286
RCH Package
287
RIV Package
288
SIP Package
289
SSOR Package
290
STR/SFR Packages
291
UZF Package
293
WEL Package
295
6.3.2. MODFLOW Pre-Processing
296
Building a MODFLOW Model
296
MODFLOW Array Editor
296
MODFLOW Grid Approach
298
MODFLOW Conceptual Model Approach
298
Activate Cells in Coverage
301
Stress Periods
302
Map to MODFLOW
303
Defining the Layer Elevations
305
Standard MODFLOW Parameters
308
MODFLOW Parameters - Two Methods
314
Conductance
314
Convergence Options
316
MODFLOW Parameters Disclaimer
317
Saving and Reading a MODFLOW Simulation
318
Output Control
319
Importing MODFLOW Files
320
MODFLOW with HDF5
327
Unsupported MODFLOW Features
331
Interpolate to MODFLOW Layers
332
MODFLOW Layers to 2D scatter points
334
MODFLOW Source/Sink Dialog
334
6.3.3. MODFLOW Post-Processing
337
MODFLOW Display Options
337
MODFLOW Post Processing Viewing Options
338
MODFLOW Solution Properties Dialog
340
Saving and Reading a MODFLOW Simulation
342
Cell Properties
343
MODFLOW World File
344
Error Summary Plot
345
Zone Budget
346
ZONEBUDGET
349
Viewing Computed Fluxes
350
6.4. MODPATH
351
MODPATH
351
MODPATH Particle Tracking
352
MODPATH Particle Sets
354
MODPATH Zone Codes
355
MODPATH Display Options
356
Exporting Pathlines
357
6.5. MT3DMS
358
MT3DMS
358
MT3D Packages
359
MT3D Source/Sink Mixing Package
360
Basic Transport Package Dialog
361
ICBUND Array
364
MT3D Source/Sink Mixing Package
365
MT3D point Sources/Sinks BC
367
Building an MT3DMS Simulation
368
Saving an MT3DMS Simulation
369
Importing an MT3D Simulation
369
MT3DMS Display Options
370
Calculate Mass
370
6.6. PEST
PEST
6.7. RT3D
371
371
372
RT3D
372
Basic Transport Package Dialog
374
6.8. SEAM3D
SEAM3D
6.9. SEAWAT
377
377
378
SEAWAT
378
Building a SEAWAT Model
379
SEAWAT Global Options Dialog
380
SEAWAT MODFLOW AUX Variables
380
SEAWAT Packages
381
Importing a SEAWAT Simulation
382
6.10. SEEP2D
383
SEEP2D
383
SEEP2D Display Options
386
SEEP2D Solution
387
6.11. T-PROGS
388
T-PROGS
388
Vertical Markov Chain
394
Strike Dip Markov Chain
398
TSIM
400
6.12. UTEXAS
401
UTEXAS
401
UTEXAS Display Options
407
6.13. WASH123D
WASH123D Display Options
408
408
7. Modeling
410
7.1. Calibration
411
Model Calibration
411
Automated Parameter Estimation
412
Parameter Estimation Dialog
414
PEST
418
Run Options
419
Observations
422
Plot Wizard
425
Calibration Targets
438
Model Checker
438
7.2. Parameters
440
Parameters
440
Parameter Dialog
442
Pilot Points
446
Multiplier Arrays for Parameters
447
Standard MODFLOW Parameters
448
7.3. Stochastic Modeling
455
Stochastic Modeling
455
Gaussian Field Generator
459
Risk Analysis Wizard
462
8. Importing/Exporting Data
466
Importing Non-native GMS Files
466
Text Import Wizard
467
Text Import Wizard Supported File Formats
468
Importing/Exporting CAD Data
474
Importing USGS DEMs
475
Importing/Exporting GIS Grids
476
Importing/Exporting Shapefiles
477
Shapefiles
481
Import From Database
481
Import from Web
482
Exporting Non-native GMS Files
488
Images
489
Registering an Image
490
KMZ files
492
GeoStudio Import
494
9. Appendix
495
File Formats
495
Data Set Files
496
Bugfixes GMS
505
Dialog Help
522
References
Article Sources and Contributors
533
Image Sources, Licenses and Contributors
540
1
1. Learning GMS
What is GMS?
The Groundwater Modeling System (GMS) is a comprehensive graphical user environment for performing
groundwater simulations. The entire GMS system consists of a graphical user interface (the GMS program) and a
number of analysis codes (MODFLOW, MT3DMS, etc.). The GMS interface is developed by Aquaveo, LLC in
Provo, Utah.
GMS was designed as a comprehensive modeling environment. Several types of models are supported and facilities
are provided to share information between different models and data types. Tools are provided for site
characterization, model conceptualization, mesh and grid generation, geostatistics, and post-processing.
The GMS Screen
The GMS screen is divided into seven main sections:
The GMS Screen
Menu Bar
Each module has its own set of menus. The first three menus (File, Edit, Display) are the same for every module.
The remaining menus are dependent on the selected module.
Edit Window
These fields are used to edit the coordinates of selected items (vertices, nodes, scatter points, etc.). The coordinates
are changed by typing in new values and hitting the ENTER or TAB key. The scalar data value (F:) associated with
the selected object can also be edited.
Tool Palette
Several Tool Palettes can be displayed in the GMS interface. Default tool palettes include the Macros Palette, the
Static Tool Palette, the Dynamic Tool Palette, the Mini-Grid Plot Palette, and the Module Palette. (For more
information on each of these palettes see Tool Palettes)
Graphics Window
The primary graphical input and output for GMS takes place in the Graphics Window. The action taken when you
interact with the Graphics Window depends on which tool is selected.
Every object that can be selected in the Graphics Window now has a corresponding right-click menu available.
These menus contain commands that allow the user to manipulate the data or display of the selected items.
2
The GMS Screen
3
Example of a right-click menu on a arc in the map module.
Project Explorer
The Project Explorer is located at the left side of the GMS window
by default, but it can be moved to anywhere on the window since
it is a dockable toolbar. The Project Explorer contains a
hierarchical representation of the data associated with a modeling
project. The Project Explorer can also be resized simply by
clicking on the window borders and dragging them to a new
location.
Many commands on the data in GMS can be executed by
right-clicks in the Project Explorer. For general commands or to
create new data objects you can right-click on the empty space in
the Project Explorer and the following pop-up menu is available.
The visibility of items in the Graphics Window can also be
controlled by selecting the toggle next to each item in the Project
Explorer.
The GMS Screen
Time Step Window
The Time Step Window is located below the Project Explorer by default, but
it can be moved to anywhere on the window since it is a "dockable" toolbar.
The Time Step Window only appears when a transient data set is selected in
the Project Explorer. Time steps can be viewed in date/time format or relative
time format by selecting the toggle below the Time Step Window. The Time
Step Window can be resized simply by clicking on the window borders and
dragging them to a new location.
Status Bar
The Status Bar is used to display the cursor coordinates, the IJK indices of the cell beneath the cursor, the data set
value beneath the cursor, data associated to selected items, and other information.
Tool Palettes
There are several Tool Palettes that can be displayed in the GMS interface. Below are the tool palettes that are on by
default.
4
Tool Palettes
5
Macros
Many of the more frequently used menu commands can be accessed through the macro buttons. These buttons
essentially serve as shortcuts to menu commands.
Static Tool Palette
The Static Tool palette contains the tools which are available in every module. These tools are tools for basic
operations such as panning and zooming. Only one tool is active at any given time. The action that takes place when
the user clicks in the Graphics Window depends on the current tool. The following table describes the tools in the
Static Tool palette.
Tool
Tool
Name
Pan
Zoom
Rotate
Description
The Pan tool is used to pan the viewing area of the Graphics Window. Panning can be done in 3 ways:
•
When the Pan tool is active, holding down the main mouse button while dragging moves the view.
•
If another tool is active and you don't want to switch tools, you can pan by holding down the F2 key and clicking and dragging
with the mouse.
•
If your mouse has a middle button (or a mouse wheel), you can hold it down and drag to pan the view.
The viewing area can be magnified/shrunk using the Zoom tool. Zooming can be done in the following ways:
•
With the zoom tool selected, clicking on the screen zooms the display in around the point by a factor of two. Holding down the
shift key zooms out.
•
With the zoom tool selected, a rectangle can be dragged around a portion of the display to zoom in on that region. Holding
down the shift key zooms out.
•
If another tool is active and you don't want to switch tools, you can zoom by holding down the F3 key and clicking and
dragging with the mouse.
•
If your mouse has a middle button (or a mouse wheel), you can scroll the wheel to zoom in and out.
The Rotate tool provides a quick way to rotate the viewing location. Rotating can be done in the following ways:
•
With the rotate tool selected, holding down the mouse button and dragging the cursor in the Graphics Window rotates the
object in the direction specified. A horizontal movement rotates the image about the z axis. A vertical movement rotates the
image about the x and y axis. The amount of rotation depends on the length the cursor moves while the mouse button is down.
•
If another tool is active and you don't want to switch tools, you can rotate by holding down the F4 key and clicking and
dragging with the mouse.
•
The viewing angle can also be entered directly.
Dynamic Tool Palette
When the active module is changed by selecting an object in the Project Explorer, the tools in the Dynamic Tool
Palette change to the set of tools associated with the selected object/module. Each module has a separate set of tools.
Mini-Grid Toolbar
The Mini-Grid Toolbar appears when a 3D grid is in memory and is activated when the orthogonal viewing mode is
active. In the orthogonal mode, the viewing angle is always parallel to one of the three grid axes (I, J, or K) and only
one of the rows, columns, or layers is displayed at one time. The Mini-Grid Toolbar shows an idealized
representation of the 3D grid and shows which of the rows, columns, or layers is currently being displayed. The
current row, column, or layer can be changed using the arrows just below the Mini-Grid Toolbar.
Tool Palettes
6
Module Palette
The Module Palette is used to switch between modules. Only one module is active at any given time. However, the
data associated with a module (ex. a 3D finite element mesh) is preserved when the user switches to a different
module. Activating a module simply changes the set of available tools and menu commands.
Project Explorer
The Project Explorer is located at the left side of the GMS window by default.
It can be moved to anywhere on the window since it is a "dockable" toolbar.
The Project Explorer contains a hierarchical representation of the data
associated with a modeling project. Previously only the data form the active
module was displayed in the Project Explorer, but now all of the data in GMS
is always displayed independent of the active module. The new Project
Explorer can also be resized simply by clicking on the window borders and
dragging them to a new location.
All of the modules have root items coresponding to them. Each root item may
be right clicked on to accomplish certain actions. Data for each module is
grouped into folders. The modules and items can also be expanded and
colapsed to show sub folders. Each item may also be turned on or off by
clicking the check box next to the item. Many items in the project explorer
can be dragged to different locations to be used with different modules. Items
may also be duplicated.
Many commands on the data in GMS can be executed by right-clicks in the Project Explorer. For general commands
or to create new data objects you can right-click on the empty space in the Project Explorer and the following pop-up
menu is available. Right click commands can also be used to export or transform items. The visibility of items in the
Graphics Window can also be controlled by selecting the toggle next to each item in the Project Explorer.
Tutorials
Tutorials
A rich set of step-by-step tutorials has been developed to aid in learning how to use GMS. If this is your first time
using GMS it is highly recommended that you look through the online Quick Tour first before doing the tutorials.
The tutorials are in PDF format. They are installed in the "docs" or "tutfiles" directory in the folder where GMS is
installed.
The tutorials are listed below by subject and are not necessarily listed in the suggested order of completion. Some
tutorials assume a basic knowledge of GMS and some build on other tutorials. When this is the case the tutorial itself
will state which tutorials you should complete beforehand.
Many of the tutorials have files that are needed to run the tutorial. These files can be found in the "tutfiles" folder
where GMS was installed.
7
8
2. Set Up
64 bit
Starting at GMS 8.1, GMS is available in a 64 bit version. This means:
• GMS can access more RAM so larger models can be created
• A 64 bit version of MODFLOW is included and can be used by changing an option in the Preferences dialog
• ArcObjects is not available because ESRI [1] has not created a 64 bit version
References
[1] http:/ / www. esri. com
License Agreement
AQUAVEO SOFTWARE LICENSE AGREEMENT
We understand that neither Aquaveo LLC nor its employees makes any warranty express or implied, or assumes any
legal responsibility for the accuracy, completeness, or usefulness of the computer programs and documents herein
ordered. We acknowledge that Aquaveo’s liability for damages associated with these programs is limited to the
amounts paid to Aquaveo. We understand that we may register the executable on only one machine per license
purchased. We also agree to not make the program available to more persons, at any given time, than the number of
licenses purchased. We agree to not distribute this program in unmodified or modified form, outside our organization
without the written permission of Aquaveo.
License agreements for software used by Aquaveo software
FTGL LICENSE AGREEMENT
http:/ / ftgl. wiki. sourceforge. net/ states: "FTGL is free software. You may use it, modify it and redistribute it under
the terms of the MIT license or the GNU LGPL, at your option."
The MIT license link is to http://en.wikipedia.org/wiki/MIT_License, which states:
Copyright (c) <year> <copyright holders> Permission is hereby granted, free of charge, to any person obtaining a
copy of this software and associated documentation files (the "Software"), to deal in the Software without restriction,
including without limitation the rights to use, copy, modify, merge, publish, distribute, sublicense, and/or sell copies
of the Software, and to permit persons to whom the Software is furnished to do so, subject to the following
conditions:
The above copyright notice and this permission notice shall be included in all copies or substantial portions of the
Software.
THE SOFTWARE IS PROVIDED "AS IS", WITHOUT WARRANTY OF ANY KIND, EXPRESS OR IMPLIED,
INCLUDING BUT NOT LIMITED TO THE WARRANTIES OF MERCHANTABILITY, FITNESS FOR A
PARTICULAR PURPOSE AND NONINFRINGEMENT. IN NO EVENT SHALL THE AUTHORS OR
COPYRIGHT HOLDERS BE LIABLE FOR ANY CLAIM, DAMAGES OR OTHER LIABILITY, WHETHER IN
AN ACTION OF CONTRACT, TORT OR OTHERWISE, ARISING FROM, OUT OF OR IN CONNECTION
License Agreement
WITH THE SOFTWARE OR THE USE OR OTHER DEALINGS IN THE SOFTWARE.
Registering GMS
When you first install GMS, it will be running in Demo Mode. All GMS functions will be enabled with the
exception of printing and saving. Anyone can run GMS in Demo Mode on any computer and it can be freely
distributed. To enable the print and save functions, you need either a password or a hardware lock.
The components (modules, interfaces) can be licensed individually depending on the needs and interests of the user.
The components of GMS are licensed using a password system. The Register command is used to enter a password
that enables the licensed components. This command can be used to enable the program after initially installing
GMS, or for adding additional modules to the program at a later time. The Register command must be used before
any files can be saved or printed. Before registration, GMS will run in Demo Mode.
When the Register command is selected, the Register dialog appears. The first item shown in the dialog is the
security string. This string is keyed to the hard drive of the computer where GMS is installed and uniquely identifies
the computer. When first registering GMS, this security string should be reported to the distributor or reseller where
GMS was purchased. The reseller then provides a password which should be entered in the edit field at the top of the
dialog. Once the password is entered, the Register button is selected. If the security string was reported correctly and
the password was entered correctly, the text next to each of the licensed components changes from "DISABLED" to
"ENABLED".
The Details button brings up a dialog listing the phonetic code for the security string. When reporting the security
string over the phone to get a password, using the phonetic code can be helpful in avoiding errors.
Once GMS has been registered, a file called gmspass.txt is created. Since GMS is licensed on a per/seat basis,
arrangement must be made to get an additional password if GMS is to be moved to another computer.
Also, GMS can also be enabled using a hardware lock, rather that a password. Contact your GMS reseller for details.
Password
From the File menu, select the Register command. This brings up the Register dialog, which has a "security string"
listed at the top. Send this security string along with your name, company, phone number, and e-mail address to your
vendor.
After verifying that you are a licensed user, a password will be sent to you. When you receive the password, enter it
in the Password field in the Register dialog and click the Register button. The modules you purchased will become
enabled and GMS will run in Normal mode.
Hardware Lock
Follow the instructions you received with the hardware lock to install the hardware lock and accompanying drivers.
If you did not receive hardware lock instructions, or they have been misplaced, they can be found in the
\Utils\Hwlock\Instructions directory on the CD. There are separate files for single user and network hardware locks.
These files can be read using your web browser. If you would like to purchase or have questions about hardware
locks, please contact your vendor.
9
Community Edition
10
Community Edition
Starting at version 8.0 there is a free version of GMS called "Community Edition". It is limited to include only the
3D grid module and the MODFLOW model interface. It is also restricted in the size of the grid and the number of
MODFLOW stress periods. Any size model can be imported, but if the grid exceeds 5000 cells or the number of
stress periods is more than 3 the project cannot be saved and a watermark is displayed in the graphics window. The
community edition must still be registered using a license code which can be obtained via the internet from the
Registration Wizard (Help | Register | Change Registration | Get Community Edition License).
You can check if you are running in Community Edition mode by going to the Registration dialog. The size limits
are displayed in the Help|About dialog.
GMS Community Edition warning dialog.
GMS registration dialog showing
that GMS is running in
Community Edition mode.
GMS showing watermark in Community Edition
when size limits are exceeded.
Graphics Card Troubleshooting
Graphics Card Troubleshooting
XMS (WMS, GMS, or SMS) use OpenGL for rendering graphics. OpenGL is a graphics standard, but each
implementation is maintained by individual graphics card companies. Different graphics cards and drivers support
different versions of the OpenGL standard. XMS currently uses features up to version 1.5 of OpenGL (as of April
2009 version 3.1 was most recent version).
Some graphics cards as well as remote desktop do not support functionality through OpenGL version 1.5. This is
mostly a problem with older integrated graphics cards particular manufactured by Intel. This page will give you
some ideas on troubleshooting these problems. The best solution is to get a graphics card that supports later versions
of OpenGL. You will see improved performance as well as be able to access all the features of XMS.
Remote Desktop
XMS (WMS, GMS, or SMS) will have reduced capability when running remote desktop. This is because remote
desktop uses the Microsoft software implementation of OpenGL which only supports OpenGL version 1.1. One
problem that may occur is that the screen may blank out when starting a remote session. This has been fixed and is
available in current beta versions or soon to be released versions of our software (SMS 10.1, GMS ??, WMS ??).
Since remote desktop only supports OpenGL version 1.1 not all of the features of XMS may be available.
1. One solution is to use a different remote control software that utilizes the graphics card of the computer you are
controlling. RealVNC is a program that does this and can be purchased at a reasonable cost. There is a free
version but it has not been tested with the XMS software. See VNC Homepage [1] for more information.
2. Another solution is to use the Mesa software rendering option available in the application's graphic preferences.
See the section below on OpenGL Graphics Dialogs for discussion of this option.
Parallels Desktop for Mac
XMS has reduced capability when running in a pure virtual PC through Parallels Desktop for Mac. Although
Parallels version 6.0 provides OpenGL version 2.1 support (instead of OpenGL version 1.1) when "Enable 3D
acceleration" is selected in the virtual machine's hardware configuration, the Parallels virtual video card adapter does
not render all XMS graphics correctly. The solution is to use the Mesa software rendering option available in XMS's
graphic preferences. See the section below on OpenGL Graphics Dialogs for discussion of this option.
If you are running XMS in a virtual PC utilizing a Boot Camp partition then Parallels uses the actual graphics card
installed in the Mac. See sections below regarding graphics card issues.
OpenGL Graphics Dialogs
XMS (post WMS 8.2, GMS 7.0 onward, and SMS 10.1 onward) have dialogs that allow the selection of OpenGL
support. The choice is between the system default library and the Mesa software library. The system default can
change based upon current conditions such as a remote login. Not all system defaults support all needed graphics
functionality. Therefore Mesa is provided for better functionality at a potential reduction in speed. However, Mesa
may produce poor images when printing. The user can make this tradeoff in the graphics dialog found in preferences.
The dialog provides 4 options so that on subsequent runs XMS will:
1. Ask which graphics library to use if the system does not support all OpenGL functionality needed by XMS. This
option is initially set and gives the following options:
1. Autoselect the Mesa software library for this run if the system default does not support all functionality. XMS
will not prompt on subsequent runs. It will just check support and select a library.
2. Use the system default library on this run (and on future runs if the "Do not ask again box" is checked).
11
Graphics Card Troubleshooting
12
3. Use the Mesa software library on this run (and on future runs if the "Do not ask again box" is checked).
2. Autoselect the Mesa software library if the system default does not support all functionality.
3. Always use the system default library.
4. Always use the Mesa software library.
Determining Graphics Card Manufacturer
Always download and install the latest drivers from your graphics card vendor. Graphics card problems are often due
to using the wrong or outdated drivers. You can use a simple diagnostic program called dxdiag [2] to determine your
computer's hardware, operating system, and graphics card. To use the dxdiag [2] program:
1.
2.
3.
4.
5.
Select "Start"
Choose "Run."
Type "dxdiag" in the box and click "OK."
Click "Yes" to the prompt, and the program will begin running.
Select the "Display" tab and the Name listed under the "Device" section is the name of your graphics card.
You can also:
1. Right-click on the desktop and select "Properties"
2. In the Display Properties dialog, click on the "Settings" tab
3. Your video card manufacturer and chipset is shown below the "Display:" line
4. Look for the names NVIDIA, ATI, Intel, Matrox, SiS, S3, etc.
Updating Laptop Graphics Card Drivers
If you have a laptop, visit the laptop manufacturer's website (Dell
to get the most recent driver.
[3]
, HP or Compaq
[4]
, Toshiba
[5]
, Sony
[6]
, etc.)
Updating Desktop Graphics Card Drivers
If you are using a desktop computer, visit the graphics card manufacturer's website to download the latest driver.
Listed below are a few common graphics cards and links to download their drivers:
•
•
•
•
•
•
•
•
•
•
3DLabs [7]
ATI [8]
Diamond [9]
Elsa [10]
Intel [11]
Matrox [12]
nVidia [13]
S3 [14] - Not all S3 card support OpenGL 1.5 which is required for all display options to be enabled.
SIS [15] - Not all SIS card support OpenGL 1.5 which is required for all display options to be enabled.
VIA [16] - Not all VIA card support OpenGL 1.5 which is required for all display options to be enabled.
Graphics Card Troubleshooting
Updating Windows Operating System
Many problems are resolved by keeping the windows operating system and hardware drivers up to date using the
windows update site [17]. Hardware updates are often only installed if the "Custom" or "Optional" updates are
included.
Updating XMS Software
Many problems are resolved by installing the latest version of XMS. Bugfixes and updates are released frequently.
The updates can be downloaded at the Aquaveo Download Center [18].
Known Graphics Issues
• Issue: Graphic symbols are not displayed correctly and sometimes corrupt text lines located next to them.
Hardware: Make: ATI Technologies Inc. Model: RADEON X600 PRO (0x5B62) Name: ATI Radeon
X300/X550/X1050 Series
Solution: Updating the driver will allow the symbols to display correctly, but the text corruption still remains.
Switch from Hardware to Software Rendering
THE FOLLOWING SHOULD BE ATTEMPTED ONLY IF THE OTHER SOLUTIONS PRESENTED DO
NOT RESOLVE THE DISPLAY ISSUES
If you have updated your graphics driver and are still having problems, you can download this opengl32.dll ZIP file
[19]
and unzip the "OpenGL32.dll" and the "Glu32.dll" file to the directory where XMS is installed. Close and
re-open XMS so this DLL is used for displaying XMS objects. Placing these DLL's in your XMS directory will fix
most graphics-related issues, such as problems with displaying triangles on large TIN or DTM datasets and other
problems with displaying large amounts of data. The following are known disadvantages to using this DLL for
displaying:
• Displaying graphics using this DLL will likely be slower since software is used to display your graphics instead
of your computer's graphics hardware. Panning, zooming, and rotating operations will be significantly slower.
• Some entities, such as symbols, are currently not displayed correctly when using this DLL. Only squares and
circles will be displayed. Changing all symbol display options to squares or symbols will allow you to work
around this problem. We are currently working on trying to fix this problem of symbols not displaying when
using this DLL. (THIS PROBLEM HAS NOW BEEN FIXED IN SOME BETA VERSIONS OF XMS
COMPILED AFTER March 31, 2009) In general, you will not want to use this DLL unless you are working with
large datasets that have display issues where XMS closes unexpectedly.
13
Graphics Card Troubleshooting
Contacting Support
If you continue to experience problems after updating your graphics card drivers, contact support [20].
References
[1] http:/ / www. realvnc. com/
[2] http:/ / en. wikipedia. org/ wiki/ DxDiag
[3] http:/ / www. dell. com/
[4] http:/ / welcome. hp. com/ country/ us/ en/ support. html
[5] http:/ / www. toshiba. com
[6] http:/ / www. sony. com
[7] http:/ / www. 3dlabs. com/ support/ drivers/
[8] http:/ / ati. amd. com/ support/ driver. html
[9] http:/ / www. diamondmm. com/
[10] http:/ / www. elsa. com/ supports/ download. asp
[11] http:/ / support. intel. com/ support/ graphics
[12] http:/ / www. matrox. com/ mga/ support/ drivers/ latest/ home. cfm
[13] http:/ / www. nvidia. com/ content/ drivers/ drivers. asp
[14] http:/ / www. s3graphics. com/ drivers. jsp
[15] http:/ / www. sis. com/ support/ support_prodid. htm
[16] http:/ / www. viaarena. com/ default. aspx?PageID=2
[17]
[18]
[19]
[20]
http:/ / update. microsoft. com
http:/ / www. aquaveo. com/ downloads
http:/ / wms. aquaveo. com/ OPENGL32. zip
http:/ / www. aquaveo. com/ technical-support/
Reporting Bugs
The Help | Report A Bug menu command can be used to send a bug report to GMS tech support. Reporting bugs
helps to improve the quality of GMS. An internet connection is required to use this feature.
14
15
3. General Tools
16
3.1. The File Menu
The File Menu
The File menu is one of the standard menus and is available in all of the modules. The commands in the File menu
are used for file input and output for the basic GMS file types, for printing, and to exit the program. The following
commands are contained in the File menu:
Menu
Command
Description
New
Deletes all data associated with all data types and all modules. It resets the status of the program to the default state that is set when
the program is first launched. This command should be selected when an entirely new modeling problem is started.
Open
This command is most often used to read in project files or other GMS native files. However, this command is also used to import
data or other files generated outside of GMS. Projects can either be opened into the current window which replaces the existing
project, or the project can be opened into a new instance of GMS. This setting is selected in the Preferences dialog that is accessed
by the Edit | Preferences command.
Import From
Database
Allows users to access data stored in a database and import it.
Import From
Web
Allows users to import an image from the world-wide-web.
Save
Used to save GMS projects. A project contains all of the files associated with a modeling project. When a GMS project is saved, all
files associated with the data currently in memory are saved. This includes any model simulations which are open. By default the
model simulation will be saved to the same location as the project. However, in the Save dialog the path for the model simulation
can be specified.
Save As
Used to designate the path for saving a GMS project. It can also be used to Export data.
Edit File
Prompts for the name of a file and opens the file in a program of your choice. This command is used to edit model input files or to
view output files. Output files that are part of a Solution can also be viewed by double clicking on the text file in the Project
Explorer.
Page Setup
Launches the Page Setup dialog. The Page Setup dialog contains 3 tabs: Margins, Options, and Paper Size. The Options tab allows
the user to specify the printing scale. The Paper Size tab allows the user to select the paper size and source. Also, the orientation,
portrait or landscape, can be selected. The Margin tab allows the user to change the Margins. On the right side of each tab is a print
preview.
Print
Printed copies of the current GMS image are generated with this command. This launches the standard Windows printing dialog.
Recent File
List
Near the bottom of the file menu is a list of recently opened projects. You can have as many as 5 different files in the recent file list.
Exit
17
3.2. The Edit Menu
The Edit Menu
The Edit menu is one of the standard menus and is available in all of the modules. The commands in the Edit menu
are used to select objects, delete objects, and set basic object and material attributes. The Edit menu contains the
following commands:
Menu
Command
Description
Delete
Delete the object currently selected in the Graphics Window.
Select All
Selects all items associated with the current selection tool.
Unselect All
Unselects all items associated with the current selection tool.
Invert Selection
Selects the items that were not initially selected and are associated with the current selection tool.
Select With Poly Used to enter a polygon enclosing the items to be selected (one of the selection tools must be active). This option is useful when
selecting a large irregularly shaped group of objects. To enter the polygon, click on the polygon's starting point and each
intermediate point defining the polygon and double-click on the ending point. All items within the polygon will be selected.
Select With
Polyline
Selects the items that intersect a polyline associated with the current selection tool.
Select From List
Some of the objects in GMS (TINs, solids, cross sections, and scatter point sets) are selected by selecting an icon that appears on
the object when the selection tool for the object is active. With a large number of objects, the display of the icons can become
complicated and it may be difficult to select the desired object. In such cases, this command can be used as an alternative method
for selecting such objects. It brings up a list of the objects currently in memory. An object is selected by checking the box next to
it in the list and then hitting the OK button.
Data Set
Calculator
The Data Calculator can be used to perform mathematical operations with data sets to create new data sets.
Properties
This command brings up the properties dialog for the currently selected item. This dialog varies depending on the selected item.
Materials
Brings up the Material Properties dialog.
Model Interfaces Bring up a dialog containing all of the models, allowing the user to define which model menus are to be static in the menu bar.
Units
Brings Units dialog which allows the user to adjust the units for the model.
Projection...
The projection currently associated with the project can be specified via this command. Changing the projection does not alter
the XYZ coordinates of the project data.
Reproject...
Reprojecting means to convert data from one coordinate system to another.
Single Point
Reprojection...
This option can be used to view the coordinates of a point to be transformed.
Transform...
This command is used to scale, rotate and translate the entire project. Individual objects can be transformed by using the same
command found in right-click context menus for the item in the Project Explorer.
Preferences
Brings up the Preferences dialog where the user can adjust the general preferences for GMS.
Screen Capture... Images in the Graphics Window can be copied to the Windows clipboard by selecting the Copy command from the Edit menu.
Once on the clipboard, the image can be copied into other applications for report generation. If the user wants to copy an image
that is larger or smaller than the graphics window this can be done by editing the copy scale factor in the Preferences dialog.
The Edit Menu
Paste Text
18
The Paste command in the Edit window allows the user to paste tabular data directly into GMS. When this command is
executed the Text Import Wizard is launched.
These were taken out of the menu
• Coordinate System || Brings up the Coordinate System dialog which allows the user to adjust the current
horizontal and vertical coordinate systems.
• Coordinate Transformation || Brings up the Coordinate Transformation Wizard which allows the user to
perform geographic system transformations, translations, rotations, and scaling.
Units
When building a ground water model, it is important to ensure that consistent units are used when entering model
parameters. To simplify the management of model units, the user can define the units for length, time, mass, force
and concentration in the Units dialog. A units label is placed next to each of the input fields in all the model dialogs
in GMS where the units are known. For example, the units for hydraulic conductivity are length / time. If the length
units are defined as "m" (meters) and the time units are defined as "d" (days) in the Units dialog, then the units string
next to the hydraulic conductivity input field would be "m/d".
Concentration units can be defined separately, and potentially inconsistently with, mass and length units. This allows
for more flexibility but can also lead to confusion so you should use care when selecting concentration units.
Unit Conversion
Generally speaking, GMS does not convert quantities from one system of units to another. GMS only displays
the chosen units to help the user make sure they are being consistent. However, in a few places, GMS will use
the currently defined units in it's calculations. These include:
•
•
•
•
in the FEMWATER Fluid Properties dialog
in the Curve Generator dialog
when calculating the stream stage constant when saving MODFLOW, and
in the measure tool.
Preferences
19
Preferences
The Edit | Preferences command brings up the Preferences dialog. There are four items in the preferences list that
can be selected to modify which preferences can be edited.
General
The General tab has all the of the general options in GMS.
• Restore Factory Preferences
This button switches all settings to the factory defaults.
• Show welcome dialog on startup
• Check for newer version on startup
• Confirm Deletions
Whenever a set of selected objects is about to be deleted, the user can choose to be prompted to confirm
the deletion. This is meant to ensure that objects are not deleted accidentally.
• Show new project wizard on startup
• XMDF File Compression
When saving XMDF files, you can use compression. The compression factor can be specified.
• Project Explorer - The Project Explorer section allows the user modify preferences related to the Project
Explorer.
• Change Module when tree selection changes.
This option changes the current module when a item is selected in the Project Explorer. This option is on
by default.
• Scroll Project Explorer when changing module.
This option will ensure the visibility of the tree item objects in a certain module when the module is
changed.
• Synchronize active data set and elevation data set for TINs, 2D Meshes, 2D Grids, and 2D Scatter Sets.
• Contouring
Allows the user to enter a filled contour tolerance.
• North arrow paths
Specify the path to the folder containing the North Arrows.
Model Executables
The Models page allows the user to specify the location of model executables, as well as the option to use the Model
Wrapper.
• Model Wrapper
GMS is a pre- and post-processor for Numerical Models. Most of these numerical models are run
externally in the DOS environment. The default option is to use the Model Wrapper. The Model
Wrapper "wraps" itself around the same DOS executables and gives more model feedback including
graphs and tables. The Model Wrapper includes a toggle box in the bottom left that, when checked and
you exit the Model Wrapper, GMS will automatically read in the results of the solution. This toggle will
only be checked by default if the model converged. The option to use the Model Wrapper or the old
DOS view is included in the Preferences Dialog. Certain models, including Stochastic and inverse
Preferences
20
modeling, can only be run using the Model Wrapper.
Parallel versions of MODFLOW-2000, MODFLOW-2005, and SEAWAT are shipped with GMS to run simulations.
Beginning with version 8, GMS ships parallel versions where the SAMG solver has been parallelized. Even when
this option is on, when running Parallel PEST with MODFLOW the serial (non-parallel) version of MODFLOW will
be used since the Parallel PEST will use all of the available cores on the computer with the serial version. Also see
MODFLOW preferences for an option to turn on or off the parallel version.
MODFLOW
The MODFLOW page has options related to the MODFLOW interface in GMS.
• Compress MODFLOW H5 files
This option will force the H5 files saved with MODFLOW to be compressed. Generally this option
should be turned on.
• Create h5 copy of head solution
Turning on this option can speed up reading the MODFLOW head solution especially when there are a
large number of stress periods. When this option is on, GMS writes an HDF5 copy of the MODFLOW
head solution upon reading it the first time. The following times GMS reads the head solution, it doesn't
take as much time.
• Default version of MODFLOW to run
• Double precision
When this option is on, GMS will use the double precision version of MODFLOW to run
simulations. By default this option is off and GMS uses the single precision version of
MODFLOW.
• Parallel (not used by Parallel PEST)
When this option is on, GMS will use the parallel version of MODFLOW to run simulations.
Beginning with version 8, GMS ships parallel versions of MODFLOW where the SAMG solver
has been parallelized. Even when this option is on, Parallel PEST will use the serial (non-parallel)
version of MODFLOW since the Parallel PEST will use all of the available cores on the
computer.
Images / CAD
• Bitmap Scale Factor
When the copy command is selected, a bitmap image of the screen is placed on the clipboard. The scale
factor can be used to increase :or decrease the resolution of the bitmap. This scale factor also applies
when saving the image as a bitmap.
• CAD Symbol Size
The size of the CAD symbol display can be specified.
Preferences
Printing
Allows the user to specify scaling Points, Lines, and Fonts while printing.
Program Mode
GMS has the option of changing the "mode" or "skin" that GMS is running. The purpose of the mode is to simplify
the items available in the interface.
Available Modes
• GMS
This is the default mode where are the tools are available to the user.
• GMS 2D
GMS 2D is for users that are only interested in using GMS to do seepage and slope stability. In GMS 2D mode
the only tools that are available are the 2D mesh and the Map. There are several changes to the GMS interface
when in this mode, including:
1. Hiding of tools and modules not in use
2.
3.
4.
5.
6.
SEEP2D model automatically initialized from conceptual model
SEEP2D boundary conditions automatically mapped from conceptual model (no need to run Map -> SEEP2D)
Easily create all coverage types in one step
Feature object types automatically assigned based on coverage attributes
Allow only one conceptual model
• GMS Site
GMS Site is for users that are only interested in using tools for site characterization. As such the tools
available in this mode are TINs, Boreholes, Solids, 2D Scatter, and Map. These tools can be used to construct
solid models of stratigraphy.
Caveats
When GMS is running in a particular mode then only data associated with the available tools will be read into GMS.
For example, if I have a GMS project file that contains a 3D Grid, and I am running in "GMS 2D" mode then when I
attempt to read in the project file I will get a message that GMS is not enabled to read in 3D Grid data. The only data
that will read into GMS in "GMS 2D" mode is data associate with the 2D Mesh and the Map.
Map
Gives the user the option to automatically perform the Map->SEEP2D command.
21
Preferences
22
TINs
• Vertex options
• Retriangulate after deleting
Default z-value
• Confirm z-value
• Interpolate for default z on interior
• Extrapolate for default z on exterior
• Breakline options
• Add supplementary points
• Swap edges
• Minimum length ratio
Boreholes
• Auto-assign horizons
Rows per lift
Row overlapped between lifts
Sets retained between lifts
• Measure slope from borehole tips
Average horizon slope
Horizon slope weight
Gap weight
• Auto-Fill cross sections
• Prompt for vertex spacing
• Do not redistribute vertices
• Use default spacing
Default spacing/length ratio
Max. lense thickness ratio
Scatter sets
• 2D scatter
Default data set value
• Confirm date set value
• 3D scatter
Default data set value
Default Z value
• Confirm date set value
Preferences
23
2D Mesh
• Interpolate for default z on interior
•
•
•
•
•
Default z (ft)
Assign default z-value
Prompt for z-value
Insert nodes into triangulated mesh
Check for coincident nodes
Retriangulate voids when deleting
Thin triangle aspect ratio
Graphics
•
•
•
•
Ask which library to use if system does not support all functionality
Autoselect the software library if system does support all functionality
Always use system library (may not support all features)
Always use software library (may be slower)
Materials
Many of the data types supported by GMS (ex., elements, solids, borehole regions) have a material ID associated
with each object. This material ID is an index into a list of material types. These material types often represent
different types of soil or rock. A global list of material attributes is maintained that can be edited using the Materials
command in the Edit menu.
The Materials are listed in a table or spreadsheet. New materials can be created by typing
in the last row, or by copying and pasting from a spreadsheet, or by selecting the insert
button.
Insert, delete, move up,
move down buttons
Materials have an ID, name, color and pattern. If a numerical model interface is active
(MODFLOW, FEMWATER etc.), the Materials dialog will show a tab control for each
active model. Additional columns in the spreadsheet are added which correspond to the appropriate properties for the
model.
A legend showing all the materials can be displayed in the Graphics Window. The legend can be turned on and off in
the Display Options dialog.
Previous Versions
The Materials command in the Edit menu brings up the Material Editor dialog. The names and IDs of the current
materials are listed in the box on the left side of the dialog. One of the materials is always selected. To select a
different material, click on the name of the desired material in the list of materials. New materials can be created by
selecting the New button. Materials are deleted by selecting the Delete button. A copy of an existing material can be
made by selecting the Copy button.
The material color and pattern of the selected material are edited in the Global Options section of the dialog. The
material color is edited by clicking in the Material color / pattern button.
If the Display material legend toggle is selected, a legend will appear in the bottom right hand corner of the Graphics
Window which lists the name and color of the currently defined materials.
Materials
24
Also, model specific material properties can be edited using the Materials command. Depending on which models
are currently initialized, tabs will appear on the right side of the dialog allowing the user to enter model specific
material properties.
The material ID associated with an object can be changed using the Properties command in the Edit menu.
Material Set
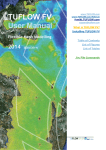
A material set is similar to a data set but represents materials instead of
data set values. Material sets can exist with 3D grids and meshes and
can be created manually or by running a T-PROGS simulation. To
create a material set manually you can right-click on the 3D grid or
mesh in the Project Explorer and select the New Material Set command.
Doing so will create a material set from the current cell or element
materials. All Material sets are grouped under a Material Sets folder in
the Project Explorer. Although grid cells and mesh elements (as well as
other objects) have materials associated with them from the start and
these material assignments can be changed on a cell-by-cell (or
element-by-element) basis, a material set is not created until you
specifically create it. Clicking on a material set causes the set to be
applied to the grid cells (or mesh elements) and the material
assignments of the cells updated.
Properties
3D grid showing materials from a material set.
A material set in the Project
Explorer.
As with data sets, a material set has properties that can be viewed.
Right-clicking on the material set in the Project Explorer and selecting the Properties command brings up the
Material Set Info dialog. This dialog lists the materials in the material set, their frequency and percentage. A
histogram is also drawn showing the frequency of the different materials in the set.
Viewing / editing
Clicking the Edit Materials button in the Material Set Info dialog brings up a table showing the materials in the
material set, similar to viewing values in a data set. The materials can be edited and saved.
Inactive values
As with data sets, materials sets can include inactive values (starting at GMS version 8.0). Inactive materials are
rendered using a material with ID -9999999.
Material set solutions
TPROGS can generate multiple material sets as part of its solution. These are stored in a material set solution folder
which is locked against editing. Material set solutions can be used to run a stochastic simulation in MODFLOW.
25
3.2.1. Coordinate Systems
Coordinate Systems
XMS programs work in a single coordinate system. The user selects what system will be used using the Edit |
Coordinate System menu command.
Both a horizontal and vertical system are specified. Many numerical models work in a local system, so there may not
be a problem if the user does not know what coordinate system the data is referenced to. If the desired model
requires a global system, or the base data is referenced to more than one system, the modeler must determine the
coordinate systems involved.
Since data can be gathered and referenced to various coordinate systems, XMS allows the user to convert data from
one coordinate system into another. The Coordinate Conversions page describes how to do this. The available
systems and units include:
Horizontal System
The options to the right of the dialog change as the horizontal system is changed. For example, the hemisphere is
required for a Geographic system and a UTM zone is required for a UTM system.
•
•
•
•
•
Local
Geographic
UTM
State Plane
CPP
Local is the default horizontal and vertical system. Unless the user desires to convert data to another system, it is not
necessary to change the system from Local.
Horizontal Units
The horizontal units can be specified for all systems except Geographic, which uses decimal degrees. The units set
here are the units used by the models such as RMA2.
• U.S. Survey Feet
• International Feet
• Meters
Ellipsoid
The Ellipsoid options are only available for non-NAD/HPGN/CPP systems. The ellipsoid can be selected for a
region of the world. Changing the ellipsoid changes the minor and major radii of the earth, measurements used in
performing conversions. To set the radii for an ellipsoid not included in XMS, select the User Defined ellipsoid and a
button appears titled Define. Clicking on the button brings up a dialog where the radii are defined. The Major and
Minor Radii (a and b, respectively) are defined in meters only. The Minor Radius can be input directly or defined by
specifying the ellipsoid flattening (1/f) or eccentricity squared (e2) variables, where
Coordinate Systems
Vertical System
The supported vertical options are for North America. If a non-NAD/HPGN horizontal system is selected, this option
is disabled.
• Local
• NGVD 29
• NAVD 88
Vertical Units
The vertical unit is only used for conversions. Area and volume calculations performed by XMS use the horizontal
units.
• U.S. Survey Feet
• International Feet
• Meters
External Links
• Introduction to Tidal and Geodetic Vertical Datums and Datum Computations [1] - Presentations available here [2]
References
[1] http:/ / www. ngs. noaa. gov/ corbin/ class_description/ Tidal_Geodetic_Datums. shtml
[2] ftp:/ / ftp. ngs. noaa. gov/ pub/ corbin/ datum_training/
26
Coordinate Conversions
Coordinate Conversions
Converting data from one coordinate system to another can be done using the Edit|Coordinate Conversions menu
command. The command may also be accessed by right-clicking on a single entity (grid, mesh, scattered data set ...)
in the Project Explorer. This allows the user to convert just that entity from one system into another (typically to the
current project coordinate system).
All data will be converted from the system on the left of the dialog to the system on the right.
"Convert From" System
The "Convert From" system defines the coordinate system the data is currently referenced to. When working from
the Edit menu, this is the system XMS is working in and is dimmed by default because it is assumed you have
already specified this system. When working from the Project Explorer, this is the coordinate system of the selected
entity and must be selected.
"Convert To" System
The "Convert To" system defines the system you will be working in after the conversion. When the dialog is invoked
from the Edit menu, this is selected by the user and all data is converted from the current system to this new system.
When the dialog is invoked from the Project Explorer, the "Convert To" system is dimmed because this is assumed
to be the system XMS is working in and all other data is already in this system.
Restrictions
Some conversions are not allowed, such as converting between a NAD and non-NAD system. A warning is issued
when conversions are not allowed.
27
Projections
Projections
"Projection" refers to a map projection like UTM [1]. In XMS software, a projection can be associated with a project,
and data can be reprojected from one projection to another. XMS software utilizes the Global Mapper (TM) [2]
library which supports hundreds of standard projections.
Previous XMS software versions referred to projections as "coordinate systems" and reprojection as "coordinate
conversion".
Project Projection
The current projection, or the projection currently associated with the project, can be specified via the
Edit|Projection menu command. Changing the projection does not alter the XYZ coordinates of the project data.
Local Projection
Many numerical models work in local systems, and don't care how that system relates back to global coordinate
systems (UTM, State Plane etc.). XMS software allows for local projections that are unrelated to any standard
projection.
Reproject
Reprojecting means to convert data from one coordinate system to another. For example, a 2D mesh representing the
ground surface may have XYZ coordinates in a UTM system and they need to be converted to a State Plane system
to be consistent with other data. Reprojecting usually results in the XYZ coordinates of the data changing, although
conceptually the data is in the same place with respect to the Earth, just in a different coordinate system.
There are three basic reprojection tasks that you can do:
• Reprojecting the entire project from one system to another
• Reprojecting one object from one coordinate system to the project coordinate system
• Single point reprojection, which allows you to enter the XYZ coordinates for a point in one projection and see
what the new coordinates would be if the point was reprojected to a different projection.
Either operation brings up a dialog with two projections specified. On the left, the "Convert From" projection defines
the projection the data is currently in. On the right, the "Convert To" projection defines the projection the data will
be in after the operation.
Reproject everything
Reprojecting everything can be done by selecting the Edit|Reproject menu command. This will convert all the data
loaded into the XMS application from one projection to another. In this operation, the "Convert From" projection
(left side of the dialog) is dimmed by default. The user selects a new projection on the right side that all data in the
application will be converted to. This operation changes the "current" projection that is being used by XMS to the
newly specified "Convert To" projection.
Reproject object
This command is done on a specific geometric object (grid, mesh, scatter set, ...) by right-clicking on the entity in the
Project Explorer. The object is reprojected from some projection into the current projection being used by the XMS
application. In this operation, the "Convert To" projection (right side of the dialog) is dimmed by default because it
represents the current projection used by the project. It is assumed that the desire is to reproject data from another
projection into the current projection. The current projection is not changed in this operation.
28
Projections
Single Point Reprojection
Single Point Reprojection allows you to enter the XYZ coordinates for a point in one projection and see what the
new coordinates would be if the point was reprojected to a different projection. It also lets you create a feature point
at the new location. This operation is accessed via the Edit|Single Point Reprojection menu command. It's also
available in the Register Image dialog.
Restrictions
Some reprojections are not allowed, such as reprojecting between a NAD and non-NAD system. A warning is issued
when the reprojection is not allowed.
Supported Projections
XMS software utilizes the Global Mapper (TM) [2] library which supports hundreds of standard projections.
References
[1] http:/ / en. wikipedia. org/ wiki/ Universal_Transverse_Mercator_coordinate_system
[2] http:/ / www. globalmapper. com/
CPP Coordinate System
A CPP (Carte Parallelo-Grammatique Projection) system is a local system. The origin of the system must be defined
in latitude/longitude decimal degrees.
The conversion from of a point from latitude/longitude to CPP is:
The conversion of a point from CPP to latitude/longitude is:
R = 6378206.4 m. (Clarke 1866 major spheroid radius)
29
Geographic Coordinate System
Geographic Coordinate System
A Geographic system is a latitude/longitude system defined in decimal degrees. Supported Geographic systems
include:
• NAD (North American Datum) 1927 and NAD 1988
• 33 world ellipsoids and a user defined ellipsoid (i.e., Clarke 1866, WGS 1984, etc.)
The hemispheres are defined for non-NAD systems. The hemisphere cannot be changed for NAD systems (Northern,
Western hemispheres).
Local Coordinate System
A local coordinate system is a system defined for a survey. Many numerical models work in local systems, and don't
care how that system relates back to global coordinate systems (UTM, State Plane etc.). If a portion of the data for a
project is referenced to a global coordinate system, and a portion is in a local system, a transformation to convert all
the data to a single system must be defined. This can be done by defining the location and orientation of the origin of
the local system with reference to the global system. This allows the data to be referenced back to the global system
or to another local system.
Three scenarios are possible when dealing with local coordinate systems:
1. Global to Local - When converting from a global to a local coordinate sytem, the global coordinates of the origin
of the local coordinate system must be defined using the Local Origin button in the lower portion of the dialog.
This dialog can also be used to enter the angle of rotation of the local coordinate axes relative to the global
coordinate axes. The angle is measured ccw from the positive x-axis.
2. Local to Local - When converting from one local coordinate system to another local coordinate system, the same
approach is used as when converting from a global to local coordinate sytem. The Local Origin dialog is used to
define the coordinates of the origin of the new coordinate system relative to the old coordinate system.
3. Local to Global - When converting from a local to a global coordinate sytem, the Local Origin dialog is used to
coordinates of the local coordinate system (which is the old system in this case) relative to the new global
coordinate sytem.
30
Coordinate Transformation
Coordinate Transformation
Coordinate Transformation means changing the position (xyz coordinates) of data. There are two ways to access
this feature:
• Edit|Coordinate Transformation menu command. Accessed this way the command will transform all your data.
• Right-click on an object in the Project Explorer and select the Transform command. This transforms just the
object clicked on.
Coordinate Transformation Wizard
Doing either of the above will bring up the Coordinate Transformation Wizard. There are two steps.
Step 1 - Choose the method of transformation
The two options are:
• Geographic system transformation. This option is used to transform from one coordinate system to another.
• Translate, rotate, scale. This performs a simple transformation to move, scale, or rotate your data.
Step 2 - Choose transformation options
Geographic system transformation option
All data will be converted from the system on the left of the dialog to the system on the right.
"Convert From" System
The "Convert From" system defines the coordinate system the data is currently referenced to. When working from
the Edit menu, this is the system GMS is working in and is dimmed by default because it is assumed you have
already specified this system. When working from the Project Explorer, this is the coordinate system of the selected
entity and must be selected. You may edit the current coordinate system by selecting the check box at the top of the
dialog.
"Convert To" System
The "Convert To" system defines the system you will be working in after the conversion. When the dialog is invoked
from the Edit menu, this is selected by the user and all data is converted from the current system to this new system.
When the dialog is invoked from the Project Explorer, the "Convert To" system is dimmed because this is assumed
to be the system GMS is working in and all other data is already in this system. In the convert to section you may
select the horizontal and vertical system to be used after your conversion.
Restrictions
Some conversions are not allowed, such as converting between a NAD and non-NAD system. A warning is issued
when conversions are not allowed.
Translate, rotate, scale option
If the Translate, rotate, scale option was selected in step one, step two lets you chose to either translate, rotate or
scale. You cannot do more than one transformation at a time - for example you cannot translate and scale at the same
time. If you want to do both, you can perform the translation first, then perform the scale.
See Transform
31
Coordinate Transformation
32
Related Topics
• GMS:Coordinate Conversions
Transform
The Transform command is used to
move objects. In the Transform dialog,
the transformation type can be chosen
and then appropriate parameters can be
entered. The following transformation
types are available:
• Scaling: Scaling factors for the X,
Y, and/or Z directions are entered.
To prevent scaling a specific
direction, the default value of 1.0
should be used.
• Translation: Translation values for
the X, Y, and/or Z directions are
entered. To prevent tranlation in a
specific direction, the default value
of 0.0 should be used.
Transform Dialog
• Rotations: When rotation is selected, the set of options on the right side of the dialog become available to define
the center of rotation around the Z axis. The rotation will occur counter-clockwise by the specified angle around
the specified center of rotation.
By default, the image will be framed after the transformation takes place. However, this can be turned off by using
the Frame image after transformation option.
See Coordinate Transformation
33
3.3. The Display Menu
The Display Menu
The Display menu is one of the standard menus and is available in all of the modules. The commands in the Display
menu are as follows:
Menu
Command
Description
Display
Options
Brings up the Display Options dialog
Contour
Options
Opens the Contour Options dialog
Refresh
When editing the image in the Graphics Window it occasionally becomes necessary to update the display or refresh the screen by
redrawing the image. Whenever possible, GMS automatically updates the display. However, in some cases small parts may be
obscured by editing procedures. If so, the display can be refreshed by selecting the Refresh command from the Display menu.
After selecting the Refresh command, the display process can be aborted by pressing the ESC key.
Refresh
Display
When editing the image in the Graphics Window it occasionally becomes necessary to update the display or refresh the screen by
redrawing the image. Whenever possible, GMS automatically updates the display. However, in some cases small parts may be
obscured by editing procedures. If so, the display can be refreshed by selecting the Refresh Display command from the Display
menu. After selecting the Refresh Display command, the display process can be aborted by pressing the ESC key.
Redraw
Display
When zooming in and out in the Graphics Window some items such as arrows change size for increased drawing speed. This
command refreshes the display and redraws these items at the size specified in the Display Options.
Frame Image
After altering the image display using the Zoom or Pan tools, the image can be centered by selecting the Frame Image command
in the View menu. This command adjusts the window boundaries so that all currently visible objects just fit in the Graphics
Window.
Visibility
•
Hide - A set of selected objects can be hidden by selecting the Hide command in the Display menu. Hidden objects cannot
be selected. The Frame Image command only frames the image based on the visible objects.
View Angle
•
Show - Hidden objects can be made visible by selecting the objects and choosing the Show command in the Display menu.
This method applies to objects such as solids, TINs, and mesh layers which can be selected with an icon. Other items such as
cells and elements cannot be selected when hidden but can be made visible by selecting the Show command with nothing
selected. In this case, all hidden objects are made visible.
•
Isolate - In many cases it is useful to hide all of the current objects but one. One way to do this is to select all of the objects
to hide (without selecting the desired object) and then select the Hide command. A quicker way to achieve the same result on
one or more objects is to use the Isolate command in the Display menu. The Isolate command makes the selected items visible
and automatically makes all other items of the same type invisible.
•
The objects in the Graphics Window can be rotated and viewed in three dimensions. Two angles, bearing and dip, are used to
rotate the view. The bearing and dip values correspond to a rotation about the z and x axes. The bearing affects the horizontal
angle (rotating the object in the xy plane), and the dip changes the vertical angle (shifting the viewing angle on the object to a
higher or lower perspective). The object cannot be tilted sideways. Using only two viewing angles rather than three limits the
viewing angles, but it is simpler and more intuitive. The bearing and dip angles can be explicitly defined in the View Angle
dialog accessed by selecting the View Angle command from the View menu. The viewing angles can be manipulated
interactively with the Rotate tool.
The Display Menu
Window
Bounds
Views
34
•
The region of the real world coordinate system that is mapped to the Graphics Window can be altered using the Pan and Zoom
tools. It is also possible to precisely control the visible region by selecting the Set Window Bounds command from the View
menu. This command brings up the Set Window Boundaries dialog. If the X range to be specified (preserves aspect ratio)
option is selected, the x coordinate at the left and right and the y coordinate at the bottom of the Graphics Window are
specified. The y coordinate at the top of the Graphics Window is not specified in order to maintain the aspect ratio. If the Y
range to be specified (preserves aspect ratio) option is selected, the y coordinate at the top and bottom and the x coordinate at
the left of the Graphics Window are specified. The x coordinate at the right of the Graphics Window is not specified in order
to maintain the aspect ratio. If the X and Y range to be specified (alters aspect ratio) option is selected, the x coordinate at
the right and left and y coordinate at the top and bottom of the Graphics Window are specified. Since all four coordinates are
specified, the aspect ratio of the scene may be altered.
•
Plan View - Changes the viewing angle so that the user is looking down the z-axis with the x-axis horizontal and the y-axis
vertical.
•
Front View - Changes the viewing angle so that the user is looking down the y-axis with the x-axis horizontal and the
z-axis vertical.
•
Side View - Changes the viewing angle so that the user is looking down the x-axis with the y-axis horizontal and the z-axis
vertical.
•
Oblique View - Changes the viewing angle so that the user is looking at the model at an angle of 45o to each axis.
•
Previous - Restores the Graphics Window viewing parameters as they were before the last viewing command was issued
(rotate, zoom, pan, etc.).
General/Ortho A command is provided in the Display menu for switching between the orthogonal and general viewing modes. The orthogonal
Mode
mode is only available with 3D grids.
Convert To
Cad
Converts any visible geometric data into CAD format internally within GMS. This CAD data will be saved with the project as a
DWG file, or can be exported as a separate DWG or DXF file. This command is found either in the the Display Menu or by
right-clicking in the empty space in the Project Explorer.
Toolbars
The Toolbars menu allows the user to hide and show the listed toolbars.
Plot Wizard
Brings up the Plot Wizard dialog.
Animate
The Animate command launches the Animation Wizard.
Play
Animation
The Play Animation command launches an *.avi player that allows the user to browse for an *.avi file and play the animation.
Contour Options
Contour Options
The options used to generate contours can be edited by selecting the Contour Options command in the Data menu.
The items in the Contour Options dialog are as follows:
General vs. Grid Layers
There are two tabs associated with the Contour Options dialog. The options described below are for the General
options. The Grid Layers options are used when contouring 3D grids.
Contour Method
There are 3 main types of contours: linear, color filled, and both linear and color filled.
Linear - The default method is Normal linear contours and causes the contours to be displayed as piece-wise linear
strings.
Color Fill - If the Color fill between contours option is selected, the region between adjacent contour lines is filled
with a solid color. There is also a smooth option available. When this option is turned on the color between contour
lines varies according to the color ramp. The transparency of the filled contours can also be adjusted.
Linear and Color Fill - This option shows linear contours on top of color filled contours.
Block Fill - This option applies only to cell centered grids. Cells are filled with a single color. The color chosen
corresponds to the color ramp value associated with the value at the cell center.
Line options
Bold contours - The Bold every... option can be used to display contours at selected intervals with a thicker line
width.
Contour labels - The Label every... option can be used to plot labels on contours at selected intervals. The contour
label options are edited using the Contour Labels dialog.
Data Range
The values shown in the Data range section correspond to the maximum and minimum values in the active data set.
These values are sometimes useful when choosing an appropriate contour interval.
Use each timestep's max and min - This option is only applicable is your contours are colored according to a color
ramp, and your data set has more than one time step. If this option is on, the maximum and minimum color ramp
colors will be displayed for every timestep. Otherwise, the maximum and minimum colors apply to the entire data
set and therefore will only appear when the current data set contains the data set maximum or minimum value.
Contour Specified Range - Regardless of which option is selected for the contour interval, a maximum and a
minimum contour value can be specified and the contouring can be restricted to the specified range. If desired, the
fill below or fill above options can be turned on to color fill above/below the specified range.
35
Contour Options
Contour Interval
The contour interval defines the values associated with the
contours. Based on the option selected, the contour values
are computed and displayed in the spreadsheet. The colors of
the contours will also be displayed if a Color Ramp is being
used.
Four options are provided for defining contour intervals in
the Contour Options dialog. The options are as follows:
Number of Contours - With the Number of Contours
option, an integer is entered representing the total number of
contours. The contour interval is adjusted based on the
current active data set so that the contours are evenly spaced
and the number of contours correspond exactly to the
specified value.
Specified Interval - With the Specified Interval option, the
contour interval (5, 10, 20, etc.) is entered directly by the
user.
Specified Values - The Specified Values option allows the
user to enter a list specific contour values. Contours are only
generated at these values.
Log Interval - When contouring chemical data, it is common to have a small "hot spot" somewhere in the interior of
the grid where the concentrations are several orders of magnitude higher than the rest of the grid. In such cases, the
contours are all biased to the high concentration zones and no contours are drawn in the low concentration zones. A
common approach for dealing with such situations is to select a set of contour values corresponding to multiples of
ten (0.01, 0.1, 1.0 10.0, etc.). This can be accomplished by explicitly assigning a set of contour intervals using the
Specified Values option. The problem with this approach is that the colors assigned to the contours are still based on
a linear interpolation of the data values, thus skewing the colors to the higher concentration zones.
If the Log Interval option is selected, GMS automatically assigns contour intervals as multiples of 10. Furthermore,
if the color-fill or color ramp option is being used, the colors assigned to the contours are distributed in a logarithmic
fashion, rather than linearly interpolated from the low to high values. A sample plot using logarithmic contour
intervals is shown below:
If the Log interval option is selected, all contour intervals will be positive. No contours are drawn in areas where the
data values are zero or negative. Furthermore, a "Starting value" must be entered. This value represents the minimum
contour value.
36
Contour Options
37
Contour Labels
The Contour Label Options command in the Data menu is used to access the Contour Label Options dialog. This
dialog is used to set the label color, the number of decimal places used to plot the label, and the spacing used when
the labels are generated automatically. The default spacing value controls the placement of labels when labels are
generated automatically.
Labels can be added to contours in one of two ways:
• 1. If the contour label option is selected in the Contour Options dialog, labels are automatically placed on the
contours. The spacing of the labels is controlled with the Contour Labels dialog.
• 2. In some modules, contour labels can be added manually to contours by selecting the Contour Labels tool in the
Tool Palette and clicking on the contours where labels are desired. By default, the data set value corresponding to
the point that was clicked is computed and a label corresponding to the nearest contour value is drawn centered at
the point that was clicked. An option can be set in the Contour Label Options dialog to use the exact value at the
point that is clicked as opposed to using the nearest contour value. This option is useful to post data set value
labels in regions where there are no contours.
Specified Data Set
The user specifies the data set with the Select Data Set... button in the Display Options|3D Grid dialog. This brings
up a new window where the specified data set is selected. The contour options available for the specified data set are
the same as the active data set options, yet each must be establish separately. This option is useful in comparing data
sets.
Animations
One of the most powerful visualization tools in GMS is animation. Animations can be created with transient or
steady state data. The view angle and zoom factor can be changed during the animation as well. Animations are
saved in the Windows (*.avi) format. AVI files can be played back externally to GMS using a variety of applications
and can be inserted into multi-media documents and applications.
A new animation can be created by selecting the Animate command from the Display menu.
Animation Options
There are 4 options available when creating an animation:
Option
Type
Data Set
Transient
Particle Tracking
Transient
Cross-sections / Iso-surfaces Steady State
Moving View
N/A
Transient vs. Steady State Animation
All of the options except Moving view are either considered Transient or Steady state. You cannot use a Transient
option and a Steady state option at the same time. Moving view, however, can be used by itself or in conjunction
with any combination of the other options.
The typical case for choosing to do a transient animation is when you have a transient solution generated by a model.
The transient animation could illustrate how vectors, contours, fringes or iso-surfaces change at different solution
Animations
times. A transient animation can also be used to show particle tracking over time, even with a steady state solution.
Steady state animation can only be performed using 3D grids or 3D meshes. A steady state animation can be used
with a steady state data set, or with one time step of a transient data set. Two options are available for steady state
animation: Cross-section / Iso-surface animation and Flow trace animation.
Data Set Animation
Transient data set animation can be used with any object with a transient data set. As each frame is generated, a set
of values corresponding to the current time is loaded into memory and the image is redrawn using the current display
options. Thus, if the contour display option is selected, the contours will vary from frame to frame according to the
changes in the data set.
The total number of frames generated in the animation can be defined by either matching the time steps (one frame
per time step) or by using a constant interval (e.g., one frame for every two hour interval). If the Match time steps
option is chosen, extra frames can be created between each time step if necessary using linear interpolation of the
data values at the specified time steps.
Particle Tracking Animation Particle tracking can be animated to show how pathlines grow over time. Although it is
considered a Transient option in the table above, this option can be used with a transient or a steady state solution.
Only the forward tracking particle sets can be animated.
If Particle tracking is selected by itself, you can choose how many frames you want in the animation. GMS will then
compute the time at which to generate each frame by dividing the total animation time evenly by the number of
frames. The animation begins at the minimum start time of all forward tracking particle sets, and ends at the
maximum travel time of all particles (in all forward tracking particle sets).
Cross-section / Iso-surface Animation
If the Geometric surface animation option is chosen, a cutting plane and/or an iso-surface can be animated. If the
Animate cutting plane over specified XYZ range option is chosen, an x, y, and/or z cutting plane is incrementally
moved through the mesh or grid from the specified beginning location to the ending location as each frame is
generated. This generates an animation showing a moving cross section. If the Animate iso-surface option is chosen,
a single iso-value is incrementally varied between the specified beginning and ending values and a different
iso-surface is generated for each frame based on the value.
Moving View
The Moving view option can be used by itself or in conjunction with any combination of the other options. This
option can be used to change how you view the data as the animation proceeds. You can define views and associate
them with particular frames of the animation. When the animation is generated, GMS will interpolate between the
defined views to determine what the view should be at every frame.
CODEC
Starting in GMS 6.5 you can choose what codec you use to create your AVI movie. GMS will search your computer
for all compatible codecs and they will be available in the pull down menu.
Animation Playback
Once a new animation has been generated, GMS launches the AVI player and plays the animation. The speed of
playback can be adjusted using the Speed scroll bar. The maximum speed depends on the speed of the computer and
the size of the image being animated. The smaller the image, the faster the maximum playback speed.
38
Color Ramp
Color Ramp
Several of the display options (contours, iso-surfaces, color-shaded vectors, etc.) use a color ramp to vary the display
color based on a relative value. The color ramp can be edited by selecting the Color Ramp Options command in the
Data menu. The Color Ramp Options dialog contains the following options:
Legend
If the Legend option is selected, a vertical strip of colors with a legend of corresponding data set values is displayed
in the upper left corner of the Graphics Window whenever the color ramp is used to display an object (shading, color
contours, etc.). The length and width of the color legend are specified with the Legend width and Legend height edit
fields. The values entered for legend width and height are in screen pixels.
Palette Method
The Palette Method section lists the three basic options for defining the color ramp:
Intensity Ramp
The Intensity Ramp option defines a ramp of colors corresponding to a varying intensities of a single color.
Hue Ramp
The Hue Ramp option defines a ramp of color hues (red-yellow-green-blue-magenta) at the maximum color
intensity.
User-Defined
If the User-Defined option is selected, a user-defined color palette is used to define the color ramp.
User-Defined Palettes
The user-defined color palettes are listed in the upper right corner of the Color Ramp Options dialog. A new palette
is created by selecting the New button. This button brings up the New Palette dialog listing a set of options for
defining the initial color palette. These colors can be edited using the Current Palette section of the Color Ramp
Options dialog. An existing palette can be deleted using the Delete button.
Once a set of user-defined color palettes are created, they are saved with the project to a palette file (*.pal). The
Import and Export buttons can be used to share user-defined palettes between projects.
Current Palette
The current color palette is displayed in the Current Palette section. The min and max value of the color ramp can be
set by clicking and dragging the two triangles just below the color palette. For user-defined color palettes, new colors
can be added, colors can be deleted, and the color associated with a color entry can be edited using the tools just
below the palette.
The data value associated with a selected color can be edited either by dragging the color or by entering a new value
directly. The values can be displayed as either percentages or direct values (corresponding to the active data set). The
Edit Table button can be used to edit the colors and corresponding values directly in a tabular format.
39
Color Ramp
Preview
The Preview section at the bottom of the Color Ramp Options dialog displays the color ramp defined by the current
palette and max and min values. The Reverse button can be used to reverse the direction of the color ramp (for
example, to switch from red-yellow-green-blue to blue-green-yellow-red).
40
41
3.3.1. Display Options
Display Options
Most of the data types in GMS have a set of display options that can be modified using the Display Options
command in the Display menu. The Display Options command brings up the Display Options dialog. The dialog can
also be brought up using the Display Options macro.
Data Type Tabs
The Display Options dialog contains a list of the data objects currently in memory. Corresponding data tabs are
displayed in the dialog depending on what object type is selected in the list box. Each display feature associated with
a data type is listed in the Display Options dialog. The check box next to the feature named can be toggled on or off
to control whether or not the feature is to be displayed. In addition, the button next to the feature brings up a dialog
that can be used to edit the display attributes of the feature (color, font, line thickness, etc.). The following table
describes the display options tabs that exist for the various data types. Click on the links to learn more about the
specific display options for each data type.
Image
Data Type
Tabs Also Available for Data Type
TIN Data
Borehole Data
Solid Data
2D Mesh Data
SEEP2D
2D Grid Data
2D Scatter Data
3D Mesh Data
FEMWATER, Particles, WASH123D, ADH
3D Grid Data
MODFLOW, Particles, MT3D
3D Scatter Data
Map Data
GIS Data
Cross Sections
Lighting Options
Axes
Drawing Grid
MODAEM, UTEXAS
Display Options
42
General Display Options
The Display Options dialog also controls several general display options in GMS. These general display options are
described in the table below.
Display
Option
Description
Z
magnification
Occasionally an object may be very long and wide with respect to its overall depth (z dimension). In such cases, it is possible to
exaggerate the z scale so that the variation in the z value is more apparent by changing the magnification factor from the default
value of 1.0.
Background
color
The Color dialog can be brought up to change the selected color. The selected color is displayed as the background color in the
Graphics Window.
Triad options
To aide in visualization of 3D objects in oblique view, a XYZ triad can be displayed in the lower left corner of the Graphics
Window. The display, size, and color of the triad can be specified in the Display Options dialog. The triad is useful in visualizing
how the geometry currently defined in GMS aligns with the world coordinate system.
Drawing Grid Options
When entering new nodes or entering a polygon or polyline in plan view, it is often useful to have the coordinates
snap to a uniform grid. This allows accurate placement of the objects when the desired coordinates are even
multiples of some number. The properties of the drawing grid can be controlled through the Drawing Grid
tab of
the Display Options dialog. This dialog is accessed from the Display menu or the
Display Options macro. The
following table describes the display options available for the Drawing Grid.
Display
Option
Description
Spacing
The Spacing edit field specifies the spacing of the grid nodes and grid lines in the drawing grid. The Grid color window specifies the
color that is used to display the drawing grid in the Graphics Window.
Snap
If the Snap option is selected, all new vertices, nodes, points, etc., snap to the closest grid point as they are being created or when they
are dragged interactively.
Display
grid lines
If the Display grid lines option is selected, grid lines are displayed according to the Line spacing increment. For example, if the Grid
spacing is set to 10 and the Line spacing increment is set to 5, a grid line will be drawn every 50 units. The grid line color can also be
adjusted using the button next to the Display grid lines toggle.
Display
grid points
If the Display grid points option is selected, grid points are displayed according to the Grid point spacing increment. The grid point
color can also be adjusted using the button next to the Display grid points toggle.
Vectors
Vectors
If the Vectors item in the Display Options dialog is selected for an object (TIN, Grid, or Mesh), vector plots can be
generated using the active vector data set for the object. One vector is placed at each node, cell, or vertex.
The display of vectors can be controlled using the Vector Options dialog accessed through the Vector Options
command in the Data menu or from a button in the Display Options dialog. The dialog options are as follows:
Dimensions
The Auto compute length toggle is on then GMS will compute the length of the vectors. If this toggle is off then the
Length can be edited. The edit fields labeled Length, Head width, Head length, and Stem width control the size and
shape of the vectors. The Head width, Head length, and Stem width are expressed as a percentage of the Length of
the vector.
Vary Length and/or Color
Often it is desirable to vary the display of the vectors according to the magnitude of the vector function at a current
point. This can be done with the Vary length according to magnitude and Vary color according to magnitude. If the
Vary length according to magnitude option is selected each vector is displayed with a length equal to the magnitude
of the vector multiplied by the Scaling ratio. If the Vary color according to magnitude option is selected, the vectors
with the smallest and largest magnitude are draw in the color of the lowest and highest colors on the current color
ramp. All other vectors are drawn in a color which corresponds to its magnitude from the current color ramp.
Display Every Nth Vector
If the Display every _nth vector is selected, only every nth vector is drawn. This is useful when the model is so large
that drawing every vector clutters the display.
Color Specified Range
It is possible to have the current color ramp vary over a specified range of the active vector data set. This is done by
selecting the Color specified range option and editing the Min magnitude and Max magnitude edit fields.
2D vs. 3D Vectors
If you are in one of the orthogonal views (xy plane, xz plane, yz plane) the vectors will be displayed as 2D vectors. If
you are in oblique view then the vectors are displayed a 3D vectors.
43
Lighting Options
44
Lighting Options
The lighting options are accessed by clicking on the Lighting Options item or tab in the Display Options dialog. The
default options vary between applications, and the options may be changed, saved, and restored within the project.
The following table describes the lighting display options.
Display Option
Description
Enable lights
This check box controls whether light sources are used in the lighting process for generating lighted images. These light sources
control the intensity of the colors on the lighted image and highlight the relief or geometrical variation in the surface of the
objects being lighted.
Lighting list box
This list contains preset lighting schemes and highlights the scheme currently displayed.
Renaming a
scheme
Double click on a scheme to begin editing its name.
Deleting a
scheme
Right click on a scheme and select Delete. The final scheme cannot be deleted.
Creating a
scheme
Right click on a scheme and select duplicate.
Plan view
preview
This preview shows the current light scheme on a sphere in plan view, i.e., looking along the z-axis. Click or drag within the
preview to direct both the diffuse and the specular components of the light currently selected in the light table. The selected
light direction is shown by a dot on the sphere. A direction from in front of the sphere is shown by a green dot, and from in back
by a red dot.
Smooth edges
Check this box to smooth all diffuse and specular lights of this scheme so that the surface does not appear faceted.
Shiny
Increase this value to sharpen all specular highlights of this scheme. At 100% this value turns off the specular highlight since it
assumes that all specular lights are points whose reflection shrinks to a imperceptible point at maximum shinyness. At 0% this
value assumes that the full intensity of the light is reflected in all directions (decrease the specular values proportionally to get a
realistic effect of less and less light reflecting to the eye from each surface).
Lighting Options
45
Ambient slider
Shows the Ambient value of the light currently selected in the table, and can change the value. The ambient value is light from
all directions which lights each and all surfaces uniformly leaving no surface unlighted. It is most useful on surfaces facing
away from directional light such as diffuse and specular light.
Diffuse slider
Shows the Diffuse value of the light currently selected in the table, and can change the value. The diffuse value is for a point
light which brightens surfaces in all directions the more they face the that light, and which leaves surfaces in darkness that face
away from the light.
Specular slider
Shows the Specular value of the light currently selected in the table, and can change the value. The specular value is a point
light which brightens surfaces if they reflect like a mirror from the direction of the light to the direction of the viewer, and
which leaves surfaces in darkness that do not have this angle of reflection.
Light table
Displays the enable, xyz position, Ambient, Diffuse, and Specular values for each of 8 lights in the current scheme, and
highlights the currently selected light. Any of these values may be modified by clicking them and editing their value.
Enable column
Check these boxes to turn on each light.
X, Y, and Z
columns
Edit these values or click/drag in the plan view preview sphere to change the direction of the light. These values are will be
normalized to a unit direction vector.
Ambient, Diffuse, Edit these values or drag their corresponding slider.
and Specular
columns
Plot Axes
The Plot Axes are a set of ruled lines oriented in either the world coordinate system or the grid coordinate system.
The axes can be either 2D or 3D. The properties the plot axes can controlled through the Plot Axes tab of the Display
Options dialog. The Plot Axes options are accessed by selecting the Axes item in the Display Options dialog. The
Plot Axes tab is then displayed on the dialog, and is used to specify the attributes of the axes, axes ticks, axes labels,
and axes numbers. The following table describes the display options available for the plot axes.
Display
Option
Description
Display plot
axes
If the Display plot axes toggle is selected, the plot axes will be displayed as specified and a sample of the plot axes will appear in
the window in the upper left of the dialog. If the Display plot axes toggle is not selected, all plot axes will be hidden and the rest of
the dialog will be dimmed.
Origin
options
If the Use world coordinate origin option is selected, the numbers displayed on the plot axes are defined by the origin of the world
coordinate system. If there is either a 2D or 3D grid currently defined in GMS, the origin of the grid can be used to define the
numbering by selecting either the Use 3D grid origin option or the Use 2D grid origin option. If there is not a 3D grid defined in
GMS, the Use 3D grid origin option is dimmed. Likewise, if there is not a 2D grid defined in GMS, the Use 2D grid origin option
is dimmed.
If the world coordinate origin is used, the world coordinate system will also be used to align the axes. However, if the origin of
either the currently defined 2D or 3D grid is used, the plot axes can be aligned with either the world coordinate system or the local
grid coordinate system. If the angle of rotation of the currently defined grid is 0.00 degrees, there is no difference between the world
coordinate system and the local grid coordinate system. If there is an angle of rotation other than 0.00 degrees, the local grid
coordinate system can be used by selecting the Local grid coordinates option. The world coordinate system can be used by selecting
the World coordinates option.
Use
exponential
notation
This option controls whether or not the axes numbers are displayed using exponential notation.
Plot Axes
Axis extents
46
The extents of the plot axes are specified with the controls in the spreadsheet. The Auto scale X, Auto scale Y, and Auto scale Z
options are used to specify that the extents and spacing of the axes will be automatically calculated by GMS. If extents or spacing
other than the calculated defaults are desired, any or all of the Manual scale X, Manual scale Y, and Manual scale Z options can
be selected. If one of the Manual scale options is chosen, the min, max, tick interval, and how many ticks are to be labeled are
specified for the corresponding direction.
All of the directions that use the Auto scale option are further controlled by the Fit to bounding volume and the Offset from
bounding volume options. If the Fit to bounding volume option is selected, the axes will be placed such that they fit tightly to the
bounding volume of the currently defined objects in GMS. If the Offset from bounding volume option is chosen, the axes will be
placed such that they are 15-20% larger than the bounding volume of the currently defined object in GMS.
Axis
properties
The axis properties can be changed for each axis by right-clicking no the axis in the canvas window. The right-click menu options
include Hide axis and Edit Axis. The Edit Axis options brings up a separate dialog with attributes including color and size that can
be specified.
47
3.4. Other Tools
Annotations
Annotation Objects
The XMS application family provides a series of tools to annotate the data in an application for presentations,
animations and screen shots.
These tools (annotation objects)are accessed through the Annotations Module and include:
•
•
•
•
•
Images
North Arrows
Scale Bars
Text
Lines
• Ovals
• Rectangles
Screen vs World Space Layers
All annotation layers either contain objects referenced to world or screen coordinates. Objects referenced to world
coordinates will change size and position on the screen with the underlying data. This is useful to identify specific
locations in your model such as peir locations. Objects associated with screen coordinates do not move on the screen
with the underlying data. This is useful for titles, legends such as north arrows and scale bars, and logos. Some types
of annotations can only be created in screen space layers including North Arrows, Images, and scale bars.
If the first annotation object you create, could be part of a screen or world space layer SMS will ask which type of
layer you wish to create and add the object to. You can create additional layers by right clicking on the Annotation
Data tree item and selecting Create Screen Space Layer or Create World Space Layer. Layers are differentiated by
including an 'S' for screen space layers or 'W' for world space layers in their icons in the project explorer.
If multiple layers exist, any newly created annotation object will be placed in the "current" layer.
Annotation Object Attributes
The extents of annotation objects defined by a frame. The user defines this frame initially when creating the
annotation object by left clicking at any point on the screen and dragging a rectangle with the mouse (left button still
down). The display will show the frame while you drag with the mouse. (Points and lines defining degenerate frames
are not allowed.) When the user creates a annotation, if the frame is too big for the window, it will be resized
appropriately. Annotations can't be resized or moved even partially outside of the borders of the window. If the user
resizes a annotation through a quick mouse drag and the cursor lands outside the window, the annotation will be
redrawn to take up all the window space in that direction.
Annotations
This frame bounds the region of the screen where the object will appear with the modeling data. The user interacts
with the object by interacting with its frame and specifying its attributes or properties (see the section on selection
below). The frame anchors the annotation object on the screen. This anchoring defines both the size and position of
the object. The x-location, y-location, x-size and y-size are all defined independently as either a pixel value or
percentage of the screen.
Horizontally, the user can position the left edge, the right edge or the center of the object. If the user positions the left
edge, the object position is defined relative to the left edge of the screen. If the user positions the right edge, the
object position is defined relative to the right edge of the screen. If the user positions the center of the object, the
object position is defined relative to the horizontal center of the screen.
For example, the left side of the frame may be specified as 100 pixels from the left edge of the screen. Alternatively,
the user may specify that the right edge of the frame should be 10% of screen width from the right edge. Finally, the
user may specify that the center of the object is 100 pixels to the right of the center of the screen.
The vertical position and sizes of the object are similarly specified in the anchoring attribute of the object.
All annotation objects also have attributes. The specific attributes depend on the type of object. The attributes define
color, line thickness, fill properties, associated images, etc..
Screen Space Images
A screen space image is simply a graphics icon mapped to the screen. A typical application would be to display a
company, department, or municipality logo next to the numeric model being displayed in the graphics window.
Attributes of the screen space images include:
• General anchoring attributes
• The image file being displayed as part of the project
• Whether the image is being displayed as a scaled (distorted object), scaled based on its original aspect ratio, or
locked at another aspect ratio.
• Transparency - The image properties dialog have a transparency checkbox. When checked it will cause the image
to be redrawn with the most used color in the image. When that it is checked, it also causes the color checkbox
and the tolerance edit field to become available. If the color checkbox is checked, it will activate the color button
and the color button will have the latest chosen image color painted on it or the most used color in the image, if it
has not been activated before. Clicking on the down arrow part of the color button causes a color popup to be
displayed with swaths of the 40 most used colors in the image or all the colors in the image, if the image has less
than 40 colors. Clicking on one of those colors will cause the image to be redrawn with that color made
transparent in the image. The tolerance edit field allows for variation in the matching of the red, green and blue
components. The tolerance field ranges in allowable values from 0.0 to 1.0. 0.0 means the red, green and blue
components must exactly match. Values higher than 0.0 indicate the degree of variation from the given color.
Clicking the transparency checkbox to the off state causes the image to be redrawn with no transparency.
48
Annotations
49
Scale Bars
A scale bar occupies a fixed size of the screen to display the relative size of the objects in the simulation. The user
defines the minimum width of the scale bar section (in pixels), along with a minimum and maximum height of the
scale (also in pixels). The XMS application adds a "Units" label (meters in the image shown below) and labels for
the model distance related to the scale divisions.
The XMS applications will compute a well conditioned number to use as the scale increment that fits in the specified
scale bar extents.
Attributes of the scale bar include:
• General anchoring attributes.
• The minimum spacing between distance labels.
• The minimum division width (in pixels). The XMS application determines the number of divisions based on the
minimum divisiion width and the width of the frame.
• The minimum and maximum height of the scale bar object.
• The font (style, color, size) used to label the scale bar.
• Whether or not the area behind the scale bar will be filled, and if so, with what color.
North Arrows
North arrow objects consist of automatically rotating screen space images. When an XMS
application is installed, at least one default North Arrow image will be included in the
application's home directory. Users may create or download as many north arrow icons as
desired. These icons are displayed at the specified location (anchored with the standard
options), but will rotate as the view direction changes so that the "up" direction of the icon
always aligns with the "North" or positive "Y" direction.
Attributes of north arrows include:
• See screen space image attributes.
Text
Text can be created in world or screen space layers.
You can enter text by clicking in the graphics window with the create text tool active.
You can set the following attributes for text:
•
•
•
•
Font - including size
Color
Background - fill behind with the background color or another color
Border and border thickness
Annotations
Lines/Arrows
You can create Lines/Arrows using the Create Line Tool. Lines/Arrows can be created in screen or world space
layers.
The attributes available for Lines/Arrows include:
• Type - Dashed or solid w/ thickness
• Color
• Arrowheads - location (beginning, end, both) and size
Ovals
You can create ovals by dragging a box with Create Oval tool active. Ovals can be created in world or screen space
layers.
The attributes that can be specified for ovals include:
• Line type - dashed/solid with width
• Line color
• Fill and color or No Fill
Rectangles
Rectangles can be created in screen or world space layers. Their attributes are the same as those available for ovals.
Selection
The first toolbar button is used to select and set attributes for annotation objects. This requires that objects exist to be
selected. In this case when you press this tool and then left click in the annotation object, the object frame will be
drawn around the annotation. In addition to the frame, the XMS application displays grab handles on the corners and
edges of the frame. The user modifies the rectangular shape of the annotation by dragging one of the grab handles
and changes the position of the object by dragging the annotation (click at any point in the object interior).
When this tool is active the right mouse button will pop up a menu of all dialogs for that particular type of
annotation. This will include at least "Attributes" which will display a dialog of the objects attributes for editing.
50
CAD Options
CAD Options
DWG and DXF files can be imported into GMS and displayed to assist in model placement or simply to enhance the
display of a model.
The objects in a DWG or DXF file are organized into layers. The display of layers in a CAD drawing is controlled
using the check boxes in the Project Explorer. Individual layers can be turned off/on or if you would like to turn off
the display of all CAD data then uncheck the box next to the CAD folder.
Delete Data To Delete the CAD Data right-click on the CAD data folder in the tree and select Delete from the
pop-up menu. If the CAD data was imported from a file, the file is not deleted from disk.
CAD -> Feature Objects CAD data can be converted to GMS feature objects by right-clicking on the CAD data
folder in the Project Explorer and selecting CAD To -> Feature Objects command. CAD points are turned into
points, CAD lines and polylines are turned into arcs, and CAD polygons are turned into polygons. The feature
objects are added to the active coverage. Once converted, the feature objects can be used to build conceptual models.
CAD -> TIN A set of CAD 3D faces which have been imported to GMS can be converted to a TIN by right-clicking
on the CAD data folder in the Project Explorer and selecting the CAD To -> TIN command.
Convert To CAD This command converts any visible geometric data into CAD format internally within GMS. This
CAD data will be saved with the project as a DWG file, or can be exported as a separate DWG or DXF file. This
command is found either in the the Display Menu or by right-clicking in the empty space in the Project Explorer.
Cross Sections
Cross sections - also referred to as fence diagrams - are flat surfaces used to visualize the subsurface. GMS has
different types of cross section objects:
•
•
•
•
Solid Cross Sections
Borehole Cross Sections
3D Grid Cross Sections
3D Mesh Cross Sections
51
Cross Sections
52
Solid Cross Sections
Solid cross sections can be created by "slicing" through a set of solids using the Create Cross Section tool. This can
be done at any angle and the slicing can be done using a multi-segment polyline. Solid cross sections can be
converted to a conceptual model. This is useful if you have a solid model of an embankment that you want to
analyze using UTEXAS.
Example of fence diagrams created using solids
Borehole Cross Sections
Borehole cross sections are quite different than solid, 3D grid, and 3D mesh cross sections. See the page on Borehole
Cross Sections.
Borehole cross section
Cross Sections
53
3D Grid Cross Sections
3D grid cross sections are created similar to solid cross sections. Data sets are automatically interpolated from the 3D
grid to the cross sections and contours can be displayed on the cross sections.
Two cross sections cut through a 3D grid
3D Mesh Cross Sections
3D mesh cross sections are created similar to solid cross sections. Data sets are automatically interpolated from the
3D mesh to the cross sections and contours can be displayed on the cross sections.
Multi-panel cross section cut through a 3D mesh
Cross-Section Options
When cross sections are created from a mesh or a grid, values of the active scalar and vector data sets are
interpolated to the cross sections. Whenever a new data set is chosen as the active data set for the mesh, the data
values are re-interpolated to the cross sections.
The properties of all cross section data that GMS displays on the screen can be controlled through the Cross Sections
tab of the Display Options dialog. This dialog is opened by right clicking on the
Cross Sections entry in the
Project Explorer and selecting the Display Options command. It can also be accessed from the from the Display
menu or the
Display Options macro. The following table describes the display options available for the cross
sections.
Cross Sections
54
Display Option
Description
Interior edge
removal
By default, the lines representing the intersection of the cross section with the faces of the cells or elements are displayed on the
cross section. These lines can be hidden by selecting the Interior edge removal option.
Cross section
edges
If this option is on, the lines that make up the cross section are displayed.
Cross section
faces
If this option is on, then the cross section will be displayed as a set of filled polygons.
Contours
If the Contours item is selected, contours are displayed on the cross sections using the active scalar data set.
Vectors
If the Vectors item is selected, vectors are displayed on the cross sections using the active vector data set when the cross sections
are displayed.
Flow trace
If the Flow trace item is selected, a flow trace image is texture mapped to each cross section using the active vector data set when
flow trace option is used with the Animation wizard.
Convert Cross Section to Coverage
Cross sections can be converted to coverages by right clicking on the coverage and selecting the Convert To
Coverage command. The outer boundary of each material zone is converted into arcs and polygons are automatically
built.
Converting a cross section to a coverage.
The resulting coverage from the cross section.
When this command is executed the user is prompted to select where the new coverage(s) should be created in the
project explorer. If the user wishes to have the materials from the cross section assigned to the appropriate polygons
in the coverage then the user should select an appropriate conceptual model. The conceptual model must support the
assignment of materials to polygons (MODFLOW, SEEP2D/UTEXAS, FEMWATER).
Cross Sections
Coordinate Transformation
The coordinates of points from the cross section are transformed into the XY plane. The x coordinates are calculated
relative to zero where zero is defined as one end of the cross section. Currently the end of the cross section that is
designated as zero is the end with the minimum Y coordinate. If the cross section is horizontal then the end of the
cross section with the minimum X is used.
The x coordinates are calculated by finding the distance of the point from the end of the cross section that was set as
zero. The Y coordinates are calculated by subtracting the minimum z value of the cross section from the z value of
the point (y = z - z_min).
Limitations
• The cross section must be vertical.
• The cross section must be a single panel (when viewing the cross section in plan view it appears as a single line
segment).
Data Sets
A data set is a set of values associated with each node, cell, vertex, or scatter point in an object. A data set can be
steady state (one value per item) or transient (one value per item per time step). The values in the data set can be
scalar values or vector values. Certain types of objects in GMS have an associated list of scalar data sets and a list of
vector data sets. Each of the following objects in GMS can have both scalar a vector data sets:
• TINs
• 2D Meshes
• 2D Grids
• 3D Meshes
• 3D Grids
The following objects can only have scalar data sets:
• Borehole Sample Data
• 2D Scatter Point Sets
• 3D Scatter Point Set
The commands for manipulating data sets are located in the Data menu.
Data sets are used for both pre- and post-processing of models. For example, a scalar data set associated with a 3D
grid can represent starting values of head or values of hydraulic conductivity for a groundwater modeling problem.
Another data set associated with the same grid may represent computed head values. Data sets can be used to
generate contours, iso-surfaces, vector plots, and animation sequences.
55
Data Sets
56
Generating Data Sets
Data sets can be generated in a variety of ways. They can represent output from a groundwater model (head,
drawdown, etc.). They can represent tabular values in a text file entered by the user or exported from another
application such as a GIS. They can be created by interpolating from a scatter point set to a TIN, grid, or mesh. Data
sets can also be generated by performing mathematical operations on other data sets with the Data Calculator.
One advantage of the data set list approach for managing information is that it facilitates transfer of information
between different types of models or models with differing resolution. This is accomplished through scatter point
sets and interpolation. TINs, borehole contacts, borehole sample data, grids, and meshes can all be converted to a 2D
or 3D scatter point set. When an object is converted to a scatter point set, all scalar data sets associated with the
object are copied to the new scatter point set. The data sets can then be transferred from the scatter point set group to
other objects of any type using one of the supported interpolation schemes.
Importing/Exporting Data Sets A data set can be exported by right-clicking on the data set in the Project Explorer
and select the Export command. The Save As dialog has three filter types that can be exported:
• Binary Data Set Files (*.dat)
• ASCII Data Set Files (*.dat)
• HDF5 data Set Files (*.h5)
A data set can be imported by right-clicking on any of the objects explained above in the Project Explorer and select
the Import Data Set command. This command brings up the File Open dialog.
Project Explorer
Data sets are displayed and managed in the Project Explorer. Click here to learn about data sets in the Project
Explorer.
Active Data Set
Each object (TIN, Grid, Mesh, or Scatter Point Set) in GMS has a set of values which is designated as the "active
data set." The active data set is an important part of model visualization in GMS. Each time the display is refreshed,
the contours and other display features are generated using the active data set.
The active data set and time step are displayed in the Project Explorer. Left-clicking on a solution or data set in the
Project Explorer makes that item "active" and the display is automatically updated in the GMS window. The table
below shows the icons displayed next to the active data sets.
active scalar data set
active vector data set
active ccf data set
Data Set Info
Selecting the Properties command in right click menu on a data set in the Project Explorer will bring up the Data Set
Info Dialog. The components of the dialog are as follows:
Statistics
A set of statistics related to the active data set is displayed on the left side of the Data Set Info dialog. the statixtics
for all time steps can be shown by selecting the Show all time step stats. toggle. A histogram of the data values is
displayed on the right side. Right-clicking on the plot and selecting the Plot Data command brings up the X-Axis
Precision dialog. This dialog enables users to set the precision of the x-axis of the Histogram.
Data Sets
57
View/Edit Values
For data sets associated with model solutions, the data values can be displayed in a spreadsheet using the View
Values button. For all other data sets, the button label changes to Edit Values and the spreadsheet can be used to
change the data set values.
Active/Inactive Flags
If the currently selected module is the 3D Grid module, the active/inactive status of cells can be changed by selecting
the Edit button at the bottom left of the dialog. This brings up the Active/Inactive Flags dialog.
Date/Time Display
For a transient data set, the time values can be displayed in the Time Step Window using either a relative time format
(e.g., 100.0) or using a date/time format (e.g., 1/12/1998 3:23:48). The relative times are computed using a reference
time that is defined for the model (MODFLOW, FEMWATER etc.). The reference time represents the date/time
corresponding to t=0.
Data Sets in the Project Explorer
The solutions and data sets associated with a particular object (grid, mesh, scatter point set, etc.) are managed using
the Project Explorer.
Data Sets
scalar data set
active scalar data set
vector data set
active vector data set
ccf data set
active ccf data set
3 different types of data sets are shown in the Data Tree: scalar, vector, and cff. The icons used to identify the data
sets are shown below.
If the active data set is transient then the time steps are displayed in the Time Step Window.
Solutions
Solutions are output from a numerical model that GMS supports. Solutions are shown in the Project Explorer as a
folder with an lock on it
. If a solution is transient then the time steps are displayed in the Times Step Window.
Data sets can not be moved into or out of a solution folder. Also, the solution may contain text files such as the *.out
and *.glo files produced by MODFLOW. These files can viewed by right clicking on the item and selecting View
File from the pop up menu, or you can double click on the item.
Clicking on a solution or data set makes that item "active" and the display is automatically updated in the GMS
window.
Folder
The data sets and solutions are organized by folders. The user can create new folders and move data sets, solutions,
and folders to other folders anywhere on the Project Explorer. Folders can be created by right clicking on the certain
items in the Project Explorer and selecting New Folder in the menu. A data set or folder can be deleted simply by
selecting the folder and selecting the Delete key or by right-clicking on the item and selecting the Delete option in
the corresponding pop-up menu. Statistics about a data set can be viewed by right-clicking on a data set and selecting
the Properties option from the pop-up menu.
Data Calculator
58
Data Calculator
At a glance
• Performs mathematical calculations on
scalar datasets
• Calculations can include any number of
scalar datasets and user supplied numbers
• Useful for computing derived values such
as Froude numbers
• Useful for comparing scalar datasets
The Data Calculator can be used to perform
mathematical operations with data sets to
create new data sets. The Data Calculator is
accessed by selecting the Data Calculator
command from the Data menu. The
components of the Data Calculator are as
follows:
Data Calculator
Expression Field
The most important part of the Data Calculator is the Expression field. This is where the mathematical expression is
entered. The expression should be formulated using the same rules that are used in formulating equations in a
spreadsheet. Parentheses should be used to clearly indicate the preferred order of evaluation. There is no limit on the
length of the expression. The operators in the expression should be limited to the operators shown in the middle of
the Data Calculator. The operands in the expression should consist of user-defined constants (e.g., 3.14159), or data
sets.
List of Data Sets
All of the data sets associated with the active object (TIN, Grid, Mesh, or Scatter Point Set) are listed at the top of
the Data Calculator. If a transient data set is highlighted, the time steps are listed on the right side of the Data
Calculator. When a data set is used in an expression, the name of the data set should NOT be used. Rather, the letter
associated with the data set should be used. For example, if a data set is listed as "b. head1", the data set is referenced
in the expression simply as "b"
When a transient data set is used in an expression, either a single time step or the entire sequence of time steps may
be used. For example, the expression "abs(d:100)" creates a single (steady state) data set representing the absolute
value of the data set at time = 100.0. However, the expression "abs(d:all)" creates a transient data set representing the
absolute value of each of the time steps in the original data set.
Data Calculator
59
Result Name
When an expression is evaluated, a new data set is created and the name of the new data set is designated in the
Result field.
Operators
The allowable operators are listed in the middle of the dialog. Selecting one of the operator buttons adds the selected
operator to the end of the expression. However, the operators can also be typed directly in the expression field. The
function of each of the operators is as follows:
Operator
Function
"+"
Add
"-"
Subtract
"*"
Multiply
"/"
Divide
"("
Left Parenthesis
")"
Right /Parenthesis
" log(x) "
The base 10 logarithm of a data set
" ln(x) "
The natural logarithm of a data set
" x^a "
(x) raised to the (a) power. (x) and (a) can be any mixture of constants and data sets
" abs(x) "
The absolute value of a data set
" sqrt(x) "
The square root of a data set
" ave(x,y) "
The average of two data sets
" min(x,y) "
The minimum of two data sets
" max(x,y) "
The maximum of two data sets
" trunc(x,a,b) "
Truncates a data set (x) so that all values are >= a and <= b
" 1/(x) "
The inverse of (x) - Only available in SMS
Operating with transient datasets
Each argument in the operators listed in the table above may be:
• A steady state (1 time step) data set
• A specified time step of a transient data set (i.e., x:#). In this case the # represents the index of the time step as
specified in the timestep window.
• A transient time step (i.e., x:all). These operations are only valid if all arguments have matching time step values.
In this case, the result will be a new transient data set with identical time values as the arguments.
The data calculator supports an alternate format for computing attributes of a transient dataset. This alternate format
applies to three of the operators. These operators compute a single timestep (steady state) dataset representing the
spatially varied attribute operating on all the timesteps.
Data Calculator
60
Operator
Function
" ave(x:all) "
The average at each location of all time steps in the data set
" min(x:all) " The minimum at each location of all time steps in the data set
" max(x:all) " The maximum at each location of all time steps in the data set
Compute Button
Once an expression is formulated and a name for the resulting data set has been specified, the expression can be
evaluated by selecting the Compute button. At this point, the data set is created and the name of the new data set
should appear in the list of data sets.
Related Links
•
•
•
•
Data Sets (GMS)
Data Sets (SMS)
Data Sets (WMS)
Data Set Toolbox (SMS)
Display Theme
A Display Theme is a collection of display options. The user can create a display theme by right-clicking in the
blank space of the Project Explorer and selecting the New | Display Theme menu command. This will bring up the
Display Theme Properties dialog. In this dialog the user can name the display theme, select which display options to
include in the display theme, and enter the names of items that will automatically use the display theme. For more
information on display themes see the Display Themes tutorial here.
XY Series Editor
XY Series Editor
The XY Series Editor is a special dialog that is used to generate and edit curves defined by a list of x and y
coordinates. The curve can be created and edited by directly editing the xy coordinates using a spreadsheet list of the
coordinates. An entire list of curves can be generated and edited with the Editor and curves can be imported from
and exported to text files for future use. You can also paste your xy data directly to the spreadsheet.
The XY Series Editor is used in GMS, SMS, and WMS. It was designed to be general in nature so that it could be
used anywhere that a curve or function needs to be defined. In some cases, the x values of the curve must correspond
to a pre-defined set of values. For example, the x values may correspond to a set of time steps whose interval is
established in a separate dialog. In such cases, the x fields cannot be edited but the y values associated with the
pre-defined x values can be edited. In other cases, there is no limit on the number of x values or on the x spacing and
both the x and y values can be edited.
The XY Edit Fields
The two vertical columns of edit fields on the left side of the dialog are for direct editing of the xy series values. A
pair of application specific titles appears at the top of the columns.
The buttons below the xy edit fields are used to manipulate the values in the edit fields. The buttons are as follows:
Use dates/times For selected situations such as entering time series data in the Map module, it is useful to enter the
data in date/time format. Checking this toggle allows the x values in your curve to be entered in date/time format.
Import/Export Buttons The Import and Export buttons allow the user to read in or save an xy series file.
The XY Series Plot
The window in the upper right hand corner of the XY Series Editor is used to plot the curve corresponding to the xy
values in the edit fields. As each value in the edit fields is edited, the corresponding point on the curve is adjusted
instantaneously. Plot options are accessed by right-clicking on the plot.
Related Pages
• GMS main page
• SMS main page
• WMS main page
61
62
4. Interpolation
63
4.1. Introduction
Interpolation
GMS contains a powerful suite of interpolation tools. You can interpolate to TINs, 2D meshes, 2D grids, 3D meshes,
and 3D grids. The following types of interpolation are available in GMS:
• Linear
• Inverse Distance Weighted
• Clough-Tocher
• Natural Neighbor
• Kriging
• Gaussian Field Generator
GMS also supports Jackknifing, which is used to compare interpolation schemes.
In addition to interpolating scalar values, GMS also supports interpolation of materials with T-PROGS. The
T-PROGS software is used to perform transition probability geostatistics on borehole data.
How To Interpolate in GMS Interpolation is performed using the 2D Scatter Points and the 3D Scatter Points. To
interpolate values from a scatter set you either right-click on a scatter set in the Project Explorer and select the
Interpolate to command or select the command from the Interpolation menu. The commands in the Interpolation
menu act on the "active" item in the Project Explorer.
Interpolation Commands
Interpolation Commands
Once a 3D interpolation scheme has been selected and the appropriate parameters for the selected scheme have been
input, the data set of the active scatter point set can be interpolated to another object. During the interpolation
process, a new data set is constructed for the target object containing the interpolated values. A separate interpolation
command is provided for interpolating to each of the target objects. The interpolation commands are found in the
Interpolation menu. The commands are as follows:
• Interpolate -> Active TIN
The to Active TIN command interpolates to the vertices of the active TIN.
• Interpolate -> 2D Mesh
The to 2D Mesh command interpolates to the nodes of the 2D finite element mesh.
• Interpolate -> 2D Grid
The to 2D Grid command interpolates to the 2D finite difference grid. The interpolation is done either to the
grid nodes or to the grid cell centers depending on whether the grid is a mesh-centered or cell-centered grid.
(See 2D Grid Types)
• Interpolate -> 3D Mesh
The to 3D Mesh command interpolates to the nodes of the 3D finite element mesh.
• Interpolate -> 3D Grid
The to 3D Grid command interpolates to the 3D finite difference grid. The interpolation is done either to the
grid nodes or to the grid cell centers depending on whether the grid is a mesh-centered or cell-centered grid.
(See 2D Grid Types)
• Interpolate -> MODFLOW Layers
The Interpolate to MODFLOW Layers commmand lets you interpolate from 2D scatter data to MODFLOW
data: top and bottom layer elevations, LPF array data (HK, VK, etc), recharge.
• Gaussian Simulation Options
Gaussian Sequential Simulation (GSS) is a form of Kriging that can only be used for 2D interpolation and only
works when interpolating to 3D cell-centered grids.
• Jackknifing
3D Jacknifing identical to 2D Jacknifing.
When one of the interpolation commands is selected, the Interpolate dialog appears.
64
3D Interpolation Options
3D Interpolation Options
3D scatter point sets are used for interpolation to other data types such as grids and meshes. Interpolation is useful
for such tasks as iso-surface rendering or setting up input data for a model. Since no interpolation scheme is superior
in all cases, several interpolation techniques are provided in GMS.
The basic approach to performing an interpolation is to select an appropriate interpolation scheme and interpolation
parameters, and then interpolate to the desired object using one of the interpolation commands (to 3D Grid, to 3D
Mesh, etc.) described below.
The interpolation options are selected using the 3D Interpolation Options dialog which is accessed through the
Interp. Options command in the Interpolation menu. Once a set of options is selected, those options are used for all
subsequent interpolation commands. The options in the 3D Interpolation Options dialog are as follows:
Active Data Set
Interpolation is always performed using the active data set of the active scatter point set. The active data set is
normally selected in the Project Explorer. The name of the current active data set is listed at the top of the 3D
Interpolation Options dialog.
If the active data set is transient then more interpolation options are available. (see Steady State vs. Transient
Interpolation)
Interpolation Methods
The following methods are supported for 3D interpolation in GMS:
• Inverse Distance Weighted Interpolation
• Kriging
Log interpolation is also supported.
Anisotropy
Sometimes the data associated with a scatter point set will have directional tendencies. The azimuth and horizontal
anisotropy allow the user to take into account these tendencies.
Vertical Anisotropy
In 3D, vertical anisotropy is also available. In previous versions of GMS the user could enter a Z scale. Vertical
anisotropy is 1 over the Z scale. This notation was changed to be consistent with Kriging.
Occasionally, scatter point sets are sampled along vertical traces. In such cases, the distances between scatter points
along the vertical traces are an order of magnitude smaller than the distances between scatter points along the
horizontal plane. For example, if the scatter point set was obtained from borehole data, the distance between scatter
points may be a few centimeters, whereas the distance between boreholes may be several meters. This disparity in
scaling causes clustering and can be a source of poor results in some interpolation methods.
The effects of clustering along vertical traces can be minimized using the vertical anisotropy option in the 3D
Interpolation Options dialog. The Z coordinate of each of the scatter points is multiplied by 1 / the vertical
anisotropy parameter prior to interpolation. Thus, if the vertical anisotropy parameter is less than 1.0, scatter points
along the same vertical axis appear farther apart than they really are and scatter points in the same horizontal plane
appear closer than they really are. As a result, points in the same horizontal plane are given a higher relative weight
than points along the Z axis. This can result in improved accuracy, especially in cases where the horizontal
correlation between scatter points is expected to be greater than the vertical correlation (which is typically the case in
65
3D Interpolation Options
soils since soils are deposited in horizontal layers).
Assign default extrapolation value to hidden objects
This option will assign the default extrapolation value to all cells that are hidden using the Hide command in the
Display | Visibility menu option (see The Display Menu).
Truncation
When interpolating a set of values, it is sometimes useful to limit the interpolated values to lie between a minimum
and maximum value. For example, when interpolating contaminant concentrations, a negative value of concentration
is meaningless. However, many interpolation schemes will produce negative values even if all of the scatter points
have positive values. This occurs in areas where the trend in the data is toward a zero value. The interpolation may
extend the trend beyond a zero value into the negative range. In such cases it is useful to limit the minimum
interpolated value to zero. Interpolated values can be limited to a given range by selecting the Truncate values option
in the 3D Interpolation Options dialog.
Steady State vs. Transient Interpolation
If the active data set happens to be a transient data set, two options are available:
1. Steady state interpolation can be performed using only the selected time step of the active data set.
2. Transient interpolation can be performed using all of the time steps.
By default, only the selected time step is used. The time step is shown next to the data set name at the top of the
dialog. All of the time steps can be selected by selecting the Use all time steps toggle next to the Time step combo
box. If all time steps are chosen, GMS begins with the first time step in the list and repeatedly interpolates from the
scatter point set to the target object, one time step at a time, for all of the time steps. As a result, a data set is created
on the target object with a set of time steps matching the time steps on the scatter point set.
When performing transient interpolation with the kriging option, special care should be taken with regard to the
variogram. Since each time step represents a separate set of data, technically, a separate variogram (or set of
variograms) should be created for each time step (GMS stores a separate variogram for each step). This can be
accomplished by selecting each time step one at a time using the Time step combo box at the top of the Interpolation
Options dialog, and creating a new variogram for each time step.
66
67
4.2. Linear
Linear
If the linear interpolation scheme is selected, the 2D scatter points are first triangulated to form a temporary TIN.
The TIN is a network of triangles connecting the scatter points together. It is used to interpolate from the scatter
points to another object such as a grid or a mesh.
The equation of the plane defined by the three vertices of a triangle is as follows:
where A, B, C, and D are computed from the coordinates of the three vertices (x1,y1,z1), (x2,y2,z2), & (x3,y3,z3):
The plane equation can also be written as:
which is the form of the plane equation used to compute the elevation at any point on the triangle.
Since a TIN only covers the convex hull of a scatter point set, extrapolation beyond the convex hull is not possible
with the linear interpolation scheme. Any points outside the convex hull of the scatter point set are assigned the
default extrapolation value entered at the bottom of the Interpolation Options dialog. The figure below shows a 2D
scatter point set (small red triangles in GMS) being interpolated to a 2D grid. The green lines represent a TIN
constructed from a scatter point set. The thick blue line represents the convex hull of the data set. No extrapolation
will occur outside of this thick blue line (picture is not representative of this description).
Convex Hull of a Scatter Point Set
68
4.3. Inverse Distance Weighted
Inverse Distance Weighted
One of the most commonly used techniques for interpolation of scatter points is inverse distance weighted (IDW)
interpolation. Inverse distance weighted methods are based on the assumption that the interpolating surface should
be influenced most by the nearby points and less by the more distant points. The interpolating surface is a weighted
average of the scatter points and the weight assigned to each scatter point diminishes as the distance from the
interpolation point to the scatter point increases. Several options are available for inverse distance weighted
interpolation. The options are selected using the Inverse Distance Weighted Interpolation Options dialog. This dialog
is accessed through the Options button next to the Inverse distance weighted item in the 2D Interpolation Options
(3D Interpolation Options) dialog. The options in the dialog are as follows:
• Shepards Method
• Gradient Plane Nodal Functions
• Quadratic Nodal Functions
• Subset Definition
Shepards Method
The simplest form of inverse distance weighted interpolation is sometimes called "Shepard's method" (Shepard
1968). The equation used is as follows:
where n is the number of scatter points in the set, fi are the prescribed function values at the scatter points (e.g., the
data set values), and wi are the weight functions assigned to each scatter point. The classical form of the weight
function is:
where p is an arbitrary positive real number called the weighting exponent and is defaulted to 2. The weighting
exponent can be modified by turning on the Use classic weight function option. hi is the distance from the scatter
point to the interpolation point or
where (x,y) are the coordinates of the interpolation point and (xi,yi) are the coordinates of each scatter point. The
weight function varies from a value of unity at the scatter point to a value approaching zero as the distance from the
scatter point increases. The weight functions are normalized so that the weights sum to unity.
Although the weight function shown above is the classical form of the weight function in inverse distance weighted
interpolation, the following equation is used in GMS:
Shepards Method
where hi is the distance from the interpolation point to scatter point i, R is the distance from the interpolation point to
the most distant scatter point, and n is the total number of scatter points. This equation has been found to give
superior results to the classical equation (Franke & Nielson, 1980).
The weight function is a function of Euclidean distance and is radially symmetric about each scatter point. As a
result, the interpolating surface is somewhat symmetric about each point and tends toward the mean value of the
scatter points between the scatter points. Shepard's method has been used extensively because of its simplicity.
3D Interpolation
The 3D equations for Shepard's method are identical to the 2D equations except that the distances are computed
using:
where (x,y,z) are the coordinates of the interpolation point and (xi,yi,zi) are the coordinates of each scatter point.
Gradient Plane Nodal Functions
A limitation of Shepard's method is that the interpolating surface is a simple weighted average of the data values of
the scatter points and is constrained to lie between the extreme values in the data set. In other words, the surface does
not infer local maxima or minima implicit in the data set. This problem can be overcome by generalizing the basic
form of the equation for Shepard's method in the following manner:
where Qi are nodal functions or individual functions defined at each scatter point (Franke 1982; Watson & Philip
1985). The value of an interpolation point is calculated as the weighted average of the values of the nodal functions
at that point. The standard form of Shepard's method can be thought of as a special case where horizontal planes
(constants) are used for the nodal functions. The nodal functions can be sloping planes that pass through the scatter
point. The equation for the plane is as follows:
where fx and fy are partial derivatives at the scatter point that have been previously estimated based on the geometry
of the surrounding scatter points. Gradients are estimated in GMS by first triangulating the scatter points and
computing the gradient at each scatter point as the average of the gradients of each of the triangles attached to the
scatter point.
The planes represented by the above equation are sometimes called "gradient planes". By averaging planes rather
than constant values at each scatter point, the resulting surface infers extremities and is asymptotic to the gradient
plane at the scatter point rather than forming a flat plateau at the scatter point.
3D Interpolation The 3D equivalent of a gradient plane is a "gradient hyperplane." The equation of a gradient
hyperplane is as follows:
where fx, fy, and fz are partial derivatives at the scatter point that are estimated based on the geometry of the
surrounding scatter points. The gradients are found using a regression analysis which constrains the hyperplane to
69
Gradient Plane Nodal Functions
the scatter point and approximates the nearby scatter points in a least squares sense. At least five non-coplanar scatter
points must be used.
Quadratic Nodal Functions
The nodal functions used in inverse distance weighted interpolation can be higher degree polynomial functions
constrained to pass through the scatter point and approximate the nearby points in a least squares manner. Quadratic
polynomials have been found to work well in many cases (Franke & Nielson 1980; Franke 1982). The resulting
surface reproduces local variations implicit in the data set, is smooth, and approximates the quadratic nodal functions
near the scatter points. The equation used for the quadratic nodal function centered at point k is as follows:
To define the function, the six coefficients ak1..ak6 must be found. Since the function is centered at the point k and
passes through point k, we know beforehand that ak1=fk where fk is the function value at point k. The equation
simplifies to:
Now there are only five unknown coefficients. The coefficients are found by fitting the quadratic to the nearest NQ
scatter points using a weighted least squares approach. In order for the matrix equation used to solve for the
coefficients to be stable, there should be at least five scatter points in the set.
3D Interpolation
For 3D interpolation, the equation for the quadratic nodal function is:
To define the function, the ten coefficients ak1..ak10 must be found. Since the function is centered on point k, we
know that ak1=fk where fk is the data value at point k. The equation simplifies to:
Now there are only nine unknown coefficients. The coefficients are found by fitting the quadratic to a subset of the
neighboring scatter points in a weighted least squares fashion. In order for the matrix equation used to be solve for
the coefficients to be stable, there should be at least ten non-coplanar scatter points in the set.
70
Subset Definition
71
Subset Definition
In the IDW Interpolation Options dialog, an option is available for using a subset of the scatter points (as opposed to
all of the available scatter points) in the computation of the nodal function coefficients and in the computation of the
interpolation weights. Using a subset of the scatter points drops distant points from consideration since they are
unlikely to have a large influence on the nodal function or on the interpolation weights. In addition, using a subset
can speed up the computations since less points are involved.
If the Use subset of points option is chosen, the Subsets button can be used to bring up the Subset Definition dialog.
Two options are available for defining which points are included in the subset. In one case, only the nearest N points
are used. In the other case, only the nearest N points in each quadrant are used as shown below. This approach may
give better results if the scatter points tend to be clustered.
The Four Quadrants Surrounding an
Interpolation Point.
If a subset of the scatter point set is being used for interpolation, a scheme must be used to find the nearest N points.
Two methods for finding a subset are provided in the Subset Definition dialog: the global method and the local
method.
Global Method
With the global method, each of the scatter points in the set are searched for each interpolation point to determine
which N points are nearest the interpolation point. This technique is fast for small scatter point sets but may be slow
for large sets.
Local Method
With the local methods, the scatter points are triangulated to form a temporary TIN before the interpolation process
begins. To compute the nearest N points, the triangle containing the interpolation point is found and the triangle
topology is then used to sweep out from the interpolation point in a systematic fashion until the N nearest points are
found. The local scheme is typically much faster than the global scheme for large scatter point sets.
Computation of Interpolation Weights
Computation of Interpolation Weights
When computing the interpolation weights, three options are available for determining which points are included in
the subset of points used to compute the weights and perform the interpolation: subset, all points, and enclosing
triangle.
Subset of Points
If the Use subset of points option is chosen, the Subset Definition dialog can be used to define a local subset of
points.
All Points
If the Use all points option is chosen, a weight is computed for each point and all points are used in the
interpolation.
Enclosing Triangle
The Use vertices of enclosing triangle method makes the interpolation process a local scheme by taking advantage
of TIN topology (Franke & Nielson, 1980). With this technique, the subset of points used for interpolation consists
of the three vertices of the triangle containing the interpolation point. The weight function or blending function
assigned to each scatter point is a cubic S-shaped function as shown in part a of the figure below. The fact that the
slope of the weight function tends to unity at its limits ensures that the slope of the interpolating surface is
continuous across triangle boundaries.
(a) S-Shaped Weight Function and (b) Delauney Point Group for
Point A.
The influence of the weight function extends over the limits of the Delauney point group of the scatter point. The
Delauney point group is the "natural neighbors" of the scatter point, and the perimeter of the group is made up of the
outer edges of the triangles that are connected to the scatter point as shown in part b. The weight function varies
from a weight of unity at the scatter point to zero at the perimeter of the group. For every interpolation point in the
interior of a triangle there are three nonzero weight functions (the weight functions of the three vertices of the
triangle). For a triangle T with vertices i, j, & k, the weights for each vertex are determined as follows:
Where ||ei|| is the length of the edge opposite vertex i, and bi, bj, bk are the area coordinates of the point (x,y) with
respect to triangle T.
Area coordinates are coordinates that describe the position of a point within the interior of a triangle relative to the
vertices of the triangle. The coordinates are based solely on the geometry of the triangle. Area coordinates are
72
Computation of Interpolation Weights
73
sometimes called "barycentric coordinates." The relative magnitude of the coordinates corresponds to area ratios as
shown below:
Barycentric Coordinates for a Point in a Triangle.
The XY coordinates of the interior point can be written in terms of the XY coordinates of the vertices using the area
coordinates as follows:
Solving the above equations for bi, bj, and bk yields:
Using the weight functions defined above, the interpolating surface at points inside a triangle is computed as:
where wi, wj, and wk are the weight functions and Qi, Qj, and Qk are the nodal functions for the three vertices of the
triangle.
74
4.4. Clough-Tocher
Clough-Tocher
The Clough-Tocher interpolation technique is often referred to in the literature as a finite element method because it
has origins in the finite element method of numerical analysis. Before any points are interpolated, the scatter points
are first triangulated to form a temporary TIN. A bivariate polynomial is defined over each triangle, creating a
surface made up of a series of triangular Clough-Tocher surface patches.
The Clough-Tocher patch is a cubic polynomial defined by twelve
parameters shown in the following figure: the function values, f, and
the first derivatives, fx & fy, at each vertex, and the normal derivatives,
, at the midpoint of the three edges in the triangle (Clough & Tocher,
1965; Lancaster & Salkauskas, 1986). The first derivatives at the
vertices are estimated using the average slopes of the surrounding
triangles. The element is partitioned into three subelements along
seams defined by the centroid and the vertices of the triangle.
A complete cubic polynomial of the form:
The Twelve Parameters Used to Define the
Clough-Tocher Triangle
is created over each sub-triangle with slope continuity across the seams and across the boundaries of the triangle.
Second derivative continuity is not maintained across the seams of the triangle.
Since the Clough-Tocher scheme is a local scheme, it has the advantage of speed. Even very large scatter point sets
can be interpolated quickly. It also tends to give a smooth interpolating surface which brings out local trends in the
data set quite accurately.
Since a TIN only covers the convex hull of a scatter point set, extrapolation beyond the convex hull is not possible
with the Clough-Tocher interpolation scheme. Any points outside the convex hull of the scatter point set are assigned
the default extrapolation value entered at the bottom of the Interpolation Options dialog.
75
4.5. Natural Neighbor
Natural Neighbor
The basic equation used in natural neighbor interpolation is identical to the one used in IDW interpolation:
As with IDW interpolation, the nodal functions can be either constants, gradient planes, or quadratics. The nodal
function can be selected using the Natural Neighbor Interpolation Options dialog. The difference between IDW
interpolation and natural neighbor interpolation is the method used to compute the weights and the method used to
select the subset of scatter points used for interpolation.
Natural neighbor interpolation is based on the Thiessen polygon network of the scatter point set. The Thiessen
polygon network can be constructed from the Delauney triangulation of a scatter point set. A Delauney triangulation
is a TIN that has been constructed so that the Delauney criterion has been satisfied.
Delauney Triangulation and Corresponding Thiessen Polygon
Network for a Set of Scatter Points.
There is one Thiessen polygon in the network for each scatter point. The polygon encloses the area that is closer to
the enclosed scatter point than any other scatter point. The polygons in the interior of the scatter point set are closed
polygons and the polygons on the convex hull of the set are open polygons.
Each Thiessen polygon is constructed using the circumcircles of the triangles resulting from a Delauney triangulation
of the scatter points. The vertices of the Thiessen polygons correspond to the centroids of the circumcircles of the
triangles.
Natural Neighbor
76
Local Coordinates
The weights used in natural neighbor interpolation are based on the concept of local coordinates. Local coordinates
define the "neighborliness" or amount of influence any scatter point will have on the computed value at the
interpolation point. This neighborliness is entirely dependent on the area of influence of the Thiessen polygons of the
surrounding scatter points.
To define the local coordinates for the interpolation point, Pn, the area of all Thiessen polygons in the network must
be known. Temporarily inserting Pn into the TIN causes the TIN and the corresponding Thiessen network to change,
resulting in new Thiessen areas for the polygons in the neighborhood of Pn.
The concept of local coordinates is shown graphically in the following figure. Points 1-10 are scatter points and Pn is
a point where some value associated with points 1-10 is to be interpolated. The dashed lines show the edges of the
Thiessen network before Pn is temporarily inserted into the TIN and the solid lines show the edges of the Thiessen
network after Pn is inserted.
Overlapping Thiessen Polygon Areas Used in Computation of Local
Coordinates.
Only those scatter points whose Thiessen polygons have been altered by the temporary insertion of Pn are included in
the subset of scatter points used to interpolate a value at Pn. In this case, only points 1, 4, 5, 6, & 9 are used. The
local coordinate for each of these points with respect to Pn is defined as the area shared by the Thiessen polygon
defined by point Pn and the Thiessen polygon defined by each point before point Pn is added. The greater the
common area, the larger the resulting local coordinate, and the larger the influence or weight the scatter point has on
the interpolated value at Pn.
If we define k(n) as the Thiessen polygon area of Pn and km(n) as the difference in the Thiessen polygon area of a
neighboring scatter point, Pm, before and after Pn is inserted, then the local coordinate lm(n) is defined as:
The local coordinate lm(n) varies between zero and unity and is directly used as the weight, wm(n), in the
interpolation equation. If Pn is at precisely the same location as Pm, then the Thiessen polygon areas for Pn and Pm
are identical and lm(n) has a value of unity. In general, the greater the relative distance Pm is from Pn, the smaller its
influence on the final interpolated value.
Natural Neighbor
Extrapolation
As shown in the figure above, the Thiessen polygons for scatter points on the perimeter of the TIN are open-ended
polygons. Since such polygons have an infinite area, they cannot be used directly for natural neighbor interpolation.
Thus, a special approach is used to facilitate extrapolation with the natural neighbor scheme. Prior to interpolation,
the X and Y boundaries of the object being interpolated to (grid, mesh, etc.) are determined and a box is placed
around the object whose boundaries exceed the limits of the object by approximately 10% (this value can be
modified by the user). Four temporary "pseudo-scatter points" are created at the four corners of the box. The inverse
distance weighted interpolation scheme with gradient plane nodal functions is then used to estimate a data value at
the pseudo-points. From that point on, the pseudo-points with the extrapolated values are included with the actual
scatter points in the interpolation process. Consequently, all of the points being interpolated to are guaranteed to be
within the convex hull of the scatter point set. Once the interpolation is complete, the pseudo-points are discarded.
77
78
4.6. Kriging
Kriging
Kriging is a method of interpolation named after a South African mining engineer named D. G. Krige who
developed the technique in an attempt to more accurately predict ore reserves. Over the past several decades kriging
has become a fundamental tool in the field of geostatistics.
Kriging is based on the assumption that the parameter being interpolated can be treated as a regionalized variable. A
regionalized variable is intermediate between a truly random variable and a completely deterministic variable in that
it varies in a continuous manner from one location to the next and therefore points that are near each other have a
certain degree of spatial correlation, but points that are widely separated are statistically independent (Davis, 1986).
Kriging is a set of linear regression routines which minimize estimation variance from a predefined covariance
model.
The kriging routines implemented in GMS are based on the Geostatistical Software Library (GSLIB) routines
published by Deutsch and Journel (1992). Since kriging is a rather complex interpolation technique and includes
numerous options, a complete description of kriging is beyond the scope of this reference manual. The user is
strongly encouraged to refer the GSLIB textbook for more information:
Deutsch, C.V., & A.G. Journel. GSLIB: Geostatistical Software Library and User's Guide. Oxford University Press,
New York, 1992.
Other good references on kriging include:
Royle, A.G., F.L. Clausen, & P. Frederiksen. Practical Universal Kriging and Automatice Contouring.
Geo-Processing, Vol. 1, No. 4, 1981.
Davis, J.C. Statistics and Data Analysis in Geology. John Wiley & Sons, New York, 1986.
Lam, N.S. Spatial Interpolation Methods: A Review. The American Cartographer. Vol. 10, No. 2, 1983.
Heine, G.W., A Controlled Study of Some Two-Dimensional Interpolation Methods, COGS Computer
Contributions, Vol. 2, No. 2.
Olea, T.A., Optimal Contour Mapping using Universal Kriging. J. Geophys. Research, Vol. 79, No. 5, 1974.
Journel, A.G., & Huijbregts, C.J. Mining Geostatistics. Academic Press, New York, NY, 1978.
A powerful set of kriging techniques with varying degrees of sophistication have been implemented in GMS. The
selection of the Kriging method and the definition of the variograms are accomplished using the Kriging Options
dialog. There are several differences between 2D and 3D Kriging. The supported techniques include:
Ordinary Kriging
The first step in ordinary kriging is to construct a variogram from the scatter point set to be interpolated. A
variogram consists of two parts: an experimental variogram and a model variogram. Suppose that the value to be
interpolated is referred to as f. The experimental variogram is found by calculating the variance (g) of each point in
the set with respect to each of the other points and plotting the variances versus distance (h) between the points.
Several formulas can be used to compute the variance, but it is typically computed as one half the difference in f
squared.
Kriging
79
Experimental and Model Variogram Used in Kriging
Once the experimental variogram is computed, the next step is to define a model variogram. A model variogram is a
simple mathematical function that models the trend in the experimental variogram.
As can be seen in the above figure, the shape of the variogram indicates that at small separation distances, the
variance in f is small. In other words, points that are close together have similar f values. After a certain level of
separation, the variance in the f values becomes somewhat random and the model variogram flattens out to a value
corresponding to the average variance.
Once the model variogram is constructed, it is used to compute the weights used in kriging. The basic equation used
in ordinary kriging is as follows:
Where n is the number of scatter points in the set, fi are the values of the scatter points, and wi are weights assigned
to each scatter point.
This equation is essentially the same as the equation used for inverse distance weighted interpolation (equation 9.8)
except that rather than using weights based on an arbitrary function of distance, the weights used in kriging are based
on the model variogram. For example, to interpolate at a point P based on the surrounding points P1, P2, and P3, the
weights w1, w2, and w3 must be found. The weights are found through the solution of the simultaneous equations:
where S(dij) is the model variogram evaluated at a distance equal to the distance between points i and j. For example,
S(d1p) is the model variogram evaluated at a distance equal to the separation of points P1 and P. Since it is necessary
that the weights sum to unity, a fourth equation is added:
Since there are now four equations and three unknowns, a slack variable, l, is added to the equation set. The final set
of equations is as follows:
The equations are then solved for the weights w1, w2, and w3. The f value of the interpolation point is then calculated
as:
Kriging
By using the variogram in this fashion to compute the weights, the expected estimation error is minimized in a least
squares sense. For this reason, kriging is sometimes said to produce the best linear unbiased estimate. However,
minimizing the expected error in a least squared sense is not always the most important criteria and in some cases,
other interpolation schemes give more appropriate results (Philip & Watson, 1986).
An important feature of kriging is that the variogram can be used to calculate the expected error of estimation at each
interpolation point since the estimation error is a function of the distance to surrounding scatter points. The
estimation variance can be calculated as:
When interpolating to an object using the kriging method, an estimation variance data set is always produced along
with the interpolated data set. As a result, a contour or iso-surface plot of estimation variance can be generated on the
target mesh or grid.
Simple Kriging
Simple kriging is similar to Ordinary Kriging except that the following equation is not added to the set of equations:
and the weights do not sum to unity. Simple kriging uses the average of the entire data set while ordinary kriging
uses a local average (the average of the scatter points in the kriging subset for a particular interpolation point). As a
result, simple kriging can be less accurate than ordinary kriging, but it generally produces a result that is "smoother"
and more aesthetically pleasing.
Universal Kriging
One of the assumptions made in kriging is that the data being estimated are stationary. That is, as you move from one
region to the next in the scatter point set, the average value of the scatter points is relatively constant. Whenever
there is a significant spatial trend in the data values such as a sloping surface or a localized flat region, this
assumption is violated. In such cases, the stationary condition can be temporarily imposed on the data by use of a
drift term. The drift is a simple polynomial function that models the average value of the scatter points. The residual
is the difference between the drift and the actual values of the scatter points. Since the residuals should be stationary,
kriging is performed on the residuals and the interpolated residuals are added to the drift to compute the estimated
values. Using a drift in this fashion is often called "universal kriging."
80
Kriging Options
Kriging Options
The kriging options can be edited with the Kriging Options dialog. The options are as follows:
Kriging Method
The pull-down list in the kriging method section is used to select which kriging technique is used. The options are
simple kriging or ordinary kriging. (See Kriging)
Drift
When performing Universal Kriging, a drift function should be defined. The Drift button brings up the Drift dialog.
Each of the toggles in the dialog represents a single component of the polynomial equation defining the drift.
Initially, all of the toggles off by default. Turning on coefficients enables universal kriging and defines the drift
polynomial. For example, to use a planar drift function, only the linear terms should be used.
Search Options
The Search Options button brings up the Search Options dialog. The Minimum and Maximum values in the Number
of points to use for kriging controls how many of the points found in the search radius are actually used in the
kriging calculations. If fewer than the minimum value are found, a default value (-999) is assigned to the
interpolation point. If greater than the maximum value is found, the closest points are used.
The input data cutoff values are used to screen out data values outside the specified range. Points with values outside
this range are ignored.
If the Octant option is selected in the search type section, a maximum of N points in each of the eight octants (for 2D
a quadrant is used) surrounding the interpolation point are used in the calculations. This method results in better
performance with clustered data. If the Normal method is selected, the octant approach is not used.
Search Ellipsoid
The Search Ellipsoid button brings up the Search Ellipsoid dialog. When a value is interpolated to an interpolation
point, only a subset of the scatter points in the vicinity of the interpolation point are used in the calculations. The
items in the Search Ellipsoid dialog control the shape of a "search space" surrounding the interpolation point. Only
points in this search space are considered candidates for use in the kriging calculations.
By default, the search space is a circle (sphere in 3D) centered at the point with a radius defined by the Maximum
search radius item. For problems exhibiting anisotropy, the search space can be transformed to an ellipse (ellipsoid in
3D). The anis1 factor and the azimuth angle control the shape and orientation of the ellipse. The azimuth represents
the rotation of the major principal axis clockwise from the +y axis. The anis1 factor represents the ratio of the search
radius along the minor principal axis relative to the search radius (the maximum radius) in the major principal
direction. In most cases, the anis1 factor and the azimuth angle should match the anis factor and azimuth angle
defined in the Variogram Editor.
Editing Variograms
Regardless of which kriging method is selected, a model variogram must be constructed prior to interpolating the
values from the scatter points to the target object. In some cases, multiple variograms must be defined. The basic
steps involved in constructing a model variogram are to first build an experimental variogram and then construct a
model variogram that matches the experimental variogram. Variograms are constructed using the Variogram Editor.
The Variogram Editor is activated by selecting the Edit Variogram button in the Kriging Options dialog.
81
3D Kriging
3D Kriging
3D Kriging is almost identical to 2D Kriging. All of the basic kriging options, including simple kriging and ordinary
kriging. (See Kriging)
2D vs. 3D
There are several differences in the 2D and the 3D versions of kriging. First of all, if the drift option is turned on,
more drift coefficients are available. In the Search Options dialog, an octant searching scheme can be selected. A
number is entered which represents the maximum number of scatter points from each of the eight octants
surrounding the interpolation point to keep in the subset. Limiting the number of points in each octant can give better
results when the scatter points are clustered.
Modeling Anisotropy
The main difference between the 3D and 2D versions of kriging is the way anisotropy is treated. The third dimension
adds additional angles and factors that must be manipulated. As is the case with 2D kriging, the first step in
modeling anisotropy is to detect anisotropy using experimental variograms. Anisotropy can be modeled in up to
three orthogonal directions. A series of orthogonal variograms are generated at different orientations until the three
experimental variograms corresponding to the three principal axes of anisotropy are found. The combination which
gives the greatest difference in range for the three experimental variograms corresponds to the principal axes. The
axis with the largest range is the major principal axis.
When computing directional experimental variograms in 3D, two angles are used to define the direction vector:
azimuth and dip. To define the rotation of a vector, we assume the unrotated vector starts in the +y direction. The
azimuth angle is the first angle of rotation and it represents a clockwise rotation in the horizontal plane starting from
the +y axis. The dip angle is the second angle of rotation and it represents a downward rotation of the vector from the
horizontal plane. The azimuth and dip angles defined in the experimental variogram dialog can be used to define a
focused experimental variogram in any direction.
Once anisotropy has been detected using the experimental variograms, anisotropy can be modeled with the model
variogram using either the directional variogram method or the anisotropy factor method. The simplest method is the
directional variogram approach. If the directional variogram approach is used, a separate model variogram is
constructed for each of the three orthogonal axes.
If the anisotropy factor method is selected, the azimuth and dip angles corresponding to the major principal axis
should be entered into the angle edit fields in the lower left corner of the Variogram Editor. These fields also allow a
third angle of rotation, the plunge angle, to be specified. The plunge angle represents a rotation or spinning about the
direction vector (which is already rotated by the azimuth and dip). The direction of rotation is defined as clockwise
looking down the direction vector toward the origin. In most cases, the plunge angle can be left at zero.
Once the angles are entered, the model variogram should then be constructed which fits the experimental variogram
corresponding to the major principal direction. The anis1 and anis2 parameters in the Variogram Editor should then
be changed to a value other than unity (the default value). Changing these parameters to a value less than unity
causes three curves to be drawn for the model variogram. The second curve corresponds to the original curve with
the range parameter multiplied by the anis1 value. The third curve corresponds to the original curve with the range
parameter multiplied by the anis2 value. The anis1 parameter should be altered until the second curve fits the
experimental variogram corresponding to the second principal axis of anisotropy. If the principal axis is assumed to
be the y axis in the unrotated state, this axis is the x axis in the rotated state. The anis2 parameter should then be
altered until the third curve matches the third principal axis of anisotropy (the z axis in the unrotated state). Once the
correct anisotropy factors are found, the Variogram Editor should be exited and the angles and anisotropy factors
82
3D Kriging
should be entered in the Search Ellipsoid dialog to define a search ellipsoid that matches the variogram anisotropy.
For further information on modeling anisotropy in 3D, the user is referred to Deutsch and Journel (1992).
Variogram Editor
Before interpolating a scatter point set using the Kriging option, a model variogram must be defined. The basic steps
involved in constructing a model variogram are to first build an experimental variogram and then construct a model
variogram that matches the experimental variogram. This is accomplished using the Variogram Editor. The
Variogram Editor is activated by selecting the Edit Variogram button in the Kriging Options dialog.
The experimental variograms and the model variogram are plotted in the upper portion of the Variogram Editor. The
items in the upper right portion of the Editor are used to create experimental variograms. The items in the lower half
of the Editor are used to define the model variogram. In a typical study, several experimental variograms may be
constructed and plotted before one is chosen. A model variogram is then designed to fit the chosen experimental
variogram.
Creating Experimental Variograms
A new experimental variogram is computed by selecting the New button under the list of experimental variograms.
This button brings up the Experimental Variogram dialog.
Lags
When computing an experimental variogram, it is impractical to plot a variance for each scatter point with respect to
each of the other scatter points. Therefore, distances are subdivided into a number of intervals called lags as
illustrated in the following figure. The distance between each pair of scatter points is checked to see which lag
interval it lies within. The variances for all pairs of points whose separation distance falls within the same lag
interval are averaged. The resulting average is plotted in the experimental variogram vs. the distance corresponding
to the lag interval. Therefore, there is one point in the experimental variogram plot for each lag. The lag intervals are
defined in the Experimental Variogram dialog by entering a total number of lags, a unit lag separation distance, and a
lag tolerance. In most cases, the lag tolerance should be one half of the unit lag separation distance; the tolerance can
be smaller to allow for data on a pseudo-regular grid. A pair will be included in multiple lags if the tolerance is
greater than one-half of the unit lag separation distance.
83
Variogram Editor
84
Semivariogram
The semivariogram is the most common type of variogram. The semivariogram value for a lag interval is computed
as:
where N is the number of pairs of points whose separation distance falls within the lag interval and f1i and f2i are the
values at the head and tail of each pair of points. The head and tail are defined as follows:
Naming Convention for Pairs of Scatter
Points.
Covariance
The covariance is the traditional covariance used in statistics. The covariance value for a lag interval is computed as:
where m-h and m+h are the mean of the head and tail values respectively.
Correlogram
The correlogram is computed by standardizing the covariance by the standard deviation of the head and tail values.
where s-h and s+h are the standard deviation of the head and tail values respectively.
Variogram Editor
General Relative Semivariogram
This variogram is computed by standardizing the semivariogram computed using equation 9.38 by the squared mean
of the data values in each lag:
Pairwise Relative Semivariogram
With this variogram, each pair is normalized by the squared average of the tail and head values.
Experience has shown that the general relative and pairwise relative semivariograms are effective in revealing spatial
structure and anisotropy when the scatter points are sparse (Deutsch & Journel, 1992). Because of the divisors in
equations 9.41 and 9.42, these semivariograms should only be used on positively skewed data sets.
Semivariogram of Logarithms
This variogram is computed by applying equation 9.38 to the natural logarithms of the data values:
Semirodogram
The semirodogram is similar to the traditional semivariogram except that the square root of the absolute difference is
used rather than the squared difference:
Semimadogram
The semimadogram is similar to the traditional semivariogram, except that the absolute difference is used rather than
the squared difference:
The semirodogram and the semimadogram are particularly effective for establishing range and anisotropy. They
should not be used for modeling the nugget of semivariograms (Deutsch & Journel, 1992).
Viewing the Experimental Variograms
After setting up the lag interval and choosing a variogram type, the OK button is selected in the Experimental
Variogram dialog. At this point, the experimental variogram is computed. For large scatter point sets, this may take a
significant amount of time.
Once the experimental variogram is computed, it is added to the list of experimental variograms in the upper right
corner of the Variogram Editor and it is displayed in the variogram plotting window. One of the variograms in the
list is always highlighted. The name, color, and symbols (used to plot the variogram) of the highlighted variogram
can be edited. In addition, the display of each variogram can be turned on and off so any combination of
experimental variograms can be plotted. Selecting the Delete button deletes the highlighted variogram. Selecting the
Edit button causes the Experimental Variogram dialog to come up initialized with the values used in the computation
85
Variogram Editor
86
of the highlighted variogram. When the OK button is selected, the values of the variogram are recomputed.
Creating Model Variograms
Once a set of experimental variograms are computed, one is chosen and a model variogram is constructed to fit the
experimental variogram. The model variogram is constructed using the items in the lower half of the Variogram
Editor.
Model Functions
Four types of model functions are supported for building model variograms. Each of the functions are characterized
by a nugget, contribution, and range.
The Parameters Used to Define a Model Variogram.
The nugget represents a minimum variance. The contribution is sometimes called the "sill" and represents the
average variance of points at such a distance away from the point in question that there is no correlation between the
points. The range represents the distance at which there is no longer a correlation between the points.
The four model functions supported are:
Spherical Model
The Spherical Model is defined by a range -a- and a contribution -c- as:
Exponential Model
The Exponential Model is defined by a parameter -a- and a contribution -c- as:
Gaussian Model
The Gaussian Model defined by a parameter -a- and a contribution -c- as:
Power Model
The Power Model is defined by a power 0 < a < 2 and a slope c as:
Variogram Editor
87
Nested Structures
A model variogram is constructed using a combination of one or more model functions. Each instance of a model
function is called a "nested structure". A nested structure is created by selecting the New button in the Nested
Structure section of the dialog. A new structure is created and added to the list of nested structures. The model
variogram plotted in the variogram plot window represents the combination of all of the nested structures in the list.
One of the nested structures in the list is highlighted at all times. The selected structure can be deleted by selecting
the Delete button under the list. The name, model function type, contribution, and range of the selected structure can
be edited (the nugget is the same for all nested structures, i.e., only the contribution and range of each structure are
summed). As the parameters defining the structure are altered by the user, the plot of the model variogram is updated
dynamically in the variogram plot window. This type of instantaneous feedback provides a powerful tool for
"sculpting" a model variogram in an intuitive manner until it fits the selected experimental variogram.
In most cases, a single nested structure is adequate. For cases with complex experimental variograms, using multiple
nested structures to define the model variogram can prove useful.
Modeling Anisotropy
Some data sets exhibit anisotropy, i.e., the correlation between scatter points changes with direction. For example,
due to the depositional history of an alluvial soil deposit, parameters such as porosity and hydraulic conductivity
may be most strongly correlated in one direction. This means the differences in the data values change relatively
little in one direction compared to how much they change with distance in the orthogonal direction. The direction
corresponding to the highest correlation (smallest change) is called the major principal direction and the orthogonal
direction is the minor principal direction.
One of the more powerful features of the kriging method is that anisotropy can be detected by generating
experimental variograms in orthogonal directions and looking for differences. When anisotropy exists, the model
variogram can be constructed to match the anisotropy and ensure that the differences in the continuity of the data
each of the orthogonal directions is accurately modeled in the interpolated data set.
Detecting Anisotropy
Anisotropy can be detected by generating a focused experimental variogram in each orthogonal direction and
observing whether or not there are significant differences in the resulting variograms. When constructing an
experimental variogram with the Experimental Variogram dialog, directional data corresponding to an axis of
anisotropy can be entered. The meaning of the directional data is illustrated in the following figure:
The Directional Data Used to Detect Anisotropy.
Variogram Editor
88
When a scatter point is compared with each of the other scatter points to compute the experimental variogram, only
those points falling within the shaded area shown in the figure above are considered. The shaded area is defined by
the azimuth angle, the azimuth bandwidth, the half window azimuth tolerance, and the lag intervals. For isotropic
conditions, the half window azimuth tolerance should be set to 90o (the default value). This forces all points to be
included in the calculation of the experimental variogram.
Anisotropy is typically detected using a trial and error process. Pairs of experimental variograms are generated, the
pairs being offset from each other by an azimuth angle of 90o. If anisotropy exists, the ranges of the two variograms
will differ as shown below. If the data are isotropic, the azimuth angle will have little effect on the resulting
experimental variograms. The angles which produce the pair of experimental variograms with the largest difference
in ranges represent the principal axes of anisotropy. The variogram with the larger range represents the major
principal axis and the variogram with the shorter range represents the minor principal axis.
Experimental and Model Variograms for Anisotropic Conditions.
Anisotropy Method
Once anisotropy has been detected, the next step is to model the anisotropy using the model variogram.
The azimuth angle corresponding to that major principal axis (the one with the longer range) should be entered in the
azimuth angle field in the lower left corner of the Variogram Editor (the dip and plunge fields are for 3D kriging and
are dimmed for 2D interpolation). A model variogram should then be constructed which fits the experimental
variogram corresponding to the major principal direction. The anis1 parameter in the Variogram Editor should then
be changed to a value other than unity (the default value). Changing the anis1 parameter to a value less than unity
causes two curves to be drawn for the model variogram as shown in the above figure. The second curve corresponds
to the original curve with the range parameter multiplied by the anis1 value. In other words, the anis1 parameter
represents the range in the minor direction divided by the range in the major direction. The anis1 parameter should
be altered until the second curve fits the experimental variogram corresponding to the minor principal axis of
anisotropy. Each of the nested structures has an anis1 parameter that can be edited. Once again, as the anis1
parameter is altered, the variogram plot is updated dynamically, allowing a fit to be made in a simple intuitive
fashion. Once the correct anis1 factor is found, the Variogram Editor should be exited and the azimuth and anis1
factors should be entered in the Search Ellipsoid dialog to define a search ellipse that matches the variogram
anisotropy.
Variogram Editor
Saving Variograms
Once a variogram or set of variograms is defined, the variograms are saved with the data set files when the project is
saved to disk. Thus, when the project is read back in to GMS, the variograms are ready to be used for interpolation
and do not need to be redefined.
89
90
4.7. Jackknifing
Jackknifing
Jackknifing is a special type of interpolation which can be useful in analyzing a scatter point set or an interpolation
scheme. When the Jackknifing command is selected, the active scatter point set is interpolated "to itself" using the
currently selected interpolation scheme. Each point in the set is processed one at a time. The point is temporarily
removed and the selected interpolation scheme is used to interpolate to the location of the missing point using the
remaining points. Ideally, the interpolated value should correspond closely to the original measured value at the
point. By interpolating to each point, a new data set is generated for the scatter point set. This new data set can be
compared with the original data set using the Summary command in the Interpolation menu.
You can select your original data set and then you can select the data set created from jackknifing. The mean error,
mean absolute error, and the root mean squared error are automatically calculated.
91
5. Modules
92
5.1. TIN Module
TIN Module
TIN stands for Triangulated Irregular Network. TINs are used for surface modeling. TINs are formed by connecting
a set of XYZ points with edges to form a network of triangles. TINs can be used to represent the surface of a
geologic unit or the surface defined by a mathematical function.
Several TINs can be modeled at once in GMS. One of the TINs is designated as the "active" TIN. The selection and
editing tools apply to the active TIN only.
Creating a TIN
Creating a TIN
In order to create a TIN in GMS you must have a set of TIN vertices. Then the TIN is created by triangulating the
vertices (connecting the vertices with lines to form triangles). The triangulation algorithm assumes that each of the
vertices being triangulated is unique in the xy plane, i.e., no two points have the same xy location. Duplicate points
can be removed by selecting Find Duplicates from the TINs menu.
TINs can be created 3 different ways in GMS: manually entering the vertex locations and triangulating, converting a
different GMS data type to a TIN, and copying a currently existing TIN.
Manually Creating a TIN
A TIN can be created manually from the following steps:
1. Right-click in the empty space of the Project Explorer and select the New -> TIN command.
2. Select the Create Vertices tool from the TIN Tool Palette.
3. Create the vertices by clicking inside the Graphics Window at the xy coordinates where you want the vertex
located. (To change the vertex location see: Editing a TIN)
4. Select the Triangulate command from the TINs menu.
Creating a TIN from GMS Data
2D meshes, 2D grids, and 2D scatter points can all be converted to a TIN. This is accomplished by using the
following commands:
•
•
•
•
•
•
Mesh to TIN
Grid to TIN
Scatter Points to TIN
Contacts to TIN
Watertable to TIN
Add Contacts to TIN - This command is used to enter a point from a contact into the active TIN . The contact(s)
are first selected and the command is then chosen from the Borehole menu. Typically all contacts which should
be part of a TIN are selected before generating the TIN, but sometimes one is inadvertently left out, or more
boreholes are added later.
Copying a Current TIN
To make a copy of a TIN that currently exists in GMS follow these steps:
1. Select the TIN you wish to copy using the Select TINs tool.
2. Select the Duplicate TIN command from the TINs menu. A dialog appears prompting for the Z offset of the new
TIN. The Z offset is used to displace the TIN above or below the TIN being duplicated.
93
Editing a TIN
Editing a TIN
TINs can be edited several ways. The selection and editing tools apply only to the active TIN. If you are going to
edit vertices, you must first turn off the TINs | Lock All Vertices menu command.
Editing TIN Vertices
Creating New TIN Vertices
New vertices can be created using the Create Vertices tool from the TIN Tool Palette. Clicking in the Graphics
Window creates a new vertex at the point clicked (vertices can only be created when in Plan View). The default z
value and other parameters governing the creation of new vertices can be set by selecting the TIN Settings command
from the TINs menu.
Deleting TIN Vertices
Selected TIN vertices can be deleted by hitting the Delete key or by selecting the Delete command from the Edit
menu. If the Confirm Deletions option in the Preferences dialog is on, the user is prompted to confirm each deletion.
Editing TIN Vertex Coordinates
Two methods of editing TIN vertex coordinates are available. To manipulate vertex coordinates, the Select Vertex
tool must be selected from the TIN Tool Palette.
• A vertex can be moved to a new position by clicking on the vertex and holding down the mouse button while
dragging the vertex to the desired position. If the current view is plan view, dragging the vertex causes it to move
in the xy plane. GMS does not allow the vertex to be dragged to a position where one of the surrounding triangles
becomes inverted. If the current view is not the plan view, the vertex moves along the z-axis.
• The vertex position and z value can also be manipulated by selecting the vertex and changing the XYZ values that
will appear in the x, y, and z edit boxes in the Edit Window.
Snap Vertices to TIN
It is sometimes useful to snap the vertices of one TIN to another TIN. This is useful when modeling pinch out zones
and truncations. The TIN containing the vertices to be moved should be the active TIN, since vertex selection can
only be done for the active TIN. After the desired vertices have been selected, the Snap Vertices to TIN command of
the TINs menu should be selected. GMS then prompts the user to select the TIN to which the vertices are snapped.
The selected vertices' z coordinate values are then modified such that they lie on the selected TIN.
94
Editing a TIN
95
Editing Triangles of a TIN
Create Triangles
The Create Triangles tool is used to manually create new triangles. Triangles are normally created by triangulating a
set of points automatically. However, this tool is useful for manually editing and refining a TIN. To use the Create
Triangles tool:
• Select the three vertices of the triangle. The vertices can be selected in either clockwise or counter-clockwise
order.
• Drag a box around three vertices of the triangle.
Deleting Triangles
• Using the Select Triangles tool, the triangles may be selected and deleted.
• Boundary Triangles - The perimeter of the TIN resulting from the triangulation process corresponds to or
approximates the convex hull of the TIN vertices. This may result in some long thin triangles or "slivers" on the
perimeter of the triangulated region. There are several ways to deal with the long thin triangles. Thin triangles can
be selected and deleted using the normal selection procedures. There is also an option for selecting thin triangles
when the Select Triangles tool is selected. If the Control key is held down, it is possible to drag a line with the
mouse. All triangles intersecting the line are selected. Long thin triangles on the perimeter of the TIN can also be
selected by selecting the Select Boundary Triangles command from the TINs menu. The Select Boundary
Triangles command checks triangles on the outer boundary first. If the length ratio of the triangle is less than the
critical length ratio, the triangle is selected and the triangles adjacent to the triangle are then checked. The process
continues inward until none of the adjacent triangles violate the minimum length ratio. The critical length ratio for
selecting thin triangles can be set by selecting the TINs | TIN Settings menu command. The length ratio is
defined as the longest side of the triangle divided by the sum of the two shorter sides.
Changing Triangle Density
The density of a TIN can be quickly increased using the Uniformly Subdivide TIN command in the TINs menu. The
user is prompted for a subdivision factor and the factor is used to uniformly subdivide the TIN into sub-triangles as
shown below:
TIN (a) Before and (b) After Uniform Subdivision.
Editing a TIN
96
Subdivide TIN
This command can be used to "smooth" a TIN. When using a TIN for contouring, the contours are computed using a
linear interpolation of the triangles. If the vertices are sparse, the contours may not appear to be smooth. The
contours can be smoothed by copying the vertices to a scatter point set, subdividing the TIN into sub-triangles, and
interpolating the z values (or other data sets) from the scatter point set to the new vertices defining the sub-triangles.
Subdivision and smoothing can be accomplished using the following steps:
•
•
•
•
If multiple TINs exist, make sure the TIN is the active TIN.
Convert the TIN to a scatter point set using the TIN -> Scatter Points command in the TINs menu.
Subdivide the TIN by selecting the Subdivide TIN command from the TINs menu.
Switch to the 2D Scatter Point module and select an interpolation method using the Interp. Options command in
the Interpolation menu.
• Select the to Active TIN command from the Interpolation menu. This creates a new data set for the selected TIN.
Adding Breaklines
A breakline is a feature line or polyline representing a ridge or some other feature that the user wishes to preserve in
a mesh made up of triangular elements. In other words, a breakline is a series of edges to which the triangles should
conform to, i.e., not intersect.
Breaklines (a) Triangulated Mesh and Breakline. (b) Triangulated
Mesh After the Breakline has been Processed.
Breaklines can be processed using the Add Breaklines command from the Mesh menu. Before selecting the
command, one or more sequences of nodes defining the breakline(s) should be selected using the Select Node
Strings tool in the 2D Mesh Tool Palette.
As each breakline is processed, the triangles intersected by the breakline are modified by adding new nodes at
necessary locations to ensure that the edges of the triangles will conform to the breakline. The elevations of the new
nodes are based on a linear interpolation of the breakline segments. The locations of the new nodes are determined in
such a way that the Delauney criterion is satisfied.
TIN Settings
97
TIN Settings
Retriangulate After Deleting - If this option is on, the region surrounding the vertex is retriangulated as each
vertex is deleted. Otherwise, the triangles adjacent to the vertex are simply deleted.
Adjust Boundary to Include Exterior Vertices - If this option is on, the boundary of the TIN is changed so
that the new vertex becomes part of the TIN if a new point is added outside the active TIN. If the new vertex is
in the interior of the active TIN, the vertex is automatically incorporated into the TIN.
Default Z-Value - The default z value is assigned to all new vertices created with the Create Vertex tool.
Confirm Z-Values - If this option is on, GMS prompts for a z value each time a new vertex is created.
Interpolate For Default Z On Interior - If this option is on and a new vertex is created in the interior of a
TIN, a default z-value is linearly interpolated from the plane equation defined by the triangle containing the
point.
Extrapolate For Default Z On Exterior - If this option is on and a new vertex is entered outside the TIN
boundary, a default z-value is extrapolated from the TIN to the new vertex.
TIN Display Options
The properties of all TIN data that GMS displays on the screen can be controlled through the TIN tab of the Display
Options dialog. This dialog is opened by right clicking on the
TIN Data entry in the Project Explorer and
selecting the Display Options command. It can also be accessed from the from the Display menu or the
The
following table describes the display options available for the TIN module.
Display Option
Description
Vertices
If the Vertices item in the TIN Display Options dialog is set, the TIN vertices are displayed each time the Graphics Window is
refreshed. Since it is possible to accidentally drag points, vertices can be "locked" to prevent them from being dragged or edited
by selecting the Lock ALL Vertices command from the TINs menu. Vertices can be unlocked by unchecking the Lock ALL
Vertices command in the TINs menu. Both a "Locked" and "Unlocked" vertex color may be set so that there is a visible
difference when displaying the TIN. (See Editing TINs)
Triangle edges
If this item is on the lines that make up each triangle are displayed. The color of the triangle edges can be adjusted according to
the following options:
1. Auto - draws the material color if faces are not displayed. Uses black or white if the faces are displayed.
2. Specified - used the color specified next to the triangle edges
3. Material - displays the material color of the triangle
Triangle faces
The Triangle faces item causes the faces of the triangles to be drawn as filled polygons.
Texture map
image to active
TIN
The Texture map image item is used to "drape" an image over the surface of the TIN.
TIN Display Options
TIN boundary
The TIN boundary feature is often used in conjunction with contours in order to display the contours without cluttering the screen
by displaying each triangle. The first image below shows contours displayed together with the TIN triangles. The second image
shows contours displayed with the TIN boundary.
Thiessen
polygons
If the Thiessen polygons item is set, a Thiessen polygon for each TIN vertex is displayed each time the display is refreshed. The
edges of the Thiessen polygons are formed by the perpendicular bisectors of the edges of the triangles in the TIN. The vertices of
these polygons correspond to the centers of the circumcircles of the Delauney triangulation. Any location inside a Thiessen
polygon is closer to the TIN vertex contained in that polygon than to any other TIN vertex. The red polygons in the image below
correspond to the Thiessen polygons for this TIN.
98
TIN Display Options
Circumcircles
99
If the Circumcircles item is set, the circumcircle enclosing the three vertices for each triangle are drawn when the display is
refreshed. Circumcircles provide the basis of a Delauney triangulation since the Delauney criterion is satisfied by ensuring that no
circumcircle encloses a vertex. Displaying circumcircles can aid in the understanding of the triangulation process. The red circles
in the figure are the circumcircles for the TIN.
Vertex numbers If the Vertex numbers item is set, the number of each vertex is displayed adjacent to the vertex.
Scalar values
If the Scalar values item is set, the active data set value of each vertex is displayed adjacent to the vertex.
Contours
Most of the objects supported by GMS can be contoured by turning on the Contour Options in the Display Options dialog. When
an object is contoured, the values associated with the active data set for the object are used to generate the contours.
Vectors
If the Vectors item in the Display Options dialog is selected for an object (TIN, Grid, or Mesh), vector plots can be generated
using the active vector data set for the object. One vector is placed at each node, cell, or vertex.
TIN Tool Palette
The following tools appear in the dynamic portion of the Tool Palette when the TIN module is active. Only one tool
is active at any given time. The action that takes place when the user clicks in the Graphics Window with the cursor
depends on the current tool. The tools are for selection and interactive editing of TINs. The table below describes the
tools in the TIN tool palette.
Tool Tool Name
Description
Select
Vertices
The Select Vertices tool is used to select vertices for operations such as deletion, or to drag a vertex to a new location. The
coordinates of selected vertices can also be edited using the Edit Window.
Select
Triangles
The Select Triangles tool is used to select triangles for operations such as deletion.
Select TINs The Select TINs tool is used to select TINs for operations such as deletion. When this tool is active, a TIN icon appears at the
centroid of each TIN. A small letter "A" appears in the icon of the active TIN. A TIN is selected by selecting the icon. A TIN
can be designated as the active TIN by double-clicking on the TIN icon. When a different tool is selected, the icons disappear.
In some cases, several TINs occupy approximately the same location and the icons for the TINs overlap. In such cases, it may
be difficult to select the desired TIN. An alternate way to select TINs is to use the Select From List command in the Edit menu.
This brings up a list of the currently available TINs and a TIN is selected by highlighting the name of the desired TIN and
selecting the OK button.
Select
Vertex
Strings
The Select Vertex Strings tool is used to select one or more strings of vertices. Vertex strings are used for operations such as
adding breaklines to the TIN. The procedure for selecting vertex strings is somewhat different than the normal selection
procedure. Strings are selected as follows:
•
Click on the starting vertex for the string. The vertex selected will be highlighted in red.
•
Click on any subsequent vertices you would like to be part of the string (vertices do not have to be next to each other) and
double-click on the final vertex. The selected vertices are now connected by a solid red line.
To remove the last vertex from a string, press the Backspace key. To abort entering a vertex string, press the ESC key. To end a
vertex string, press Return or double-click on the last vertex in the string. Another vertex string can then be selected.
TIN Tool Palette
100
Create
Vertices
The Create Vertices tool is used to manually add vertices to a TIN. It can only be used in plan view. When this tool is selected,
clicking on a point within the Graphics Window will place a vertex at that point. What happens to the vertex after it is added
(whether and how it is triangulated into the TIN) depends on the settings in the Vertex Options dialog under the Modify TINs
menu.
Create
Triangles
The Create Triangles tool is used to manually create new triangles. Triangles are normally created by triangulating a set of
points automatically. However, this tool is useful for manually editing and refining a TIN. To use the Create Triangles tool:
•
Select the three vertices of the triangle. The vertices can be selected in either clockwise or counter-clockwise order.
•
Drag a box around three vertices of the triangle.
Swap Edges The Swap Edges tool swaps the common edge of two adjacent triangles. To use the tool, simply click on any edge in the TIN.
Contour
Lables
The Contour Label tool manually places numerical contour elevation labels at points clicked on with the mouse. These labels
remain on the screen until the contouring options are changed, until they are deleted using the Contour Label Options dialog, or
until the Graphics Window is refreshed. Contour labels can be deleted with this tool by holding down the Shift key while
clicking on the labels. This tool can only be used when the TIN is in plan view.
Converting TINS to Other Data Types
TINs may be converted to other types of data used in GMS, such as a 2D mesh or 2D scatter points. TINs can be
converted by right-clicking on the TIN in the Project Explorer, Right-clicking on the TIN in the graphics window, or
using the following commands in the TIN menu:
TIN -> 2D Scatter Points
The TIN -> 2D Scatter Points command creates a 2D scatter point set from the active TIN . One scatter point
is created for each vertex in the TIN. A copy is made of each of the data sets associated with the TIN and the
duplicate data sets are stored with the new scatter point set.
TIN -> 2D Mesh
The TIN -> 2D Mesh command creates a 2D finite element mesh from the GMS - Make TIN Activeactive
TIN . One triangular element is created for each triangle in the TIN. Any data sets associated with the TIN are
copied to the new mesh.
TIN Boundary -> Polygon
The TIN Boundary -> Polygon command creates a new polygon in the active coverage in the Map module
corresponding to the outer boundary of the active TIN .
Thiessen -> Map
The Thiessen -> Map command calculates the thiessen polygons from the TIN and converts them to Map
Polygons.
Vertex Strings -> Arcs
The Vertex Strings -> Arcs command creates an arc in the active coverage of the Map module for each of the
selected vertex strings .
Building Solids and 3D Meshes with TINs
Building Solids and 3D Meshes with TINs
TINs can be used to build 3D solid models as well as 3D meshes. This can be done by selecting the following
commands in the Build TIN menu:
• Horizons -> Solids
• Horizons -> 3D Mesh
• Fill Between TINs -> 3D Mesh
See Creating a 3D Mesh
The preferred method for creating solids is the Horizons method mentioned above. The following commands
are legacy operations that are less robust and not supported.
• TINs -> Extruded Solid - This command creates a new solid from each of the selected TINs by extruding each
of the TINs up or down to an elevation specified by the user. Extruded TINs are useful in the construction of solid
models of soil stratigraphy.
• Fill Between TINs -> Solid - This command provides a quick way to create a solid bounded above and below by
two or more selected TINs. The TIN defining the top of the boundary of the solid should be selected first. The
remaining TIN(s) are then selected. All selected TINs are extruded down to an arbitrary elevation below that of
all the selected TINs. GMS then performs a difference set operation.
TINs can be used to build three-dimensional solid models of the soil layers. The transformation from TINs to solids
is accomplished using a TIN extrusion and set operation procedure illustrated in two dimensions in the following
figure. A two-dimensional cross section of three TINs, labeled p, q, and r, is shown in part (a).
The TINs are converted into temporary solid primitives that represent
approximations of the soil layers. The conversion is accomplished by
projecting the outer boundary (perimeter) of each TIN down to a
horizontal plane. This can be thought of as an extrusion process where
a two-dimensional surface is extruded into a three-dimensional solid. A
three-dimensional illustration of this process is shown in the figure
below.
Boundaries are created around the perimeter of the solid and one large
boundary is created at the base of the solid. The elevation of the
horizontal plane is chosen so that the resulting solid is below the
lowest point of interest. A series of two-dimensional cross sections of
the primitive solids P, Q, and R formed by extruding the TINs in part
(a) of the figure above is shown in part (b).
The final step of the modeling process consists of combining the
primitive solids to form solid models of the soil layers. This is
The TIN Extrusion and Set Operation Process.
accomplished using set operations. Portions of the solids that overlap
(a) Sample TINs. (b) Extrusion of Surfaces Into
other solids are "trimmed" away and adjacent solids are forced to
Solids. (c) Creation of Layers Through Set
match precisely at the boundaries. This step of the modeling process is
Operations. (d) Completed Solid Model of Soil
Stratigraphy.
illustrated in part c. Primitive Q is subtracted from primitive P to
produce the temporary solid P-Q. Primitive R is then subtracted from
P-Q to produce the solid P'. The solid Q' is formed by subtracting primitive R from primitive Q. The primitive R
does not intersect other solids and needs no trimming. Cross sections of the completed solid models of the soil layers
are shown in part (d).
The combination extrusion/set operation process can be simplified in some cases. For example, within GMS it is
possible to create solid P' directly by "filling" between TIN p and the two TINs q and r. GMS accomplishes this by
101
Building Solids and 3D Meshes with TINs
combining the process described above for creating solid P' into a single operation. The user simply selects TINs p,
q, and r and performs the Fill Between TINs -> Solid command in the Build TINs menu of the TIN module.
The combination of TIN editing, TIN extrusion, and set operations represents a powerful and flexible tool that makes
it possible to model complex stratigraphic relationships such as truncations, faults, embedded seams, and pinchout
zones. Once the models are constructed, the volumes of the solids can be viewed using the Get Info command in the
File menu. In addition, the models can be further modified using set operations to simulate complex excavations.
Cross sections and fence diagrams can be constructed from the solid models at any location and at any orientation.
Triangulation
A TIN is constructed by triangulating a set of vertices. The vertices are connected with a series of edges to form a
network of triangles. The resulting triangulation satisfies the Delauney criterion. The Delauney criterion ensures that
no vertex lies within the interior of any of the circumcircles of the triangles in the network as shown below:
Two Adjacent Triangles Which (a) Violate and (b) Honor the
Delauney Criterion.
The result of enforcing the Delauney criterion is that long thin triangles are avoided as much as possible.
The vertices associated with the active TIN can be triangulated using the Triangulate command from the TIN menu,
or by right-clicking on the TIN in the Project Explorer and selecting the Triangulate command.
102
TIN Files
103
TIN Files
TIN files are used for storing triangulated irregular networks. The TIN file format is shown below and a sample file
is shown after. The TIN file format can be used to import a simple set of xyz coordinates since the triangle
information (beginning with the TRI card) does not need to be present. If you have a file of xyz coordinates you only
need to add the TIN, BEGT, and VERT nv cards to the top of the file and the ENDT card at the end.
TIN
BEGT
TNAM name
TCOL id
VERT nv
x1 y1 z1 lf1
x2 y2 z2 lf2
.
.
.
xnv ynv znv lfnv
TRI nt
v11 v12 v13
v21 v22 v23
.
.
.
vnt1 vnt2 vnt3
ENDT
Sample TIN File:
TIN
BEGT
TNAM Aspen
TCOL 255 255 255
VERT 408
0.0 3.1 7.8 0
5.3 8.7 4.0 1
.
.
2.4 4.4 9.0 1
TRI 408
5 1 4
4 1 2
.
.
4 2 3
ENDT
/*
/*
/*
/*
/*
/*
File type identifier */
Beginning of TIN group */
Name of TIN */
TIN material id */
Beg. of vertices */
Vertex coords. */
/* Beg. of triangles */
/* Triangle vertices */
/* End of TIN group */
TIN Files
104
Cards used in the TIN file
Card Type TIN
Description File type identifier. Must be on first line of file. No fields.
Required
YES
Card Type BEGT
Description Marks the beginning of a group of cards describing a TIN. There should be a corresponding ENDT card at a latter point in the file. No
fields.
Required
YES
Card Type TNAM
Description Provides a name to be associated with the TIN.
Required
NO
Format
TNAM name
Sample
TNAM aspen
Field
Variable
1
name
Value
str
Description
The name of the TIN.
Card Type TCOL
Description Defines a default color for the triangles of the TIN
Required
NO
Format
TCOL color_red color_green color_blue
Sample
TCOL 255 255 255
Field
Variable
Value
Description
1
color_red
0–255 The red color component of TIN triangles.
2
color_green 0–255 The green color component of TIN triangles.
3
color_blue
0–255 The blue color component of TIN triangles.
Card Type VERT
Description Lists the vertices in the TIN
Required
YES
Format
VERT nv
x1 y1 z1 lf1
x2 y2 z2 lf2
.
.
xnv ynv znv lfnv
Sample
VERT 4
0.0 3.1
5.3 8.7
2.4 4.4
3.9 1.2
Field
7.8
4.0
9.0
3.6
Variable Value
0
1
1
0
Description
TIN Files
105
1
2–4
5
nv
+
The number of vertices in the TIN
x,y,z
±
Coords. of vertex
lf
0,1
Locked / unlocked flag for vertex (optional). 0=unlocked, 1=locked. Repeat fields 2-5 nv times.
Card Type TRI
Description Lists the triangles in the TIN
Required
NO ( a set of triangles can be generated from the vertices)
Format
TRI nt
v11 v12 v13
v21 v23 v23
.
.
vnt1 vnt2 vnt3
Sample
TRI
5 1
4 1
4 2
5 4
Field
1
2–4
4
4
2
3
3
Variable Value
nt
+
v1,v2,v3 +
Description
The number of triangles in the TIN.
Vertices of triangle listed in a counter-clockwise order. Repeat nt times.
Card Type ENDT
Description Marks the end of a group of cards describing a TIN. There should be a corresponding BEGT card at a previous point in the file. No
fields.
Required
YES
106
5.2. Boreholes Module
Boreholes Module
Types of Borehole Data
A borehole can contain either stratigraphy data or sample data or both.
Stratigraphy
Stratigraphy data are used to represent soil layers that are encountered in a soil boring. The soil layers are
represented using contacts and segments as shown below. A segment represents a soil layer and a contact is the
interface between two segments.
Boreholes Representing Soil Stratigraphy With
Contacts And Segments
Sample Data
Sample data represent data obtained by continuous sampling along the length of the hole. Cone penetrometer data
and down-hole geophysical data are examples of sample data. The figure below shows an example of sample data
being displayed. Sample data are stored in data sets which can be manipulated in a similar fashion as other data sets
in GMS.
Boreholes with Sample Data
Creating and Editing Boreholes
Creating and Editing Boreholes
Boreholes can be created by importing borehole data, importing sample data, or using the borehole tools to manually
enter the boreholes.
To create a borehole data file, make a file with the borehole name, x, y, z, locations and a material ID. The z location
will be the top of the soil layer. Once a borehole has been created and imported, it can be edited in the Borehole
Editor or by using the borehole tools.
When you right click on a borehole in the Project Explorer you can copy the borehole by selecting the Duplicate
command in the pop up menu. This will create a new borehole offset in x and y by 10% of the extents of the current
data in GMS. This command is useful when there is a large gap between boreholes. A new borehole with similar
stratigraphy to neighboring boreholes can be placed in the gap and the contacts can be positioned as desired. Adding
an artificial borehole or a "pseudo-borehole" in the gap gives the user more control over the shape of the TINs and
solids created from the boreholes.
Boreholes can be locked to prevent them from being edited. When the boreholes are locked, all graphical editing is
disabled and a check appears on the menu. This prevents the boreholes, the borehole contacts, and the borehole
segments from being inadvertently dragged with the mouse. Also, the Edit Window becomes disabled. The
boreholes can still be edited using the Borehole Editor. The boreholes can be unlocked by selecting the Lock All
Boreholes command again, and the check in the menu will disappear.
Auto Select
With a large number of boreholes, it may be tedious to individually select all the borehole contacts necessary for an
operation. For this reason, the capability to automatically select multiple contacts is provided with the Auto Select
command. One contact representing a prototype or example is first selected and the Auto Select command is chosen.
The Auto-Select dialog appears showing a close-up of the selected contact and allows for:
• Matching of the material above, below, or both.
• Starting the search from the top or the bottom of the borehole.
Since only one contact per borehole is selected, the appropriate combination of the above options is important. Each
borehole is searched from either the top or bottom of the hole until the first match is made. That contact is then
added to the set of selected contacts.
The Auto Select command can also be used with the Select Segment tool in the Borehole Tool Palette to quickly
select all segments matching a selected borehole segment. In this case, the segments are selected automatically and
the Auto Select dialog does not appear.
Borehole Editor
The Borehole Editor can be used to create new boreholes and edit existing boreholes. The existing boreholes are
displayed in a tree window at the top of the dialog, with the currently selected borehole being highlighted. The
currently selected borehole is drawn along the right side of the dialog. Both Hydrogeologic Units (HGU) and Soils
are shown.
The name of the borehole can be changed by clicking on the borehole name in the text window and typing in a new
name.
If the Set water table elevation toggle is on, a water table elevation can be entered. This can be used to display a
water table symbol on each hole.
The borehole's contacts are listed in the spreadsheet in the middle of the dialog. Contacts can be deleted and new
contacts can be inserted above the currently selected contact using the buttons just below the spreadsheet. The
107
Creating and Editing Boreholes
108
material below the contact is specified by selecting the material name.
Borehole Editor Dialog
Borehole Display Options
The properties of all borehole data that GMS displays on the screen can be controlled through the Borehole tab of the
Display Options dialog. This dialog is opened by right clicking on the
Borehole Data entry in the Project Explorer
and selecting the Display Options command. It can also be accessed from the from the Display menu or the
Display Options macro. The following table describes the display options available for the Borehole module.
Display Option
Borehole edges
Description
This option controls the display of the lines that show the outline of the boreholes. The color of the borehole edges can be
adjusted according to the following options:
1. Auto - draws the material color if faces are not displayed. Uses black or white if the faces are displayed
2. Specified - used the color specified next to the borehole edges
3. Material - displays the material color of the borehole segment
Borehole faces
If this option is on then the borehole segments are displayed are filled polygons.
Diameter
This value determines the display size of the boreholes in the graphics window.
Num. slices
This edit field determines the number of slices to display the borehole. The default is 6 making the boreholes display as
hexagons.
Hole names
If the Hole names box is checked, the name of each hole is displayed at the top of the hole.
Water table
If the Water table box is checked, an icon representing the water table is displayed at the water table elevation of each
borehole.
Horizon IDs
The horizon IDs toggle controls the display of the horizon id next to each borehole contact.
Cross sections edges
The horizon ids toggle controls the display of the horizon id next to each borehole contact. 3 options are available for the
cross section edges:
1. Auto - draws the material color if faces are not displayed. Uses black or white if the faces are displayed
2. Specified - used the color specified next to the cross section edges
3. Material - displays the material color of the stratigraphic unit in the cross section
Cross section faces
If this option is on then the borehole segments are displayed as filled polygons.
Cross section names
If this option is on then the borehole names are displayed above the boreholes.
Borehole Display Options
109
Material display
This radio group determines the display color of the boreholes. The borehole segments can be colored either by the Soil
or HGU assigned.
Cross Section
Highlighting for
Horizon Coverages
Toggle display of the lines showing the part of the cross sections where the material with the horizon ID of the active
horizon coverage exists. This highlighting only appears when you are in plan view and the active coverage is a horizon
coverage.
Points
If the Points box is checked, every sample data point is displayed. If the Use color ramp box is checked, the points are
colored according to the current data set and the current color ramp settings.
Lines
If the Lines box is checked, the sample points are connected by a series of line segments. If the Use color ramp box is
checked, the line segments are colored according to the current data set and the current color ramp settings.
Data plots
If the Data plots box is checked, a plot of the current data set is drawn next to each borehole with sample data. The width
(horizontal length) can be adjusted and the options associated with the plot scale, plot axes, etc., can be accessed by
selecting the Plot Options button.
Data range
By default, the minimum color on the color ramp is associated with the minimum data set value and the maximum color
is associated with the maximum data set value. The ramp of colors can be confined to a smaller interval defined by the
Maximum and Minimum values. This forces all of the color gradation to be concentrated in a particular range of interest.
Borehole Tool Palette
The following tools are available in the dynamic portion of the Tool Palette whenever the Borehole Module is
activated. Only one tool is active at any given time. The action that takes place when the user clicks in the Graphics
Window depends on the current tool. The following table describes the tools in the borehole tool palette.
Tool
Tool
Name
Description
Select
Borehole
The Select Borehole tool is used to select entire boreholes. Information about the selected borehole can be obtained by using the
Get Info command from the File menu. Selected boreholes can be deleted, or dragged with the mouse. In plan view, the borehole
can be dragged anywhere in the XY plane. In other views, the borehole can only be dragged up and down along the Z axis unless
the Control key is held down, in which case the borehole can be dragged anywhere in the viewing plane. The coordinates of the
top of the borehole can be edited in the Edit Window. The name associated with a selected borehole can be edited by
double-clicking on the borehole or by selecting the Attributes command from the Edit menu while the borehole is selected.
Select
Segment
The Select Segment tool is used to select the region between two contacts. Information about the selected segment can be
obtained by using the Get Info command from the File menu. The selected segment can be deleted unless it is the only segment
on the borehole. In plan view, the segment can be dragged anywhere in the XY plane with the mouse. In other views, the
selected segment can only be dragged up and down along the Z axis, unless the Control key is held down, in which case the
segment can be dragged anywhere in the viewing plane. The coordinates of the top contact on the segment can be edited in the
Edit Window . The material associated with the segment can be changed by double-clicking on the segment or by using the
Attributes command in the Edit menu. Several segments with the same material type can be selected automatically by using the
Auto Select command or they can be selected sequentially while holding down the Shift key.
Select
Contact
The Select Contact tool is used to select the interfaces between soil layers. Selected contacts can be deleted as long as there are at
least two contacts remaining on the borehole after deletion. In plan view, the selected contact can be dragged anywhere in the
XY plane with the mouse. In other views, the selected contact can only be dragged up and down along the Z axis, unless the
Control key is held down, in which case the contact can be dragged anywhere in the viewing plane. The coordinates of the
contact can be edited in the Edit Window. Multiple contacts can be selected sequentially by holding down the Shift key, or they
can be selected automatically using the Auto Select command. Selected contacts can be used to create TINs. A horizon id can be
assigned to a selected contact(s) by selecting the Properties command in the Edit menu.
Select
Cross
Section
The Select Cross Section tool selects existing cross sections by clicking on the selection icon in the GMS graphics window when
this tool is active. See the figure below.
Borehole Tool Palette
110
Create
Borehole
The Create Borehole tool can be used to create a new borehole at the location clicked on by the mouse. The user is first prompted
for the missing coordinate (i.e., in plan view, the z coordinate is asked for). Boreholes can not be created in oblique view. The
borehole is given a default name of "New Borehole" and three segments which are ten units long by default. A newly created
borehole can be edited using the other tools in the Tool Palette or the Borehole Editor.
Create
Contact
The Create Contact tool can be used to create a new contact on an existing borehole by clicking on the borehole at the location
where the new contact is to be located. The user is then prompted for the material associated with the contact (the material for
the segment below the contact).
Create
Cross
Section
The Create Cross Section tool creates user defined cross sections between existing boreholes. To create a single cross-section,
the user clicks on the first hole and then double-clicks on the second hole. Multiple panels of a cross section can be created at
once (i.e., a fence diagram) by single-clicking on sequence of boreholes and double-clicking on the last borehole.
The figure below shows a set of borehole cross sections. The cross section selection icon is the black diamond near
the center of each of the cross sections. A cross section can be edited by selecting its corresponding icon and
selecting the Cross Section Editor command from the Borehole menu or by double-clicking on the selection icon.
Set of borehole cross sections
Borehole Hydrogeologic Units
Hydrogeologic units (HGUs) can be defined on boreholes. HGUs are typically a simplified representation of the soil
layers from the borehole field data. For example, the borehole log may include several types of sand ("brown sand",
"gray silty sand", "clean sand"), but for modeling purposes, you may want to treat these all as one material, "sand".
Now you can show both the original soils and the simplified HGUs on the boreholes.
Borehole Editor - The HGU and soil IDs can be edited using the Borehole Editor.
Display in Main Window - The boreholes can be displayed in the main graphics window using either the HGU IDs
or the soil IDs. The ID used for display can be selected in the Borehole Display Options dialog.
Borehole Display Options
Importing Borehole Data - When importing borehole data, both an
HGU and Soil ID column can be used in the input. Files containing
only a single set of materials can be imported to either field and the
other field can be populated using the conversion tools described
below.
Converting Materials - A set of soil IDs can be converted to a set of
HGU IDs using the Soils->HGUs command in the Borehole menu. Likewise, a set of HGU IDs can be converted to
a set of soil IDs using the HGUs->Soils command.
Building Cross-Sections, Solids - When building cross-sections or solid models using boreholes, the HGU IDs are
used by GMS. The soil IDs are used purely for visualization or for setting up the HGU IDs.
Converting Borehole Data
Converting Borehole Data
Borehole data can be converted to other types of objects with in GMS such as 2D Scatter Points, TINs, 3D Meshes.
Borehole data is converted by using the following commands in the Boreholes menu:
•
•
•
•
Horizons to Solids
Horizons to HUF
Horizons to 3D Mesh
Contacts to TIN
The Contacts -> TIN command is used to create a TIN surface from a set of selected contacts.
• Contacts to 2D Scatter Points
A set of selected contacts can be converted to a 2D scatter point set using the Contacts -> 2D Scatter Points
command.
• Sample Data to 3D Scatter Points
The Sample Data -> 3D Scatter Points command brings up the Sample Data -> Scatter Points dialog that is
used to create a 3D scatter point set from sample data.
• Sample Data to Stratigraphy
• Watertable to 2D Scatter Points
The water table coordinates for a set of boreholes can be converted to a 2D scatter point set using the Water
Table -> 2D Scatter Points command.
• Add Contacts to TIN
The Add Contacts to TIN command is used to enter a point from a contact into the active TIN. The contact(s)
are first selected and the command is then chosen from the Borehole menu. Typically all contacts which
should be part of a TIN are selected before generating the TIN, but sometimes one is inadvertently left out, or
more boreholes are added later.
111
Borehole Cross Sections
Borehole Cross Sections
A borehole cross section is a set of polylines and polygons that define the stratigraphy between two boreholes. A
borehole cross section can be created manually or automatically.
Creation
Automatic creation
Cross sections can be created automatically using the Boreholes|Auto-Create Blank Cross Sections menu command.
This uses a triangulation process to determine the most likely connections between boreholes. The top and/or bottom
arcs of the new cross sections can be warped to match the elevation of TIN surfaces using the Snap Cross Sections to
TIN dialog which appears when the Boreholes|Auto-Create Blank Cross Sections command is executed. Snapping
the tops and bottoms of cross sections to TIN surfaces can also be done at any time via the
Boreholes|Advanced|Snap Cross Sections to TIN menu command. Keep in mind, however, that warping the top and
bottom of a cross section may interfere with the internal polygons that are defined in the cross section, so snapping to
a TIN is best done before filling in the cross sections.
112
Borehole Cross Sections
113
Manual creation
Cross sections can be created manually by using the Create Cross Section tool and clicking on boreholes.
Editing
When a borehole cross section is first created, it is made up of a set of default lines. The figure below shows a
default cross section. Notice that "arcs" (polylines) have been created defining the top and bottom of the cross
section and an "arc" (polyline) has been created for each segment in the boreholes.
Default cross section
Automatic editing
The Boreholes|Auto-Fill Blank Cross Sections menu command can be used to automatically fill in all existing blank
cross sections. The command can use either the horizon IDs (preferred) or materials information on the boreholes.
Manual editing
To edit a cross section manually, the user must use the Select Cross Section tool and select a cross section. The
Cross Section Editor dialog can be then opened by selecting the Cross Section Editor command from the Borehole
menu while the user has either a single or a series of cross sections selected. The user can also launch the Cross
Section Editor dialog by double-clicking on a single cross section. The next figure shows a finished cross section.
Borehole Cross Sections
114
Complete cross section
Borehole Cross Section Editor
The Cross Section Editor can be used to manually construct and view cross sections between boreholes. The Cross
Section Editor in GMS 6.5 has been updated to allow for the display and editing of multiple borehole cross sections.
The Cross Section Editor has a set of tools and toggles used to create, edit, and view the cross sections. The tools
used to create the nodes, polylines, and polygons are similar to the tools available in the Map module used to create
feature objects (points, arcs, and polygons). The following tables describe the tools and display options available in
the Cross Section Editor.
Tools
Tool
Tool Name
Description
Select Tool
Generic selection tool that selects nodes, vertices, arcs, and polygons
Select Point/Node
Selection tool that will only select points or nodes
Select Vertex
Selection tool that will only select vertices
Select Arc
Selection tool that will only select arcs
Select Polygon
Selection tool that will only select polygons
Create Vertex
Creates new vertices along arcs within the cross section
Create Arc
Creates arcs between two nodes or vertices within the cross section
Pan
Pans in the viewing area of the Graphics Window
Zoom
Magnifies or shrinks the current viewing area
Borehole Cross Sections
115
Frame All Cross
Sections
Frames to the extents of all the cross sections
Frame Current
Cross Section
Frames to the extents of the current cross section
Z-Magnification
Adjusts the Z-Magnification factor to increase or decrease the graphical display along the Y (real world Z) axis, making
more or less room at the top and bottom of the screen while maintaining the boreholes and cross sections in the middle
of the screen
Plot Options
Adjusts the axes plot options, including: title, background color, font, font color, grid display, axes titles, and axes
display
Delete
Deletes the currently selected vertices, nodes, arcs, or polygons
Left
Activates the cross section to the left of the current cross section as the current cross section
Right
Activates the cross section to the right of the current cross section as the current cross section
Print
Prints the current Graphics Window
Auto-Match Cross Creates a set of straight arcs connecting matching contacts on adjacent boreholes based on the user's selection to use
Section
Horizons or Materials
Build Cross
Section Polygons
Deletes all current polygons, builds new polygons using all of the arcs, and checks to see if every polygon built is valid.
A polygon is valid only if it contains either one arc representing a borehole region or two arcs representing two matching
borehole regions on two holes. Thus, every valid polygon can be assigned one and only one material type. If every
polygon built is valid, the Color Fill toggle will be automatically turned on and all polygons built will be filled with the
color representing the material they are assigned. Otherwise, a dialog saying "Invalid polygons present" will pop up and
all polygons built will be deleted.
Delete All
Deletes all of the vertices, nodes, arcs, and polygons in the current cross section
Display Options
Display Toggle
Nodes
Vertices
Description
Controls the display of the nodes in the graphics window
Controls the display of the vertices in the graphics window
Arcs
Controls the display of the arcs in the graphics window
Boreholes
Controls the display of the arcs in the graphics window
Poly fill
Controls the display of the polygons in the graphics window
Mirror view
Reverses the order in which the cross sections are displayed
Mark inactive
Dims the inactive cross sections
Display axes
Controls the display of the plot axes in the graphics window
116
5.2.1. Horizons
Horizons
The term “horizon” refers to the top of each stratigraphic unit that will be represented in a corresponding Solid, HUF
unit or Material Layer. Horizons are numbered consecutively in the order that the strata are “deposited” (from the
bottom up). Horizons can be assigned to both Boreholes and TINs.
Once horizons have been assigned to boreholes and/or TINs, the Horizons Wizard can be used to create solids, 3D
mesh, or HUF data.
Assigning Horizons to Boreholes
Horizons are defined at borehole contacts. Each contact that the user wishes to include in the construction of the
solid must have a horizon ID. If the user wishes to ignore a contact, this can be done by setting the horizon ID to
zero. Horizons are numbered in the order that the strata are “deposited” (from the bottom up). Gaps can exist in the
horizons. For example, horizons can be assigned using 1, 2, 3, ect..., or the user could assign horizons using 10, 20,
30, etc...
Automatic Assignment
To have GMS automatically assign horizon IDs to boreholes, you can use the Boreholes | Auto-Assign Horizons
menu command. Depending on the number and complexity of your boreholes, this command may take a
considerable amount of time.
Manual Assignment
Horizons are defined at borehole contacts (interface between different materials on a borehole log) by double
clicking on a contact with the Select Contact tool. The Boreholes | Auto Select command can be helpful in assigning
horizons to a large group of boreholes.
Horizons assigned to contacts on boreholes
Horizons
Assigning Horizons to TINs
A TIN Horizon is assigned in the TIN properties dialog. This dialog can be accessed by right-clicking on a TIN in
the Project Explorer and selecting the properties command. Each TIN can be assigned one Horizon ID.
Horizons assigned to contacts in TIN Properties
Dialog
Each TIN that the user wishes to include in the horizons algorithm must have a horizon ID. If the user wishes to
ignore a TIN, this can be done by setting the horizon ID to zero.
Horizon Conceptual Model
If the user wishes to explicitly control the areal extent of a solid created from horizons, this can be done using
horizon coverages. GMS has a conceptual model type for horizons. Coverages that are inside of a horizons
conceptual model can be associated with a horizon ID. The polygons in a horizon coverage determine the areal
extent of the solid for the associated horizon. The first figure below shows a horizon coverage for the green material.
The solid associated with this horizon will not extend beyond the boundary of the polygon. The second figure shows
the solid resulting from the boreholes and the horizon coverage. When the Horizons->Solids command is executed
the user may include a Horizons conceptual model as part of the input to the command.
117
Horizon Conceptual Model
The Horizons algorithm is used to create either solids, HUF units, or 3D Meshes from Borehole and TIN data. How
to use the three Horizon commands are explained in more detail below:
• Horizons to Solids
• Horizons to 3D Mesh
• Horizons to HUF
118
Horizons Applications
119
Horizons Applications
The horizons method has been applied at a variety of sites to construct solid models of the subsurface. This page
highlights example applications of the Horizons Method.
Modeling a Slope Failure
In this example a combination of boreholes, user defined cross sections, and TINs were used to create solids at a site
with a slope failure.
Borehole data
Surface elevations
Failure surface
One user cross section
User defined cross sections
Solids created from user data
Zoomed in on cross sections
Cross sections from solids
Zoomed in on cross sections
Horizons Applications
Vertical Boundary Between Solids
In this application the user wanted to create a set of solids where there would be distinct materials below a river bed
compared to the other materials in the study area. The following cross section shows what the user wanted to create.
Primary TINs
To create solids that would match this cross section, the user created 2 different primary tins and executed the
Horizons->Solids command for each primary TIN. The first TIN covered the area of the river and the second TIN
covered the remainder of the study area as show in the images below.
Solids
The user had TINs that defined the top elevations of the horizon surfaces. There were 3 TINs used in the area around
the river and there were 4 TINs used the remainder of the study area. Solids were created for the river area using the
first TIN as the primary TIN. Solids were also created in remainder of the study area by using the second TIN as the
primary TIN. Notice the the bottom most material matches in both sets of solids. This is because the same TIN with
that horizon was used when creating both sets of solids.
120
Horizons Applications
Cross Sections from Solids
These images show the solids together and cross section cut through the solids. Again notice how the bottom most
material matches across both sets of solids.
Horizons to HUF
The following steps illustrate how to use the Horizons method to create HUF data
1. Create/Import Inputs - There are two main types of inputs for the horizons method:
1. Boreholes - Boreholes can be created by importing borehole data by using the Text Import Wizard, importing
sample data after boreholes already exist, or using the borehole tools to manually enter the boreholes. Once a
borehole has been created it can be edited in the Borehole Editor or by using the borehole tools. Also an
existing borehole can be copied. Boreholes can be locked to prevent them from being edited.
2. TINs - TINs can be created 3 different ways in GMS: manually entering the vertex locations and triangulating,
converting a different GMS data type to a TIN, and copying a currently existing TIN. (See Creating TINs)
2. Assign Horizon IDs - The term “horizon” refers to the top of each stratigraphic unit that will be represented in a
corresponding Solid, HUF unit or Material Layer. Horizons are numbered consecutively in the order that the
strata are “deposited” (from the bottom up). Horizons can be assigned to both Boreholes and TINs. (See
GMS:Horizons)
3. Create 3D Grid/MODFLOW model - A 3D Grid and MODFLOW model need to be first created to use the
Horizon -> HUF command. The flow package for the MODFLOW model must also be set to use the HUF
package. Before building a MODFLOW simulation, a 3D grid must be created which covers the area to be
modeled. A grid can be created by selecting the Create Grid command in the Grid menu. A suite of tools and
commands for editing grids (inserting rows, changing column widths, etc.) are also provided in the 3D Grid
Module. If the conceptual model approach is used to construct a MODFLOW model, the grid can be
automatically constructed from the conceptual model data using the Grid Frame and the Map -> 3D Grid
command in the Feature Objects menu. The grid can be automatically refined around wells and cells outside the
model domain can be inactivated.
4. Setup additional optional inputs - Two additional options exist to help constrain and provide user intervention
in the Horizon modeling process. The two options are to create borehole cross sections or a horizon conceptual
model.
1. Including Borehole Cross Sections
2. Horizon Conceptual Model
121
Horizons to HUF
5. Run the Horizons Wizard - Select the Horizons->3D Mesh command in the Borehole or TINs menu.
Horizon -> HUF Algorithm
When the Horizon command is executed the horizons specified on the
borehole contacts or TIN nodes are converted to a set of scatter points
with one data set for each horizon. The scatter points are then used to
interpolate a surface for each horizon. Starting with the lowest
numbered horizon, the surface is extruded down to create a HUF layer
The surface corresponding to the next horizon is then extruded down to
fill in the space between that surface and the previous surface. This
Example of Horizons to HUF
process is repeated for each surface. At each step, HUF layer is created
for the current horizon and all previously layers are subtracted from
that layer, resulting in an incremental buildup of the stratigraphy from the bottom to the top. In conclusion the HUF
Package elevation and thickness arrays are generated from the horizon data.
Horizons Wizard
The Horizons Wizard is used to create solids, a 3D mesh, or HUF layers from horizon data. The wizard is started via
the Horizons -> Solids, Horizons -> 3D Mesh, and Horizons -> HUF commands. These commands are in the TIN
and Boreholes menus.
Step 1
The first step is to define the inputs to be used, which can include boreholes, TINs, and a Horizon Conceptual
Model.
Step 2
The second step is to define the top and bottom of the solid, mesh, or HUF layers. When creating HUF data, you
may also edit the grid elevations.
Step 3
The third step is to define the interpolation method to be used, as well as options specific to creating solids, a mesh,
or HUF package.
Beginning with GMS 7.0, when creating solids, the user can choose the option Preserve projection TIN data sets.
This option will create a new TIN that will have a data set for each horizon. This is often useful so that the user can
see the result of the interpolation process for each Horizon. The user can then edit the TIN by hand and include the
TIN when executing the Horizons->Solids command.
122
Horizons to Solids
123
Horizons to Solids
The following steps illustrate how to use the Horizons method to create solid stratigraphy.
1. Create/Import Inputs - There are two main types of inputs for the horizons method:
1. Boreholes - Boreholes can be created by importing borehole data by using the Text Import Wizard, importing
sample data after boreholes already exist, or using the borehole tools to manually enter the boreholes. Once a
borehole has been created it can be edited in the Borehole Editor or by using the borehole tools. Also an
existing borehole can be copied. Boreholes can be locked to prevent them from being edited.
2. TINs - TINs can be created 3 different ways in GMS: manually entering the vertex locations and triangulating,
converting a different GMS data type to a TIN, and copying a currently existing TIN. (See Creating TINs)
2. Assign Horizon IDs - The term “horizon” refers to the top of each stratigraphic unit that will be represented in a
corresponding Solid, HUF unit or Material Layer. Horizons are numbered consecutively in the order that the
strata are “deposited” (from the bottom up). Horizons can be assigned to both Boreholes and TINs. (See Horizons)
3. Create Primary TIN - A TIN must be created or imported into GMS to be used as the Primary TIN for the
Horizons method. The primary TIN defines the boundary of the solids that will be generated. Also, the density of
the triangles in the primary TIN controls the density of the triangles in the solids that are created. (See Creating
TINs)
4. Setup additional optional inputs - Two additional options exist to help constrain and provide user intervention
in the Horizon modeling process. The two options are to create borehole cross sections or a horizon conceptual
model.
1. Including Borehole Cross Sections
2. Horizon Conceptual Model
5. Run the Horizons Wizard - Select the Horizons->Solids command in the Borehole or TINs menu.
Horizon -> Solid Algorithm
Solids created from the horizons method
When the Horizon command is executed the horizons specified on
the borehole contacts or TIN nodes are converted to a set of scatter
points with one data set for each horizon. The scatter points are
then used to interpolate a surface for each horizon. Starting with
the lowest numbered horizon, the surface is extruded down to
create a solid. The surface corresponding to the next horizon is
then extruded down to fill in the space between that surface and
the previous surface. This process is repeated for each surface. At
each step, a solid is created for the current horizon and all
previously defined solids are subtracted from that solid, resulting
in an incremental buildup of the stratigraphy from the bottom to
the top. The entire process is simpler, more intuitive, and more
robust than the old set operations approach.
Horizons to Solids
124
Including Borehole Cross Sections
If the Horizon process using horizons on borehole contacts does not
produce the desired results, the borehole data can be supplemented
with user-defined cross sections using the Cross Section Editor.
For example, when the Horizons -> Solids command is executed, the
user can choose to include cross section data. If this option is selected,
the material boundaries (arcs) on the cross sections inherit the horizon
ID assigned to the adjacent borehole contact and the points along the
material boundary are added to the contacts when interpolating the
horizon surfaces. The resulting solids match the user-defined cross
sections as closely as possible. In other words, by creating a few
simple cross section, the user has complete control over the shape of
the solids created by the horizons technique.
Cross sections from the solid created via the
horizons method
The match between the resulting solid and the user defined cross
section is a function of two things: first, the density of the points on the
user defined cross section, and second the triangle density of the
primary TIN. As mentioned, the arcs on the cross sections inherit the
horizon ID from the borehole contact as shown below.
In this case the marked points on the cross section inherit horizon ID 3.
If you want more control over the interpolation of horizon 3 then you
just need to add more points to the arc. This can be done by selecting
the redistribute command in the Cross Section Editor. The triangle
Example of how cross section data inherits
density of the primary TIN also controls how well the resulting solid
horizon id from boreholes
matches the user defined cross section. Since the points on the cross
section are interpolated to the primary TIN, if the TIN does not have a
significant number of triangles in the vicinity of the cross section then there is no way the TIN surface can match the
cross section.
Horizons to 3D Mesh
125
Horizons to 3D Mesh
The following steps illustrate how to use the Horizons method to create 3D Mesh stratigraphy.
1. Create/Import Inputs - There are two main types of inputs for the horizons method:
1. Boreholes - Boreholes can be created by importing borehole data by using the Text Import Wizard, importing
sample data after boreholes already exist, or using the borehole tools to manually enter the boreholes. Once a
borehole has been created it can be edited in the Borehole Editor or by using the borehole tools. Also an
existing borehole can be copied. Boreholes can be locked to prevent them from being edited.
2. TINs - TINs can be created 3 different ways in GMS: manually entering the vertex locations and triangulating,
converting a different GMS data type to a TIN, and copying a currently existing TIN. (See Creating TINs)
2. Assign Horizon IDs - The term “horizon” refers to the top of each stratigraphic unit that will be represented in a
corresponding Solid, HUF unit or Material Layer. Horizons are numbered consecutively in the order that the
strata are “deposited” (from the bottom up). Horizons can be assigned to both Boreholes and TINs. (See Horizons)
3. Create Primary 2D Mesh - A 2D mesh is needed to be used as a projection for the resulting 3D mesh. A 2D
mesh or a meshing coverage needs to be created and selected as the primary mesh. The 2D mesh defines the
boundary of the 3D Mesh. Also, the meshing options assigned to primary coverage controls the elements of the
3D Mesh that is created. (See Creating 2D Meshes)
4. Setup additional optional inputs - Two additional options exist to help constrain and provide user intervention
in the Horizon modeling process. The two options are to create borehole cross sections or a horizon conceptual
model.
1. Including Borehole Cross Sections
2. Horizon Conceptual Model
5. Run the Horizons Wizard - Select the Horizons->3D Mesh command in the Borehole or TINs menu.
Horizon -> 3D Mesh Algorithm
When the Horizon command is executed the horizons specified on the borehole contacts or TIN nodes are converted
to a set of scatter points with one data set for each horizon. The scatter points are then used to interpolate a surface
for each horizon. Starting with the lowest numbered horizon, the surface is extruded down to create a set of elements
in a 3D Mesh. The surface corresponding to the next horizon is then extruded down to fill in the space between that
surface and the previous surface. This process is repeated for each surface. At each step, a set of elements are created
for the current horizon and all previously defined elements are subtracted from that layer, resulting in an incremental
buildup of the stratigraphy from the bottom to the top. The entire process results in a 3D Mesh with each horizon
layer represented by a Material Zone.
TINs used to create 3D Mesh below
3D Mesh created via the horizons method
126
5.3. Solid Module
Solid Module
The Solid module of GMS is used to construct
three-dimensional models of stratigraphy using solids.
Once such a model is created, cross sections can be cut
anywhere on the model to create fence diagrams.
Solids are used for site characterization and
visualization. Solids can also be used to define layer
elevation data for MODFLOW models using the Solids
-> MODFLOW command or Solids to HUF and to
define a layered 3D mesh using the Solids -> Layered
Mesh.
Example of a solid created in GMS
Example of fence diagrams created using solids
Solid Properties
127
Solid Properties
The Solid properties dialog allows the user to edit/view attributes of the selected solid. This dialog can be accessed
by selecting a solid from the Project Explorer, right clicking to access the pop up menu, and selecting the Properties
command. It can also be accessed by double clicking on a solid in the graphics window, or by selecting a solid and
then selecting the Properties command from the Edit menu.
The following items can be edited in the properties dialog:
Name
Name of the solid
Material
Material associated with the solid
Begin Layer
beginning grid layer assigned to solid used with Solids->MODFLOW
End Layer
ending grid layer assigned to solid used with Solids->MODFLOW
Use top cell bias
option for using the top cell bias used with Solids->MODFLOW
Top cell bias
the percent to bias the thickness of the top cell with Solids->MODFLOW
Target min. cell thickness minimum cell thickness used with Solids->MODFLOW
These items are display as information about the solid:
• Solid ID
• Number vertices
• Number triangles
• Max z
• Min z
• Centroid,x
• Centroid,y
• Centroid,z
• Volume
Solid Primitives
Solid Primitives
To allow the addition of a trench, building, excavation, tunnel, etc. to a solid model, GMS provides the capability of
generating several types of simple solid primitives. The solid primitives can be combined using set operations to
model man made objects or other subsurface features which cannot be conveniently modeled by extruding TINs.
Cube
Simple cubes or, more precisely, hexahedrons whose faces are all parallel to the x, y, and z planes, can be created by
selecting the Cube command from the Solids menu and specifying the center point of the cube and the x, y, and z
dimensions.
Sphere
A sphere can be created by selecting the Sphere command from the Solids menu and inputting the radius of the
sphere, the coordinates of the centroid of the sphere, and the number of subdivisions. The number of subdivisions
determines the density of triangles used to approximate the sphere.
Cylinder
A cylinder can be created by selecting the Cylinder command from the Solids menu and inputting the coordinates of
both ends of the cylinder, the radius of the cylinder, and the number of subdivisions in the cylinder. The number of
subdivisions determines the density of triangles used to approximate the cylinder. The larger the number, the more
accurate the representation will be, however the increased number of triangles will also cause display operations to
be slower.
Prism
A prism can be created by first putting the image into plan view and then selecting the Prism command from the
Solids menu. The user is then prompted to input a polygon. As with other polygons entered in GMS, the Backspace
or Delete key can be used to delete the last point entered, the ESC key can be used to abort the process, and
double-clicking terminates point entry. The user is then prompted to enter a bottom elevation and a top elevation for
the prism. The default values given for the top and bottom elevation represent elevations just above and just below
all of the other solids. The polygon is then extruded from the top to the bottom elevation to create a solid object.
128
Solid Display Options
129
Solid Display Options
The properties of all solid data that GMS displays on the screen can be controlled through the Solids tab of the
Display Options dialog. This dialog is opened by right clicking on the
Solid Data entry in the Project Explorer
and selecting the Display Options command. It can also be accessed from the from the Display menu or the
Display Options macro. The following table describes the display options available for the solids module.
Display
Option
Solid edges
Description
The Solid edges item is used to display the edges of the solid. The solids are either drawn using the default cell color or the color of
the material associated with each solid.
The color of the solid edges can be adjusted according to the following options:
1. Auto - draws the material color if faces are not displayed. Uses black or white if the faces are displayed
2. Specified - used the color specified next to the solid edges
3. Material - displays the material color of the solid
Solid faces
The Solid faces item causes the faces of the solid to be drawn as filled polygons.
Solid Module Tool Palette
The following tools are available in the dynamic portion of the Tool Palette whenever the Solid module is activated.
Only one tool is active at any given time. The action that takes place when the user clicks in the Graphics Window
depends on the current tool. The following table describes the tool in the solid tool palette.
Tool
Tool
Name
Description
Select
Solid
The Select Solid tool is used to select solids for deletion or for set operations. When this tool is active, a solid icon appears at the
centroid of each solid. A solid is selected by selecting the icon. When a different tool is selected, the icons disappear.
Select
Face
The Select Face tool is used to select the faces of a solid.
Select
Cross
Section
Once a set of cross sections has been created, they can be selected using the Select Cross Section tool. Selected cross sections can
be deleted or made visible or invisible using the Hide and Show commands.
Create
Cross
Section
Cross sections can be created from the solids that are currently being displayed using the Create Cross Section tool. Cross sections
are formed when the user enters a polyline. A polyline is entered by clicking on several points and double-clicking on the final
point when the line is finished. The DeleteBackspace key may be used to remove a point from the polyline, and the ESC key can
be used to abort the process. A cross section or fence diagram is then computed by cutting perpendicular to the current viewing
orientation through the currently visible solids (a solid can purposefully be left out of a cross section by hiding it before making
the cross section). A section or "panel" in the fence diagram is created for each line segment in the polyline. While most cross
sections are created with the solids in plan view, any viewing orientation can be specified.
When this tool is active, a cross sections icon appears on each cross section. A cross section is selected by selecting the icon.
When a different tool is selected, the icons disappear. When there are several cross sections, it is often easier to differentiate cross
section icons in plan view (assuming the cross sections were created in plan view). As a general rule, the icons are placed in the
center of the first line segment used to cut the cross section.
When cross sections are created, the materials associated with the solids are inherited by cross sections. Cross sections can be
saved to a file if desired.
Solids to Layered Mesh
Solids to Layered Mesh
The Solids -> Layered Mesh command in the Solids menu can be used to quickly build a 3D finite element mesh that
matches the stratigraphy defined by a set of solids. This option is similar to the Boundary Matching option of the
Solids -> MODFLOW command except it results in a layered 3D finite element mesh that honors the horizontal
boundaries of the stratigraphic layers defined by a set of solids. The steps involved in using the Solids -> Layered
Mesh command are as follows:
1. Create a 2D Projection Mesh
The first step is to create a 2D projection mesh. This mesh represents a plan view of the 3D mesh. Each triangle in
the 2D mesh will result in a column of 3D wedge elements and each quadrilateral in the 2D mesh will result in a
column of 3D hexahedral elements. The 2D mesh can be refined around well locations if desired. This mesh is
typically created using the Map module as part of the FEMWATER conceptual model.
2. Create the Solids
The next step is to create the solids defining the stratigraphy. The boundary of the solids should be slightly larger
than the 2D projection mesh.
3. Assign layer ranges to the Solids
As is the case with the Solids -> MODFLOW Boundary Matching option, a layer range should be assigned to each
of the solids. There is one significant difference in assigning layer ranges with the Solids -> Layered Mesh command
is that every layer in the 3D mesh must be present in the solids. You can not have "inactive" mesh elements similar
to "inactive" grid cells.
4. Solids -> Layered Mesh Command
Unlike the Solids -> MODFLOW Boundary Matching option, it is not necessary to create a 3D mesh before
selecting the Solids -> Layered Mesh command. The 3D mesh is automatically generated. Each element in the 2D
projection mesh is extruded into a vertical column of cells and the solids are used to assign the elevations to the
nodes. The material ids are assigned to the 3D elements by finding the solid that encompasses the centroid of each
3D element assigning the material id of that solid to the element.
130
Solids to Layered Mesh
131
Sample Mesh
A sample mesh created with the Solids -> Layered Mesh option is shown below. Note that the solids boundaries are
preserved at the tops and bottoms of the solids but the transition along the edges of the solids can be irregular.
Sample mesh created using the Solids -> Layered
Mesh command
Solids to HUF
The Solids -> HUF command in the Solids menu of the Solid Module can be used to generate the HUF Package
input data from the solids currently in your project.
This command brings up the Solids -> HUF dialog. By turning on the Adjust grid cell elevations toggle the user
will adjust the 3D grid cell elevations. The Minimum cell thickness edit field allows the user to specify a minimum
cell thickness. When the elevations are adjusted, if a cell has a thickness less than the minimum the bottom cell in
that column will be inactivated and the cell elevations will be recalculated. The Fraction spreadsheet contains a
row for each layer in the 3D grid. By default, each layer is assigned an equal fraction. The user can edit the fraction
assigned to any layer by checking the Edit toggle and changing the fraction. Any layers that don't have the edit
toggle checked are evenly distributed so that the sum of the all the fractions is one.
When the user selects OK from the Solids -> HUF dialog the solids are intersected by the grid. The intersections of
the solids are then converted into HUF hydrogeologic unit top and thickness arrays.
Example of HUF data created from solids
Solids to MODFLOW Command
Solids to MODFLOW Command
The Solids -> MODFLOW command represents a powerful tool for modeling complex stratigraphy in a completely
grid-independent fashion. As part of the overall conceptual model building process, the stratigraphy at a site is
modeled as a set of solids. The solids are built using tools in the Borehole, TIN, and Solids modules. These solids
can represent a wide variety of complex stratigraphic relationships. The user then assigns hydraulic conductivity (Kh
and Kv) and storage coefficients to the solids as material properties and a multi-layer grid is constructed where the
boundary of the grid occupies the same region of the solids in plan view. The Solids -> MODFLOW command can
then be used to automatically define the elevation arrays in MODFLOW. If the grid is refined or edited in any way,
this command can be selected again to rebuild the arrays in seconds with no further user intervention. Together with
the feature objects in the Map module, a set of solids can be used to build a completely grid-independent conceptual
model regardless of the complexity of the site.
Following is the set of steps required to use the Solids -> MODFLOW command:
1. Building the Solids
2. Material Properties
3. Creating the Grid
4. When using Boundary matching, match layers to solids
5. Execute Solids -> MODFLOW
Building the Solids
Before executing the Solids -> MODFLOW command, a set of solids should be contructed that match the site
stratigraphy. These solids are typically constructed using the horizons approach. When building these solids, it is
best to build the primary TIN with a larger outer polygon boundary than the boundary that is used to define the
MODFLOW conceptual model. This ensures that the stratigraphy will encompass all of the grid.
Material Properties
The next step is to create a set of material properties for the solids using the Material Properties command in the
Solids menu.
Creating the Grid
Once the solids are created and the layer assignments are made, the next step is to create a grid. The grid boundary in
the xy plane (plan view) should either match the boundary of the solids or encompass the solids. The grid can be
refined around wells if desired. The number of layers in the grid should be compatible with the layer assignments
made to the solids. When the grid is first created, the z elevations can be ignored since they will be inherited from
the solids. A sample grid is shown below.
After the grid is created, the cells outside the model domain should be inactivated using the Activate Cells in
Coverage command in Feature Objects menu in the Map module.
132
Solids to MODFLOW Command
133
Sample grid created in GMS
Solids -> MODFLOW Options
Now you are ready to execute the Solids -> MODFLOW command. This command brings up a dialog listing the
three basic options associated with the Solids -> MODFLOW command. Each option utilizes a different approach
for converting the solid stratigraphy to the MODFLOW BCF input arrays. The three options are:
1. Boundary Matching
2. Grid Overlay
3. Grid Overlay with Keq
Boundary Matching
One of the three basic options associated with the Solids -> MODFLOW command is the Boundary Matching
option. The goal of the boundary matching algorithm is to compute a set of elevation arrays that honor the
boundaries between the stratigraphic units as closely as possible.
Solids and Layer Ranges
Next a layer range must be assigned to each solid. The layer range represents the consecutive sequence of layer
numbers in the MODFLOW grid that are to coincide with the solid model. A sample set of layer range assignments
is shown in the figure below (a). The example in the figure below is a case where each solid is continuous through
the model domain and there are no pinchouts. Each of the solids is given a layer range defined by a beginning and
ending grid layer number. The resulting MODFLOW grid is shown in the figure below (b).
(a) A Set of Simple Solids with Grid Layer
Assignments (b) The MODFLOW Grid Resulting
From the Layer Assignments
Solids to MODFLOW Command
134
A more complex case with pinchouts is illustrated in the next figure (a). Solid A is given the layer range 1-4, and the
enclosed pinchout (solid B) is given the layer range 2-2. The set of grid layers within the defined range that are
actually overlapped by the model may change from location to location. The layer range represents the set of grid
layers potentially overlapped by the solid anywhere in the model domain. For example, on the left side of the
problem shown in the figure below (a), solid A covers grid layers 1, 2, 3 and 4. On the right side of the model, solid
A is associated with grid layers 1, 3 and 4 since the enclosed solid (solid B) is associated with layer 2. Likewise,
Solid C is associated with grid layers 5 and 6 on the left side of the model but only with layer 6 on the right side of
the model where solid D is associated with layer 5. The resulting MODFLOW grid is shown in the figure below (b).
(a) Grid Layer Assignments for a Set of Solids
with Pinchouts (b) The MODFLOW Grid
Resulting From the Layer Assignments
When assigning layer ranges to solids, care must be taken to define associations that are topologically sound. For
example, since solid B in the figure above (a) is enclosed by solid A, solid B could not be assigned a layer range that
is outside the layer range of solid A.
Layer ranges are assigned using the Solids Properties dialog.
Solids -> MODFLOW Command
The final step is to select the Solids -> MODFLOW command in the Solids menu. The layer elevations and material
properties for the 3D grid will then be automatically assigned from the solids as shown below.
Grid after using the Solids->MODFLOW
command
The following images represent cross-sections at selected locations of the grid shown above. Notice that the grid
elevations precisely match the stratigraphic boundaries defined by the solids while maintaining the continuous layers
required by MODFLOW.
Solids to MODFLOW Command
135
Sample cross-section
Sample cross-section
Smoothing Tolerance
When the Solids -> MODFLOW command is executed with the Boundary Matching option, it is common to have
seams that occupy only a portion of a layer as shown in the above cross sections. The top and bottom elevations for
cells adjacent to these seams must be adjusted by GMS using a "smoothing" process to ensure that there are not
drastic cell size differences in the horizontal direction from one cell to the next. The smoothing is accomplished by
iteratively changing the elevation of selected cells until the cell elevations change less than the Smoothing Tolerance
specified in the Solids -> MODFLOW Options dialog.
Minimum Thickness
This option enables users to avoid extremely thin layers at edges of pinchouts and represents the minimum thickness
of grid cells created from the solids. Solids with thickness less than this amount are ignored and the surrounding
material is used instead. This property is assigned in the solids properties dialog. The figure below demonstrates the
application of this property.
Small minimum thickness
Larger minimum thickness
Solids to MODFLOW Command
Top Cell Bias
The top cell bias is the percentage of the thickness which is assigned to the top layer of the MODFLOW grid create
from the solids. The thickness of the top layer increases as the top cell bias increases. A large top cell bias can be
used to prevent top-layer cells from going dry. This property is assigned in the solids properties dialog.
Grid Overlay
The Grid Overlay option is one of the three basic options for the Solids -> MODFLOW command. The Grid
Overlay option is similar to the Boundary Matching option. While the Boundary Matching option precisely matches
stratigraphic boundaries, it does have some drawbacks. It can result in very thin layers at certain locations in the grid
such as transition points at the boundary of a solid that pinches out to a sharp edge. In some cases, these thin layers
can cause stability problems with MODFLOW or with a subsequent transport analysis. For such cases, the Grid
Overlay method or the Grid Overlay with Keq method may provide superior results.
With the Grid Overlay option, no layer range assignments are necessary. Once the solids and grid are created, the
Solids -> MODFLOW command can be immediately selected. For each vertical column of cells, GMS intersects a
vertical ray through the cell center and finds the highest and lowest intersection, i.e. the top and bottom of the entire
set of solids. These elevations become the top and and bottom elevation of the entire grid. The elevations of any
intermediate layer boundaries are then linearly interpolated between these two extremes. The material properties are
then assigned by computing the xyz coordinates of the center of each cell and determining which solid encloses the
cell center. The material properties from that solid are then assigned to the cell. The result is shown in the following
figure (compare this to the example shown in the Boundary Matching topic). Note that the boundaries of the solids
are not preserved as accurately as they are with the boundary matching algorithm. However, the cell sizes are much
more consistent and extremely thin cells are avoided.
136
Solids to MODFLOW Command
Minimum Thickness
In some cases, the set of solids used with the Grid Overlay method may have thin sections where the vertical
thickness of the entire set of solids becomes extremely small. In such cases, the resulting grid cells become very thin
as they are "squeezed" in this thin region. The cell thickness in these regions can be controlled using the Minimum
Thickness value in the Solids Attributes dialog. When each vertical column of cells is processed, the height of the
cells in the column is compared to the minimum thickness. If the cell height is less than the minimum, one or more
cells at the bottom of the grid are inactivated until the minimum thickness is satisfied.
Grid Overlay with Keq
The Grid Overlay option is one of the three basic options for the Solids -> MODFLOW command. This option is
very similar to the Grid Overlay option. One of the problems with the Grid Overlay option is that if there is a
relatively thin layer in the solids and the layer does not happen to encompass any cell centers or it encompasses few
cell centers, the layer will be under-represented in the MODFLOW grid. This becomes particularly important if the
layer is meant to represent a low permeability layer. For such cases, the Grid Overlay with Keq option may give
superior results. The Grid Overlay with Keq method is identical to the Grid Overlay method in terms of how the
elevations of the grid cells are defined. The two methods differ in how the material properties are assigned. Rather
than simply assigning materials based on which solid encompasses the cell centers, the Keq method attempts to
compute a custom Kh and Kv value for each cell. When assigning the material properties to a cell, GMS computes
the length of each solid in the cell (from a vertical line at the cell center that intersects the solids) and computes an
equivalent Kh, Kv, and storage coefficient for the cell that takes each of the solids in the cell into account. Thus, the
effect of a thin seam in a cell would be included in the Kh and Kv values for the cell.
The equivalent Kh is computed as follows:
where Khi is the Kh of a solid and Mi is the length of the same solid intersected at the cell center.
The equivalent Kv is computed as follows:
where Kvi is the Kv of a solid and Mi is the length of the same solid intersected at the cell center.
137
Solids to MODFLOW Command
A horizontal cross-section through a sample grid defined via the Grid Overlay with Keq method is shown below. The
colors represent the resulting Kh values. Note how the K values transition at the boundaries of the solids.
Parameter Estimation
Caution should be taken when using the Grid Overlay with Keq method when performing automated parameter
estimation. The "key value" approach to defining parameter zones for PEST requires that the values assigned to the
zones be unique within each zone. With the Boundary Matching and Grid Overlay methods, the key values could be
assigned to the solids and the values would be properly inherited by the grid cells. With the Grid Overlay with Keq
method, the parameter values are "blurred" at the edges of the solids and the key values assigned by the user to the
solids would be lost.
138
139
5.4. 2D Mesh Module
2D Mesh Module
The 2D Mesh module is used to construct two-dimensional finite element meshes. Numerous tools are provided for
automated mesh generation and mesh editing. 2D meshes are used for SEEP2D modeling and to aid in the
construction of 3D meshes. The figures below show an example of a SEEP2D model and a 3D mesh created using
the 2D Mesh Module.
3D Mesh Created by Extruding a 2D Mesh
Sample SEEP2D Problem
Creating a 2D Mesh
Creating a 2D Mesh
2D Meshes can be created 3 different ways in GMS: using an automatic meshing technique, manually entering the
node locations and triangulating, or converting a different GMS data type to a 2D Mesh.
Using an Automatic Meshing Technique
Map -> 2D Mesh is the preferred method for mesh generation in GMS.
Manually Creating a 2D Mesh
In order to create a 2D Mesh in GMS you must have a set of 2D Mesh nodes. Elements can be created by using one
of the Create Element tools in the 2D Mesh Tool Palette and then selecting the mesh nodes to create elements. A 2D
Mesh can also be created by triangulating the nodes. The triangulation algorithm assumes that each of the vertices
being triangulated is unique in the xy plane, i.e., no two points have the same xy location. Duplicate points can be
removed by selecting Find Duplicates command from the Mesh menu. The user is prompted to input a tolerance to
be used when checking for duplicate nodes. Two nodes are considered to be duplicates if the XY distance between
them is less than or equal to the specified tolerance. The user can also specify whether the duplicate nodes are to be
deleted or simply displayed in red.
A 2D Mesh can be created manually from the following steps:
1. Select the Create Nodes tool from the 2D Mesh Tool Palette.
2. Create the Nodes by clicking inside the Graphics Window at the xy coordinates where you want the vertex
located. (To change the node location see Editing 2D Meshes)
3. Select the Create Linear Triangle Element tool from the 2D Mesh Tool Palette.
4. Select the Triangulate command from the Mesh menu.
Creating a 2D Mesh from GMS Data
TINs, 2D grids, 2D scatter points, and 3D meshes can all be converted to a 2D Mesh. This is accomplished by using
the following commands:
• TIN -> 2D Mesh
• 2D Grid -> 2D Mesh
• 2D Scatter Points -> 2D Mesh Nodes
• 3D Mesh -> 2D Mesh
After using the Scatter Points -> Mesh Nodes command you must triangulate the nodes to create the 2D Mesh.
140
Editing 2D Meshes
Editing 2D Meshes
Editing Nodes
Insert Node
New nodes in a 2D mesh are created by selecting the Create Nodes tool from the 2D Mesh Tool Palette
and clicking where the new node is to be located. The default parameters governing the creation of new
nodes can be specified using the 2D Mesh Settings command in the Mesh menu. This brings up the
Node Options dialog.
Delete Node
A set of selected nodes can be deleted by hitting the Delete key or selecting the Delete command from
the Edit menu. If the deleted node is connected to one or more elements, the action taken when the node
is deleted depends on the status of the options in the 2D Mesh Settings dialog.
If the Retriangulate voids when deleting option is turned on, the void created when a node and the
elements surrounding the node are deleted is re-triangulated or filled in with triangles. This feature
makes it possible to selectively "unrefine" a region of the mesh or reduce the density of the nodes in a
region of the mesh without having to completely recreate all of the elements in the region.
If the Retriangulate voids when deleting item in the Node Options dialog is not set, the selected node
and the elements surrounding the node are simply deleted and the resulting void is not filled in with
triangles.
If the Confirm Deletions option in the Edit menu is active, GMS will prompt the user to confirm each
deletion. This feature is helpful in preventing accidental deletions. The Confirm Deletions item is
toggled by selecting it from the menu.
Move Node
The coordinates of a 2D Mesh node can be edited by selecting the mesh node and entering the new
coordinates in the edit boxes in the Edit Window. It is also possible to drag an existing node to a new
location by clicking on the node and moving the mouse with the button held down until the node is in
the desired position.
If the Snap to Grid option in the Drawing Grid Options dialog is set, the node will move in increments
corresponding to the drawing grid. If the node being dragged is connected to one or more elements,
GMS will not allow the node to be dragged to a position where one of the surrounding elements would
become ill-formed.
Since it is possible to accidentally drag points, nodes can be "locked" to prevent them from being
dragged by selecting the Lock All Nodes item from the Mesh menu. The nodes can be unlocked by
unselecting Lock All Nodes from the Mesh menu.
141
Editing 2D Meshes
142
Editing Elements
Convert Between Linear and Quadratic
Linear elements (three node triangles and four node quadrilaterals) can be converted to quadratic
elements (six node triangles and eight node quadrilaterals) and vice versa by selecting the Convert
Elements item from the Mesh menu.
If there are both linear and quadratic elements in the mesh (as may be the case with a disjoint mesh), the
user is prompted to specify the type of conversion desired, linear to quadratic or quadratic to linear.
Merging Triangles
The triangulate operation creates a mesh composed entirely of triangles. In some cases it is desirable to
have the mesh composed primarily of quadrilateral elements. Quadrilateral elements result in a more
concise mesh which leads to faster solutions, and quadrilateral elements are often more stable
numerically. To address this need, two options are provided for converting triangular elements to
quadrilateral elements:
• The Merge Triangles Command - The Merge Triangles command in the Modify Mesh menu can be used
to automatically merge pairs of adjacent triangular elements into quadrilateral elements. Upon selecting the
Merge Triangles command, the user is prompted to input a minimum interior angle. This angle should be
between 0o and 90o. If no elements are selected, all of the triangular elements in the mesh are then
processed. If some elements have been selected, only the selected elements are processed. The conversion
process works as follows:
1. The set of elements to be processed is traversed one element at a time. Each triangular element that is found
is compared with each of its three adjacent elements. If the adjacent element is a triangle, the trapezoid
formed by the triangle and the adjacent triangle is checked.
2. Each of the four interior angles of the trapezoid is computed and compared to a minimum interior angle. If
all of the angles are greater than the user-specified minimum interior angle, then the two triangles are
merged into a single quadrilateral element.
This process is repeated for all of the elements. The merging scheme will not always result in a
mesh composed entirely of quadrilateral elements. Some triangular elements are often necessary
in highly irregular meshes to provide transitions from one region to the next.
• The Merge/Split Tool - The other option for merging triangles involves the use of the Merge/Split tool in
the 2D Mesh Tool Palette. This tool can be used to manually merge triangles one pair at a time rather than
using the automatic scheme described above.
The manual method is also useful to edit or override the results of the automatic merging scheme
in selected areas. The Merge/Split tool can also be used to undo a merge. A quadrilateral element
can be split into two triangles by clicking anywhere in the interior of the element. This tool is
useful if a pair of triangles is inadvertently merged.
Splitting Quadrilaterals
Occasionally it is necessary to split quadrilateral elements into triangular elements. For example, in
order for new nodes to be automatically inserted into a mesh, the elements in the region where the node
is inserted must be triangular. Also, in order to process a breakline, the elements in the region of the
breakline must be triangular. In such situations, it may be necessary to split a group of quadrilateral
elements into triangular elements. Two options are provided for splitting quadrilateral elements:
• The Split Quads Command - The Split Quads command in the Mesh menu can be used to split a group of
quadrilateral elements into triangular elements. If no elements are selected, all of the quadrilateral elements
in the mesh are split. If some elements have been selected, only the selected quadrilateral elements are split.
Editing 2D Meshes
143
• The Merge/Split Tool - The other option for splitting quadrilateral elements involves the use of the
Merge/Split tool in the 2D Mesh Tool Palette. If the Merge/Split tool is selected, clicking anywhere in the
interior of a quadrilateral element with the mouse cursor will cause the element to be split into two
triangles. The shortest diagonal through the quadrilateral is chosen as the common edge of the two new
triangular elements.
Refining Elements
In some cases, a mesh does not have enough elements in a particular region of the mesh to ensure
stability. Rather than inserting supplemental nodes and re-creating the mesh, it is possible to refine a
selected region of the mesh using the Refine Elements command in the Mesh menu. This increases the
mesh density of a selected area of the mesh. If no elements are selected, the entire mesh is refined. The
elevations of the new nodes are interpolated from the existing nodes.
Change Element Materials
Elements can have a material ID associated to it. The Materials command in the Edit menu brings up
the Material Editor dialog. The material ID associated with the element can be changed using the
Properties command in the Edit menu. (See Materials)
Boundary Triangles
The perimeter of the TIN resulting from the triangulation process corresponds to or approximates the
convex hull of the TIN vertices. This may result in some long thin triangles or "slivers" on the perimeter
of the triangulated region. There are several ways to deal with the long thin triangles. Thin triangles can
be selected and deleted using the normal selection procedures. There is also an option for selecting thin
triangles when the Select Triangles tool is selected. If the Control key is held down, it is possible to
drag a line with the mouse. All triangles intersecting the line are selected. Long thin triangles on the
perimeter of the TIN can also be selected by selecting the Select Boundary Triangles command from
the TINs menu. The Select Boundary Triangles command checks triangles on the outer boundary first.
If the length ratio of the triangle is less than the critical length ratio, the triangle is selected and the
triangles adjacent to the triangle are then checked. The process continues inward until none of the
adjacent triangles violate the minimum length ratio. The critical length ratio for selecting thin triangles
can be set by selecting the TINs | TIN Settings menu command. The length ratio is defined as the longest
side of the triangle divided by the sum of the two shorter sides.
Breaklines
A breakline is a feature line or polyline representing a
ridge or some other feature that the user wishes to preserve
in a mesh made up of triangular elements. In other words,
a breakline is a series of edges to which the triangles
should conform to, i.e., not intersect.
Breaklines can be processed using the Add Breaklines
command from the Mesh menu. Before selecting the
command, one or more sequences of nodes defining the
breakline(s) should be selected using the Select Node
Strings tool in the 2D Mesh Tool Palette.
Breaklines (a) Triangulated Mesh and Breakline.
(b) Triangulated Mesh After the Breakline has
been Processed.
As each breakline is processed, the triangles intersected by the breakline are modified by adding new
nodes at necessary locations to ensure that the edges of the triangles will conform to the breakline. The
elevations of the new nodes are based on a linear interpolation of the breakline segments. The locations
of the new nodes are determined in such a way that the Delauney criterion is satisfied.
2D Mesh Settings
2D Mesh Settings
New nodes in a 2D mesh are created by selecting the Create Nodes tool from the 2D Mesh Tool Palette and clicking
where the new node is to be located. The default parameters governing the creation of new nodes can be specified
using the 2DMesh Settings command in the Mesh menu. This brings up the Node Options dialog. The options in the
dialog are as follows:
Default Z
If the check box entitled Interpolate for default z on interior is selected when a new node is inserted in the interior of
the mesh, the element enclosing the node is linearly interpolated to get the Z value. If the node is on the exterior of
the mesh, the default z value is used. If the toggle is not selected, the default Z is used everywhere.
The options in the center of the dialog are used to specify whether to use a default Z value for all new nodes or to
have GMS prompt the user for the Z value every time a new node is created.
Insert Nodes into Triangulated Mesh
If the check box entitled Insert nodes into triangulated mesh is selected, any new node that lies in a region of the
mesh consisting of triangular elements will automatically be incorporated into the mesh. New nodes will not be
automatically incorporated into quadrilateral meshes.
Check for Coincident Nodes
If the check box entitled Check for coincident nodes is selected, any new node created using the Create Nodes tool
will be checked to see if it lies on top of an existing node.
144
2D Mesh Display Options
145
2D Mesh Display Options
The properties of all 2D mesh data that GMS displays on the screen can be controlled through the 2D Mesh tab of
the Display Options dialog. This dialog is opened by right clicking on the
2D Mesh Data entry in the Project
Explorer and selecting the Display Options command. It can also be accessed from the from the Display menu or the
Display Options macro. The following table describes the display options available for the 2D Mesh module.
Display
Option
Description
Nodes
The Nodes item is used to display mesh nodes. A small circle is drawn at each node.
Element
edges
The Elements item is used to display the edges of elements. The elements can be drawn using either the default color for elements
or using the color of the material associated with each element.
The color of the element edges can be adjusted according to the following options:
1. Auto - draws the material color if faces are not displayed. Uses black or white if the faces are displayed.
2. Specified - used the color specified next to the cell edges
3. Material - displays the material color of the cell
Element faces This option fills the elements with the material color.
Texture map
image
The Texture Map Image Item is used to "drape" an image over the surface of the 2D Mesh.
Mesh
boundary
The Mesh boundary item is used to display a solid line around the perimeter of the mesh. Displaying the boundary is useful when
contours are being displayed with the element edges turned off.
Node
numbers
The Node Numbers item is used to display the ID associated with each node next to the node.
Element
numbers
The Element numbers item is used to display the ID associated with each element at the centroid of the element.
Thin elements If the Thin elements item is set, triangular elements with small aspect ratios are highlighted. The minimum aspect ratio can be set
using the Aspect Ratio command in the Modify Mesh menu.
Scalar values
The Scalar Values item is used to display the scalar values of the active dataset for each node next to the node.
Contours
Most of the objects supported by GMS can be contoured by turning on the Contour Options in the Display Options dialog. When an
object is contoured, the values associated with the active data set for the object are used to generate the contours.
2D Mesh Tool Palette
146
2D Mesh Tool Palette
The following tools are contained in the dynamic portion of the Tool Palette when the 2D Mesh Module is active.
Only one tool is active at any given time. The action that takes place when the user clicks in the Graphics Window
depends on the current tool. The following table describes the tools in the 2D Mesh tool palette.
Tool
Tool Name
Description
Select Nodes
The Select Nodes tool is used to select a set of nodes for some subsequent operation such as deletion. The coordinates of
a selected node can be edited by dragging the node while this tool is active. The coordinates of selected nodes can also
be edited using the Edit Window. A node can also be selected by using the Find Node command in the Mesh menu. The
user is prompted for a node ID and the node is selected. Any previously selected nodes are unselected.
Select Elements
The Select Elements tool is used to select a set of elements for operations such as deletion or assigning a material type.
An element can also be selected by using the Find Element command in the Mesh menu. The user is prompted for an
element ID and the element is selected. Any previously selected elements are unselected.
Select Node
Strings
The Select Node Strings tool is used to select one or more strings of nodes. Node strings are used for operations such as
adding breaklines to the mesh.
The procedure for selecting node strings is somewhat different than the normal selection procedure. Strings are selected
as follows:
•
Click on the starting node for the string. The node selected will be highlighted in red.
•
Click on any subsequent nodes you would like to add to the string (nodes do not have to be adjacent). The selected
nodes are now connected by a solid red line.
To remove the last node from a string, press the Backspace key. To abort entering a node string, press the ESC key. To
end a node string, press Return or double-click on the last node in the string. Another node string can then be selected.
Create Nodes
The Create Nodes tool is used to manually add nodes to a mesh. When this tool is selected, clicking on a point within
the Graphics Window will place a node at that point. What happens to the node after it is added (whether and how it is
triangulated into the mesh) depends on the settings in the Node Options dialog in the Modify Mesh menu.
Create Linear
Triangle Element
Four types of elements are supported by the 2D Mesh module:
Create Quadratic
Triangle Element
Create Linear
Quadrilateral
Element
1.
2.
3.
4.
Three node triangles (linear triangles).
Six node triangles (quadratic triangles).
Four node quadrilaterals (linear quadrilaterals).
Eight node quadrilaterals (quadratic quadrilaterals).
Elements can be created using automatic meshing techniques such as triangulation. However, it is often necessary to
edit a mesh by creating elements one at a time using the four Create Element tools.
See the Creating an Element section below.
Create Quadratic
Quadrilateral
Element
Merge/Split
If the Merge/Split tool is selected, clicking on a triangle edge with the mouse cursor will cause the two triangular
elements adjacent to the edge to be merged into a quadrilateral element provided that the quadrilateral shape formed by
the two triangles is not concave.
The Merge/Split tool can also be used to undo a merge or to "unmerge" a quadrilateral element. A quadrilateral element
can be split into two triangles by clicking anywhere in the interior of the element. This tool is useful if a pair of triangles
are inadvertently merged.
Swap Edges
If the Swap Edges tool is selected, clicking on the common edge of two adjacent triangles will cause the edge to be
swapped as long as the quadrilateral shape formed by the two triangles is not concave.
Occasionally, it is useful to interactively or manually swap the edges of two adjacent triangles. This can be thought of as
a quick and simple alternative to adding breaklines to ensure that the edges of the triangular elements honor a
geometrical feature that needs to be preserved in the mesh.
2D Mesh Tool Palette
Contour Labels
147
The Contour Label tool is used to manually place numerical contour elevation labels at points clicked on with the
mouse. These labels remain on the screen until the contour options are changed, until they are deleted using the Contour
Labels dialog, or until the mesh is edited in any way. Contour labels can be deleted with this tool by holding down the
Shift key while clicking on the labels. This tool may only be used when the 2D mesh is in plan view.
Creating an Element
A single element can be constructed from a set of existing nodes using the following steps:
1. Select the tool corresponding to the type of element to be created.
2. Select the nodes corresponding to the corner nodes of the element in consecutive order around the perimeter of
the element. The nodes can be selected in either clockwise or counter-clockwise order. It is also possible to build
an element by dragging a rectangle to enclose the nodes making up the new element rather than selecting each
node one by one. A beep will sound if the wrong number of nodes for the current element type are selected.
If the current element type is a quadratic element (six or eight node element), the midside nodes of the element are
created automatically. If the new element is adjacent to an existing element, the midside node of the existing element
is used for the new element and a new midside node is not created, i.e. midside nodes are not duplicated.The
coordinates of midside nodes cannot be edited. Midside nodes are always assumed to be located at the midpoint of
the two adjacent corner nodes. When a corner node is edited, the coordinates of the adjacent midside nodes are
updated accordingly.
GMS performs several checks when a new element is constructed. The new element is checked to see whether or not
it is ill-formed (the element has a twist in it or is self intersecting). The element is also checked to see if it overlaps
any of the elements adjacent to the nodes comprising the new element. In addition, the elements adjacent to a new
element are checked to ensure that the elements are conforming, i.e. linear elements (three and four node elements)
are not allowed to be placed adjacent to quadratic elements (six and eight node elements). If any of the above checks
fail, the construction of the new element is aborted
Converting a 2D Mesh to other types of Data
148
Converting a 2D Mesh to other types of Data
2D Meshes may be converted to other types of data used in GMS, such as a TIN or 2D scatter points. 2D Meshes are
converted by using the following commands in the Grid menu:
Mesh -> 2D Scatter Points
The Mesh -> 2D Scatter Points command in the Build Mesh menu is used to create a new scatter point set using the
nodes in a mesh. A copy is made of each of the data sets associated with the mesh and the data sets are associated
with the new scatter point set.
Mesh -> TIN
A new TIN can be created from a 2D finite element mesh by selecting the Mesh -> TIN command from the Build
Mesh menu. A triangle is created from each triangular element in the mesh and two triangles are created from each
quadrilateral element in the mesh by splitting the quadrilateral element along the shortest diagonal.
Mesh -> 3D Tets
The Mesh->3D Tets command in the Mesh menu is used to convert a 2D mesh to a 3D mesh of tetrahedron.
This command brings up the Mesh->3D Tets dialog. At the top of the dialog the user selects two data sets that will
represent the Top elevation and the Bottom elevation of the 3D mesh. In general the top elevation data set should be
completely above the bottom elevation data set. The user also selects how the 3D mesh will be extruded. There are
two options: Constant number of layers and Layers distributed by depth. When using Constant number of layers,
the user simply enters the number of layers in the edit field. When using the Layers distributed by depth, the user
enters a maximum layer thickness for each material present in the 2D mesh in the spread sheet.
How it works
The user specifies a top and bottom elevation data set and the 3D mesh is extruded between the two data sets. This
process is illustrated in the figures below.
Two methods are available for determining the number of 3D mesh
nodes to place between the two surfaces: Constant number of layers
and Layers distributed by depth.
Two surfaces defining the top and bottom of the
3D mesh
• The first option is a constant number of layers. The figure above
was created by specifying 4 layers between the top and bottom
surface. In this case five 3D mesh nodes are created between the top
and bottom elevation data sets creating 4 layers.
• The second option uses the materials assigned to the 2D mesh. The
user then specifies a maximum layer thickness for each of the
materials. Then as the 3D mesh is extruded the number of nodes will vary depending on the material and the
distance between the top and bottom elevation. This is illustrated in the figures below. The first figure show a 2D
mesh with 3 materials assigned to it.
Converting a 2D Mesh to other types of Data
149
Tet mesh extruded between the top and bottom
data sets
A maximum layer thickness was assigned to each of the materials: red14.0 ft., blue- 10.0 ft., and green- 6.0 ft. The resulting 3D mesh is
shown below.
2D mesh with 3 materials
3D tet mesh created with materials and max layer
thickness
Element types
150
Element types
Element types used in XMS software. See also XMDF elements [1].
Element Type
Image
Faces
1D linear element with 2 nodes
1D linear element with 3 nodes
transition element
2D linear triangle
2D quadratic triangle
2D linear quadrilateral
2D quadratic quadrilateral
2D quadratic quadrilateral with center node
3D linear tetrahedron
FaceID Node Indices
1
2,3,4
2
1,4,3
3
1,2,4
4
1,3,2
Element types
151
3D linear prism
FaceID Node Indices
1
1,3,2
2
4,5,6
3
1,2,5,4
4
2,3,6,5
5
3,1,4,6
3D linear hexahedron
FaceID Node Indices
1
1,4,3,1
2
5,6,7,8
3
1,2,6,5
4
2,3,7,6
5
3,4,8,7
6
4,1,5,8
3D linear pyramid
FaceID Node Indices
References
[1] http:/ / www. aquaveo. com/ xmdf/ doc1. 6/ group__d4d8d2d. html
1
1,4,3,2
2
1,2,5
3
2,3,5
4
3,4,5
5
4,1,5
2D Mesh Polygon Attributes
2D Mesh Polygon Attributes
This dialog is used to set the attributes for feature polygons with a SEEP2D or FEMWATER coverage. Attributes
that can be specified for each polygon include:
Mesh Type
Set the meshing type to be used to fill the interior of the polygon. The options include (different options are given
according the coverage type):
None
This results in a hole in the finite element network (no elements are created inside the polygon).
Adaptive Tessellation
Adaptive tessellation is a mesh generation technique used to fill the interior of a polygon. A polygon is
assigned to be adaptive tessellation in the polygon attributes dialog and is filled with the Map to 2D Mesh
command.
Adaptive tessellation uses the existing spacing on the polygons
to determine the element sizes on the interior. Any interior arcs
and refine points are forced into the new mesh. If the input
polygon has varying node densities along its perimeter, GMS
attempts to create a smooth element size transition between these
areas of differing densities. By altering the size bias, the user can
indicate whether GMS should favor the creation of large or small
elements. Decreasing the bias will result in smaller elements;
Example mesh created using adaptive tessellation
increasing the bias will result in larger elements. In either case,
the elements in the interior of the mesh will honor the arc edges
and the element sizes specified at nodes. The bias simply controls the element sizes in the transition region.
Patch
Map Patches
Patching is a mesh generation technique used to fill the interior of a polygon. A polygon is assigned to
be a patch in the polygon attributes dialog and is filled with the Feature Objects | Map -> 2D Mesh
command.
The coordinates of the new nodes on the interior of the patch are computed by constructing a partial
bicubic Coons patch using the polygon as patch edges. This ensures that interior nodes are smoothly
interpolated from the nodes making up the perimeter of the patch. Patches are applicable when the data
points are gathered along parallel lines, such as cross sections in a river.
Rectangular Patches
The following are some hints when using rectangular patches:
The curvature of the patch can change somewhat, but it should not switch directions. If it does, then the
patch should be split at the inflection point of the curve.
Although opposite sides in the rectangular patch are not required to have the same number of nodes, the
best patches occur when this is close. In the example shown above, the two ends have the same number
of nodes and the two sides only differ by three nodes.
152
2D Mesh Polygon Attributes
153
Triangular Patches
All three sides of a triangular patch must have the same number of nodes.
Errors
When the patch is previewed in the polygon attributes dialog, the elements in a new patch are checked to
make sure they do not overlap each other. If any problems are detected, an error message is given and
the patch is not created. Errors may occur especially when the region is highly irregular in shape. In
such cases, the region can either be divided into smaller patches, or it can be filled using a different
mesh generation technique.
If a polygon cannot be patched, a help string under the preview window in the polygon attributes dialog
explains what needs to be changed.
Paving
With paving the polygon boundary is "paved" inward until the interior is filled. The mesh triangles created
from this method are aligned to the boundary.
Example of a mesh created using paving
Polygon Type/Material
Polygons can be assigned a Material type.
Graphical Tools
The Polygon Attributes dialog includes a preview window on the left side. This window shows the arcs and nodes of
the selected polygon and allows the user to interact with that definition. The Preview button generates the elements
that will be created for the polygon. It is recommended that the preview is used with the patch and adaptive
tessellation options only due to the time required performing density meshing. There are several tools for modifying
the existing polygon. Zooming, panning and framing work in the preview window just as they normally would in the
graphics window of GMS. They are used to facilitate the selection tools.
All entities are selected by clicking on the entity or by dragging a box to select several entities after selecting the
tool. The graphical tools are described in the following table.
2D Mesh Polygon Attributes
Tool
154
Tool Name
Description
Select Vertex
Select a vertex in the window (red point on arc). Drag the vertex to move it.
Create Vertex
Create a vertex by clicking on a red arc.
Select Point/Node Select a large blue or red node in the window.
Select Arc
Selects arcs in the preview window.
Arc Options
The options dealing with selected arc(s).
• Use original n nodes. Use the original vertices on the arc (before entering the dialog). If a vertex is moved,
deleted, or created using the above tools, clicking this option will not undo the vertex.
• Distribute n nodes. Specify the number of nodes and vertices to put on the arc (minimum of 2). The nodes are
evenly spaced if the Bias is 1.0. A Bias of 2.0 will space the nodes more densely to one side; the last space will be
twice as big as the first space. A Bias of 0.5 swaps this; the first space is twice as big as the last.
Node Options
The options dealing with selected node(s). These options are used for
patches. Patches require 3 or 4 edges. An edge is an arc segment from one
blue point to another blue point.
• Split. Split two merged arcs. This turns the node blue.
• Merge. Merge two arcs. This turns the node red.
• Degenerate Edge. This works with 4-sided patches. The degenerate
node is treated as an edge, as shown in the figure below.
Example of the node options
155
5.5. 2D Grid Module
2D Grid Module
The 2D Grid module is used for creating and editing two-dimensional Cartesian grids. 2D grids are primarily used
for surface visualization and contouring. This is accomplished by interpolating to the grid. The figure below is an
example of interpolating contaminant concentration data to a 2D grid.
Concentration Data Interpolated to a 2D Grid
Watertable Elevations From a MODFLOW
Simulation
2D Grid Types
2D Grid Types
Two types of grids are supported in the 2D Grid module:
mesh-centered grids and cell-centered grids. With a mesh-centered
grid, the data values are stored at the corners of the grid cells. With a
cell-centered grid, data values are stored at the cell centers.
When a data set is imported to a cell-centered grid, there is one value
in the data set for each cell. The contouring and fringing functions use
scalar values at the cell corners. Therefore, whenever contouring or
Types of 2D Grids Supported in GMS. (a)
fringing is performed, the values at the cell centers are interpolated to
Mesh-Centered Grid (b) Cell-Centered Grid.
the cell corners. Interpolation to cell corners is only done for
visualization purposes. All computations performed using the data
calculator are performed on the original values at the cell centers. With mesh-centered grids, all visualization and
computations are performed at the cell corners and no interpolation is necessary.
Grids in GMS are Cartesian grids. That is, the row and column spacing in the grid can vary, but the row and column
boundaries are straight. Each cell center or grid node can have a unique elevation. The grid can also be rotated about
the Z axis if desired.
Creating and Editing 2D Grids
Creating 2D Grids
Two types of 2D grids are supportted by GMS, mesh centered and cell centered. The two main techniques used to
create 2D grids are: the Create Grid command and the Map -> 2D Grid command. A 2D grid can also be created
from an existing 3D grid using the Grid -> 2D Grid command in the Grid menu of the 3D Grid Module. A GIS grid
may also be imported.
Create Grid
A new grid can be created by selecting the Create Grid command from the Grid menu. This command brings
up the Create Grid dialog. The options in the dialog are as follows:
Origin, Length, Rotation - By default, the rows and columns of 2D grids are aligned with the x and y axes.
However, grids can be rotated about the z-axis, if desired. Thus, the information needed to determine the
overall size and location of the grid is the xy coordinates of the lower left corner of the grid (the lower left
corner prior to rotation), the length of the grid in the x and y directions, and the rotation angle. The xy
coordinates of the origin are entered in the Origin edit fields, the dimensions are entered in the Length fields,
and the angle of rotation is entered in the field entitled Rotation about Z-axis.
Bias - Several options are available for defining the number and locations of the cell boundaries. A bias can be
defined which controls how the cell size varies from one cell to the next. For example, an X bias of 1.5 causes
each cell to be 50% larger than the previous cell when moving in the positive x direction.
Number of Cells - The total number of cells in each direction (number of rows or columns) can be defined by
explicitly entering a number or by entering a base cell size and a limit cell size. The base and limit cell size
options are used when a bias other than 1.0 is specified. The base cell size is the size of the first cell in the
sequence. The cells are then generated by altering the cell size according to the bias until the limit cell size is
reached. The remainder of the cells are constructed using the limit cell size.
156
Creating and Editing 2D Grids
Type and Orientation - The controls at the bottom of the Create Grid dialog are used to define the type and
orientation of the grid. The user can specify whether the grid should be a mesh-centered grid or a cell-centered
grid. The orientation of the ij axes with respect to the XY axes can also be specified.
Map -> 2D Grid
The Map -> 2D Grid command is used to construct a 2D grid using the feature objects in a 2D Grid Coverage.
When the Map -> 2D Grid command is selected, the Create Grid dialog appears. If a grid frame has been
defined, the size and location of the grid frame are used to initialize the fields in the Create Grid dialog. In
most cases, these values will not need to be changed and the user can simply select the OK button to create the
grid. If a grid frame has not been defined, the size and location of the grid are initialized so that the grid just
surrounds the currently defined feature objects. If desired, the grid dimensions can be edited prior to selecting
the OK button to create the grid.
If one or more refine points are defined in the conceptual model, the number of rows and columns in the grid
will be automatically determined when the grid is created. Thus, these fields cannot be edited by the user and
will be dimmed. If refine points are not defined, the user must enter the number of rows and columns.
Editing 2D Grids
Each of the cells in a 2D grid can be active or inactive. An inactive cell is ignored when contours, fringes, or vectors
are displayed on the mesh.
Each cell in the grid has an associated material type. When a new grid is created, the material type for each cell
corresponds to the default material type. The default material type can be set using the Materials Editor command in
the Edit menu. A new material can be assigned to a cell or a set of cells by selecting the cell(s) and then selecting the
Properties command from the Edit menu.
Rows and columns can be added to an existing 2D grid by using the Add i Boundary tool and the Add j Boundary
tool. Also, the interface between a row and a column can be moved by using the Move Boundary tool. (See 2D Grid
Tool Palette)
157
2D Grid Display Options
158
2D Grid Display Options
The properties of all 2D Grid data that GMS displays on the screen can be controlled through the 2D Grid tab of the
Display Options dialog. This dialog is opened by right clicking on the
2D Grid Data entry in the Project Explorer
and selecting the Display Options command. It can also be accessed from the from the Display menu or the
Display Options macro. The following table describes the display options available for the 2D Grid module.
Display
Option
Description
Nodes
The Nodes item is used to display grid nodes depending on the Grid Type . If the grid is cell-centered, a dot is displayed at the cell
centers. If the grid is mesh-centered, a dot is displayed on the cell corners.
Cell edges
The Cell edges item is used to display the edges of grid cells. The cells are either drawn using the default cell color or the color of
the material associated with each cell.
In addition to turning the display of cells on or off, you can temporarily hide grid cells.
The color of the cell edges can be adjusted according to the following options:
1. Auto - draws the material color if faces are not displayed. Uses black or white if the faces are displayed.
2. Specified - used the color specified next to the cell edges
3. Material - displays the material color of the cell
Cell faces
The Cell faces item causes the faces of the grid cells to be drawn as filled polygons.
Inactive cells
The Inactive cells item is used to display cells which are inactive. If this option is turned off, inactive cells are not displayed.
Inactive cells must be displayed before they can be selected.
Grid
boundary
The Grid boundary item is used to display a solid line around the perimeter of the grid. Displaying the boundary is useful when
contours are being displayed with the cell edges turned off.
Cell numbers
The Cell Numbers item is used to display the ID of each grid cell.
Node
numbers
The Node Numbers item is used to display the ID of each grid node.
Scalar values
The Scalar Values item is used to display the scalar values of the active dataset for each node next to the node.
IJ indices
The IJ indices item is used to display the ij indices of each cell or node.
IJ triad
The IJ triad item is used to display a symbol at one of the corners of the grid showing the orientation of the ij axes.
Texture map
image
The Texture map image item is used to "drape" an image over the surface of the 2D Grid.
Contours
Most of the objects supported by GMS can be contoured by turning on the Contour Options in the Display Options dialog. When an
object is contoured, the values associated with the active data set for the object are used to generate the contours.
Vectors
If the Vectors item in the Display Options dialog is selected for an object (TIN, Grid, or Mesh), vector plots can be generated using
the active vector data set for the object. One vector is placed at each node, cell, or vertex.
2D Grid Tool Palette
159
2D Grid Tool Palette
The following tools are contained in the dynamic portion of the Tool Palette when the 2D Grid Module is active.
Only one tool is active at any given time. The action that takes place when the user clicks in the Graphics Window
depends on the current tool. The following table describes the tools in the 2D Grid tool palette.
Tool
Tool
Name
Description
Select Cell The Select Cell tool is used to select individual grid cells or grid nodes. Multi-selection can be performed by holding down the
SHIFT key while selecting or by dragging a rectangle to enclose the cells to be selected. The ij indices of the selected cell are
displayed in the Edit Window.
Only visible cells can be selected. Cells which have been hidden cannot be selected. Inactive cells can only be selected when
they are being displayed by turning on the Inactive Cells item in the Display Options dialog.
To select specific cell based on the ij of the cell or by cell ID you can use the Find Cell command in the Grid menu. The Find
Grid Cell dialog provides edit fields for both an ID or an IJ value. Entering a value for ID will automatically update the IJ fields.
Likewise, entering a value for the IJ location will automatically update the ID. When the OK button is selected, the indicated
cell will be selected in the grid.
In addition to selecting one cell at a time, the Find Grid Cell Dialog can select an entire row column or layer. A zero may be
entered in either of the I or J fields indicating that all cells in that direction will be selected. The ID of the cells that will be
selected is also displayed as static text at the top of the dialog.
Select i
The Select i tool is used to select an entire "row" (set of cells with the same i index) of cells at once. Multi-selection can be
performed by holding down the SHIFT key. The i index of the selected row is displayed in the Edit Window.
Select j
The Select j tool is used to select an entire "column" (set of cells with the same j index) of cells at once. Multi-selection can be
performed by holding down the SHIFT key. The j index of the selected column is displayed in the Edit Window.
Select
Node
The Select Node tool is used to select nodes and interactively edit cell boundary coordinates by clicking on the intersection of
two cell boundaries and dragging the boundaries with the mouse button held down. The coordinates of the cell boundary
intersection are displayed in the Edit Window as the boundaries are dragged. If the current view is not the plan view, the
dragging movement is constrained to follow the Z axis. The coordinates of a selected boundary intersection can also be edited
by directly entering the coordinates in the Edit Window.
Add i
Boundary
The Add i Boundary tool is used to insert a new i boundary into the grid. The new boundary is inserted at the cursor location
when the mouse button is clicked. Inserting a new cell boundary changes the dimensions of the grid and all data sets associated
with the grid are deleted. If the control key is held down while executing this command, the row will be evenly divided.
Add j
Boundary
The Add j Boundary tool is used to insert a new j boundary into the grid. The new boundary is inserted at the cursor location
when the mouse button is clicked. Inserting a new cell boundary changes the dimensions of the grid and all data sets associated
with the grid are deleted. If the control key is held down while executing this command, the column will be evenly divided.
Contour
Labels
The Contour Label tool manually places numerical contour elevation labels at points clicked on with the mouse. These labels
remain on the screen until the contour options are changed, until they are deleted using the Contour Labels dialog, or until the
grid is edited in any way. Contour labels can be deleted with this tool by holding down the SHIFT key while clicking on the
labels. This tool can only be used in plan view.
Converting 2D Grids
Converting 2D Grids
2D Grids may be converted to other types of data used in GMS, such as a TIN, 2D mesh, or 2D scatter points. 2D
Grids can be converted by using the following commands in the Grid menu:
Grid -> 2D Scatter Points
The Grid -> 2D Scatter Points command in the Grid menu is used to create a new scatter point set using the
nodes or cells of a 2D grid. A copy is made of each of the data sets associated with the grid and the data sets
are associated with the new scatter point set.
Grid -> TIN
A new TIN can be created from a 2D grid by selecting the Grid -> TIN command from the Grid menu. Two
triangles are created from each cell in the grid.
Grid -> 2D Mesh
A new 2D finite element mesh can be created from a 2D grid by selecting the Grid -> 2D Mesh command
from the Grid menu. A four node quadrilateral element is created from each cell in the grid.
160
161
5.6. 2D Scatter Point Module
2D Scatter Point Module
The 2D Scatter Point module is used to interpolate from groups of 2D scattered data to other objects (meshes, grids,
TINs). Several interpolation schemes are supported, including kriging.
Interpolation is useful for setting up input data for analysis codes and for site characterization. The two figures below
show examples of using interpolation.
Interpolation of Modflow Layer Elevations to a
3D Grid
Sample Interpolation for Site Characterization
Once a scatter point is created or imported, it can be saved as part of the current project using the Save command in
the File menu. When scatter point data are saved, the scatter point locations (xy coordinates) are saved to a Scatter
Point file and the data sets are saved to a Data Set file.
Creating and Editing 2D Scatter Point Sets
Creating and Editing 2D Scatter Point Sets
Each of the points from which values are interpolated are called scatter points. A group of scatter points is called a
scatter point set. Each of the scatter points is defined by a set of xy coordinates.
Each scatter point set has a list of scalar data sets. Each data set represents a set of values which can be interpolated
to a TIN, mesh, or grid.
Multiple scatter point sets can exist at one time in memory. One of the scatter point sets is always designated as the
"active" scatter point set. Interpolation is performed from the active data set of the active scatter point set only.
Creating Scatter Points
Scatter point sets can be created in one of three ways: interactively creating scatter points, converting from other data
types, or importing from a file.
Interactively Creating Scatter Points
The Create scatter point tool is used to click out new scatter points in the GMS Graphics Window. The new scatter
points are added to the active scatter point set. If you want the new points in their own scatter point set then select
the Scatter Points | New Scatter Point Set command.
Converting from Other Types
Scatter point sets are often created by converting from other data types (TINs, meshes, grids, boreholes). The
following commands are available to convert an object to a Scatter Point Set:
• TIN -> 2D Scatter_Points
• Contacts -> 2D Scatter Points
• Watertable -> 2D Scatter Points
• Grid -> 2D Scatter Points
• Mesh -> 2D Scatter_Points
• Map -> 2D Scatter Points
• Modflow Layers -> 2D Scatter_Points
Importing Tabular Scatter Point Data
In most cases, scatter point sets are created by importing a text file through the Text Import Wizard.
Editing Scatter Points
The location of a scatter point can be edited by selecting the scatter point and dragging it to a new location or by
typing in the new coordinates in the Edit Window.
The data set value associated with a scatter point can be edited using the edit field labeled "F:" in the Edit Window.
Data set values can also be edited using a spreadsheet dialog by selecting the Edit Values button in the Data Set Info
dialog.
In addition to the data set values, each scatter point has three properties that can be edited on a point by point basis:
• label
• material
• activity
162
Creating and Editing 2D Scatter Point Sets
163
• Fixed pilot point
The label is a text string that can be displayed by turning on the ID option in the Display Options dialog. The
material type is used for indicator simulations.
The fixed pilot point property is used with PEST(See Automated Parameter Estimation). If this option is on, then the
value at this point is not estimated during the parameter estimation process.
The scatter point properties can be edited by double-clicking on a point or by selecting a set of points and selecting
the Properties command in the Edit menu.
Editing Scatter Points
Individual scatter points can also be deleted. This command results in the removal of the point from all the datasets
associated to the scatter point set.
2D Scatter Point Display Options
The properties of all 2D scatter data that GMS displays on the screen can be controlled through the 2D Scatter tab of
the Display Options dialog. This dialog is opened by right clicking on the
2D Scatter Data entry in the Project
Explorer and selecting the Display Options command. It can also be accessed from the from the Display menu or the
Display Options macro. The following table describes the display options available for the 2D Scatter Point
module.
Display
Option
Description
Active scatter
point set
The name of the active scatter point set is listed at the top of the dialog. The symbol selected using the Scatter point symbols
option (described below) applies to the active scatter point set. This makes it possible to use a different set of symbols for the
points in each set so that the sets are easily distinguishable.
Scatter point
symbols
The Scatter point symbols item is used to display a symbol at the location of each scatter point. The widget to the left of the toggle
is used to bring up a dialog listing the available symbols. The color of each of the scatter points in a set may be changed in this
dialog also.
The color of the scatter points can be adjusted according to the following options:
1. Specified - uses the color specified next to the scatter point symbols
2. Data - the color ramp is used to assign a color to each of the symbols according to the value of the active scalar data set
Inactive scatter Individual scatter points can either be active or inactive. The Inactive scatter points option can be used to control the display of the
points
inactive points.
Scatter point
scalar values
The Scatter point scalar values option is used to display the value of the active data set next to each of the scatter points.
Scatter point
labels
The Scatter point labels item is used to display the scatter point label next to each scatter point.
Scatter point
numbers
The Scatter point IDs item is used to display the scatter point ID next to each scatter point.
Symbol legend The Symbol legend item is used to display a symbol legend listing each of the scatter point sets by name and showing the symbol
associated with the scatter point sets.
2D Scatter Point Tool Palette
164
2D Scatter Point Tool Palette
The following tools are active in the dynamic portion of the Tool Palette whenever the 2D Scatter Point Module is
active. Only one tool is active at any given time. The action that takes place when the user clicks in the Graphics
Window with the cursor depends on the current tool. The table below describes the tools in the 2D Scatter Set tool
palette.
Tool
Tool
Name
Description
Select
Scatter
Point
The Select Scatter Point tool is used to select individual scatter points for editing using the Edit Window. Scatter points can also
be dragged with the mouse. Scatter points can be deleted. With extremely large sets of scatter points, it may become difficult to
identify a scatter point with a particular ID, even if the scatter point IDs are being displayed. In such cases, the Find Point
command in the Scatter Points menu can be used to quickly locate a point. The command prompts the user for the ID of the
desired point and the point is selected.
Select
Scatter
Point Set
The Select Scatter Point Set tool is used to select entire scatter point sets for deletion or to designate the active scatter point set.
When this tool is active, an icon appears at the centroid of the set for each of the scatter point sets. A scatter point set is selected
by selecting the icon for the set.
Create
Scatter
Point
This tool is used to interactively create scatter points by clicking in the GMS graphics window.
Interpolating with 2D Scatter Points
Scatter point sets are used for interpolation to other data types such as TINs, grids, and meshes. A 2D grid can be
created which will just enclose the scatter points by using the Bounding Grid command in the Scatter Points menu.
Interpolation is useful for such tasks as contouring or setting up input data to a model. Since no interpolation scheme
is superior in all cases, several interpolation techniques are provided in GMS.
The basic approach to performing an interpolation is to select an appropriate interpolation scheme and interpolation
parameters, and then interpolate to the desired object using one of the 2D interpolation commands.
The interpolation options are selected using the Interpolation Options dialog accessed through the Interp. Options
command in the Interpolation menu. Once a set of options is selected, those options are used for all subsequent
interpolation commands.
Converting 2D Scatter Points to Other Types of Data
Converting 2D Scatter Points to Other Types of
Data
2D Scatter Points may be converted to other types of data used in GMS, such as a TIN, 2D Mesh Nodes, or
Observation Points. 2D Scatter Points are converted by using the following commands in the Scatter Points menu:
• Scatter Points -> TIN
The Scatter Points -> TIN command creates a set of TIN vertices. These vertices are automatically triangulated
to form a TIN.
• Scatter Points -> Mesh Nodes
The Scatter Points -> Mesh Nodes command creates a set of 2D finite element nodes from the points in the
active scatter point set.
• Scatter Points -> Obs. Pts.
The Scatter Points -> Obs. Pts command creates one observation point for each of the scatter points in the
active scatter point set. The active data set values become the measured values for the observation points. You
must create a coverage with a measurement before executing this command.
• Scatter Points -> 3D Scatter Points
The Scatter Points -> 3D Scatter Points command creates a 3D scatter point set from the 2D scatter points. All
of the data sets are copied to the 3D scatter points. The Z (elevation) of the 3D scatter points is set to the Z of
the 2D scatter points at the time of conversion.
Gaussian Field Generator
GMS includes an interpolation option associated with the 2D scatter point module called Gaussian Sequential
Simulation (GSS). This option is used to generate a set of scalar data sets (Gaussian fields) using a Gaussian
sequential simulation. This is somewhat similar to indicator kriging or T-PROGS in that it generates a set of equally
probable results which exhibit heterogeneity and are conditioned to values at scatter points. However, the resulting
arrays are floating point scalar data sets, rather than the integer arrays produced by T-PROGS and indicator kriging.
The results of a GSS can be used in combination with the new Multiplier Array option for parameters. It is now
possible to associate one or more scalar data sets with an array-based parameter. When MODFLOW is executed, the
parameter starting value is multiplied by the data set to produce the input array. This makes it possible to use the
results of the Gaussian sequential simulation as input for parameter fields for a stochastic (Monte Carlo) simulation.
Gaussian Simulations
The new GSS tool is based on the FIELDGEN code developed by John Doherty. John Doherty describes GSS as
follows:
The process of stochastic field generation by sequential simulation is very easy to understand. At each field point an
expected field value and a field standard deviation pertaining to that point are first determined. These are calculated
through kriging from points to which field values have already been assigned, as well as from points at which
conditioning data exists (if available). Using the expected value and standard deviation calculated in this way, a
random field value is generated based on the assumption of a Gaussian probability distribution. The field value thus
obtained can then be used in generating expected values and standard deviations at other field points at which field
generation then takes place in the same way.
165
Gaussian Field Generator
GSS is a form of Kriging but it is listed in the GMS interface as a new interpolation scheme. This new option will
differ from Kriging in the following ways:
1. GSS uses the FIELDGEN utility developed by John Doherty to perform the interpolation rather than the GSLIB
code used by kriging. FIELDGEN is a modified version of the sgsim utility in GSLIB so many of the options are
quite similar to those used for normal kriging.
2. As is the case with T-PROGS, the user enters the number of desired simulations and FIELDGEN produces N
arrays, rather than one array.
3. It can only be used for 2D interpolation and it will only work when interpolating to 3D cell-centered grids.
4. It can work with or without a scatter point set. If a scatter point set is provided, the resulting fields are
conditioned to the values at the scatter points. Otherwise the user defines a mean and a variogram and the values
are randomly generated.
Gaussian Simulation Options
The first step in setting up a GSS is to import a set of scatter points with the values to which you intend to condition
your simulation. This step can be skipped if you have no conditioning data. The next step is to select the Gaussian
Simulation Options command in the Interpolation menu in the 2D Scatter Point module. This brings up the
following dialog:
The Solution name at the top is the name that will be applied to the set of Gaussian fields. The Number of
realizations item is the desired number of Gaussian fields. The original GSLIB code was designed to work with
uniform grids (constant cell sizes). The Non-uniform grid option controls how the data are converted to a
non-uniform grid (if necessary). The Edit Variogram button should be selected to set up a model variogram using
the GMS variogram editor. A model variogram must be defined whether or not you have scatter points for
conditioning.
166
Gaussian Field Generator
Running the Simulation
Once the GSS options are selected, the next step is to run the simulation. This is accomplished by selecting the Run
Gaussian Simulation command in the Interpolation menu. During the simulation, you should see a window
displaying the progress of the simulation:
Viewing the Results
Once the simulation is finished, you should see a new folder appear in the Project Explorer window which has the
name of the simulation and contains a set of data set arrays:
Clicking on each data set icon makes it the active data set for contouring. The data set properties can be viewed by
double-clicking on the icon. The following image represents a sample Gaussian realization:
167
Gaussian Field Generator
Active/Inactive Points
Each scatter point has an active/inactive status. A scatter point with an inactive status can be displayed, but the data
set value at the point is ignored when interpolation takes place. As a result, interpolation proceeds as if the point did
not exist.
The active/inactive flags for scatter points are particularly useful when dealing with transient data. For example,
suppose that a set of scatter points represents TCE concentrations measured at a series of observation wells over a
year's time. The locations of the wells and the measured concentrations can be imported to GMS as a scatter point set
with a transient data set. Once they are imported, the transient data set can be interpolated to a grid and a film loop
showing color shaded contours can be generated to illustrate how the plume has changed with time. However, in
preparing the data for import, it is discovered that some of the data values are missing. One approach is to make up a
dummy value for the missing sample and enter the entire data set anyway. The problem with this approach is that it
is difficult to determine an appropriate dummy value. Another option is to enter this value as a "non-detect". This
causes the point to become inactive for the time step where the sample is missing. GMS disregards the point for that
time step and performs the interpolation using the remaining active points.
Active/inactive flags are stored with data sets. If the active data set is changed, the active/inactive flags will be
reassigned based on the flags in the new active data set. Not all data sets contain active/inactive flags. If a data set
does not contain flags, all points are assumed to be active.
The following methods can be used for controlling or assigning the active/inactive status of points:
168
Active/Inactive Points
Tabular Scatter Point Input
If the scatter points are imported using the Text Import Wizard then a special data value can be designated as
NONDETECT. This value is typically assigned to a number not likely to be encountered such as -999. Then, as the
data set columns are being read, any value with the NONDETECT value is assumed to be inactive and the status flag
is set accordingly.
Active/Inactive Flags Dialog
After a scatter point set has been imported to GMS, the active/inactive status flags for the active data set can be
edited by selecting the Edit Inactive Flags button in the Data Set Info dialog accessed from the Data Set Properties
dialog (this dialog is accessed from the Project Explorer). This brings up the Active/Inactive Flags dialog. This
dialog is used to either delete all of the current active/inactive flags (making all points active), or enter one or more
key values (ex., -999) which are used to inactivate all points with the listed values.
2D Interpolation Options
The interpolation options are selected using the Interpolation Options dialog accessed through the Interp. Options
command in the Interpolation menu. Once a set of options is selected, those options are used for all subsequent
interpolation commands. The items in the 2D Interpolation Options dialog are as follows:
Active Data Set
Interpolation is always performed using the active data set of the active scatter point set. The active data set is
normally selected in the Project Explorer. The name of the current active data set is listed at the top of the 2D
Interpolation Options dialog. The active data set can not be changed with this dialog.
If the active data set is transient then more interpolation options are available. (see Steady State vs. Transient
Interpolation)
Interpolation Method
The following 2D interpolation methods are supported by GMS:
• Linear
• Inverse Distance Weighted
• Clough-Tocher
• Natural Neighbor
• Kriging
Log Interpolation
When interpolating chemical data, it is not uncommon to have a small "hot spot" somewhere in the interior of the
data where the measured concentrations are many orders of magnitude higher than the majority of the other
concentrations. In such cases, the large values dominate the interpolation process and details and variations in the
low concentration zones are obliterated. One approach to dealing with such situations is to use log interpolation. If
this option is selected, GMS takes the log of each data value in the active scatter point set prior to performing
interpolation. By interpolating the log of the data set, small values are given more weight than otherwise. Once the
interpolation is finished, GMS takes the anti-log (10x) of the interpolated data set values before assigning the data set
to the target grid or mesh.
169
2D Interpolation Options
Note that it is impossible to take the log of a zero or negative value. When the log interpolation option is turned on, a
value must be entered by the user to assign to scatter points where the current data value is less than or equal to zero.
Typically, a small positive number should be used.
Anisotropy
Sometimes the data associated with a scatter point set will have directional tendencies. The azimuth and horizontal
anisotropy allow the user to take into account these tendencies.
Extrapolation
Although they are referred to as interpolation schemes, most of the schemes supported by GMS perform both
interpolation and extrapolation. That is, they can estimate a value at points both inside and outside the convex hull of
the scatter point set. Obviously, the interpolated values are more accurate than the extrapolated values. Nevertheless,
it is often necessary to perform extrapolation. Some of the schemes, however, perform interpolation but cannot be
used for extrapolation. These schemes include Linear and Clough-Tocher interpolation. Both of these schemes only
interpolate within the convex hull of the scatter points. Interpolation points outside the convex hull are assigned the
Default extrapolation value.
Truncation
When interpolating a set of values, it is sometimes useful to limit the interpolated values to lie between a minimum
and maximum value. For example, when interpolating contaminant concentrations, a negative value of concentration
is meaningless. However, many interpolation schemes will produce negative values even if all of the scatter points
have positive data values. This occurs in areas where the trend in the data is toward a zero value. The interpolation
may extend the trend beyond a zero value into the negative range. In such cases it is useful to limit the minimum
interpolated value to zero. Interpolated values can be limited to a given range by selecting the Truncate values option
in the Interpolation Options dialog. The range can be user-defined or automatically set to the maximum and
minimum values of the data set being interpolated.
170
171
5.7. 3D Mesh Module
3D Mesh Module
The 3D Mesh module is used to create and edit 3D finite element meshes. Once a mesh is constructed, the
FEMWATER interface can be used to assign boundary conditions and analysis parameters and perform a
FEMWATER analysis.
Iso-surface of Pressure Head from a FEMWATER Simulation
3D Element Types
Four types of 3D elements are supported by GMS: eight node hexahedra, six node prisms or wedges, four node
tetrahedra, and five node pyramids. Hexahedra and wedges are created by projecting a 2D mesh. Tetrahedral
elements are constructed with the Tessellate command or they can be created elsewhere and imported into GMS.
Types of 3D Elements Supported by GMS
Creating a 3D Mesh
Creating a 3D Mesh
In order to create a 3D Mesh in GMS you must have a set of 3D Mesh nodes. Elements can be created by using one
of the create element tools and then selecting the mesh nodes to create elements. Duplicate points can be removed by
selecting Find Duplicates command from the Mesh menu. If a node is found that is within a user specified tolerance
of another node, the node is either selected or deleted.
3D Meshes can be created 2 different ways in GMS: converting a different GMS data type to a 3D Mesh and using
an automatic meshing technique.
Converting GMS data to a 3D Mesh
3D Grids and 3D Scatter Points can be converted to a 3D Mesh. This is accomplished by using the following
commands:
Grid -> 3D Mesh
A 3D grid can be converted into a 3D mesh. If the 3D grid is a mesh-centered grid, the grid nodes are simply
converted into a mesh nodes. If the 3D grid is a cell-centered grid, a mesh node is placed at the centroid of each cell
to form the 3D mesh. An eight node quadrilateral element is created from each cell in the grid.
Scatter Points -> Mesh Nodes
The Scatter Points -> Mesh Nodes command is used to convert each of the scatter points to a 3D mesh node. The
nodes can then be used to generate a mesh using the Tessellate command in the Mesh menu in the 3D Mesh module.
Automated Meshing
3D finite element meshes are not always constructed within the 3D Mesh module. The following methods are
available for the construction of 3D Meshes:
Fill Between TINs -> 3D Mesh
3D meshes are often constructed using a combination of tools in the
TIN module and the 2D Mesh module. Portions of the mesh
corresponding to "zones" or stratigraphic units are constructed one at a
time as shown below. Each of these zones is bounded above and below
by a surface and consists of one or more layers of 3D elements.
Before constructing a zone of elements, a 2D mesh must be created or
imported using the 2D Mesh Module. A pair of TINs must also be
created which represent the top and the bottom of the zone. These TINs
3D Mesh With Multiple Zones
are typically constructed from borehole data or from scatter points. The
zone is then created by selecting the two TINs and selecting the Fill Between TINs -> 3D Mesh command in the
TINs menu. At this point, the user is prompted to enter the number of layers of elements to be created between the
TINs and the material that will be associated with the elements in the zone. Each of the elements in the 2D mesh is
then "projected" through the two TINs to create a vertical column of 3D elements as shown below. For example, if N
layers are specified, N 3D wedge elements are created from each of the triangular elements in the 2D mesh, and N
3D hexahedral elements are created from each of the quadrilateral elements in the 2D mesh. The Z coordinates of the
nodes created for the 3D elements are distributed uniformly between the top and the bottom TINs.
172
Creating a 3D Mesh
Projection Technique for Creating 3D Meshes
173
This process is repeated for each of the zones in the mesh. In order for
the nodes at the bottom of one zone to match the nodes at the top of
another zone, the same TIN should be used at the bottom of the upper
zone and at the top of the lower zone. If the vertices of the TIN are
edited in any way after one layer is generated but before an adjacent
layer is generated, a gap may be introduced between the two zones of
3D elements.
Classify Elements
One way to model features such as a clay seam is to create all of the layers in the mesh and then change the material type of selected
elements. The Classify Elements command in the Mesh menu can be used to accomplish the same task using solid models of the soil
stratigraphy. Using this command, a solid model can be constructed and used to change the material type of a set of elements corresponding
to a complicated geometric feature. When the Classify Elements command is selected, the centroid of each element in the 3D mesh is
computed and the centroid is checked with each of the solid models to determine which solid the centroid lies within. The material type of
the element is then changed to correspond to the material type of the solid containing the element centroid. If the centroid of an element
does not lie in the interior of any of the solids, the material type of the element is unaltered.
The advantage of this construction procedure for 3D meshes is that it is
simple and it is fast. The disadvantage of the procedure is that
truncations or pinchout zones in the stratigraphy are not directly
modeled. However, such features can be simulated by selecting
elements and changing the material type associated with the elements
once a zone of elements has been created. For example, suppose an
aquifer contains a clay lens that extends partially into the aquifer as
shown in part a of the figure below. A zone of elements could be
created for the clay layer which extends over the entire XY range of
the model (part b). The elements in this set of clay elements that are
not in the region actually occupied by the clay layer could be selected
and assigned the material type of the aquifer (part c). This can also be
accomplished with a Solid Model and the Classify Elements
command.
Modeling a Clay Seam Using Zones of Elements
Creating 3D Meshes From Solid Models
Unlike the Solids -> MODFLOW Boundary Matching option, it is not necessary to create a 3D mesh before
selecting the Solids -> Layered Mesh command. The 3D mesh is automatically generated. Each element in the 2D
projection mesh is extruded into a vertical column of cells and the solids are used to assign the elevations to the
nodes. The material ids are assigned to the 3D elements by finding the solid that encompasses the centroid of each
3D element assigning the material id of that solid to the element.
Creating 3D Meshes From Mesh Nodes
A mesh can be automatically constructed from a set of 3D nodes with the Tessellate command in the Mesh menu of
the 3D Mesh module. This command performs the three-dimensional equivalent of the Delauney triangulation
process. The Tesselation algorithm assumes that each of the vertices being tesselated is unique in xyz, i.e., no two
points have the same xyz location. The result is a mesh composed entirely of tetrahedra. The region that is meshed
corresponds to the convex hull of the nodes.
Editing a 3D Mesh
Editing a 3D Mesh
3D mesh nodes can be:
• Moved - The coordinates of a 3D mesh node can be edited by selecting the node and dragging it to its new
location or by typing the new coordinates in the Edit Window.
• Locked - Once a mesh has been created and edited as desired, the locations of all of the mesh nodes can be
locked using the Lock All Nodes command. This is generally done to avoid inadvertent movement of the nodes
while assigning boundary conditions and manipulating the view. Once the nodes can be unlocked by unselecting
Lock All Nodes command.
• Deleted - 3D mesh nodes can be deleted by selecting the node and then the Delete command from the Edit menu
or the Delete key.
• Renumbered - As a 3D mesh is constructed within GMS, the nodes and elements in the mesh are numbered
arbitrarily. If any nodes or elements are deleted, gaps are created in the numbering sequence. Such gaps can be
removed and an optimal numbering sequence can be achieved by selecting the Renumber command in the Mesh
menu. Prior to selecting the Renumber command, the user should select a series of boundary faces of the 3D
mesh. These faces represent the location where the numbering process is to begin. In most cases, it is best to
select all of the faces on an entire side of the mesh. This can be accomplished using the Select Face tool with the
Control key held down. The renumbering process renumbers the nodes and elements in a logical order that tends
to minimize the node and element bandwidth (which leads to more efficient solutions with some finite element
solvers). The process begins by ordering the nodes and faces of the selected group of faces. This is essentially a
2D renumbering process. The longitudinal and lateral directions of the region of selected faces are determined and
the numbering proceeds by sweeping along rows oriented in the lateral direction while progressing from row to
row in the longitudinal direction. Once the nodes and faces of the selected region are renumbered, the layer of
elements adjacent to the faces are numbered in a similar sequence. This process is repeated by sweeping outward
from the selected region, one layer of elements at a time, until the entire mesh is renumbered. The results of the
renumbering process can be reviewed by turning on the display of node and/or element numbers in the Display
Options dialog. The results can also be viewed by right-clicking on the 3D Mesh Data Folder in the Project
Explorer and selecting the Properties command. The node and element bandwidths are listed in the dialog that
comes up. If the objective of renumbering the mesh is minimizing the node and element bandwidths, the best
results are generally achieved by selecting a side of the mesh corresponding to one of the two "ends" of the major
or longitudinal axis of the mesh.
Refine Elements
3D mesh elements can be refined. Increasing the density of mesh elements can be accomplished by selecting a set of
elements and selecting the Refine Elements command from the Mesh menu. This brings up the Refine Elements
dialog.
Elements to Refine
The top portion of the dialog is used to specify which elements in the mesh are to be refined. If the Refine all 3D
mesh elements option is selected, all elements in the mesh are refined regardless of which elements are selected. If
the Refine selected 3D mesh elements option is selected, only the selected elements of the mesh are refined.
Even if the Refine selected 3D mesh elements option is selected, a few elements that were not selected must also be
altered. This is due to the fact that the elements that were selected for refinement are refined, disjoint faces are
created between the selected elements and the non-selected elements directly adjacent to the selected elements. To
eliminate these disjoint faces, some transition elements are identified and refined. Transition elements are defined as
any non selected element that shares at least one node with an element that is selected for refinement.
174
Editing a 3D Mesh
175
Refinement Method
There are three methods of refinement that can be used. The difference among the three methods is the shape of the
resulting mesh elements. Each of the three methods is described below.
Vertical Column Refinement
Vertical column refinement is used to split hexahedra and wedges in
the X and Y directions only, as shown on the right.
Vertical column refinement was designed to be used with meshes
created by extruding a 2D mesh through several layers. Meshes created
in this manner are composed strictly of hexahedra and wedges and can
be made by following the mesh extrusion procedure.
Depending upon the type and orientation of the elements in a 3D mesh,
vertical column refinement may not be possible. When the Refine
Elements options is selected from the Mesh menu, the entire mesh is
checked to see if it can be refined using vertical column refinement. If
vertical column refinement is not possible, the Vertical column
refinement option is dimmed. In order for vertical column refinement
to be possible, the following conditions must be met.
Vertical column refinement of (a) hexahedra and
(b) wedges
1. If the entire mesh is to be refined, all elements in the mesh must be either hexahedra or wedges.
2. If only a selected portion of the mesh is to be refined, all selected elements must be either hexahedra or wedges.
3. All wedges to be refined must be oriented in space such that their top and bottom faces correspond to the
triangular faces of the wedge.
4. Both the top and bottom faces of each element to be refined must be on the boundary or adjacent to other
elements that are also to be refined.
5. All transition elements (i.e., elements not intended to be refined but share at least one node with an element that
was selected for refinement) must also satisfy conditions 2 and 3 above.
All Elements To Tetrahedra Refinement
All element types to tets refinement is used to convert any of the four
basic element types to tetrahedra. This option is especially useful since
some finite element solvers require meshes to be composed strictly of
tetrahedra.
The Coarse refinement and Fine refinement options are used to specify
All elements to tetrahedra fine method of
the degree of refinement to be applied. If the Fine refinement option is
refinement
of (a) hexahedra, (b) wedges, (c)
selected, each tetrahedron is divided into eight smaller tetrahedra, each
pyramids, and (d) tetrahedra
pyramid is divided into 16 smaller tetrahedra, each wedge is divided
into 24 smaller tetrahedra, and each hexahedron is divided into 48
smaller tetrahedra. As with vertical column refinement, it is possible to refine either the entire mesh or selected
portions of a mesh using the Fine refinement method.
If the Coarse refinement option is selected, each pyramid is divided into two smaller tetrahedra, each wedge is
divided into either three, or eight tetrahedra, and each hexahedra is divided into five, six, or twelve tetrahedra as
shown below. Tetrahedra are not refined. Unlike the Fine refinement method, it is not possible to refine only a
selected portion of a mesh when using the coarse method. The entire mesh gets refined.
Editing a 3D Mesh
176
All elements to tetrahedra coarse method of
refinement of (a) hexahedra, (b) wedges, and (c)
pyramids
Retain Element Types Refinement
Retain element types refinement is used to convert any of the four
basic element types to smaller elements of the same type. For example,
each hexahedra is divided into eight smaller hexahedra as shown
below. Pyramids are the exception since they are divided into five
smaller pyramids and four tetrahedra. It is possible to divide a pyramid
into four smaller pyramids, but the resulting pyramids are of poor
quality.
Retain element types refinement of (a) hexahedra,
(b) wedges, (c) pyramids, and (d) tetrahedra.
Like vertical column refinement, it is possible to refine only selected
portions of a mesh when using Retain element types refinement. However, it is not always possible to retain element
types in the transition elements. If the original mesh is composed of strictly tetrahedra, any selected region of the
mesh can be refined without introducing elements other than tetrahedra. However, if the mesh contains any element
type other than tetrahedra, pyramids and wedges will be introduced into the transition region.
3D Mesh Display Options
177
3D Mesh Display Options
The properties of all 3D Mesh data that GMS displays on the screen can be controlled through the 3D Mesh tab of
the Display Options dialog. This dialog is opened by right clicking on the
3D Mesh Data entry in the Project
Explorer and selecting the Display Options command. It can also be accessed from the from the Display menu or the
Display Options macro. The following table describes the display options available for the 3D Mesh module.
Display
Option
Description
Nodes
The Nodes item is used to display the mesh nodes.
Element
edges
The Elements item is used to display the edges of elements. The elements are drawn using the color of the material associated with
each cell. An option is included to display all of the edges or only the edges on the boundary of each material. Element can also be
temporarily hidden.
The color of the element edges can be adjusted according to the following options:
1. Auto - draws the material color if faces are not displayed. Uses black or white if the faces are displayed.
2. Specified - used the color specified next to the cell edges
3. Material - displays the material color of the cell
Element faces This option fills the elements with the material color.
Texture map
image
The Texture Map Image Item is used to "drape" an image over the top surface of the 3D Mesh.
Mesh shell
The Mesh shell item is used to display an edge for each of the edges on the exterior of the set of all elements (visible or invisible)
which corresponds to a discontinuity in the mesh exterior. This display option provides a helpful spatial context when displaying
iso-surfaces or cross sections.
Feature angle
The Mesh shell feature angle is used only when the Mesh Shell option is selected. This angle represents a threshold angle at which
an edge of the shell will be displayed. If for example, an angle of 45 degrees is defined, any edge of the mesh which divides two
element faces that are at an angle greater than 45 degrees to each other will not be displayed.
Node
numbers
The Node numbers item is used to display the ID associated with each node next to the node. The numbers are only displayed on
the front-facing faces of exterior elements.
Element
numbers
The Element numbers item is used to display the ID associated with each element at the centroid of the element. The numbers are
only displayed on the front-facing faces of exterior elements.
Scalar values
The Scalar Values item is used to display the scalar values of the active dataset for each node next to the node.
Contours
Most of the objects supported by GMS can be contoured by turning on the Contour Options in the Display Options dialog. When an
object is contoured, the values associated with the active data set for the object are used to generate the contours.
Vectors
If the Vectors item in the Display Options dialog is selected for an object (TIN, Grid, or Mesh), vector plots can be generated using
the active vector data set for the object. One vector is placed at each node, cell, or vertex.
Iso-surfaces
If the Iso-Surfaces item in the Display Options dialog is selected for an object (3D Grid or 3D Mesh), iso-surfaces will be
generated. An iso-surface is the 3D equivalent of a contour line. While a contour line is a line of constant value extracted from a
surface, an iso-surface is a surface of constant value extracted from a 3D data set.
3D Mesh Tool Palette
178
3D Mesh Tool Palette
The following tools are contained in the dynamic portion of the Tool Palette when the 3D Mesh Module is active.
Only one tool is active at any given time. The action that takes place when the user clicks in the Graphics Window
depends on the current tool. The following table describes the tools in the 3D Mesh tool palette.
Tool
Tool Name
Description
Select
Boundary
Nodes
The Select Boundary Nodes tool is similar in function to the Select Nodes tool except that it selects only nodes that are on the
boundary of the mesh. This tool is useful when assigning nodal boundary conditions.
Select
Boundary
Faces
The Select Boundary Faces tool is similar in function to the Select Boundary Nodes tool except that it selects faces of
elements on the boundary of the mesh. This tool is useful when assigning flux type boundary conditions.
Select
Material
Zones
The Select Material Zones tool is used to select all elements of the mesh that have the same material type. This tool is useful
for hiding or isolating zones in the mesh corresponding to a material type. When this tool is active, an icon appears on the
mesh display for each of the material types. A material zone is selected by selecting the icon.
Select
Elements
The Select Elements tool is used to select individual elements. Elements are typically selected for hiding, or for changing the
material type associated with the element. Multi-selection can be performed by holding down the Shift key while selecting or
by dragging a rectangle to enclose the elements to be selected. The ID of the selected element is displayed in the Edit
Window. Only visible elements can be selected. Elements which have been hidden cannot be selected. Hidden elements can
be made visible by selecting the Show command in the Display menu. When selecting elements by dragging a box, all
elements that lie within the box are selected. When selecting elements by clicking on individual elements with the cursor,
only elements on the exterior of the visible portion of the mesh are selected. Elements in the interior of the mesh can be
selected individually by first hiding the elements surrounding the elements to be selected. An element can also be selected by
using the Find Element command in the Mesh menu user is prompted for an element ID and the element is selected. Any
previously selected elements are unselected.
Select Nodes
The Select Nodes tool is used to select individual nodes for editing. Multi-selection can be performed by holding down the
Shift key while selecting or by dragging a rectangle to enclose the nodes to be selected. The ID of the selected node is
displayed in the Edit Window. The coordinates of the selected node are also displayed in the Edit Window and can be edited
by typing in new coordinates and selecting the TAB or Return key. Nodal coordinates can also be edited by dragging a node
using the Select Nodes tool. When in plan view, nodes can be dragged in the XY plane. In any other view, nodes are
constrained to move along the Z axis when they are being dragged. Since it is possible to accidentally drag points, nodes can
be "locked" to prevent them from being dragged by selecting the Lock All Nodes command from the Mesh menu. The nodes
can be unlocked by selecting Unlock All Nodes from the Mesh menu. A node can also be selected by using the Find Node
command in the Mesh menu. The user is prompted for a node ID and the node is selected. Any previously selected nodes are
unselected.
Select Node
Strings
The Select Node Strings tool is used to select one or more strings of nodes. Node strings are used for operations such as
adding breaklines to the mesh.
All of the standard multi-selection techniques are available with this tool. In addition, if the Control key is depressed when a
selection is made, all nodes on the same "side" of the mesh as the selected node are automatically selected. This option is
useful when the same boundary condition is to be assigned to all nodes on the selected mesh side. The extent of the selected
"side" is determined by feature breaks on the exterior of the mesh. If the angle between two adjacent element faces on the
mesh is sharp, the common edge of the faces is assumed to be a feature break and is the boundary of a mesh side.
All of the standard multi-selection techniques are available with this tool. In addition, if the Control key is depressed when a
selection is made, all element faces on the same "side" of the mesh as the selected face are automatically selected. This
option is useful when the same boundary condition is to be assigned to all faces on the selected mesh side. The extent of the
selected "side" is determined by feature breaks on the exterior of the mesh. If the angle between two adjacent element faces
on the mesh is sharp, the common edge of the faces is assumed to be a feature break and is the boundary of a mesh side.
The procedure for selecting node strings is somewhat different than the normal selection procedure. Strings are selected as
follows:
•
Click on the starting node for the string. The node selected will be highlighted in red.
•
Click on any subsequent nodes you would like to add to the string (nodes do not have to be adjacent). The selected nodes
are now connected by a solid red line.
To remove the last node from a string, press the Backspace key. To abort entering a node string, press the ESC key. To end a
node string, press Return or double-click on the last node in the string. Another node string can then be selected.
3D Mesh Tool Palette
179
Select Wells
The Select Wells tool is used to select nodes which have a well (point source/sink) type boundary condition assigned to them.
Since wells are often assigned to nodes in the interior of the mesh, it may be difficult to select the node that a well has been
assigned to using the Select Nodes tool due to the large number of nodes in a mesh. This tool makes this type of selection
easier since only well nodes can be selected when the tool is active.
Select Cross
Sections
Once a set of cross sections has been created, they can be selected using the Select Cross Sections tool. Selected cross
sections can be deleted, or they can be made visible or invisible using the Hide and Show commands.
When this tool is active, a cross section icon appears on each cross section. A cross section is selected by selecting the icon.
When a different tool is selected, the icons disappear. When there are several cross sections, it is often easier to differentiate
cross section icons in plan view (assuming the cross sections were created in plan view). As a general rule the icons are
placed in the center of the first line segment used to cut the cross section.
Select
Particle
Starting
Locations
Particle Starting Locations, used in particle tracking, can be selected with the Select Particle Starting Locations tool. Selected
particles can be deleted. Statistical information for the selected particles, such as the path length and time, is displayed in the
status bar.
Create Cross
Section
Cross sections can be created from a 3D mesh using the Make Cross Section tool. Cross sections are formed when the user
enters a polyline. A polyline is entered by clicking on several points and double-clicking on the final point when the line is
finished. The Delete or Backspace key may be used to remove a point from the polyline, and the ESC key can be used to
abort the process. A cross section or fence diagram is then computed by cutting perpendicular to the current viewing
orientation through the currently visible elements of the mesh. While most cross sections are created with the mesh in plan
view, any viewing orientation can be specified.
Once cross sections are created, they can be deleted, hidden, or shown using the Select Cross Sections tool. Data sets are
automatically interpolated from the 3D mesh to the cross sections for generation of contour and color fringe plots.
Define
Tetrahedron
Define
Pyramid
Element
Define
Wedge
Element
Define
Hexahedron
Element
Four tools are provided for interactively creating the four types of elements supported in GMS. While it is not practical to
create an entire mesh with these tools, they are often useful for editing an existing mesh. The following steps are taken to
construct individual elements:
•
Click on the first node. The node will be highlighted in red.
•
Click on the remaining nodes, one at a time, in the standard order for the element type.
If the wrong node is selected, hitting the Delete or Backspace key backs the process up by one node. Hitting the ESCAPE
key aborts the entire process.
Classify Material Zones
Classify Material Zones
The classify material zones dialogs allows the user to assign materials to a grid or mesh. The source of the materials
can be solids or a different grid or mesh.
Select background object
The background object defines the source of the materials to be assigned to the grid or mesh.
Classify algorithm
Two options are available to assign materials to the grid or mesh: Centroid and Predominant material.
When the Centroid method is used, the centroid of the grid cell or mesh element is calculated. Then the location of
the calculated centroid is found in the background object (grid, mesh, or solid) and the material at that location in the
background object is assigned to the grid cell or mesh element. If the calculated centroid is outside of the
background object then the material of the grid cell or mesh element is not changed.
When the Predominant material method is used to assign materials to a grid from a solid the following process
occurs. A vertical ray from the center of the cell is intersected with the Solids. The top and bottom of the grid cell is
then compared with intersected solids to determine the length of each solid within the cell. Then all of the "solid
lengths" with the same material id are combined. The material id with the greatest length in the cell is assigned to the
cell. If more than one material has the same length in the cell then the material with the lowest id is assigned to the
cell.
Material set name
The material set name is used to specify the name of the new material set as it appears in the project explorer.
180
Iso Surfaces
Iso Surfaces
Iso-surface rendering is a powerful tool for visualizing 3D data sets. Iso-surfaces can be generated for 3D grids and
3D meshes. An iso-surface is the 3D equivalent of a contour line. While a contour line is a line of constant value
extracted from a surface, an iso-surface is a surface of constant value extracted from a 3D data set.
Defining Iso-values
Iso-surfaces are computed using the active scalar data set for the grid or mesh. The Iso-surface Options dialog is
accessed through the Iso-surface Options command in the Data menu or through a button in the 3D Grid Display
Options or 3D Mesh Display Options dialogs. The items in the Iso-surface Options dialog are as follows:
Active Data Set
At the top of the dialog the active scalar data set and active time step is listed. The maximum and minimum data set
values are also listed.
Iso-Values
In the next section of the dialog the number of iso-surfaces and the iso-values are defined. A maximum of 12
iso-surfaces may be created. The Default button can be used to automatically set up a number of iso-values. For
example, if the number of iso-surfaces is three and the button is selected, three iso-values, equally spaced between
the maximum and minimum data set values are generated.
Fill Between
The Fill Between boxes to the right of the iso-values are used to generate surfaces on the exterior of the mesh or grid
between two iso-values. For example, in part a of the figure shown below, two iso-surfaces have been generated
using two iso-values. The image shown in part b was computed using the same iso-values and with the Fill Between
box checked similar to figure d below. This causes the region of the mesh or grid boundary between the two
iso-values to be defined as surfaces. The image shown in part c was generated using a single iso-value with the Fill
Between box checked on the line after the iso-value like figure e. This causes the boundary with data set values
greater than the specified value to be defined as surfaces.
181
Iso Surfaces
182
(d)
(e)
Iso-Surfaces (a) No Fill (b) Fill Between Two Iso-Values (c) Fill Above or Below an Iso-Value (d) Filling between 2
iso-surfaces (e) Filling above an iso-surface.
Define as Cross-Section
Like contour lines, iso-surfaces are temporary in nature. In other words, if the active data set is changed, the current
iso-surfaces are deleted and new iso-surfaces are computed using the new data set values. In some cases, it is useful
to create an iso-surface as a permanent object. This can be accomplished by selecting the Define as cross section
option in the Iso-surface Options dialog. This causes the computed iso-surfaces to be treated as cross sections. As
cross sections, these iso-surfaces can be saved to a file, hidden, or deleted. In addition, if a new data set is selected,
the iso-surfaces are not deleted. In fact, the values associated with the new data set are interpolated to the cross
section iso-surfaces and can be displayed on the iso-surfaces as color fringes or contours. This makes it possible to
effectively display two data sets at once.
Interior Edge Removal
By default, whenever an iso-surface is computed from a mesh or a grid, the lines corresponding to the intersection of
the iso-surface with the cell or element boundaries are displayed on the iso-surfaces. If the Interior edge removal
option is selected, only the edges on the iso-surface corresponding to a feature angle break greater than the specified
value are displayed on the iso-surface. For example, if the feature angle were set at 30.00 degrees, the angle formed
by the two polygonal faces adjacent to each edge in the iso-surface would be checked and only those edges where the
computed angle is less than 180 - 30 = 150 degrees would be displayed. Typically, a small value (e.g., 0.001) is used
so that only the edges adjacent to two coplanar faces are removed (made invisible).
Iso Surfaces
Visible Region Only Option
If the Compute for visible region only option is chosen, the iso-surfaces are not computed in regions where the cells
or elements are not visible. Otherwise, iso-surfaces are computed for all regions of the mesh or grid.
Iso-Surface Edges
If this option is on, the lines that make up the iso-surface are displayed.
Iso-Surface Faces
If this option is on, the iso-surface is displayed a color-filled surface.
Specify Range
The specified range command allows the user to control the minimum and maximum value used to define the colors
assigned to the iso-surfaces.
Isosurface Volumes
The volume within an iso-surface or the volume between two iso-surfaces is computed using the Iso-Surface
Volume command in the Data menu. This command brings up a dialog with a list of iso-values and volumes. The
listed iso-values correspond to the iso-values defined in the Iso-Surface Options dialog. The listed volumes represent
the volumes between each of the iso-values. For example, the first volume represents the volume below (on the
"low" side of) the lowest iso-value, the second volume represents the volume between the first and second
iso-values, etc. The total volume listed at the bottom of the dialog should correspond to the total volume of the grid
or mesh.
Beginning with GMS 7.0 the Isosurface Volumes dialog has changed to display a single volume associated with each
isosurface. In addition to showing a single volume, the user can also view the volume of the cells (or elements) that
are less than the isovalue, the volume of the cells that are greater than the isovalue, and the volume of the cells
intersected by the isosurface by turning on the Display additional volume information toggle. In some cases GMS is
unable to compute the volume of the isosurface. In those cases the user can still have an estimate of the isosurface
volume by looking at the volume of the cells. The volume of the cells should be close to the volume of the isosurface
when the grid (or mesh) is composed of very "small" cells. The difference between the isosurface volume and the
volume of the cells decreases as the size of the cells decreases.
183
Converting 3D Meshes to Other Data Types
Converting 3D Meshes to Other Data Types
3D Mesh Nodes can be converted to 3D Scatter Points bye using the following command in the Mesh Menu:
Mesh to 3D Scatter Points
The Mesh -> Scatter Points command in the Mesh menu is used to create a new scatter point set using the
nodes in a mesh. A copy is made of each of the data sets associated with the mesh and the data sets are
associated with the new scatter point set.
This command is useful for comparing the solutions from two separate simulations from different meshes. For
example, if two simulations have been performed with slightly different meshes (base vs. plan) it may be
useful to generate iso-surfaces or a fringe plot showing the difference between the solutions. It is possible to
generate a data set representing the difference between two data sets using the data calculator. However, the
two data sets must be associated with the same mesh before the data calculator can be used. The data sets from
one of the meshes can be transferred to the other mesh as follows:
1. Load the first mesh and its data set into memory.
2. Convert the mesh to a scatter point set using the Mesh -> Scatter Points command.
3. Delete the first mesh by selecting the Delete All command from the Edit menu.
4. Load the second mesh and its data set into memory.
5. Switch to the 3D Scatter Point module and select an interpolation scheme using the Interpolation Options
command in the Interpolation menu.
6. Interpolate the data set to the second mesh by selecting the to 3D Mesh command from the Interpolation
menu.
At this point, both data sets will be associated with the second mesh and the Data Calculator can be used to
compute the difference between the two data sets. This same sequence of steps can be used to interpolate a
data set from a 3D grid to a 3D mesh, or vice versa.
3D Mesh to 2D Mesh
This command creates a 2D mesh from the upward facing elements of the 3D mesh. The materials of the 3D
elements are preserved on the 2D mesh. The data sets associated with the 3D mesh are NOT transferred to the
2D mesh.
184
Building the 3D Mesh from the FEMWATER Conceptual Model
Building the 3D Mesh from the FEMWATER
Conceptual Model
Once the FEMWATER conceptual model is constructed, the next step is to use the conceptual model to build a 3D
finite element mesh. This is accomplished by first building a 2D mesh, then building the 3D mesh by extruding each
of the 2D elements in 3D elements.
Map -> 2D Mesh
The first step in building the 3D mesh is to select the Map -> 2D Mesh command in the Feature Objects menu. This
command creates a 2D mesh by automatically filling in the interior of the conceptual model with nodes and
elements. The size and spacing of the elements is controlled by the spacing of the vertices on the arcs and by the
refine point attribute assigned to any wells in the interior of the conceptual model.
An example of the Map -> 2D Mesh command is shown in the following figure. A sample FEMWATER conceptual
model is shown in part a. The 2D mesh resulting from execution of the Map -> 2D Mesh command is shown in part
b.
Converting a FEMWATER Conceptual
Model (a) Conceptual Model (b) 2D
Mesh Created with Map -> 2D Mesh
Command (c) 3D Mesh Created by
Extruding 2D Mesh (d) 3D Mesh after
Map -> FEMWATER Command.
Creating the 3D Elements
Once the 2D mesh is created, the next step is to create the 3D mesh by extruding each of the 2D elements into a
series of 3D elements. The elevations of the 3D elements can be defined from a set of boreholes, a set of TINs, or a
set of Solids.
For sites with relatively simple stratigraphy, the Regions -> 3D Mesh command in the Borehole module can be used.
For sites with more complex stratigraphy, the Fill Between TINs -> 3D Mesh command in the TIN module should
be used.
A mesh can also be created using the Solids -> Layered Mesh command in the Solid module.
185
186
5.8. 3D Grid Module
3D Grid Module
The 3D Grid module is used to create 3D Cartesian grids. These grids can be used for interpolation, iso-surface
rendering, cross sections, and finite difference modeling.
Interfaces to the following 3D finite difference models are provided in this module:
• MODFLOW
• MODPATH
• MT3DMS
• RT3D
• SEAM3D
Sample MT3D Simulation
3D Grid Types
187
3D Grid Types
Two types of 3D grids are supported in GMS: cell centered and mesh
centered. When computations are performed on a mesh-centered grid,
the computation points are the grid nodes or the corners of the grid
cells. With a cell-centered grid, computations are performed at the cell
centers.
(a) Cell Centered Grid (b) Mesh Centered Grid
When a data set is imported to a cell-centered grid, there is one value
in the data set for each cell. To use contouring or fringing the values at the cell corners must be known. Therefore,
whenever contouring or fringing is performed, the values at the cell centers are interpolated to the cell corners.
Interpolation to cell corners is only done for visualization. All computations performed using the Data Calculator are
performed on the original values at the cell centers. With mesh-centered grids, all visualization and computations are
performed at the cell corners and no interpolation is necessary.
All of the model interfaces in the 3D Grid module are based on cell-centered grids. Mesh-centered grids are useful
for interpolation and iso-surface visualization since no extra interpolation is necessary.
Creating and Editing 3D Grids
Creating 3D Grids
Two techniques are available for creating 3D grids: the Create Grid command in the 3D Grid Module and the Map
-> 3D Grid command in the Map Module. When a 3D Cell Centered Grid is created two different viewing modes are
available.
Create Grid
A new grid can be created by selecting the Create Grid command from the Grid menu. This command brings
up the Create Grid dialog. The options in the dialog are as follows:
Origin, Length, Rotation - By default, the rows and columns of 2D grids are aligned with the x and y axes.
However, grids can be rotated about the z-axis, if desired. Thus, the information needed to determine the
overall size and location of the grid is the xy coordinates of the lower left corner of the grid (the lower left
corner prior to rotation), the length of the grid in the x and y directions, and the rotation angle. The xy
coordinates of the origin are entered in the Origin edit fields, the dimensions are entered in the Length fields,
and the angle of rotation is entered in the field entitled Rotation about Z-axis.
Bias - Several options are available for defining the number and locations of the cell boundaries. A bias can be
defined which controls how the cell size varies from one cell to the next. For example, an X bias of 1.5 causes
each cell to be 50% larger than the previous cell when moving in the positive x direction.
Number of Cells - The total number of cells in each direction (number of rows or columns) can be defined by
explicitly entering a number or by entering a base cell size and a limit cell size. The base and limit cell size
options are used when a bias other than 1.0 is specified. The base cell size is the size of the first cell in the
sequence. The cells are then generated by altering the cell size according to the bias until the limit cell size is
reached. The remainder of the cells are constructed using the limit cell size.
Type and Orientation - The controls at the bottom of the Create Grid dialog are used to define the type and
orientation of the grid. The user can specify whether the grid should be a mesh-centered grid or a cell-centered
grid. The orientation of the ij axes with respect to the XY axes can also be specified.
Creating and Editing 3D Grids
Map -> 3D Grid
Once the feature object coverages defining a conceptual model have been completely defined, the conceptual
model is ready to be converted to a numerical model. The first step in this conversion process is to create a
grid using the Map -> 3D Grid command. Typically, the Grid Frame command is used prior to this command
to define the location and dimensions of the grid.
When the Map -> 3D Grid command is selected, the Create Grid dialog appears. If a grid frame has been
defined, the size and location of the grid frame are used to initialize the fields in the Create Grid dialog. In
most cases, these values will not need to be changed and the user can simply select the OK button to create the
grid. If a grid frame has not been defined, the size and location of the grid are initialized so that the grid just
surrounds the currently defined conceptual model. Once again, in most cases, no changes will need to be made
and the user can typically immediately select the OK button to create the grid.
If one or more refine points are defined in the conceptual model, the number of rows and columns in the grid
will be automatically determined when the grid is created. Thus, these fields cannot be edited by the user and
will be dimmed. If refine points are not defined, the number of rows and columns must be entered.
When refine points are specified you must enter the Base size, Bias and Max size. The base size is the size you
want the cell to be right at the refine point. The Max size is the largest size that you would like your cells to be
in the entire grid. The bias determines how quickly the cell size will vary as you move away from the refine
point. If you use a bias of 1.1 then the row next to the refine point will be 1.1 times the base size. The next row
will be 1.1 size the previous row.
Editing 3D Grids
Each cell in a 3D grid has attributes associated with it. Each grid cell can be specified as active/inactive and each cell
has a material associated with it. To edit the cell attributes associated with a numerical model see Cell Properties.
Rows, columns, or layers can be added or removed from a 3D grid. A row, column, or layer may be added to the grid
by using one of the following tools found in the 3D Grid Tool Palette:
•
Add i Boundary
•
Add j Boundary
•
Add k Boundary
The boundary of a cell can also be moved to a new location by using the Move Boundary tool. Existing rows,
columns, or layers can be deleted by using the Merge Selected command in the Grid menu which is used to merge
two or more selected rows, columns, or layers into a single row, column, or layer. Since the dimensions of the grid
are changed, this command causes all data sets to be deleted. However, MODFLOW input parameters are preserved.
188
3D Grid Display Options
189
3D Grid Display Options
The properties of all 3D grid data that GMS displays on the screen can be controlled through the 3D Grid tab of the
Display Options dialog. This dialog is opened by right clicking on the
3D Grid Data entry in the Project Explorer
and selecting the Display Options command. It can also be accessed from the from the Display menu or the
Display Options macro. The following table describes the display options available for the 3D Grid module.
Display Option
Description
Nodes
The Nodes item is used to display grid nodes depending on the Grid Type . If the grid is cell-centered, a dot is displayed at the
cell centers. If the grid is mesh-centered, a dot is displayed on the cell corners.
Cell edges
The Cell edges item is used to display the edges of grid cells. The cells are either drawn using the default cell color or the color
of the material associated with each cell.
In addition to turning the display of cells on or off, you can temporarily hide grid cells.
The color of the cell edges can be adjusted according to the following options:
1. Auto - draws the material color if faces are not displayed. Uses black or white if the faces are displayed
2. Specified - used the color specified next to the cell edges
3. Material - displays the material color of the cell
Cell faces
The Cell faces item causes the faces of the grid cells to be drawn as filled polygons.
Inactive cells
The Inactive cells item is used to display cells which are inactive. If this option is turned off, inactive cells are not displayed.
Inactive cells must be displayed before they can be selected.
Named layer
ranges legend
A legend showing the material and named layer ranges can be turned on.
Cell numbers
The Cell Numbers item is used to display the ID of each grid cell.
Node numbers
The Node Numbers item is used to display the ID of each grid node.
Scalar values
The Scalar Values item is used to display the scalar values of the active dataset for each node next to the node.
IJK indices
The IJK indices item is used to display the ijk indices of each cell or node.
IJK triad
The IJK triad item is used to display a symbol at one of the corners of the grid showing the orientation of the ijk axes.
True layer
display
With MODFLOW models, a special option called the True Layer mode is available. If this mode is selected, the user provides a
set of top and bottom elevation arrays for each layer. These arrays can be used to display the vertical variations in the
stratigraphy when in one of the side views in orthogonal viewing mode or when in oblique view in general mode.
Layer borders
The Grid boundary item is used to display a solid line around the perimeter of the grid layers.
Grid shell
The Grid shell item is used to display a solid cube around the extents of the grid. Displaying the boundary is useful when
iso-surfaces are being displayed with the cell edges turned off.
Texture map
image
The Texture Map Image Item is used to "drape" an image over the surface of the 3D Grid.
Contours
Most of the objects supported by GMS can be contoured by turning on the Contour Options in the Display Options dialog. When
an object is contoured, the values associated with the active data set for the object are used to generate the contours.
Specified Data
Set
Allows the user to display the contours of a second data set that is specified by the user. All contouring options are the same for
both the specified and active data sets.
Vectors
If the Vectors item in the Display Options dialog is selected for an object (TIN, Grid, or Mesh), vector plots can be generated
using the active vector data set for the object. One vector is placed at each node, cell, or vertex.
Iso-surfaces
If the Iso-Surfaces item in the Display Options dialog is selected for an object (3D Grid or 3D Mesh), iso-surfaces will be
generated. An iso-surface is the 3D equivalent of a contour line. While a contour line is a line of constant value extracted from a
surface, an iso-surface is a surface of constant value extracted from a 3D data set.
3D Grid Tool Palette
190
3D Grid Tool Palette
The following tools are contained in the dynamic portion of the Tool Palette when the 3D Grid Module is active.
Only one tool is active at any given time. The action that takes place when the user clicks in the Graphics Window
depends on the current tool. The following table describes the tools in the 3D Grid tool palette.
Tool
Tool Name
Select Cells
Description
The Select Cells tool is used to select individual grid cells. Multi-selection can be performed by holding down the Shift key
while selecting or by dragging a rectangle to enclose the cells to be selected. The ijk indices of the selected cell are displayed
in the Edit Window. A zero may be entered in any of the i, j or k fields indicating that all cells in that direction will be
selected. (See Note)
Only visible cells can be selected. Cells which have been hidden cannot be selected. Inactive cells can only be selected when
they are being displayed by turning on the Inactive Cells item in the Display Options dialog.
When selecting cells by dragging a box, all cells that lie within the box are selected. When selecting cells by clicking on
individual cells with the cursor, only cells on the exterior of the visible portion of the grid are selected. Cells in the interior of
the grid can be selected individually by first hiding the layers, rows, or columns adjacent to the cells.
Select Node
The Select Node tool is used select nodes and to interactively edit cell boundary coordinates by clicking on the intersection of
two cell boundaries and dragging the boundaries with the mouse button held down. The coordinates of the cell boundary
intersection are displayed in the Edit Window as the boundaries are dragged. The coordinates of a selected boundary
intersection can also be edited by directly entering the coordinates in the Edit Window.
When dragging a boundary intersection, the intersection is moved in the plane of the face where the point was clicked. For
example, when a boundary intersection on the top of the grid is dragged, the intersection is constrained to move in the XY
plane. If a boundary intersection on the side of the mesh perpendicular to the X axis is dragged, the intersection is constrained
to move in the YZ plane.
If the Control key is depressed when dragging a boundary intersection in a view other than plan view, the intersection is
constrained to move in a plane parallel to the viewing plane.
Select
Material
Zones
The Select Material Zones tool is used to select all cells of the grid that have the same material type. This tool is useful for
hiding or isolating zones in the grid corresponding to a material type. When this tool is active, an icon appears on the grid
display for each of the material types. A material zone is selected by selecting the icon.
Select i
The Select i tool is used to select an entire "row" (set of cells with the same i index) of cells at once. Multi-selection can be
performed by holding down the Shift key while selecting. The i index of the selected row is displayed in the Edit Window.
Select j
The Select j tool is used to select an entire "column" (set of cells with the same j index) of cells at once. Multi-selection can be
performed by holding down the Shift key while selecting. The j index of the selected column is displayed in the Edit Window.
Select k
The Select k tool is used to select an entire "layer" (set of cells with the same k index) of cells at once. Multi-selection can be
performed by holding down the Shift key while selecting. The k index of the selected layer is displayed in the Edit Window.
Select Cross
Sections
Once a set of cross sections has been created, each cross section can be selected using the Select Cross Sections tool. Selected
cross sections can be deleted, or they can be made visible or invisible using the Hide and Show commands.
When this tool is active, a cross section icon appears on each cross section. A cross section is selected by selecting the icon.
When a different tool is selected, the icons disappear. When there are several cross sections, it is often easier to differentiate
cross section icons in plan view (assuming the cross sections were created in plan view). As a general rule the icons are placed
in the center of the first line segment used to cut the cross section.
Select
Particle
Starting
Locations
Particle Starting Locations, used in particle tracking (MODPATH), can be selected with the Select Particle Starting Locations
tool. Selected particles can be deleted. Statistical information for the selected particles, such as the path length and time, is
displayed in the status bar.
Add i
Boundary
The Add i Boundary tool is used to insert a new i boundary into the grid. The new boundary is inserted at the cursor location
when the mouse button is clicked. Inserting a new cell boundary changes the dimensions of the grid and all data sets
associated with the grid are deleted. If the control key is held down while executing this command, the row will be evenly
divided.
3D Grid Tool Palette
191
Add j
Boundary
The Add j Boundary tool is used to insert a new j boundary into the grid. The new boundary is inserted at the cursor location
when the mouse button is clicked. Inserting a new cell boundary changes the dimensions of the grid and all data sets
associated with the grid are deleted. If the control key is held down while executing this command, the column will be evenly
divided.
Add k
Boundary
The Add k Boundary tool is used to insert a new k boundary into the grid. The new boundary is inserted at the cursor location
when the mouse button is clicked. Inserting a new cell boundary changes the dimensions of the grid and all data sets
associated with the grid are deleted. If the control key is held down while executing this command, the layer will be evenly
divided.
Create Cross The Create Cross Section tool is used to create cross sections in a 3D. Cross sections are formed when the user enters a
Section
polyline. A polyline is entered by clicking on several points and double-clicking on the final point when the line is finished.
The Delete or Backspace key may be used to remove a point from the polyline, and the ESC key can be used to abort the
process. A cross section or fence diagram is then computed by cutting perpendicular to the current viewing orientation
through the currently visible cells of the grid. While most cross sections are created with the grid in plan view, any viewing
orientation can be specified. Data sets are automatically interpolated from the 3D grid to the cross sections for generation of
contour and color fringe plots.
Note: Cells can also be selected by using the Find Cell command in the Grid menu. is used for locating cells in the
current grid based on the ijk position within the grid or by cell ID. The Find Cell dialog provides edit fields for both
an ID and an ijk value. Entering a value for ID will automatically update the ijk fields. Likewise, entering a value for
the ijk location will automatically update the ID. When the OK button is selected, the indicated cell will be selected
in the finite difference grid.In addition to selecting one cell at a time, the Find Cell Dialog can select an entire row
column or layer. A zero may be entered in any of the i, j or k fields indicating that all cells in that direction will be
selected. The ID of the cells that will be selected is also displayed as static text at the top of the dialog.
Classify Material Zones
The classify material zones dialogs allows the user to assign materials to a grid or mesh. The source of the materials
can be solids or a different grid or mesh.
Select background object
The background object defines the source of the materials to be assigned to the grid or mesh.
Classify algorithm
Two options are available to assign materials to the grid or mesh: Centroid and Predominant material.
When the Centroid method is used, the centroid of the grid cell or mesh element is calculated. Then the location of
the calculated centroid is found in the background object (grid, mesh, or solid) and the material at that location in the
background object is assigned to the grid cell or mesh element. If the calculated centroid is outside of the
background object then the material of the grid cell or mesh element is not changed.
When the Predominant material method is used to assign materials to a grid from a solid the following process
occurs. A vertical ray from the center of the cell is intersected with the Solids. The top and bottom of the grid cell is
then compared with intersected solids to determine the length of each solid within the cell. Then all of the "solid
lengths" with the same material id are combined. The material id with the greatest length in the cell is assigned to the
cell. If more than one material has the same length in the cell then the material with the lowest id is assigned to the
cell.
Classify Material Zones
Material set name
The material set name is used to specify the name of the new material set as it appears in the project explorer.
3D Grid Viewing Modes
When a 3D cell-centered grid is in memory, two viewing modes are available: General Mode and Orthogonal Mode.
The general mode is the default mode and it is the mode used when a cell-centered 3D grid is not in memory. In
general mode you can view the grid from top, front, or side view or from any oblique view. With the orthogonal
view, the viewing direction are restricted to three views: looking down one of the i, j, or k axes. As you look down
an axis, you view one row, column, or layer at a time. Oblique views and shading are not available in the orthogonal
mode. The default viewing mode for cell-centered 3D grids is the orthogonal mode. Thus, whenever a new
cell-centered grid is created or read from a file, GMS automatically goes into the orthogonal viewing mode
There are two main advantages of the orthogonal mode:
• It is a convenient way to view and manipulate layered models such as MODFLOW.
• Since you only view one row, column, or layer at a time, there are fewer things to display. Thus, redrawing a grid
is much faster.
Switching Modes
A command is provided in the View menu for switching between the orthogonal and general viewing modes. If the
current mode is orthogonal, the menu command is titled Ortho Mode will be selected. If the current mode is general,
the command is titled General Mode will be selected. There is also a toolbar Macro that can be used to switch the
mode .
Mini-Grid Plot
When in the orthogonal mode, the Mini-Grid Plot is activated in the Tool Palette. The plot shows which row,
column, or layer is currently being displayed. The edit field and arrows just beneath the plot can be used to change
the current row, column, or layer. To change the view, select one of the View Along I Axis, View Along J Axis, or
View Along K Axis macros at the bottom of the Tool Palette.
True Layer Mode
With MODFLOW models, a special option called the True Layer mode is available. If this mode is selected, the user
provides a set of top and bottom elevation arrays for each layer. These arrays can be used to display the vertical
variations in the stratigraphy when in one of the side views in orthogonal viewing mode or when in oblique view in
general mode.
192
Converting 3D Grids to Other Data Types
Converting 3D Grids to Other Data Types
3D Grid data can be converted to other types of data in GMS such as 2D grids, 2D scatter points, 3D Meshes, or 3D
scatter points. 3D Grid data is converted using the following commands in the Grid menu:
Grid -> 3D Scatter Points
The Grid -> Scatter Points command in the Grid menu in the 3D Grid Module is used to create a new scatter
point set using the nodes or cells of a 3D grid. A copy is made of each of the data sets associated with the grid
and the data sets are associated with the new scatter point set.
Grid -> 3D Mesh
A new 3D finite element mesh can be created from a 3D grid by selecting the Grid -> Mesh command from
the Grid menu in the 3D Grid menu. An eight node quadrilateral element is created from each cell in the grid.
Grid -> 2D Grid
A new 2D grid can be created from a 3D grid by selecting the Grid -> 2D Grid command from the Grid menu
in the 3D Grid module. This creates a 2D grid which matches the 3D grid, i.e., one cell is created in the 2D
grid for each vertical (ij) column in the 3D grid. This command is typically used in conjunction with the 3D
Data -> 2D Data command.
MODFLOW Layers -> 2D Scatter Points
The MODFLOW Layers -> 2D Scatter Points command in the Grid menu of the 3D Grid module is used for
regional to local model conversion. It is only available if the true layer mode is being used with a MODFLOW
model. When this command is selected, a new 2D scatter point set is created and a scatter point is created at
the centroid of each vertical column of cells in the 3D grid. A data set is then created on the scatter point set
for the top and bottom elevations of each layer and for the computed head values (if a MODFLOW solution is
in memory). The MODFLOW head data set is chosen in the following way: If a modflow head data set is the
active data set then GMS uses that data set for the starting heads. If the active data set is in a modflow solution
but is not a head data set then GMS tries to use the head data set in the active solution. If neither of the first 2
cases works then GMS just goes through the list of data sets and uses the last modflow head data set that it
finds (most likely the last solution that was read in). At a later point in time, these data sets can be interpolated
from the scatter points to the cell centers of a smaller, local grid.
This dialog allows the user to create a scatter point set and data sets of the current MODFLOW simulation.
The user can limit the number of scatter points created by turning on the Only create scatter points within
selected coverage option and selecting the appropriate coverage. This is often used when converting between
a regional model and a local scale model.
• Layer Subdivision
The layers of the current MODFLOW simulation can be subdivided by specifying the Number of local
model layers for each layer in the current 3D grid.
The user can select which MODFLOW data sets to create by turning off/on the toggles below the
Create data sets of text. Data sets for layer elevations, flow package data (HK, HANI, VK, SY, SS...),
Recharge, and Heads can be created. The user must select a 3D grid data set in order to create a data set
for the Heads (most often this will be the MODFLOW solution from the regional model).
193
Converting 3D Grids to Other Data Types
194
The Recharge and Head data sets can be transient if the regional model was transient. The user can also
select a Start and End time to limit the number of time steps for these data sets.
• Bias Layer 1
An option to bias the thickness of the new layer 1 is also available. This can be useful if equally
subdividing layer 1 of the regional model would result in cells where the elevation would be above the
computed heads. Thus, the user can choose to bias the thickness of the new layer 1 to ensure that the top
layer in the new model will not be dry.
3D Data -> 2D Data
The 3D Data -> 2D Data command in the Data menu of the 3D Grid
module is used to create data sets on a 2D grid created using the Grid
to 2D Grid command. These two commands are useful for creating a
2D representation of a 3D data set for contouring.
Watertable Elevations From a MODFLOW
Simulation
The 3D Data -> 2D Data command brings up the 3D Data Set -> 2D
Data Set dialog. The button at the top of the dialog is used to select
which 3D data set is to be converted to a 2D data set. The drop down
box lists each of the options available for converting each column of
3D data values to a single 2D data value. The figure below shows an
example of using the 3D Data -> 2D Data command.
The 3D Data -> 2D Data command in the Data menu of the 3D Grid module is used to create data sets on a
2D grid created using the Grid to 2D Grid command. These two commands are useful for creating a 2D
representation of a 3D data set for contouring.
The 3D Data -> 2D Data command brings up the 3D Data Set -> 2D Data Set dialog. The button at the top of
the dialog is used to select which 3D data set is to be converted to a 2D data set. The drop down box lists each
of the options available for converting each column of 3D data values to a single 2D data value. The figure
below shows an example of using the 3D Data -> 2D Data command.
Exporting Grids
Exporting Grids
2D and 3D grids can be exported from GMS in various formats by right-clicking on the grid in the Project Explorer
and selecting the Export command. The options available include:
Exporting 2D grids
1. Text GMS 2D Grid File (*.2dg)
This is an older GMS grid file format that is described in this document [1].
2. ARC/INFO Ascii Grid File (*.asc)
This is a raster format that can be opened in ArcMap. Because it's a raster, you can only use this option with
cell-centered grids where all cells are the same size.
Exporting 3D grids
1. Text GMS 3D Grid File (*.3dg)
This is an older GMS grid file format that is described in this document [1].
2. Shapefile
An ESRI ArcGIS compatible shapefile will be exported containing 2D polygons for all 3D grid cells in all grid
layers. The attribute table fields include:
•
•
•
•
•
•
•
cell ID
cell I
cell J
cell K
grid cell activity
active scalar data set values
active data set activity (if it exists)
A simple definition query using the grid cell activity and K fields can be created in ArcMap to see one layer of
the grid at a time.
References
[1] http:/ / gmsdocs. aquaveo. com. s3. amazonaws. com/ fform30. pdf
195
Cell Properties
Cell Properties
The cell properties dialog allows the user to edit cell properties. Most cell properties are associated with a model
such as MODFLOW or MT3D. If no models exist in the GMS project them the cell properties dialog will only allow
editing of the material assigned to the grid cell.
MODFLOW
Several input arrays defining parameters such as starting head, IBOUND, hydraulic conductivity, and transmissivity
are defined in the Global/Basic and BCF, LPF, or HUF packages. These arrays can be edited in the Basic and
BCF/LPF/HUF Package dialogs, or they can be initialized using a conceptual model in the Map module. In many
cases however, it is necessary to view or edit the values on a cell-by-cell basis. This can be accomplished using the
Cell Properties command in the MODFLOW menu.
Before selecting the Cell Properties command, a set of cells should be selected using the cell selection tools. Once
the command is selected, the MODFLOW Cell Attributes dialog appears.
The parameters for the selected cells are changed by typing in new values in the edit fields. If more than one cell is
selected when the Cell Properties command is selected, the available edit fields will be left blank (unless all values
are the same for that parameter). To edit one of the parameters, click on the edit field to be edited. When the OK
button is selected, only the parameters whose edit fields that have data are changed. This makes it possible to change
one of the parameters (e.g., transmissivity) for all of the selected cells while leaving the other parameters unchanged.
NOTE: When you are using materials to define the MODFLOW model, the Cell Properties dialog will show the
material properties relating to the material of the selected cell. You will not be able to edit these values on a
cell-by-cell basis, but you can either edit the material type for this cell if the active material set is the default material
set, or you can change the material properties for the material (which affects every cell that uses that material).
MT3DMS/RT3D/SEAM3D
MT3D inputs that vary on a cell by cell basis can also be editing using this dialog and editing the data in the MT3D
tab.
196
Active/Inactive Cells
Active/Inactive Cells
Each of the cells in a cell-centered grid can be active or inactive. An inactive cell is a cell that is not part of the
computational domain. An inactive cell is ignored when contours or vectors are displayed on the grid. Several
methods are available for changing the active/inactive status of cells.
• IBOUND/ICBUND Arrays
The active/inactive status of cells can also be controlled with model parameters. For example, MODFLOW
uses an array of values known as the IBOUND array, to indicate what is active and what is inactive. If data set
flags are not currently present in the active data set, and a MODFLOW simulation is currently in memory, the
active/inactive status of cells will be determined by the IBOUND array. The ICBUND array in MT3DMS also
has an effect on the active/inactive flags.
• Activate Polygon Region
Active/inactive status of cells can be set using the Activate Cells in Coverage command in the Map module.
This command checks each cell in the grid to see if it is within the polygons defined in the
MODFLOW/MT3DMS local Source/sink type coverage. All cells within the coverage are made active and all
cells outside the coverage are made inactive. This command just modifies the IBOUND array in MODFLOW.
If there is no MODFLOW model in memory, the command can hide the grid cells instead of making them
inactive.
• Data Set Flags
Often, the status of the cells of a finite difference grid will be determined from the solution to a numerical
analysis. For example, a cell may go dry during a MODFLOW simulation, making the cell inactive. Two types
of solution files supported by GMS may include active/inactive flags: GMS data set files and MODFLOW
solution files. After importing such a data set, the active/inactive flags are stored with the data sets (or with the
time steps of a transient data set). When a data set is selected as the active data set, the flags (if they exist) are
checked and any cell which is inactive is ignored when contouring and fringing. Active/inactive flags
associated with data sets take precedence over any other method of specifying active/inactive status. When the
data set is switched or deleted, the active/inactive flags for the grid revert to their previous values.
• Active/Inactive Flags Dialog
In some cases, a data set may not explicitly contain active/inactive flags, but the flags can be inferred from one
or more key values. For example, a value of -999 in a data set may mean that the cell is dry or inactive. A set
of key values can be defined to set up the active/inactive flags for a data set using the Active/Inactive Flags
dialog. The Active/Inactive Flags dialog is accessed in the Data Set Info Dialog. The active/inactive status of
the cells is determined from the specified key values in the list. Any number of key values may be specified.
197
Named Layer Ranges
Named Layer Ranges
Starting at version 8.0, GMS allows you to create named layer ranges via the Grid|Named Layer Ranges menu
command. A layer range has a name, a material, and a minimum and maximum layer. If named layer ranges are
defined, GMS will create a material set called "Named Layer Ranges" that matches the ranges defined in the dialog
(if the material set already exists it is simply updated). If the Update grid on OK toggle is on, GMS will make the
"Named Layer Ranges" material set the active set. You can turn on a legend showing the named layer ranges.
Named layer ranges can be used in T-PROGS to target a subset of grid layers.
Redistribute Grid Cells
The number of 3D grid rows, columns or layers can be changed via the Redistribute Grid Cells dialog. This dialog is
accessed by selecting rows, columns or layers using the Select i, Select j or Select k tools, right-clicking and clicking
the Redistribute menu command. The Redistribute Grid Cells dialog indicates the number of ranks (rows, columns
or layers) that are selected and allows you to enter a new number. Entering a new number will cause GMS to
increase or decrease the number of ranks. The new ranks are distributed evenly in the selected area and any model
boundary conditions are positioned as close to their old locations as possible.
Other ways to alter grid rows, columns and layers:
• Grid ranks can be inserted manually using the Add i Boundary, Add j Boundary and Add k Boundary tools.
• Grid ranks can be merged manually using the Select i, Select j or Select k tools, right-clicking and selecting the
Merge command.
• Redistribute Layers menu command.
198
Redistribute Layers
Redistribute Layers
One way to alter 3D grid layer thicknesses is via the Redistribute Layers dialog accessed via the Grid|Redistribute
Layers menu command. This dialog allows you to specify a constant elevation for the top and bottom of the grid and
edit the relative thicknesses of the grid layers.
Other ways to alter grid layer thicknesses:
• dragging with the Select Node tool
• Redistribute Grid Cells popup menu command.
199
200
5.9. 3D Scatter Point Module
3D Scatter Point Module
The 3D Scatter Point module is used to interpolate from groups of 3D scatter points to meshes, grids, or TINs.
Several interpolation schemes are supported including kriging.
Interpolation is useful for setting up input data for analysis codes and it is also useful for site characterization.
Interpolation of TCE Data to a 3D Grid
Once a scatter point is created or imported, it can be saved as part of the current project using the Save command in
the File menu. When scatter point data is exported, the scatter point locations (xyz coordinates) are saved to one file
and the data sets are saved to another file.
3D Scatter Point Display Options
201
3D Scatter Point Display Options
The properties of all 3D scatter data that GMS displays on the screen can be controlled through the 3D Scatter tab of
the Display Options dialog. This dialog is opened by right clicking on the
3D Scatter Data entry in the Project
Explorer and selecting the Display Options command. It can also be accessed from the from the Display menu or the
Display Options macro. The following table describes the display options available for the 3D Scatter Point
module.
Display
Option
Description
Active scatter
point set
The name of the active scatter point set is listed at the top of the dialog. The symbol selected using the Scatter point symbols
option (described below) applies to the active scatter point set. This makes it possible to use a different set of symbols for the
points in each set so that the sets are easily distinguishable.
Scatter point
symbols
The Scatter point symbols item is used to display a symbol at the location of each scatter point. The widget to the left of the toggle
is used to bring up a dialog listing the available symbols. The color of each of the scatter points in a set may be changed in this
dialog also.
The color of the scatter points can be adjusted according to the following options:
1. Specified - used the color specified next to the scatter point symbols
2. Data - the color ramp is used to assign a color to each of the symbols according to the value of the active scalar data set
Inactive scatter Individual scatter points can either be active or inactive. The Inactive scatter points option can be used to control the display of the
points
inactive points.
Scatter point
scalar values
The Scatter point scalar values option is used to display the value of the active data set next to each of the scatter points.
Scatter point
labels
The Scatter point labels item is used to display the scatter point label next to each scatter point.
Scatter point
numbers
The Scatter point IDs item is used to display the scatter point ID next to each scatter point.
Symbol legend The Symbol legend item is used to display a symbol legend listing each of the scatter point sets by name and showing the symbol
associated with the scatter point sets.
3D Scatter Point Tool Palette
202
3D Scatter Point Tool Palette
The following tools are active in the dynamic portion of the Tool Palette whenever the 3D Scatter Point Module is
active. Only one tool is active at any given time. The action that takes place when the user clicks in the Graphics
Window with the cursor depends on the current tool. The table below describes the tools in the 3D Scatter Set tool
palette.
Tool
Tool
Name
Description
Select
Scatter
Point
The Select Scatter Point tool is used to select individual scatter points for editing using the Edit Window. Scatter points can also
be dragged with the mouse. Scatter points can be deleted. With extremely large sets of scatter points, it may become difficult to
identify a scatter point with a particular ID, even if the scatter point IDs are being displayed. In such cases, the Find Point
command in the Scatter Points menu can be used to quickly locate a point. The command prompts the user for the ID of the
desired point and the point is selected.
Select
Scatter
Point Set
The Select Scatter Point Set tool is used to select entire scatter point sets for deletion or to designate the active scatter point set.
When this tool is active, an icon appears at the centroid of the set for each of the scatter point sets. A scatter point set is selected
by selecting the icon for the set.
Create
Scatter
Point
This tool is used to interactively create scatter points by clicking in the GMS graphics window.
Interpolating with 3D Scatter Points
Scatter point sets are used for interpolation to other data types such as TINs, grids, and meshes. A 3D grid can be
created which will just enclose the scatter points by using the Bounding Grid command in the Scatter Points menu.
Interpolation is useful for such tasks as contouring or setting up input data to a model. Since no interpolation scheme
is superior in all cases, several interpolation techniques are provided in GMS.
The basic approach to performing an interpolation is to select an appropriate interpolation scheme and interpolation
parameters, and then interpolate to the desired object using one of the 3D Interpolation Commands.
The interpolation options are selected using the Interpolation Options dialog accessed through the Interp. Options
command in the Interpolation menu. Once a set of options is selected, those options are used for all subsequent
interpolation commands.
Converting 3D Scatter Points to Other Data Types
Converting 3D Scatter Points to Other Data
Types
3D Scatter Points may be converted to other types of data used in GMS, such as a 3D Mesh Nodes or Observation
Points. 3D Scatter Points are converted by using the following commands in the Scatter Points menu:
Scatter Points -> Mesh Nodes
The Scatter Points -> Mesh Nodes command is used to convert each of the scatter points to a 3D mesh node. The
nodes can then be used to generate a mesh using the Tessellate command in the Mesh menu in the 3D Mesh module.
Scatter Points -> Obs. Pts.
The Scatter Points -> Obs. Pts. command in the Scatter Points menu of the 3D Scatter Point module creates a new
observation coverage with one observation point for each of the 3D scatter points in the active scatter point set. The
active data set values become the measured values for the observation points.
MODPATH Starting Locations
3D scatter points can be converted to MODPATH starting locations and vice versa. This is done via the Convert To
-> MODPATH Starting Locations menu command which is available by right-clicking on a 3D scatter set in the
Project Explorer. A new particle set is created for each 3D scatter point set.
Bounding Grid
In many cases, it is useful to interpolate to a 3D grid which just contains the 3D scatter point set where the data are
defined. The Bounding Grid command was designed in order to simplify the creation of such a grid. If the
Bounding Grid command in the Scatter Points menu is selected, the Create Grid dialog comes up with the grid
dimensions automatically initialized so that the grid extends beyond the bounds of the active scatter point set by
10%.
203
204
5.10. Map Module
Map Module
The Map module provides a suite of tools for using Feature Objects to build conceptual models.
Feature objects are used to provide some GIS-like capabilities within GMS. Feature objects include points, arcs, and
polygons. Feature objects can be grouped into layers or coverages. A set of coverages can be constructed
representing a conceptual model of a groundwater modeling problem. This high level representation can be used to
automatically generate MODFLOW and MT3DMS numerical models. Feature objects can also be used for
automated mesh generation.
Feature Objects
205
Feature Objects
Feature objects in GMS have been patterned after Geographic Information Systems (GIS) objects and include points,
nodes, arcs, and polygons. Feature objects can be grouped together into coverages, each coverage defining a
particular set of information. Since feature objects are patterned after GIS objects, it is possible to import and export
feature objects to a GIS such as Arc/Info or ArcView.
The primary use of feature objects is to generate a high level conceptual model representation of a site. In such a
model, items such as rivers, drains, wells, lakes are represented with points, arcs, and polygons. Attributes such as
conductance, pumping rates, and elevations are defined with the objects. This conceptual model is then used to
automatically generate a grid or mesh and assign the boundary conditions and model parameters to the appropriate
cells. Thus, the user can focus on a simplified, high level representation of the model and little or no tedious
cell-by-cell editing is required. The feature object approach can be used to build models for SEEP2D, FEMWATER,
MODFLOW, MT3DMS, RT3D, and SEAM3D. Feature objects are also used to construct cross sections.
Object Types
The definition of feature objects in GMS follows the paradigm used by typical GIS software that supports vector
data. The basic object types are points, nodes, vertices, arcs, arc groups, and polygons. The relationship between
these objects is illustrated in the following figure.
Feature Object Types.
Points
Points are XY locations that are not attached to an arc. Points have unique IDs and can be assigned attributes. Points
are often used to represent wells. Points are also used when importing a set of XY locations for the purpose of
creating arcs or polygons.
Arcs
Arcs are sequences of line segments or edges which are grouped together as a single "polyline" entity. Arcs have
unique IDs and can be assigned attributes. Arcs are grouped together to form polygons or are used independently to
represent linear features such as rivers. The two end points of an arc are called "nodes" and the intermediate points
are called "vertices".
Create Arc Group
This command is used to create an arc group from a set of selected arcs. Once the arc group is created, it can
be selected using the Select Arc Group tool. Properties can be assigned to the arc group as a whole, and the arc
group can be selected to display the computed flow through the arc group. An arc group is deleted by selecting
Feature Objects
206
the arc group and selecting the Delete key. Deleting an arc group does not delete the underlying arcs.
Reverse Arc Direction
Each arc has a direction. One node is the "from" node, the other node is the "to" node. For most applications,
the direction of the arc does not matter. However, when the arc is used to define a MODFLOW stream
network, the direction of the arc becomes significant. The Reverse Arc Direction command can be used to
change the direction (upstream to downstream) for a stream type arc.
Nodes
Nodes define the beginning and ending XY locations of an arc. Nodes have unique IDs and can be assigned
attributes.
Vertices
Vertices are XY locations along arcs in between the beginning and ending nodes. They are used solely to define the
geometry of the arcs. Vertices do not have IDs or attributes.
Redistribute Vertices
The primary function of the vertices of an arc is to define
the geometry of the arc. In most cases, the spacing of the
vertices does not matter. However, if the arcs are to be used
for automatic mesh generation, the spacing of the vertices is
important. In this case, the spacing of the vertices defines
the density of the elements in the resulting mesh. Each edge
defined by a pair of vertices becomes the edge of an
element. The mesh gradation is controlled by defining
closely spaced vertices in regions where the mesh is to be
dense and widely spaced vertices in regions where the mesh
is to be coarse.
Redistributing Vertices. (a) Original Arc (b) Linear
When spacing vertices along arcs, the Redistribute vertices
Interpolation (c) Spline Interpolation.
command in the Feature Objects menu can be used to
automatically create a new set of vertices along a selected
set of arcs at either a higher or lower density. The desired arc should be selected prior to selecting the
Redistribute vertices command. The Redistribute vertices command brings up the Redistribute Vertices
dialog. The following options are available for redistributing vertices:
Linear Interpolation - If the Linear interpolation option is specified, then either a number of subdivisions or a
target spacing can be given to determine how points are redistributed along the selected arcs. In either case, the
new vertices are positioned along a linear interpolation of the original arc.
Spline Interpolation - If the Spline interpolation option is specified, vertices are redistributed along a series of
cubic splines defined by the original vertices of the selected arcs. The difference between the linear and spline
interpolation methods is illustrated below:
Vertex to Node
In some cases, it is necessary to split an arc into two arcs. This can be accomplished using the Vertex <->
Node command. Before selecting this command, a vertex on the arc at the location where the arc is to be split
should be selected. The selected vertex is converted to a node and the arc is split in two.
The Vertex <-> Node command can also be used to combine two adjacent arcs into a single arc. This is
accomplished by converting the node joining the two arcs into a vertex. Two arcs can only be merged if no
other arcs are connected to the node separating the arcs. Otherwise, the node must be preserved to define the
Feature Objects
207
junction between the branching arcs.
Arc Groups
An arc group is a set of arcs that has been marked as a group by the user. As an arc group, attributes can be assigned
to the entire group rather than to individual arcs. An arc group can also be selected as a single unit. Arc groups are
primarily used for flow observations.
Polygons
Polygons are a group of connected arcs that form a closed loop. A
polygon can consist of a single arc or multiple arcs. If two polygons are
adjacent, the arc(s) forming the boundary between the polygons is
shared (not duplicated).
Polygons may not overlap. However, a polygon can have a hole defined
by having a set of closed arcs defining interior polygons. An example of
such a case is shown in the figure below where three arcs are used to
define two polygons. Polygon A is made up of arcs 1, 2, 3 and 4,
whereas polygon B is defined by a single arc (arc 2). For polygon A arcs
1, 3, and 4 define the exterior boundary whereas arc 2 defines a hole.
Polygon With Holes.
Polygons have unique IDs and can be assigned attributes. Polygons are
used to represent material zones, lakes, variable head zones, etc.
Build Polygons
While most feature objects can be constructed with tools in the Tool Palette, polygons are constructed with the
Build Polygons command. Since polygons are defined by arcs, the first step in constructing a polygon is to
create the arcs forming the boundary of the polygon. Once the arcs are created, they should be selected with
the Select Arc tool, and the Build Polygons command should be selected from the Feature Objects menu. If
the selected arcs do not form a valid loop, an error message is given.
The Build Polygons command can be used to construct one polygon at a time or to construct several polygons
at once. If the selected arcs form a single loop, only one polygon is created. If the arcs form multiple loops, a
polygon is created for each unique (non-overlapping) loop. If no arcs are selected, all of the currently defined
arcs in the active coverage are used to create polygons.
Coverages
Feature objects are grouped together into coverages. Each coverage represents a particular set of data. For example,
one coverage can be used to define recharge zones, and another coverage can be used to define zones of hydraulic
conductivity.
Conceptual Models
In a generic sense, a conceptual model is a simplified, high level model of a site. In GMS, a conceptual model object
consists of a set of coverages which are tied to a particular numerical model like MODFLOW or FEMWATER. The
coverages below a conceptual model can have attributes that are related to the numerical model. For example, a
coverage below a MODFLOW conceptual model can have drain or river arcs.
Feature Objects
Feature Object Properties
The Feature Object Properties dialog is used to edit the properties of Points, Nodes, Arcs, Arc Groups, and Polygons.
Three filters are located at the top of the dialog.
The Feature type combo box is used to choose which feature (Point, Arcs...) the spreadsheet displays. The Show
combo box will show only the selected features or all features depending on which option is selected. The BC type
combo box is used to display only certain boundary conditions. For example, if the filter is changed to "well," then
only the wells would be displayed in the spreadsheet.
The Show point coordinates toggle is used to display the (x, y, z) coordinates of each point in the spreadsheet. The
Add Point and Delete Point buttons are used to create new points or remove points from the coverage.
The spreadsheet displays an attribute table associated with the current feature type (Point, Arc...). The columns
available in the spreadsheet depend on the options selected in Coverage Setup dialog.
Converting Feature Objects
Feature objects can be converted to other data types in GMS such as cross sections and scatter points. This can be
accomplished by either right-clicking on a conceptual model, coverage, grid frame, or by selecting a command from
the Feature Objects menu. These commands are summarized on the following pages.
• GMS:Map to Modules
• GMS:Map to Models
Conceptual Model
A conceptual model is a group of coverages that are linked to a particular numerical model such as MODFLOW.
Once a conceptual model has been defined, coverages can be created beneath the conceptual model. The properties
available in the coverage setup dialog depend on the model associated with the conceptual model.
Conceptual Model Properties
Each conceptual model has a name and a numerical model. Then depending on the numerical model other properties
can be assigned. The following is a list of the numerical model and additional properties that are assigned to the
conceptual model.
MODFLOW - The flow package can be LPF, BCF, or HUF for a MODFLOW conceptual model. Optionally,
transport can be included with the MODFLOW conceptual model. If transport is turned on then the transport model
must be selected (MT3DMS, RT3D, SEAM3D), and species and/or reaction parameters need to be entered.
FEMWATER - A FEMWATER conceptual model has the option of simulating flow and/or transport.
MODAEM - No additional properties are set for a MODAEM conceptual model.
WASH123D - A WASH conceptual model has the option of simulating 3D subsurface flow and/or 3D subsurface
tranport and/or 2D overland flow. If the 3D subsurface transport option is turned on, then chemicals must be created.
SEEP2D - No additional properties are set for a SEEP2D conceptual model.
ART3D - Species must be defined with an ART3D conceptual model.
Horizons - No additional properties are set for a Horizon conceptual model.
208
Feature Object Display Options
209
Feature Object Display Options
The properties of all feature object and coverage data that GMS displays on the screen can be controlled through the
Map tab of the Display Options dialog. This dialog is opened by right clicking on the
Map Data entry in the
Project Explorer and selecting the Display Options command. It can also be accessed from the from the Display
menu or the
Display Options macro. The objects on the left of the dialog are common to all coverages, regardless
of the coverage type, and are always available in the Display Options dialog. The options on the right of the dialog
depend on the coverage type. The following table describes the general display options available for the Map
module.
Display
Option
Description
ID
If this option is selected, the ID of each of the feature objects is displayed next to the object. The graphical attributes of the text
used to display the IDs are edited using the fields on the right side of the dialog.
Labels
If this option is selected, the name of points is displayed next to the object. The graphical attributes of the text used to display the
Labels are edited using the fields on the right side of the dialog.
Points
This option is used to display points. The graphical attributes of the points (symbol, color, size, etc.) depend on the coverage type
and are edited using the fields on the right side of the dialog.
Nodes
This option is used to display nodes. The graphical attributes of the nodes (symbol, color, size, etc.) depend on the coverage type
and are edited using the fields on the right side of the dialog.
Vertices
This option is used to display the vertices of arcs. A small dot is placed on the arcs at the location of each of the vertices. The color
of the vertices is the same as the color of the arcs.
Arcs
This option is used to display arcs. The graphical attributes of the arcs (color, line style, thickness, etc.) depend on the coverage
type and are edited using the fields on the right side of the dialog.
Polygons (fill)
If this option is selected, polygons are displayed filled. The graphical attributes of the polygons (fill color) depend on the coverage
type and are edited using the fields on the right side of the dialog. The Polygon fill can also be specified as an attribute.
Transparency can also be set on the polygon fill using the edit box below the option.
Legend
The Legend item can be used to display a legend listing each of the feature object types being displayed and showing what
graphical attributes (symbol, line style, fill color and pattern) are being used to display each type.
Grid frame
This option is used to toggle the display of the Grid Frame.
Show inactive
coverages
When several coverages are present, the display of coverages can become confusing. You can choose to not display inactive
coverages or change the color attributes on inactive coverages
Each of the feature objects in a coverage has a set of display options (color, line style, etc.) that can be edited in the Display
Options dialog. However, these colors are only used to display the objects in the active coverage. All of the objects in the inactive
coverages are displayed using either Coverage colors or the Inactive coverage color depending on the selected option.
Arc direction
arrows
This option controls the display of an arrow which shows the arc direction. The pixel length of the arrow can be specified.
Well screens
This options controls the display of the well screens. The width of the well screen can be adjusted in the Width edit field below the
toggle.
Calibration
targets
This options controls the display of the calibration targets used in the model calibration process. Calibration targets are drawn next
to their corresponding map data (point, arc, polygon).
The calibration target is drawn such that the height of the target is equal to twice the confidence interval (+ interval on top, interval on bottom). The Scale edit field allows the user to change the general length and width of the targets independent of the
range of the active dataset.
Segment ID
This option controls the display of the segments IDs. The font color and size for the segment can also be adjusted.
Feature Object Tool Palette
210
Feature Object Tool Palette
Several tools are provided in the Tool Palette for creating and editing feature objects. These tools are located in the
dynamic portion of the Tool Palette and are only available when the Map module is active. The table below
describes the feature object tools.
Tool Tool Name
Description
Select Tool
Generic selection tool that selects existing feature objects, including: nodes, vertices, arcs, and polygons. A selected object can
be deleted, moved to a new location, or operated on by one of the commands in the Feature Objects menu. The coordinates of
selected points/nodes can be edited using the Edit Window. Double-clicking on a object with this tool brings up that objects
attribute dialog.
Select
Point/Node
Selection tool that will only select existing points or nodes. A selected point/node can be deleted, moved to a new location, or
operated on by one of the commands in the Feature Objects menu. The coordinates of selected points/nodes can be edited
using the Edit Window. Double-clicking on a point or node with this tool brings up the Point or Node Attribute dialog.
Select
Vertex
Selection tool that will only select existing vertices on arcs. Once selected, a vertex can be deleted, moved to a new location, or
operated on by one of the commands in the Feature Objects menu. The coordinates of a selected vertex can be edited using the
Edit Window.
Select Arc
Selection tool that will only select existing arcs to perform operations such as deletion, redistribution of vertices, or building
polygons. Double-clicking on an arc with this tool brings up the Arc Attributes dialog.
Select Arc
Group
Selection tool that is used to select an arc group to assign attributes or to display the computed flux on the arc group. An arc
group is created by selecting a set of arcs and selecting the Create Arc Group command. An arc group is deleted by selecting
the arc group and selecting the Delete key or by selecting the Delete command in the Edit menu. Deleting an arc group does
NOT delete the underlying arc objects.
Select
Polygon
Selection tool that will only select previously created polygons for operations such as deletion, assigning attributes, etc. A
polygon is selected by clicking anywhere in the interior of the polygon. Double-clicking on a polygon with this tool brings up
the Polygon Attributes dialog.
Select Grid
Frame
Selection tool used to select grid frames, allowing for the editing of the grid frame. Once the grid frame is selected, the
placement and size of the grid frame can be edited by clicking on small rectangles and dragging.
Create Point Creates new points. A new point is created for each location the cursor is clicked on in the Graphics Window . Once the point
is created, it can be repositioned or otherwise edited with the Select Point/Node tool.
Create
Vertex
Creates new vertices along existing arcs. This is typically done to add more detail to the arc. A new vertex is created for each
location the cursor is clicked on in the Graphics Window that is within a given pixel tolerance of an existing arc. Once the
vertex is created, it can be repositioned with the Select Vertex tool.
Create Arc
Creates new arcs. An arc is created by clicking once on the location where the arc is to begin, clicking once to define the
location of each of the vertices in the interior of the arc, and double-clicking at the location of the end node of the arc.
As arcs are created, it is often necessary for the beginning or ending node of the arc to coincide with an existing node. If you
click on an existing node (within a given pixel tolerance) when beginning or ending an arc, that node is used to define the arc
node as opposed to creating a new node. If you click on a vertex of another arc while creating an arc, that vertex is converted to
a node and the node is used in the new arc. If you click within a given tolerance of an arc edge, a new node is inserted in the
arc. If you click on an existing point while creating an arc, the point is converted to a vertex, unless it is the beginning or
ending location of an arc, in which case it is converted to a node.
While creating an arc, it is common to make a mistake by clicking on the wrong location. In such cases, hitting the Backspace
key backs up the arc by one vertex. The ESC key can also be used to abort the entire arc creation process at any time.
Coverages
Coverages
Feature Objects in the Map module are grouped into coverages. Coverages are grouped into conceptual models.
A coverage is similar to a layer in a CAD drawing. Each coverage
represents a particular set of information. For example, one coverage
could be used to define recharge zones and another coverage could be
used to define zones of hydraulic conductivity. These objects could not
be included in a single coverage since polygons within a coverage are
not allowed to overlap and recharge zones will typically overlap
hydraulic conductivity zones.
Coverages are managed using the Project Explorer. Coverages are
organized below conceptual models. When GMS is first launched, no
coverage exists. If no coverage exists and the user creates feature
objects then a new coverage will automatically be created. When
multiple coverages are created, one coverage is designated the "active"
coverage. New feature objects are always added to the active coverage
and only objects in the active coverage can be edited. The figure below
shows several coverages in the Project Explorer. The active coverage is displayed with a color icon and bold text. A
coverage is made the active coverage by selecting it from the Project Explorer. In some cases it is useful to hide
some or all of the coverages. The visibility of a coverage is controlled using the check box next to the coverage in
the Project Explorer.
A new coverage can be created by right-clicking on a folder or conceptual model and selecting the New Coverage
command in the pop-up menu.
Right clicking on a coverage brings up a menu with the following options: Delete, Duplicate, Rename, Coverage
Setup, Attribute Table, the Map To submenu, Transform, Export, and Properties. The Delete, Duplicate, and Rename
commands are self explanatory.
Coverage Setup
The Coverage Setup command brings up the Coverage Setup dialog. This dialog controls the properties that are
assigned to feature objects. The feature object properties have been divided into 3 general categories:
Sources/Sinks/BCs, Areal Properties, and Observation Points. Under the Sources/Sinks/BCs the user can select
which source/sinks he would like to include in the coverage (like wells, rivers, drains, etc). Areal Properties includes
recharge, ET, hydraulic conductivity, and other properties that are assigned to polygonal zones. Observation Points
control which data sets have associated observation data.
The Coverage type is used for WASH123D conceptual models to set the coverage to be a 3D or a 2D coverage.
The Default layer range is used with MODFLOW conceptual models to default the "from layer"/"to layer"
assignments for boundary conditions.
The Use to define model boundary toggle is used with MODFLOW and MODAEM. This means that the polygons in
this coverage are used to define the active area of the model.
211
Coverages
3D grid layer option for obs. pts
The 3D grid layer option for obs. pts. is used to set the input option for observations associated with MODFLOW
conceptual models. The MODFLOW observation package can handle observations that include multiple cells.Three
options are available for determining which layer the observation point will be located:
• by z location - When the "by z location" option is selected, the computed value for the observation point (that will
be compared with the observed value) will be taken from the cell that corresponds with the elevation value
assigned to the observation point.
• by layer number - If you select the "by layer number" option in the coverage setup, the computed value will be
taken from the cell that corresponds to the layer that is specified in the observation point coverage properties.
• Use well screen - This option may be used when the model includes wells with screens. GMS finds the cell or
cells that intersect the screened interval the user has entered.
The Default elevation field can be used to define the initial Z elevation of new objects created in a coverage. By
assigning a different elevation to each of the coverages, the coverages can be displayed as a stack of layers in oblique
view.
Feature Object Attribute Table
All feature object properties are edited using a single spreadsheet. This makes it possible to cut and paste feature
object data using the clipboard and it makes it easier to edit entire columns of data at once. Filters at the top of the
dialog control what type of objects are displayed.
Map To Submenu
Coverages can be mapped to other geometric objects or Numerical models by selecting the corresponding command
from the Map to Submenu.
212
Grid Frame
Grid Frame
A grid frame is an outline showing where a grid will be created. The grid frame can be used to create a grid at a
particular location, size and orientation. The Feature Objects | New Grid Frame command is used to create the grid
frame. When the Map -> 3D Grid command is selected, the grid will be created using the grid frame.
The Grid Frame tool
can be used to move, size and rotate the grid frame. Double clicking on the grid frame will
bring up the Grid Frame Properties dialog which can also be used to move, size and rotate the grid frame.
Displaying the Grid Frame
The display of the grid frame can be turned on or off by checking (unchecking) the toggle next to the Grid Frame in
the Project Explorer or by using the Grid Frame option in the Feature Objects Display Options dialog.
Clean Command
The Clean command is used to fix errors in feature object data. The Clean command only applies to the active
coverage. Selecting the Clean command brings up the Clean dialog. The clean options are as follows:
• Snap Nodes - Any two nodes (or points) separated by a distance which is less than the specified distance
tolerance are combined to form a single node.
• Snap Selected Nodes - This option is the same as the previous option but only the selected nodes are checked.
When this option is checked you will be prompted to select a snapping point; you must click on the graphics
window to indicate the snapping point.
• Intersect Arcs - All arcs are checked to see if they intersect. If an intersection is found, a node is created at the
intersection and the arcs are split into smaller arcs.
• Intersect Selected Arcs - This option is the same as the previous option but only selected arcs are checked for
intersections.
• Remove Dangling Arcs - A check is made for dangling arcs (arcs with one end not connected to another arc)
with a length less than the specified minimum length. If any are found they are deleted.
213
Temporal Discretization
Temporal Discretization
Many of the parameters associated with feature objects can be specified as either constant or transient values.
Transient values are defined as a simple list of time/data pairs using the XY Series editor. The time series represents
a piece-wise linear curve indicating how the parameter varies with time. When the Map -> MODFLOW command is
selected, these curves must undergo temporal discretization. Temporal discretization is a process of converting
general time series into discrete values that apply over specific time ranges (stress periods). Transient parameters
associated with feature objects are stored in an xy series. An xy series is a general-purpose object used in GMS to
represent curves of data (in this case a time series). An xy series is manipulated by GMS with regards to feature
objects in three different ways: extrapolation, interpolation, and integration.
Extrapolation
Because the user is free to enter any time values for the x parameter of an xy series, it is possible that the xy series as
entered does not cover the same time range as the stress periods. In this case it may be necessary to extrapolate a
value for the xy series at a time before or after the first or last entered value. In GMS the simplest approach has been
used. If a value is required for a time previous to the times defined by the xy series, the first value is used. Likewise
for a time that is later than the all of the times in the xy series, the last value is used. Since this behavior might hide
an error in the input parameters, GMS will warn the user if any xy series does not cover the time range defined by
the stress periods.
Interpolation
It is also sometimes necessary to create an xy series that is a composite of two other xy series. This is the case when
obtaining transient values for an intermediate point along an arc segment that has differing transient parameters at
both nodes at the ends of the arc. To perform this type of interpolation, a new xy series is constructed that is the
union of the x times from the two original series. The y values that correspond to each of these new x values are
obtained by evaluating the original series at the x value to get two y values and then interpolating these two y values
using the following equation:
Where xn and yn are the points along the new xy series, F0 and F1 are the two original xy series and t is the
interpolation weighting parameter.
An example of xy series interpolation. When one node of an arc has a constant parameter and the other has a
transient parameter, the constant parameter is converted into an xy series with only one point. By using the
extrapolation assumption above, it is then possible to perform a transient interpolation using two transient series.
Integration
MODFLOW and MT3DMS both use the concept of Stress Periods to define the times that stresses may be applied.
A stress period is a time interval during which all external stresses are constant. Because an xy series is not
constrained to be constant over a time interval, it is necessary to obtain a representative value from the xy series that
will approximate this condition.
GMS uses integration of the curve defined by the xy series to obtain the average value over the stress period. Recall
that integrating a function from a to b yields the area beneath a curve. Then, by dividing this area by the difference
between a and b, the average value of the function can be determined. By interpreting an xy series as a piece-wise
linear curve, F(x), the average value for a time series over a time range from a to b is:
This average value is then assigned to the stress period.
214
Temporal Discretization
Time Units
When entering a time series in the Map module using the XY Series Editor, you can use relative times (i.e., 0.0, 3.2,
5.4 etc.), or dates/times (1/1/2004 12:00:00 AM, 2/13/2004 2:01:00 PM etc.).
Map to Models
Map to MODFLOW
See Map to MODFLOW
Map to FEMWATER
Once the 3D mesh is constructed, the final step in converting the FEMWATER conceptual model to a
mesh-based numerical model is to select the Map -> FEMWATER command in the Feature Objects menu.
This command assigns the wells, boundary conditions, and recharge zones assigned to the points, arcs, and
polygons in the conceptual model to the nodes and element faces of the 3D mesh. At this point, the basic
analysis options (steady state vs. transient, output control, material properties, etc.) must still be assigned using
the tools in the FEMWATER menu. Once these basic options have been assigned, the model can be saved and
FEMWATER can be launched.
Map to MT3DMS
After the conceptual model is constructed, the Map -> MT3DMS command can be used to convert the
conceptual model to an MT3DMS numerical model. Before the Map -> MT3DMS command can be selected,
the MT3DMS data must be initialized. The MT3DMS data are initialized with the following steps:
1. Switch to the 3D Grid module
2. Select the New Simulation command from the MT3D menu.
3. Open the Basic Transport Package dialog and set up the stress periods you wish to use in the simulation.
Once the MT3DMS data are initialized, the Map -> MT3DMS command becomes undimmed and can be
selected.
Because MT3DMS already assumes a default concentration of zero for an unspecified point source sink, GMS
does not create a source/sink if the concentration for the feature object has been specified as a constant value
of zero.
215
Map to Modules
216
Map to Modules
Arc -> Cross Sections
The default method for generating cross sections through solids, 3D meshes, or 3D grids it to interactively
enter a line or a polyline in the Graphics Window while the Make Cross Section tool is active (Solid module,
3D Grid module, 3D Mesh module). This line is then projected perpendicular to the screen (parallel to the
viewers viewing angle) and is intersected with the 3D objects to generate the cross section. In some cases, it is
useful to precisely locate the cross section. Furthermore, it is often necessary to repeatedly generate a cross
section at the same location. In such cases, the Arcs -> Cross Sections command can be used to precisely
control the location of a cross section.
When the Arcs -> Cross Sections command is selected, the Arcs -> Cross Sections dialog appears. The top
part of the dialog is used to specify which of the arcs are to be used to create the cross sections. Either all of
the arcs are used or only the selected arcs. Since cross sections can be cut through any 3D object, the items in
the lower section of the dialog are used to designate which of the 3D objects will be used to cut the cross
sections. If one of the types listed does not currently exist, the corresponding item is dimmed.
When the OK button is selected, a cross section is constructed for each of the designated arcs. As is the case
when the Make Cross Section tool is used, the cross sections are constructed by projecting the arcs parallel to
the viewing angle. For example, to create vertical cross sections, the image should be in plan view prior to
selecting the Arcs -> Cross Sections command.
Map -> TIN
This command creates a TIN using each polygon in the coverage.
Map to 2D Mesh
Once a set of feature objects has been created for a SEEP2D or a FEMWATER conceptual model, the Map ->
2D Mesh command can be used to generate a 2D finite element mesh from the objects. The Map -> 2D Mesh
command creates a 2D Mesh on the interior of all of the polygons in the current coverage. The figure below
shows a cross section of a dam built using the Feature Objects in the Map Module. The second figure shows a
2D Mesh created from the polygons.
Cross Section of a Dam built with Arcs and Polygons in the Map Module
Map to Modules
217
2D Mesh created from Map Objects using Map -> 2D Mesh command
Map to 2D Grid
The Map -> 2D Grid command is used to construct a 2D grid using the feature objects in a 2D Grid Coverage.
When the Map -> 2D Grid command is selected, the Create Grid dialog appears. If a grid frame has been
defined, the size and location of the grid frame are used to initialize the fields in the Create Grid dialog. In
most cases, these values will not need to be changed and the user can simply select the OK button to create the
grid. If a grid frame has not been defined, the size and location of the grid are initialized so that the grid just
surrounds the currently defined feature objects. If desired, the grid dimensions can be edited prior to selecting
the OK button to create the grid.
If one or more refine points are defined in the conceptual model, the number of rows and columns in the grid
will be automatically determined when the grid is created. Thus, these fields cannot be edited by the user and
will be dimmed. If refine points are not defined, the user must enter the number of rows and columns.
Map to 3D Grid
Once the feature object coverages defining a conceptual model have been completely defined, the conceptual
model is ready to be converted to a numerical model. The first step in this conversion process is to create a
grid using the Map -> 3D Grid command. Typically, the Grid Frame command is used prior to this command
to define the location and dimensions of the grid.
When the Map -> 3D Grid command is selected, the Create Grid dialog appears. If a grid frame has been
defined, the size and location of the grid frame are used to initialize the fields in the Create Grid dialog. In
most cases, these values will not need to be changed and the user can simply select the OK button to create the
grid. If a grid frame has not been defined, the size and location of the grid are initialized so that the grid just
surrounds the currently defined conceptual model. Once again, in most cases, no changes will need to be made
and the user can typically immediately select the OK button to create the grid.
If one or more refine points are defined in the conceptual model, the number of rows and columns in the grid
will be automatically determined when the grid is created. Thus, these fields cannot be edited by the user and
will be dimmed. If refine points are not defined, the number of rows and columns must be entered.
Map to Modules
Refine Points
Refine attributes are assigned to points or nodes and are used to automatically increase the grid density around
a point when the grid is constructed. Although refine attributes may be associated with any point or node, they
are usually assigned in conjunction with wells.
Map to 2D Scatter Points
The Map -> 2D Scatter Points command creates a scatter point set from the points and nodes and vertices of
the current coverage. The process is different for observation coverages and non-observation coverages.
Non-observation Coverages - With non-observation coverages, a single elevation data set is created for the
2D scatter points representing the Z location of all the points, nodes and vertices.
Observation Coverages - With observation coverages, the Observation Points -> Scatter Points dialog
appears. This dialog allows you to create a data set for the 2D scatter points from one of the measurements
associated with the observation points.
Measurement - A data set is created for the 2D scatter points from the measurement selected in the dialog.
The model associated with the selected measurement (if any) is shown, along with whether the measurement is
steady state or transient.
Time Step Times - This section of the dialog is only available if the selected measurement is transient. It
allows you to define the number of timesteps, and the timestep times to be created for the scatter point data set.
Match all unique times - The Match all unique times option gets the set of unique times from the XY series
of all the observation points. This is the union of all the times. If some XY series use dates/times and others
don’t, this option won’t be available. Otherwise, the times in the spreadsheet will be displayed as either
dates/times or relative times depending on the XY series. The spreadsheet will not be editable. The Use
dates/times toggle will be unavailable but set according to whether the observation point XY series use
dates/times or not. The Reference time section will be unavailable, but if the XY series use dates/times, the
minimum time will be used as the reference time for the scatter point data set.
Match time steps from model - The Match time steps from model option will only be available if the
measurement is associated with a model, and the model is transient. If so, this will be the default choice and
GMS will get the times to display in the spreadsheet from the stress period and time step info for the model.
The spreadsheet will not be editable. The Use dates/times toggle will be unavailable but set according to
whether the model uses dates/times or not. The Reference time section will be unavailable, but if the model
uses dates/times, the model reference time will be used as the reference time.
Specify times - The spreadsheet of times will be editable with this option and you can copy and paste times
from another program such as a spreasheet. Also, the Initialize Times button becomes available allowing you
to bring up a dialog you can use to create times at a specified interval. If you select the Use dates/times toggle,
the Reference time section will become available and the times in the spreadsheets will be displayed as
dates/times.
Map to 3D Scatter Points
The Map -> 3D Scatter Points command was introduced in GMS version 8.3. This command works exactly like the
Map -> 2D Scatter Points command except that 3D scatter points are created. One use of the Map -> 3D Scatter
Points command is to create scatter points from map data that can then be converted into MODPATH starting
locations.
218
219
5.11. GIS Module
GIS Module
The GIS module allows you to manipulate ESRI type GIS data, such as shapefiles. If you have a license of ArcView
8.x or higher on the computer that GMS is installed on, there are additional features available in the GIS module, but
you don't have to have an ArcView 8.x license installed to access the basic features.
The following table shows what features are available with and without a license of ArcView 8.x.
Feature
With ArcView Without ArcView
Efficient management of large data sets
X
X
Graphical selection of features
X
X
Conversion of selected GIS objects to GMS feature objects
X
X
Viewing attribute tables
X
X
Joining additional attribute tables based on a key field
X
X
Display like ArcView
X
X
Display in a simplified, single color
X
X
Support for shapefiles
X
X
Support for coverages, geodatabases, images, CAD, grids
X
Selection queries
X
Symbology
X
GIS Display Options
220
GIS Display Options
The properties of all GIS data that GMS displays on the screen can be controlled through the Shape Files tab of the
Display Options dialog. This dialog is opened by right clicking on the
GIS Data entry in the Project Explorer and
selecting the Display Options command. It can also be accessed from the from the Display menu or the
Display
Options macro. The following table describes the display options available for the GIS module.
Display
Option
Description
Points
Controls the display of points in shape files in the Graphics Window. The size and color of the points can be adjusted using the
button to the right of the Points toggle.
Lines
Controls the display of lines in shape files in the Graphics Window. The line type, width, and color can be adjusted using the button
to the right of the Lines toggle.
Polygons
Controls the display of polygons in shape files in the Graphics Window. The polygon line type, width, and color can be adjusted
using the button to the right of the Polygons toggle.
Selection
color
Controls the selection color used when GIS shape file objects are selected in the Graphics Window.
GIS Tool Palette
The following tools are active in the dynamic portion of the Tool Palette whenever the GIS module is active. Only
one tool is active at any given time. The action that takes place when the user clicks in the Graphics Window with
the cursor depends on the current tool. The table below describes the tools in the GIS tool palette.
Tool
Tool Name
Description
Select
Features
The Select Features tool is used to select feature objects in the Graphics Window. This tool is only available if ArcView is
installed locally on the user's desktop.
Identify
The Identify tool is used to select GIS objects and display information relating to that object in an Identify Results dialog.
This tool is only available if ArcView is installed locally on the user's desktop.
Select
Elements
The Select Elements tool is used to select shape objects in the Graphics Window.
Enabling ArcObjects
221
Enabling ArcObjects
ArcObjects is a development platform provided by ESRI that allows developers of other applications (such as GMS)
to incorporate ArcView/ArcGIS capability directly within their application. GMS can use ArcObjects to access some
of the same functionality in GMS that is available in ArcView, providing you are running on a computer that has a
current license of ArcView.
The Data | Enable ArcObjects command queries the ESRI license manager for ArcView/ArcGIS to see if a license
exists. If a valid license is found then the ArcView functionality within GMS is enabled and you will be allowed
access. If a license is not found then the ArcView specific features remain unavailable.
ArcObjects® is a development platform provided by ESRI® [1] that allows developers of other applications to
incorporate ArcView/ArcGIS® capability directly within their application. ArcObjects® is used to incorporate
ArcView® functionalities into XMS software. This allows users to use ArcView® functionality within XMS
software. In order to use ArcView® functionality, a current license of ArcView® must be installed. Without a
license, much of the same functionality is available, the primary differences being that only the shapefile format is
supported, and many of the selection and display capabilities are minimal.
"Error initializing EMRL_LicCheckMod.dll"
If the dll "EMRL_LicCheckMod.dll" fails to register automatically, selecting the Enable ArcObjects command will
bring up the error "Error initializing EMRL_LicCheckMod.dll". Please contact Technical Support". To fix this, you
will need to register the dll manually by following the steps below.
• 1. Select "Start | Run"
• 2. Type in 'regsvr32 "<directory where GMS 7.0 was installed>\EMRL_LicCheckMod.dll"
The default location for GMS 7.0 is "C:\Program Files\GMS 7.0".
If the program was installed in the default location, for
example, this line in the Run window will be: regsvr32 "C:\Program Files\GMS 7.0\EMRL_LicCheckMod.dll"
• 3. Select OK
• 4. Restart GMS 7.0
References
[1] http:/ / www. esri. com/
GIS to Feature Objects
GIS to Feature Objects
While future versions of GMS may be able to process some commands directly from the GIS data layers, currently
you must map all features you wish to use as part of model development to feature objects in a map coverage. One
way to do this is to convert an entire shapefile directly to a map coverage (this is the only way available in previous
versions), but often the extents of the GIS data layer are much larger (i.e., an entire state) and so it may be more
efficient to select only those GIS features (points, lines, polygons) that overlay your study area and map those to
feature objects in a map coverage.
Selecting the GIS | ArcObjects -> Feature Objects command (with an ArcObjects license), or the GIS | Shapes ->
Feature Objects (without an ArcObjects license) launches a mapping wizard which guides you through the process
of converting your GIS data layer features to feature objects in a map coverage. Before beginning the mapping
process you should first go to the map module and make sure that the currently active coverage is the coverage you
wish to map GIS data layer features to. Also, you will associate the GIS attributes with GMS coverage attributes, so
you must make sure the GMS coverage attributes are defined before you can do the conversion.
After making sure you will be mapping to the correct coverage select the GIS features which overlay your study area
and that you wish to map (this is done with the selection tool(s) in the GIS module). If you wish to map all the
features you can choose the Edit | Select All command, or just execute the Mapping command, and you will be
prompted if you want to convert all features since none are selected.
If you have ArcObjects enabled you will see that the GIS | ArcObjects -> Feature Objects command is activated
whereas if you do not have ArcObjects enabled you will see that the GIS | Shapes -> Feature Objects command is
activated. After choosing the appropriate mapping command you will see the Mapping Wizard shown below. This
wizard will guide you through the rest of the process. The first dialog in the mapping wizard contains instructions
and marks the beginning point of mapping for selected features. The first of two steps is to map the attribute fields of
the features to attributes used by GMS. GMS recognizes some attribute names as commonly used for certain
attributes and maps them automatically.
The second step marks the end of the wizard and after selecting Finish all selected features will be converted to
feature objects within the active coverage. Attributes of mapped fields will be saved accordingly as attributes of the
feature objects.
222
Add Data
Add Data
Add Shapefile Data
The Data | Add Shapefile Data command allows you to browse for and open shapefiles as GIS layers in GMS.
Without a license of ArcView on your computer then shapefiles are the only supported format for GIS layers. With a
valid license of ArcView the Data | Add Data command is available and any of the ESRI supported formats can be
opened as GIS data layers.
Add Data
The Data | Add Data command is available when ArcObjects is enabled and uses the same dialog resource to open
GIS data layers that is used by ArcView.
When ArcObjects is enabled you are able to load any of the ESRI supported formats, including shapefiles,
coverages, geodatabases, grids, images, CAD files and others, as GIS data layers in GMS. These data can then be
converted to GMS feature objects in map coverages.
Arc Hydro Groundwater
Arc Hydro Groundwater [1] is a data model and a suite of tools for groundwater data that is integrated with ESRI's [1]
ArcGIS [2]. GMS can import and export data in a geodatabase consistent with the Arc Hydro Groundwater standard.
Export to Arc Hydro Groundwater
To export data from GMS into an Arc Hydro Groundwater geodatabase you select the File | Save As menu command
and change the file type to Arc Hydro Groundwater Geodatabase. In order for the export to be successful the
following things must be true:
• ArcObjects must be enabled.
• Your data must be in a non-local projection.
Import from Arc Hydro Groundwater
An Arc Hydro Groundwater geodatabase may be imported into GMS. This is done by enabling ArcObjects and, in
the GIS module, selecting the GIS | Add Data menu command. Selecting the Arc Hydro Groundwater geodatabase
from the Add Data dialog will display the items the geodatabase contains. You may then select which items to
import into GMS.
References
[1] http:/ / www. archydrogw. com/ ahgw/ Main_Page
[2] http:/ / www. esri. com/ software/ arcgis/
223
224
6. Models
225
6.1. FEMWATER
FEMWATER
GMS includes a graphical interface to the groundwater model FEMWATER. FEMWATER is a 3D finite element,
saturated/unsaturated, density driven, flow and transport model. FEMWATER was originally written by G.T.
(George) Yeh at Penn State University (Yeh, et. al., 1992). The version of FEMWATER that is supported by GMS is
a special version that has been modified by G.T. Yeh and the U.S. Army Engineer Waterways Experiment Station.
This version is a coupled version of the original FEMWATER model (which solved for flow only) with the transport
model LEWASTE (also developed by George Yeh).
A separate reference manual is available which describes the new version of FEMWATER in detail (Lin, et. al.,
1997). This manual contains a description of the input requirements and should be read completely before using
GMS to set up a problem.
Pre-Processing
• Building a FEMWATER Model
• FEMWATER Model Input
• Saving a FEMWATER Simulation
Post-Processing
• FEMWATER Display Options
• FEMWATER Post Processing Viewing Options
External Links
• Mar 2004 ERDC/CHL CHETN-XI-1 DDJC-Sharpe Defense Distribution Depot: FEMWATER 3D Transport
Model of TCE Plume Migration with Natural Attenuation [1]
References
[1] http:/ / chl. erdc. usace. army. mil/ library/ publications/ chetn/ pdf/ chetn-xi-1. pdf
226
6.1.1. FEMWATER Pre-Processing
Building a FEMWATER Model
Three various approaches provided in GMS for constructing a FEMWATER model. The model can be completely
defined using the tools in the 3D Mesh module (the direct approach), or the model can be defined with the aid of the
feature object tools in the Map module (the conceptual model approach). A horizons to 3D mesh approach can also
be used.
Basic Steps in Building a FEMWATER Model
The basic steps in building a FEMWATER model include:
• Build a 3D mesh defining the extents of the model. Three approaches are available:
• FEMWATER Direct Approach
• FEMWATER Conceptual Model Approach
• Horizons to 3D Mesh
• Initialize FEMWATER
• Assign boundary conditions and model stresses, including sources and sinks
• Point Source/Sink BC (Wells)
• Assign Node/Face BC
• Assign material properties
• Run FEMWATER
FEMWATER Direct Approach
The Direct Approach
For models with simple geometry and boundary conditions, the entire model can be constructed using the tools and
commands in the 3D Mesh module. With this approach, the editing of the FEMWATER data is performed directly
on the nodes and elements of the mesh. The first step is to create a 3D mesh covering the model domain using the
mesh building tools in the 3D Mesh module. The boundary conditions and source/sink terms are then assigned by
selecting nodes, elements, and element faces and assigning values directly to the selected objects. The model is then
saved and FEMWATER is launched.
Creating a Mesh
The first step in performing a FEMWATER simulation is to create a 3D finite element mesh. The volumetric
domain to be modeled by FEMWATER is idealized and discretized into hexahedra, prisms, tetrahedra, and or
pyramids. Elements are grouped into zones representing hydrostratigraphic units. Each element is assigned a
material ID representing the zone to which the element belongs. When constructing a mesh, care should be
taken to ensure that elements do not cross or straddle hydrostratigraphic boundaries.
The tools provided in GMS for constructing a 3D finite element mesh are provided in the 3D Mesh Module.
When constructing a mesh for FEMWATER, there are a few important guidelines that should be considered.
These guidelines are described in Chapter 3 of the FEMWATER Reference Manual.
The most efficient method for constructing a 3D mesh for FEMWATER is to use the conceptual model
approach. The FEMWATER conceptual model can be used to automatically build a 2D mesh that matches the
Building a FEMWATER Model
227
model boundaries and is refined around wells. This mesh can then be extruded into a 3D mesh.
Solids can also be used to make a structured mesh. This is accomplished with the Solids -> Layered Mesh
command in the Solids menu.
FEMWATER Conceptual Model Approach
The preferred method for setting up a FEMWATER simulation is to use the feature object tools in the Map module
to define a FEMWATER conceptual model of a site being studied. The conceptual model is a high-level description
of the site including sources/sinks, the boundary of the domain to be modeled, rainfall and seepage zones, and
material zones within each of the layers. The conceptual model is defined with feature objects, including points, arcs,
and polygons, and is constructed independently of a numerical grid. Once the conceptual model is complete, a mesh
is automatically constructed to fit the conceptual model, and the FEMWATER data are converted from the
conceptual model to the nodes, elements, and element faces. The dialogs and interactive editing tools in the
FEMWATER menu can then be used to edit or review the data if desired.
A FEMWATER model can be created in GMS using one of two methods: assigning and editing values directly to the
nodes and elements of a mesh (the direct approach), or by constructing a grid-independent representation of the
model using feature objects and allowing GMS to automatically assign the values to the nodes and elements (the
conceptual model approach). Except for simple problems, the conceptual model approach is typically the most
effective.
The conceptual model approach utilizes feature objects in the Map module. A FEMWATER conceptual model is
created in the Map module and feature objects are used to create a high level representation of the site you are
modeling. The figure below shows a sample conceptual model.
Sample FEMWATER Conceptual Model
Two Step Process
A FEMWATER conceptual model is used to build a numerical model using a two step process. In the first step, a 3D
mesh is created. This can be done by using the feature objects in conjunction with a set of TINs to build a 3D Mesh
or a solid can be converted to a layered 3D Mesh using the Solids -> Layered Mesh command. In the second step,
the boundary conditions and recharge values assigned to the feature objects are automatically assigned to the
appropriate nodes and element faces of the 3D mesh using the Feature Objects | Map -> FEMWATER command.
To create a FEMWATER conceptual model right click on the Map Data folder in the Project Explorer and select the
New Conceptual Model command. In the Conceptual Model Properties dialog change the model type to
FEMWATER in the pull-down list. In the dialog the simulation options of flow and transport can also be toggled on
or off. Next create a coverage by right clicking on the FEMWATER conceptual model in the data tree and selecting
Building a FEMWATER Model
228
New Coverage. The coverage attributes can then be setup in the Coverage Setup dialog.
A FEMWATER coverage can contain points, arcs, and polygons. The points are used to define wells, the arcs are
used to define boundary conditions, and the polygons are used to define recharge zones. In most cases, a single
coverage is sufficient. However, multiple FEMWATER coverages can be used if desired.
More on point/arc properties here: FEMWATER Point / Arc Properties
Build a 3D Finite Element Mesh
Once the FEMWATER conceptual model is constructed, the next step is to use the conceptual model to build a 3D
finite element mesh. This is accomplished by first building a 2D mesh, then building the 3D mesh by extruding each
of the 2D elements in 3D elements.
Map -> 2D Mesh
The first step in building the 3D mesh is to select the Feature Objects |
Map -> 2D Mesh command. This command creates a 2D mesh by
automatically filling in the interior of the conceptual model with nodes
and elements. The size and spacing of the elements is controlled by the
spacing of the vertices on the arcs and by the refine point attribute
assigned to any wells in the interior of the conceptual model.
An example of the Map -> 2D Mesh command is shown in the
following figure. A sample FEMWATER conceptual model is shown
in part a. The 2D mesh resulting from execution of the Map -> 2D
Mesh command is shown in part b.
Converting a FEMWATER Conceptual Model
(a) Conceptual Model (b) 2D Mesh Created with
Map -> 2D Mesh Command (c) 3D Mesh Created
by Extruding 2D Mesh (d) 3D Mesh after Map ->
FEMWATER Command.
Creating the 3D Elements
Once the 2D mesh is created, the next step is to create the 3D mesh by extruding each of the 2D elements into a
series of 3D elements. The elevations of the 3D elements can be defined from a set of boreholes, a set of TINs, or a
set of Solids.
For sites with relatively simple stratigraphy, the Regions -> 3D Mesh command in the Borehole module can be used.
For sites with more complex stratigraphy, the TINs -> 3D Mesh command in the TIN module should be used.
A mesh can also be created using the Solids -> Layered Mesh command in the Solid module.
FEMWATER Conceptual Model Approach
FEMWATER Conceptual Model Approach
The preferred method for setting up a FEMWATER simulation is to use the feature object tools in the Map module
to define a FEMWATER conceptual model of a site being studied. The conceptual model is a high-level description
of the site including sources/sinks, the boundary of the domain to be modeled, rainfall and seepage zones, and
material zones within each of the layers. The conceptual model is defined with feature objects, including points, arcs,
and polygons, and is constructed independently of a numerical grid. Once the conceptual model is complete, a mesh
is automatically constructed to fit the conceptual model, and the FEMWATER data are converted from the
conceptual model to the nodes, elements, and element faces. The dialogs and interactive editing tools in the
FEMWATER menu can then be used to edit or review the data if desired.
A FEMWATER model can be created in GMS using one of two methods: assigning and editing values directly to the
nodes and elements of a mesh (the direct approach), or by constructing a grid-independent representation of the
model using feature objects and allowing GMS to automatically assign the values to the nodes and elements (the
conceptual model approach). Except for simple problems, the conceptual model approach is typically the most
effective.
The conceptual model approach utilizes feature objects in the Map module. A FEMWATER conceptual model is
created in the Map module and feature objects are used to create a high level representation of the site you are
modeling. The figure below shows a sample conceptual model.
Sample FEMWATER Conceptual Model
Two Step Process
A FEMWATER conceptual model is used to build a numerical model using a two step process. In the first step, a 3D
mesh is created. This can be done by using the feature objects in conjunction with a set of TINs to build a 3D Mesh
or a solid can be converted to a layered 3D Mesh using the Solids -> Layered Mesh command. In the second step,
the boundary conditions and recharge values assigned to the feature objects are automatically assigned to the
appropriate nodes and element faces of the 3D mesh using the Feature Objects | Map -> FEMWATER command.
To create a FEMWATER conceptual model right click on the Map Data folder in the Project Explorer and select the
New Conceptual Model command. In the Conceptual Model Properties dialog change the model type to
FEMWATER in the pull-down list. In the dialog the simulation options of flow and transport can also be toggled on
or off. Next create a coverage by right clicking on the FEMWATER conceptual model in the data tree and selecting
New Coverage. The coverage attributes can then be setup in the Coverage Setup dialog.
A FEMWATER coverage can contain points, arcs, and polygons. The points are used to define wells, the arcs are
used to define boundary conditions, and the polygons are used to define recharge zones. In most cases, a single
coverage is sufficient. However, multiple FEMWATER coverages can be used if desired.
More on point/arc properties here: FEMWATER Point / Arc Properties
229
FEMWATER Conceptual Model Approach
230
Build a 3D Finite Element Mesh
Once the FEMWATER conceptual model is constructed, the next step is to use the conceptual model to build a 3D
finite element mesh. This is accomplished by first building a 2D mesh, then building the 3D mesh by extruding each
of the 2D elements in 3D elements.
Map -> 2D Mesh
The first step in building the 3D mesh is to select the Feature Objects |
Map -> 2D Mesh command. This command creates a 2D mesh by
automatically filling in the interior of the conceptual model with nodes
and elements. The size and spacing of the elements is controlled by the
spacing of the vertices on the arcs and by the refine point attribute
assigned to any wells in the interior of the conceptual model.
An example of the Map -> 2D Mesh command is shown in the
following figure. A sample FEMWATER conceptual model is shown
in part a. The 2D mesh resulting from execution of the Map -> 2D
Mesh command is shown in part b.
Converting a FEMWATER Conceptual Model
(a) Conceptual Model (b) 2D Mesh Created with
Map -> 2D Mesh Command (c) 3D Mesh
Created by Extruding 2D Mesh (d) 3D Mesh after
Map -> FEMWATER Command.
Creating the 3D Elements
Once the 2D mesh is created, the next step is to create the 3D mesh by extruding each of the 2D elements into a
series of 3D elements. The elevations of the 3D elements can be defined from a set of boreholes, a set of TINs, or a
set of Solids.
For sites with relatively simple stratigraphy, the Regions -> 3D Mesh command in the Borehole module can be used.
For sites with more complex stratigraphy, the TINs -> 3D Mesh command in the TIN module should be used.
A mesh can also be created using the Solids -> Layered Mesh command in the Solid module.
FEMWATER Flows
FEMWATER Flows
Computed flows can be automatically summed and displayed for FEMWATER simulations. To enable this option,
the Save flux file option must be selected in the FEMWATER Output Control dialog prior to saving the
FEMWATER model. When this option is selected, FEMWATER saves a lumped nodal flow data set file as part of
the FEMWATER solution. This file is automatically read into GMS as part of the FEMWATER solution.
Once a FEMWATER flux file has been read into memory as part of a FEMWATER solution, the computed flux
through a set of nodes can be displayed simply by selecting the nodes. The flow budget (in, out, net) for the selected
nodes is displayed in the Status Bar at the bottom of the GMS window. The flow budget is only displayed if the
active solution is a FEMWATER solution.
It should be noted that lumped nodal fluxes are only non-zero for boundary nodes where a boundary condition has
been assigned.
Point Source/Sink BC
The Point Source/Sink BC command is used to assign a flow rate to a node. This option is typically used to assign
flow rates to interior nodes to simulate injection or extraction wells. When a point source/sink is first assigned to a
node, the node should be selected with the Select Nodes tool. The Point Source/Sink BC command is then selected
and the Point Source/Sink BC dialog appears. Both a flow rate and a concentration may be specified at a point
source/sink node. The values can be constant or transient.
Existing boundary conditions can be deleted by selecting the boundary condition with the Select Boundary Nodes,
Select Boundary Faces, or Select Wells tool and selecting the Delete BC command from the FEMWATER menu.
The Select Well Tool
When a point source/sink boundary condition is applied to a node, a well symbol is placed on the node. The Select
Wells tool can then be used to select the node rather than the Select Nodes tool whenever the well needs to be edited
or deleted. The Select Wells tool is easier to use than the Select Nodes tool when there are a large number of nodes
since it only selects nodes with point source/sink boundary conditions.
231
Assign Node/Face BC
Assign Node/Face BC
The Assign Node/Face BC command in the FEMWATER menu is used to either assign a new boundary condition or
edit an existing boundary condition to a selected set of boundary nodes or boundary element faces. The dialog that
appears depends on whether nodes or faces are selected.
Nodal Boundary Conditions
If a set of nodes is selected when the Assign Node/Face BC command is selected, the Node BC dialog appears.
Boundary conditions assigned to nodes correspond to Dirichlet boundary conditions. Both head and concentration
can be specified.
Head
Head boundary conditions in FEMWATER are assigned as total head. FEMWATER converts the total heads to
pressure heads internally. Heads can be specified as a constant value or as a transient value (curve of head vs. time).
The Load Data Set button can be used to assign the head values from a data set. For example, if the Elevation data
set is selected, the head is set equal to the node elevation at each of the selected nodes.
Concentration
The concentration can also be specified as either a constant or transient value. Since the concentration is a Dirichlet
boundary condition, it represents a fixed concentration at the node. It does not represent the concentration of the
incoming fluid.
Face Boundary Conditions
If a set of faces is selected when the Assign Node/Face BC command is selected, the Face BC dialog appears.
Boundary conditions assigned to faces are flux-type boundary conditions. Both flux and concentration can be
assigned independently. In both cases, the type must be designated as either Variable, Flux (Cauchy), or Flux
gradient (van Neumann). The value can be defined as a constant or transient value.
Existing boundary conditions can be deleted by selecting the boundary condition with the Select Boundary Nodes,
Select Boundary Faces, or Select Wells tool and selecting the Delete BC command from the FEMWATER menu.
232
FEMWATER Point / Arc Properties
233
FEMWATER Point / Arc Properties
Point Properties
Points in a FEMWATER coverage are used to define injection and extraction wells. The point attributes are edited
via the Point Properties dialog. The Point Attributes dialog is accessed by selecting a point(s) and then selecting the
Attribute Table command in the coverage right click option menu. Each point's properties are displayed in the
spreadsheet. The options in the dialog are as follows.
Type - The type of point can be changed to either a well or an observation point. These options are available
depending on what was selected in the Coverage Setup Dialog. The type for each point is defaulted to
"NONE" in the Type column pull-down list.
Refine - If the Refine mesh around point option is selected, the edge length of the elements surrounding the
node are set to the size entered in the Element size edit field when the 2D projection mesh is generated. (see:
Map -> 2D Mesh)
Wells - To define a point as a extraction or injection well change the Type to "well" in the spreadsheet. For
each well, a flow rate and a concentration can be assigned. Each well is also assigned a the top and bottom
elevation of the screened interval.
The screened interval is used to determine which of the nodes in the 3D mesh are used to represent the well in
the numerical model. When the Map -> FEMWATER command is selected, all nodes intercepted by the well
screen are found and each node is marked as a point source/sink (a well node). The flow assigned to the well
in the conceptual model is distributed to the mesh nodes using the logic illustrated below. A length of
influence on the well screen is found for each node and the flux assigned to the node is proportional to the
length of influence divided by the total screen length.
The Distribution of Flux Rate to Nodes Overlapped by Well
Screen.
Arc Properties
Arcs in a FEMWATER coverage are used to define the model boundary and the boundaries of recharge zones. Arcs
on the outside boundary of the model can also be used to specify boundary conditions. Boundary conditions are
assigned using the FEMWATER Arc Properties dialog. The Arc Properties dialog is accessed selecting the Attribute
Table command in the coverage right click option menu. The options for arc attributes are as follows:
Flow bc - The Flow bc option is used to define a specified head or specified flux boundary. If this option is
selected in the drop-down list. The available options are:
• Specified head - If this option is selected, a head value is assigned to each of the two nodes at the endpoints of
the arc. If the two values at the endpoints are different, the head is assumed to vary linearly along the arc
length. When the Map -> FEMWATER command is selected, all nodes on the boundary of the mesh beneath
the arc are found and the nodes are marked as specified head nodes. A linearly interpolated head value is
FEMWATER Point / Arc Properties
assigned to each node.
• Specified flux - If this option is selected, a flux value is assigned to the arc in the Flux rate column of the
spreadsheet. When the Map -> FEMWATER command is selected, all vertical element faces on the boundary
of the mesh beneath the arc are found and the specified flux rate is assigned to the faces.
• Variable flux - If this option is selected, a flux value is assigned to the arc. When the Map -> FEMWATER
command is selected, all vertical element faces on the boundary of the mesh beneath the arc are marked as
variable boundary faces. If a flux value of zero (the default value) is assigned, the element faces represent a
seepage face boundary where below the water table, the head is set equal to the elevation.
Contaminant - The Contaminant option is used to model concentration or mass flux boundary conditions.
This option is selected in the Transport bc column in the spreadsheet. The available options are:
Specified concentration - If this option is selected, a concentration value is assigned to the arc using the
Concentration flux column. When the Map -> FEMWATER command is selected, all mesh nodes on the
boundary of the mesh beneath the arc are found and the specified concentration is assigned to the nodes.
Specified mass flux - If this option is selected, a mass flux value is assigned to the arc using the Mass flux
column. When the Map -> FEMWATER command is selected, all vertical element faces on boundary of the
mesh beneath the arc are found and the specified mass flux rate is assigned to the faces.
Variable (concentration) - If this option is selected, a concentration value is assigned to the arc using the
Concentration column. When the Map -> FEMWATER command is selected, all element faces on the
boundary of the mesh beneath the arc are found and the specified concentration is assigned to the faces as a
variable type boundary condition. Note that this boundary condition can be used in conjunction with any of the
three options for specified head/fluid flux. The proper use of this type of boundary condition is explained in
the FEMWATER Reference Manual.
Assigning to Zones - The zone column is used to determine how the boundary conditions are applied to the
nodes and element faces when the Map -> FEMWATER command is selected. By default, the boundary
conditions are assigned to all nodes and element faces beneath the arc. However, in some cases it is useful to
restrict the boundary condition to only a portion of the vertical boundary beneath the arc. This can be
accomplished by selecting the Selected zones only option and marking the material zones where the boundary
condition is to be applied.
Node Properties - As explained in the previous section, if an arc is marked as a specified head arc, a head
value must be assigned to the two nodes at the endpoints of the arc. This is accomplished using the
FEMWATER Node Attributes dialog. The Arc Properties dialog is accessed by selecting a node and then
selecting the Attribute Table command in the coverage right click option menu. If the head values assigned to
the two endpoints of an arc are different, the head is assumed to vary linearly along the length of the arc.
Polygon Properties - Polygons in a FEMWATER coverage serve two purposes: they define the model
domain and they can be used to assign recharge values on a zonal basis. When building a FEMWATER
coverage, the boundary of the model domain should be delineated using arcs. In order to use the coverage to
build a 3D mesh, the arcs should be used to build one or more polygons defining the model domain using the
Build Polygon command.
In addition to defining the model domain, a material ID and a recharge value can be assigned to polygons in
the FEMWATER coverage using the Polygon Properties dialog. The polygon attributes are as follows:
Material - The Material pull-down list can be used to associate a material with a polygon. When the Map ->
2D Mesh command is selected, all 2D elements within the polygon are assigned the specified material. This
material can be used to define the material type for the 3D elements when the 2D elements are extruded using
the Fill Between TINs -> 3D Mesh command.
234
FEMWATER Point / Arc Properties
Fluid Flux - The Fluid flux option is used to assign a specified flux to the polygon. The flux can be assigned
using either the Specified flux or Variable flux options. These optins are set in the Flow bc drop-down list.
When the Map -> FEMWATER command is selected, all element faces on the top of the 3D mesh inside the
polygon are found and the specified flux is assigned to the element faces.
Contaminant - The Contaminant option is used to assign a mass flux or a concentration. If the Specified mass
flux option is selected, the specified mass flux rate is assigned to all element faces on the top of the mesh when
the Map -> FEMWATER command is selected. If the Variable (concentration) option is selected, the
specified concentration is assigned to all element faces inside the polygon.
FEMWATER Model Input
Several model parameters must be defined for a given FEMWATER simulation. In many cases the default values
suffice. The following is a list of the required parameters:
Titles
The Titles command in the FEMWATER menu is used to enter two sets of titles. Each set contains three lines of text.
The first set is written to the top of the geometry file when the simulation is saved. The second set is written to the
top of the model file.
• Run Options - This command in the FEMWATER menu brings up the Run Options dialog. This dialog is used to
enter a set of general analysis options.
Type of Simulation - Three options are available for designating the type of simulations to be performed by
FEMWATER:
Flow only - This option is used to perform a steady state or transient flow simulation.
Perform a transport simulation only - For this case, a steady state or transient flow simulation must be
performed prior to the transport simulation. The results of this simulation (velocity and moisture
content) are then input to FEMWATER as a flow solution initial condition.
Coupled flow and transport - With a coupled flow and transport simulation, either density-dependent
flow or density-independent flow can be simulated. This option is controlled by entering the appropriate
parameters defining the relationship between concentration and density and concentration and viscosity.
These parameters are entered in the Fluid Properties dialog.
Steady State vs. Transient - FEMWATER can be run in either a steady state or transient mode. The steady
state mode is only allowed when the Flow only option has been selected.
Units - The Units button brings up the Units dialog. This dialog is used to enter the units for length, time,
concentration, etc. for the simulation. GMS uses the selected unit options to display the appropriate units next
to each input edit field in the other FEMWATER dialogs.
Other Options - The remaining run options are described in the FEMWATER Reference Manual. In most
cases, the default values are appropriate.
• FEMWATER Initial Conditions
235
FEMWATER Model Input
236
Iteration Parameters
Brings up the Iteration Parameters dialog. This dialog is used to enter the iteration parameters for each simulation
type (flow only, transport only, coupled flow and transport).
Particle Tracking Parameters
The Particle Tracking dialog is used to edit parameters relating to how the particle tracking is carried out by
FEMWATER during the transport phase.
Time Control Parameters
The Time Control dialog is used to enter the data used by
FEMWATER to compute the computational time intervals. It is also
used to define the reference time. The options in the dialog are as
follows:
Time Steps
Time-Line Of Computational Time Steps Defined
Using the Variable Time Step Option and the XY
Series Editor.
There are two methods for defining the computational time steps:
Constant time step and Variable time step. With the Constant time step
method, the first time step is assumed to begin at time 0.0. A constant
interval time is entered along with a maximum simulation time. For example, if a constant time step of 2.0 is defined
along with a maximum simulation time of 10.0, six computational time steps will be defined at 0.0 (the initial
condition), 2.0, 4.0, 6.0, 8.0 and 10.0.
The Variable time step option permits variable intervals between time steps. Selecting the Variable Times button
brings up the XY Series Editor. The XY Series Editor has one column for entering times and another for entering
time steps. In the time column, the absolute time for a computational time step should be entered. The time step
corresponding to each time represents the interval to be used from one specified time to the next.
A simple example of times and time steps defined in the XY Series Editor and the resulting computational time steps
to be used by FEMWATER is shown below. In this case the maximum simulation time is equal to 48.0.
Output Control
The Output Control dialog is used to enter parameters defining what type of output will be printed or saved from
FEMWATER.
Printed Output File
The left side of the dialog controls what information is written to the printed output file. The printed output file is an
ASCII file where the solution will be written.
Data Set Files
The results of a FEMWATER solution are GMS data set files. The Data set files portion of the dialog permits
specification of what data sets will be saved and at what frequency. The solution data set files are used as input to
GMS to graphically visualize the results. ASCII or binary solution file formats may also be specified. In most
circumstances, binary solution files should be specified, since they take up less memory and can be read more
quickly by GMS.
FEMWATER Model Input
237
Fluid Properties
The Fluid Properties command in the FEMWATER menu brings up the Fluid Properties dialog. This dialog is used
to specify the acceleration of gravity and the density, viscosity, and compressibility of the fluid.
The Edit Values button brings up the FEMWATER Fluid Coefficients dialog. This button is undimmed when
transport is being analyzed as part of the simulation.
Material Properties
As a 3D finite element mesh is constructed in GMS, a list of materials is defined and each element in the 3D mesh
has a material type associated with it. The list of materials is initially created using the Materials dialog accessed
through the Edit menu.
• Kxx, Kyy, Kzz, Kxy, Kxz, Kyz - The hydraulic conductivity tensor is defined via the Kxx, Kyy, Kzz, Kxy, Kxz,
Kyz fields. Since the tensor is symmetric only the upper right half of the matrix can be specified.
Hydraulic Conductivity Tensor
Kxx Kxy Kxz
Kyx Kyy Kyz
Kzx Kzy Kzz
• Moisture Content, Relative Conductivity, Water Capacity curves - These unsaturated zone curves must be defined
for each material. The curves can be defined using either the XY Series Editor or the Curve Generator (discussed
below). The Curve Generator is accessed via the Generate Unsat Curves button in the bottom of the dialog.
When that button is selected, the curves that are generated will be associated with the active material, or the
material in the spreadsheet row that currently has the focus.
Curve Generator
In most cases, the simplest way to generate a set of pressure head curves for the unsaturated zone is to use the Curve
Generator. The Generate Unsat Curves button brings up the Curve Generator dialog. This dialog is used to
automatically generate a set of unsaturated zone curves using the van Genuchten equations described in the
FEMWATER Reference Manual. The items in the top of the dialog are used to select the curve type ('linear front' or
'van Genuchten equation') and the max height of capillary rise above the water table. Two methods are available for
entering the Van Genuchten parameters: (1) you can select the Manual parameter input option and enter the values
directly, or (2) you can select the Preset parameter values option and choose from a list of pre-defined soil types.
Once the parameters are defined the Compute Curves button can be used to generate a set of curves. The curves are
displayed in the bottom of the dialog. New values can be entered and the process can be repeated until a satisfactory
result is obtained. When the OK button is selected, the active curves are assigned to the current material.
Each of the unsaturated zone curves is a piece-wise linear curve defined by a sequence of points. The number of
points in each curve is either specified by the user or determined automatically by specifying a Max percent change.
If the max percent change option is used, a new point is added to the curve each time the parameter changes by the
Max percent value.
Note that the effective porosity for each material is defined from the pressure head vs. moisture content curve. The
value at p = 0 is taken from the curve and is written to the model file as part of the MP2 card.
Note also that GMS assumes that the van Genuchten 'alpha' value is entered in units consistent with the current
model units. GMS displays the current model units next to the input field to help you remember this.
FEMWATER Initial Conditions
FEMWATER Initial Conditions
Whenever a FEMWATER analysis is performed, a set of initial conditions must be defined. Initial conditions define
the initial status of the pressure head and concentration. Three types of initial conditions are possible for a
FEMWATER simulation: cold starts, hot starts, and flow solutions. Cold starts are used to establish a set of initial
values at the beginning of a steady state or transient simulation. Hot starts are used to continue a previous run of
FEMWATER without having to start over from the beginning. Flow solutions are used to define the flow field that is
necessary when performing a transport only simulation (as opposed to coupled flow and transport). Initial conditions
are described in more detail in Chapter 7 of the FEMWATER Reference Manual.
Initial conditions are defined using the Initial Conditions dialog. The available options are as follows:
Cold Starts
If a flow only simulation is performed, a set of pressure heads is required for the cold start initial condition. If a
transport only simulation is performed, a set of concentrations is required (in addition to the flow solution as
explained below). If a coupled flow and transport simulation is being performed, both heads and concentrations are
required.
Pressure Head
Two options are available for designating a pressure head cold start initial condition. One option is to enter a
constant value into the field labeled Total head. This essentially defines an initial condition corresponding to a flat
water table. FEMWATER reads this value and internally generates an array of pressure heads by subtracting the
nodal elevations from the given total head value.
The Read from data set file option can be used to designate that the pressure head varies spatially and that the values
will be read from a data set file. If this option is selected, the name of the file must be entered at the bottom of the
Initial Conditions dialog in the field titled IC pressure head. The data set file is a standard GMS data set file in either
the ASCII or binary format. The data set file can be generated using the interpolation options and then saved using
the Export Data Set command accessed by right-clicking on the data set file. However, a simpler approach to
generating a well-posed initial condition is to use the Generate I.C. button. This button brings up the Generate
Pressure Head Initial Condition dialog.
The first two items in the Generate Pressure Head Initial Condition dialog are used to select a 2D scatter point set
and data set. The scatter point set defines a set of elevations corresponding to a best estimate of the final computed
water table elevation. A minimum pressure head may also be entered. When the OK button is selected, the
elevations in the scatter point set are interpolated to the nodes of the 3D mesh. This defines a total head initial
condition. The pressure head initial condition is computed by subtracting the node elevations from the total heads.
The user is then prompted for a file name and the pressure head data set is saved to a GMS data set file and the path
to the file is automatically written to the IC pressure head field at the bottom of the Initial Conditions dialog.
The pressure head cold start can have a significant influence on the speed of convergence. In some cases, a poorly
defined initial condition may even prevent convergence. In most cases, the Read from data set file/Generate IC
option should be used since it results in a better initial condition.
238
FEMWATER Initial Conditions
Concentration
When defining a set of concentration values for a cold start initial condition, it is often useful to use a constant value
of concentration everywhere in the problem domain. For example, in many cases, an initial condition of zero
concentration everywhere in the problem domain is appropriate. The Use constant value option can be used to easily
define a constant concentration for the entire mesh. If a constant value is not appropriate, the Read from data set file
option should be chosen. In this case, the initial condition varies spatially and the values are defined by a data set
file. This file can be created by interpolating concentrations to the mesh and saving the resulting data set to a file
using the Export command in the Data Tree. When this option is chosen, the name of the data set file containing the
concentration initial condition is entered in the IC Concentration field at the bottom of the Initial Conditions dialog.
Hot Start
Hot starts are used to begin a new simulation starting at a given time step of a solution computed from a previous
transient simulation. If the hot start option is chosen, FEMWATER reads the specified hot start file and finds the
time step corresponding to the specified time. The solution then begins using the data set at that time as the initial
condition.
The solution files necessary for a hot start depend on the type of simulation. If a flow only simulation is being
performed, a pressure head file is required. If a transport only simulation is being performed, a concentration file is
required (in addition to the flow solution described below). If a coupled flow and transport simulation is being
performed, both pressure head and concentration are required. When the Hot start option is chosen, the names of the
files used for the hot start are entered in the fields at the bottom of the Initial Conditions dialog.
If the Hot start option is chosen, the Append to moisture content file and Append to velocity file options may be
selected. If these options are selected, the name of previously computed moisture content and velocity files can be
specified in the FEMWATER super file. The file can be edited using a text editor. The super file format is described
in the FEMWATER Reference Manual. FEMWATER opens these files and appends the new moisture content and
velocity values to the files after the designated hot start time.
Initial Condition File Format
For both the cold and hot start options, data set files can be used to specify the initial conditions. These files can be
saved in either ASCII or binary. The format of the files can be specified in the Initial condition file format section.
All initial condition files should be either ASCII or binary, i.e., the types cannot be mixed for a given simulation. If
the Generate IC button is used to create the pressure head file, the ASCII option should be selected.
Flow Files
A third type of initial condition is required when a transport only simulation is being performed. A transport only
simulation utilizes a previously computed flow solution (steady state or transient) to define the three-dimensional
flow field required to properly model the contaminant migration. The flow solution consists of a pressure head file.
The flow solution for a transport only simulation is used in combination with either a cold start or a hot start. With a
cold start, a set of initial concentration values is provided for concentration in addition to the steady state or transient
flow solution. With a hot start, a transient concentration solution and a hot start time is provided in addition to the
flow solution.
When a transport only option is selected, the name of the pressure head file from the flow solution is entered at the
bottom of the Initial Conditions dialog. The Flow file format options in the Initial Conditions dialog are used to
specify whether these files are ASCII or binary, and whether they are steady state or transient.
239
Saving a FEMWATER Simulation
Saving a FEMWATER Simulation
Once a FEMWATER simulation has been set up and checked for errors, the final step before running the model is to
save the simulation. FEMWATER simulations are saved using the Save and Save As commands in the File menu.
Selecting the Save command saves the GMS project including the model simulation. By default the model
simulation will be saved to the same location as the GMS project. However, in the Save dialog the path for the model
simulation can be specified.
A FEMWATER simulation is actually saved to a set of input files. The FEMWATER super file is a special type of
file which is used to organize the set of files used in a simulation. The names of all of the input and output files
associated with a simulation are saved in the super file. When FEMWATER is launched, the name of the super file is
automatically passed to the FEMWATER executable.
When a FEMWATER simulation is saved, the names of the other FEMWATER input files are automatically
patterned after the name of the super file. For example, if the super file is named sampmod.fws, the other files are
named sampmod.geo, sampmod.3bc, etc.
Geometry File Options
When a FEMWATER simulation is saved using the Save or Save As command, all data associated with the
simulation is saved to disk, including both the mesh geometry and the boundary conditions. For large FEMWATER
models, the mesh file can take up a substantial amount of disk space and take a long time to save. During a model
exercise, it is often the case that multiple versions of the simulation are saved to disk where the only change from
one simulation to the next is changes in the analysis options or boundary conditions. In such cases, both time and
disk space can be saved by re-using the same geometry file from one run to the next. This can be accomplished by
first saving a copy of the FEMWATER simulation to disk and then selecting the Geometry File command in the
FEMWATER menu. This command brings up the Geometry File dialog. If the Use existing geometry file option is
selected, the Browse button can be used to identify the previously saved geometry file. Once this option is selected,
each time GMS saves the FEMWATER super file, it does not re-save the geometry file. Rather, it saves the path to
the specified geometry file.
240
241
6.1.2. FEMWATER Post-Processing
FEMWATER Display Options
The properties of all FEMWATER boundary conditions that GMS displays on the screen can be controlled through
the FEMWATER tab of the Display Options dialog. This dialog is opened by right clicking on the
3D Mesh Data
entry in the Project Explorer, selecting the Display Options command, and then selecting the FEMWATER tab. This
tab is only visible when there is a FEMWATER simulation. It can also be accessed from the from the Display menu,
the FEMWATER menu, or the
Display Options macro. The following table describes the display options available
for the FEMWATER model.
Display Option
Description
Well
Controls the display of well boundary conditions. The symbol, symbol size, and symbol color can be adjusted using the button
to the left of the display toggle.
Well (super pump
node)
Controls the display of well super pump nodes boundary conditions. The fill color can be adjusted using the button to the left
of the display toggle.
Well conc.
Controls the display of well concentration boundary conditions. The symbol, symbol size, and symbol color can be adjusted
using the button to the left of the display toggle.
Variable
Controls the display of variable boundary conditions. The symbol, symbol size, and symbol color can be adjusted using the
button to the left of the display toggle.
Variable conc.
Controls the display of variable concentration boundary conditions. The symbol, symbol size, and symbol color can be
adjusted using the button to the left of the display toggle.
Head
Controls the display of head boundary conditions. The symbol, symbol size, and symbol color can be adjusted using the button
to the left of the display toggle.
Head conc.
Controls the display of head concentration boundary conditions. The symbol, symbol size, and symbol color can be adjusted
using the button to the left of the display toggle.
Flux
Controls the display of flux boundary conditions. The symbol, symbol size, and symbol color can be adjusted using the button
to the left of the display toggle.
Flux conc.
Controls the display of flux concentration boundary conditions. The symbol, symbol size, and symbol color can be adjusted
using the button to the left of the display toggle.
Grad. flux.
Controls the display of gradient flux boundary conditions. The symbol, symbol size, and symbol color can be adjusted using
the button to the left of the display toggle.
Grad. flux. conc.
Controls the display of gradient flux concentration boundary conditions. The symbol, symbol size, and symbol color can be
adjusted using the button to the left of the display toggle.
BC values
Controls the display of boundary condition values. The font, font size, and font color can be adjusted using the button to the
left of the display toggle.
Display symbol
legend
Controls the display of a legend containing the symbols for the boundary conditions used in the FEMWATER simulation.
Check All
By clicking this button, all of the display options are turned on.
Check None
By clicking this button, all of the display options are turned off.
FEMWATER Post Processing Viewing Options
FEMWATER Post Processing Viewing Options
Part of the output from FEMWATER is a set of files representing velocity, moisture content, pressure head, and
concentration. These files are written in the standard GMS data set file format and can be imported directly to GMS
using the Read Solution command in the FEMWATER menu.
Once the FEMWATER solution data sets have been imported to GMS, the standard GMS visualization tools can be
used to generate vector plots, cross sections, iso-surfaces, and animations.
One of the output options for FEMWATER is a flux file containing flow budget data for boundary nodes. Once this
file is imported, FEMWATER fluxes for selected nodes can be viewed.
Particle Tracking
Particle tracking can be done with a FEMWATER solution, similar to using MODPATH to do particle tracking with
a MODFLOW solution. For more information:
• FEMWATER Particle Sets
Flow / Flux
Computed flows can be automatically summed and displayed for FEMWATER simulations. To enable this option,
the Save flux file option must be selected in the FEMWATER Output Control dialog prior to saving the
FEMWATER model. When this option is selected, FEMWATER saves a lumped nodal flow data set file as part of
the FEMWATER solution. This file is automatically read into GMS as part of the FEMWATER solution.
Once a FEMWATER flux file has been read into memory as part of a FEMWATER solution, the computed flux
through a set of nodes can be displayed simply by selecting the nodes. The flow budget (in, out, net) for the selected
nodes is displayed in the Status Bar at the bottom of the GMS window. The flow budget is only displayed if the
active solution is a FEMWATER solution.
It should be noted that lumped nodal fluxes are only non-zero for boundary nodes where a boundary condition has
been assigned.
242
FEMWATER Particle Sets
243
FEMWATER Particle Sets
Particle tracking can be done with a FEMWATER solution, similar to using MODPATH to do particle tracking with
a MODFLOW solution. Particle starting locations can be automatically generated at wells, or at element or element
face centroids by using the the commands in the Particle Tracking menu. Once the starting locations are created, the
pathlines are automatically computed. Particles are grouped into particle sets, just like with MODPATH.
Restrictions
In order to compute the pathlines, the FEMWATER solution must contain nodal velocity, and nodal moisture
content data sets. You can tell FEMWATER to create these data sets using the Output Control dialog. Also, the
effective porosity ratio for all materials must be non-zero.
Particle tracking is steady state only. That is, the particles are only influenced by the active time step.
Particles are currently not tracked correctly through hexahedron elements. If you refine the hex elements to create
wedges, the particles will be tracked correctly.
Display Options
A set of display options associated with FEMWATER particle tracking is provided in GMS. These options are
accessed through the Display Options command in the Particle Tracking menu. This command is only available if a
FEMWATER simulation exists. This command brings up the Particles tab of the 3D Mesh Display Options dialog.
The following table describes the display options available for the particle tracking.
Display Option
Description
Starting locations
The starting locations for the particles can be turned on and off. The symbol style, color and size can also be adjusted.
Starting location
indices
The starting locations indices for the particles can be turned on and off. The font style, color and size can also be adjusted.
Ending locations
The ending locations for the particles can be turned on and off. The symbol style, color and size can also be adjusted.
Pathlines
The pathlines can be toggled on and off, and the pathline style and color can be adjusted. The pathline color can be set to the
default color, or the color corresponding to the starting or ending zone codes of the pathlines.
Direction arrows
Direction arrows can be displayed along the pathlines. The size of the arrow heads can be set by specifying the Length in
pixels. The arrows are displayed along the pathline at an interval corresponding to the Length specified.
Auto-update
The auto-update can be turned off and on, and controls the automatic updating of the particles.
244
6.2. MODAEM
MODAEM
MODAEM is an analytic element model developed by Vic Kelson of Wittman Hydro Planning Associates (WHPA)
of Bloomington, Indiana. The key feature of analytic element models is that they do not require the discretization of
the interior of the model domain into cells and elements as is the case with finite difference and finite element
models. Rather, the model is defined by “analytic elements” representing line sources and sinks such as rivers and
drains or specified head and specified flow boundaries. Wells are also represented as points, and recharge and
aquifer properties can be defined on polygons. MODAEM then formulates a set of equations based on these entities
and the equations can be solved for any location in the horizontal plane.
MODAEM is perfectly suited for the conceptual model approach used by GMS since the input data to MODAEM is
consistent with the GIS feature objects (points, arcs, and polygons) used to define a GMS conceptual model. In other
words, once a MODAEM conceptual model is defined, the model can be immediately executed. There is no need to
build a grid or mesh. A background grid is utilized for displaying the MODAEM results using contour lines.
However, the background grid is purely for visualization purposes and has nothing to do with the accuracy of the
model. MODAEM also supports particle tracking/streamlines.
One of the caveats of the analytical element approach is that a simplified representation of the aquifer must be used.
The aquifer properties (K, porosity, bottom elevation, aquifer thickness) can be assigned to polygons, but they are
assumed to be constant within each polygon. Currently MODAEM supports steady, confined and unconfined
two-dimensional groundwater flow, although streamlines are computed in three dimensions.
Linking MODAEM and MODFLOW
GMS also includes a feature to link MODAEM models with MODFLOW models. The main application of this
linkage is for defining boundary conditions for a local scale model. A regional model can be built with MODAEM
and then linked to a local scale MODFLOW model. This is accomplished as follows:
1. Build and calibrate the regional scale model using MODFLOW.
2. Build a conceptual model for the local scale MODFLOW model. When setting up the coverage properties for the
source/sink coverages, be sure to toggle on the MODAEM Head and Observed Flow options in the
Source/Sink/BC's list. If you have more than one MODAEM model in your project, you will also need to select
which model should be linked to the MODFLOW model using the MODAEM models combo box at the bottom
of the Coverage Setup dialog.
3. Mark the boundaries (or at least the upstream and downstream boundaries) of the MODFLOW conceptual model
as MODAEM Head boundaries.
At this point, whenever the Map->MODFLOW command is executed, GMS will automatically launch the
MODAEM model and calculate a head value for each grid cell coinciding with the MODAEM Head boundary.
Furthermore, a flow value is computed for the boundary using MODAEM and assigned to the MODFLOW
boundary as an observed head. This makes it possible to monitor the flow budget across the boundary to ensure that
the changes made to the local scale model (insertion of remedial wells, etc.) do not violate the flow conditions
inherited from the regional scale model.
MODAEM
MODAEM Output File
When MODAEM is executed, it generates an HTML formatted text output file. If the execution is successfully
completed, an icon will appear under the corresponding MODAEM conceptual model in the Data Tree representing
the output file. Double-clicking on this icon loads the output file into the default web browser.
MODAEM Links
• MODAEM License Agreement
• MODAEM Display Options
MODAEM License Agreement
GNU GENERAL PUBLIC LICENSE
Version 2, June 1991
Copyright (C) 1989, 1991 Free Software Foundation, Inc.
59 Temple Place, Suite 330, Boston, MA 02111-1307 USA
Everyone is permitted to copy and distribute verbatim copies
of this license document, but changing it is not allowed.
Preamble
The licenses for most software are designed to take away your
freedom to share and change it. By contrast, the GNU General Public
License is intended to guarantee your freedom to share and change free
software--to make sure the software is free for all its users. This
General Public License applies to most of the Free Software
Foundation's software and to any other program whose authors commit to
using it. (Some other Free Software Foundation software is covered by
the GNU Library General Public License instead.) You can apply it to
your programs, too.
When we speak of free software, we are referring to freedom, not
price. Our General Public Licenses are designed to make sure that you
have the freedom to distribute copies of free software (and charge for
this service if you wish), that you receive source code or can get it
if you want it, that you can change the software or use pieces of it
in new free programs; and that you know you can do these things.
To protect your rights, we need to make restrictions that forbid
anyone to deny you these rights or to ask you to surrender the rights.
These restrictions translate to certain responsibilities for you if you
distribute copies of the software, or if you modify it.
For example, if you distribute copies of such a program, whether
gratis or for a fee, you must give the recipients all the rights that
you have. You must make sure that they, too, receive or can get the
245
MODAEM License Agreement
source code. And you must show them these terms so they know their
rights.
We protect your rights with two steps: (1) copyright the software, and
(2) offer you this license which gives you legal permission to copy,
distribute and/or modify the software.
Also, for each author's protection and ours, we want to make certain
that everyone understands that there is no warranty for this free
software. If the software is modified by someone else and passed on, we
want its recipients to know that what they have is not the original, so
that any problems introduced by others will not reflect on the original
authors' reputations.
Finally, any free program is threatened constantly by software
patents. We wish to avoid the danger that redistributors of a free
program will individually obtain patent licenses, in effect making the
program proprietary. To prevent this, we have made it clear that any
patent must be licensed for everyone's free use or not licensed at all.
The precise terms and conditions for copying, distribution and
modification follow.
GNU GENERAL PUBLIC LICENSE
TERMS AND CONDITIONS FOR COPYING, DISTRIBUTION AND MODIFICATION
0. This License applies to any program or other work which contains
a notice placed by the copyright holder saying it may be distributed
under the terms of this General Public License. The "Program", below,
refers to any such program or work, and a "work based on the Program"
means either the Program or any derivative work under copyright law:
that is to say, a work containing the Program or a portion of it,
either verbatim or with modifications and/or translated into another
language. (Hereinafter, translation is included without limitation in
the term "modification".) Each licensee is addressed as "you".
Activities other than copying, distribution and modification are not
covered by this License; they are outside its scope. The act of
running the Program is not restricted, and the output from the Program
is covered only if its contents constitute a work based on the
Program (independent of having been made by running the Program).
Whether that is true depends on what the Program does.
1. You may copy and distribute verbatim copies of the Program's
source code as you receive it, in any medium, provided that you
conspicuously and appropriately publish on each copy an appropriate
copyright notice and disclaimer of warranty; keep intact all the
246
MODAEM License Agreement
notices that refer to this License and to the absence of any warranty;
and give any other recipients of the Program a copy of this License
along with the Program.
You may charge a fee for the physical act of transferring a copy, and
you may at your option offer warranty protection in exchange for a fee.
2. You may modify your copy or copies of the Program or any portion
of it, thus forming a work based on the Program, and copy and
distribute such modifications or work under the terms of Section 1
above, provided that you also meet all of these conditions:
a) You must cause the modified files to carry prominent notices
stating that you changed the files and the date of any change.
b) You must cause any work that you distribute or publish, that in
whole or in part contains or is derived from the Program or any
part thereof, to be licensed as a whole at no charge to all third
parties under the terms of this License.
c) If the modified program normally reads commands interactively
when run, you must cause it, when started running for such
interactive use in the most ordinary way, to print or display an
announcement including an appropriate copyright notice and a
notice that there is no warranty (or else, saying that you provide
a warranty) and that users may redistribute the program under
these conditions, and telling the user how to view a copy of this
License. (Exception: if the Program itself is interactive but
does not normally print such an announcement, your work based on
the Program is not required to print an announcement.)
These requirements apply to the modified work as a whole. If
identifiable sections of that work are not derived from the Program,
and can be reasonably considered independent and separate works in
themselves, then this License, and its terms, do not apply to those
sections when you distribute them as separate works. But when you
distribute the same sections as part of a whole which is a work based
on the Program, the distribution of the whole must be on the terms of
this License, whose permissions for other licensees extend to the
entire whole, and thus to each and every part regardless of who wrote it.
Thus, it is not the intent of this section to claim rights or contest
your rights to work written entirely by you; rather, the intent is to
exercise the right to control the distribution of derivative or
collective works based on the Program.
In addition, mere aggregation of another work not based on the Program
247
MODAEM License Agreement
with the Program (or with a work based on the Program) on a volume of
a storage or distribution medium does not bring the other work under
the scope of this License.
3. You may copy and distribute the Program (or a work based on it,
under Section 2) in object code or executable form under the terms of
Sections 1 and 2 above provided that you also do one of the following:
a) Accompany it with the complete corresponding machine-readable
source code, which must be distributed under the terms of Sections
1 and 2 above on a medium customarily used for software interchange; or,
b) Accompany it with a written offer, valid for at least three
years, to give any third party, for a charge no more than your
cost of physically performing source distribution, a complete
machine-readable copy of the corresponding source code, to be
distributed under the terms of Sections 1 and 2 above on a medium
customarily used for software interchange; or,
c) Accompany it with the information you received as to the offer
to distribute corresponding source code. (This alternative is
allowed only for noncommercial distribution and only if you
received the program in object code or executable form with such
an offer, in accord with Subsection b above.)
The source code for a work means the preferred form of the work for
making modifications to it. For an executable work, complete source
code means all the source code for all modules it contains, plus any
associated interface definition files, plus the scripts used to
control compilation and installation of the executable. However, as a
special exception, the source code distributed need not include
anything that is normally distributed (in either source or binary
form) with the major components (compiler, kernel, and so on) of the
operating system on which the executable runs, unless that component
itself accompanies the executable.
If distribution of executable or object code is made by offering
access to copy from a designated place, then offering equivalent
access to copy the source code from the same place counts as
distribution of the source code, even though third parties are not
compelled to copy the source along with the object code.
4. You may not copy, modify, sublicense, or distribute the Program
except as expressly provided under this License. Any attempt
otherwise to copy, modify, sublicense or distribute the Program is
void, and will automatically terminate your rights under this License.
248
MODAEM License Agreement
However, parties who have received copies, or rights, from you under
this License will not have their licenses terminated so long as such
parties remain in full compliance.
5. You are not required to accept this License, since you have not
signed it. However, nothing else grants you permission to modify or
distribute the Program or its derivative works. These actions are
prohibited by law if you do not accept this License. Therefore, by
modifying or distributing the Program (or any work based on the
Program), you indicate your acceptance of this License to do so, and
all its terms and conditions for copying, distributing or modifying
the Program or works based on it.
6. Each time you redistribute the Program (or any work based on the
Program), the recipient automatically receives a license from the
original licensor to copy, distribute or modify the Program subject to
these terms and conditions. You may not impose any further
restrictions on the recipients' exercise of the rights granted herein.
You are not responsible for enforcing compliance by third parties to
this License.
7. If, as a consequence of a court judgment or allegation of patent
infringement or for any other reason (not limited to patent issues),
conditions are imposed on you (whether by court order, agreement or
otherwise) that contradict the conditions of this License, they do not
excuse you from the conditions of this License. If you cannot
distribute so as to satisfy simultaneously your obligations under this
License and any other pertinent obligations, then as a consequence you
may not distribute the Program at all. For example, if a patent
license would not permit royalty-free redistribution of the Program by
all those who receive copies directly or indirectly through you, then
the only way you could satisfy both it and this License would be to
refrain entirely from distribution of the Program.
If any portion of this section is held invalid or unenforceable under
any particular circumstance, the balance of the section is intended to
apply and the section as a whole is intended to apply in other
circumstances.
It is not the purpose of this section to induce you to infringe any
patents or other property right claims or to contest validity of any
such claims; this section has the sole purpose of protecting the
integrity of the free software distribution system, which is
implemented by public license practices. Many people have made
249
MODAEM License Agreement
generous contributions to the wide range of software distributed
through that system in reliance on consistent application of that
system; it is up to the author/donor to decide if he or she is willing
to distribute software through any other system and a licensee cannot
impose that choice.
This section is intended to make thoroughly clear what is believed to
be a consequence of the rest of this License.
8. If the distribution and/or use of the Program is restricted in
certain countries either by patents or by copyrighted interfaces, the
original copyright holder who places the Program under this License
may add an explicit geographical distribution limitation excluding
those countries, so that distribution is permitted only in or among
countries not thus excluded. In such case, this License incorporates
the limitation as if written in the body of this License.
9. The Free Software Foundation may publish revised and/or new versions
of the General Public License from time to time. Such new versions will
be similar in spirit to the present version, but may differ in detail to
address new problems or concerns.
Each version is given a distinguishing version number. If the Program
specifies a version number of this License which applies to it and "any
later version", you have the option of following the terms and conditions
either of that version or of any later version published by the Free
Software Foundation. If the Program does not specify a version number of
this License, you may choose any version ever published by the Free Software
Foundation.
10. If you wish to incorporate parts of the Program into other free
programs whose distribution conditions are different, write to the author
to ask for permission. For software which is copyrighted by the Free
Software Foundation, write to the Free Software Foundation; we sometimes
make exceptions for this. Our decision will be guided by the two goals
of preserving the free status of all derivatives of our free software and
of promoting the sharing and reuse of software generally.
NO WARRANTY
11. BECAUSE THE PROGRAM IS LICENSED FREE OF CHARGE, THERE IS NO WARRANTY
FOR THE PROGRAM, TO THE EXTENT PERMITTED BY APPLICABLE LAW. EXCEPT WHEN
OTHERWISE STATED IN WRITING THE COPYRIGHT HOLDERS AND/OR OTHER PARTIES
PROVIDE THE PROGRAM "AS IS" WITHOUT WARRANTY OF ANY KIND, EITHER EXPRESSED
OR IMPLIED, INCLUDING, BUT NOT LIMITED TO, THE IMPLIED WARRANTIES OF
MERCHANTABILITY AND FITNESS FOR A PARTICULAR PURPOSE. THE ENTIRE RISK AS
250
MODAEM License Agreement
TO THE QUALITY AND PERFORMANCE OF THE PROGRAM IS WITH YOU. SHOULD THE
PROGRAM PROVE DEFECTIVE, YOU ASSUME THE COST OF ALL NECESSARY SERVICING,
REPAIR OR CORRECTION.
12. IN NO EVENT UNLESS REQUIRED BY APPLICABLE LAW OR AGREED TO IN WRITING
WILL ANY COPYRIGHT HOLDER, OR ANY OTHER PARTY WHO MAY MODIFY AND/OR
REDISTRIBUTE THE PROGRAM AS PERMITTED ABOVE, BE LIABLE TO YOU FOR DAMAGES,
INCLUDING ANY GENERAL, SPECIAL, INCIDENTAL OR CONSEQUENTIAL DAMAGES ARISING
OUT OF THE USE OR INABILITY TO USE THE PROGRAM (INCLUDING BUT NOT LIMITED
TO LOSS OF DATA OR DATA BEING RENDERED INACCURATE OR LOSSES SUSTAINED BY
YOU OR THIRD PARTIES OR A FAILURE OF THE PROGRAM TO OPERATE WITH ANY OTHER
PROGRAMS), EVEN IF SUCH HOLDER OR OTHER PARTY HAS BEEN ADVISED OF THE
POSSIBILITY OF SUCH DAMAGES.
END OF TERMS AND CONDITIONS
How to Apply These Terms to Your New Programs
If you develop a new program, and you want it to be of the greatest
possible use to the public, the best way to achieve this is to make it
free software which everyone can redistribute and change under these terms.
To do so, attach the following notices to the program. It is safest
to attach them to the start of each source file to most effectively
convey the exclusion of warranty; and each file should have at least
the "copyright" line and a pointer to where the full notice is found.
}}--> This is free software, and you are welcome to redistribute it
under certain conditions; type `show c' for details.
The hypothetical commands `show w' and `show c' should show the appropriate
parts of the General Public License. Of course, the commands you use may
be called something other than `show w' and `show c'; they could even be
mouse-clicks or menu items--whatever suits your program.
You should also get your employer (if you work as a programmer) or your
school, if any, to sign a "copyright disclaimer" for the program, if
necessary. Here is a sample; alter the names:
Yoyodyne, Inc., hereby disclaims all copyright interest in the program
`Gnomovision' (which makes passes at compilers) written by James Hacker.
, 1 April 1989
Ty Coon, President of Vice
This General Public License does not permit incorporating your program into
proprietary programs. If your program is a subroutine library, you may
consider it more useful to permit linking proprietary applications with the
library. If this is what you want to do, use the GNU Library General
Public License instead of this License.
251
MODAEM Display Options
252
MODAEM Display Options
The properties of all MODAEM properties that GMS displays on the screen can be controlled through the
MODAEM tab of the Display Options dialog. This dialog is opened by right clicking on the
Map Data entry in
the Project Explorer, selecting the Display Options command, and then selecting the MODAEM tab. This tab is only
visible when there is a MODAEM simulation. It can also be accessed from the from the Display menu, the
MODAEM menu, or the
Display Options macro. The following table describes the display options available for
the MODAEM model.
Display
Option
Description
Contours
Whenever MODAEM is executed, the head values are computed at the corners of a background grid. These head values can then be
contoured. Most of the objects supported by GMS can be contoured by turning on the Contour in the Display Options dialog. When
an object is contoured, the values associated with the active data set for the object are used to generate the contours.
Map
elevations
If the Map Elevations option is selected in the MODAEM Display Options dialog, the head values are mapped to elevations (z
values) of the background grid and the contours are displayed on the resulting warped grid in oblique view. This makes it possible to
see a 3D view of the computed water table surface.
Background
mesh
Controls the displays of a background grid. The density of the background grid can be adjusted using the Mesh density factor edit
field. The background grid is always adjusted to fit the area defined by the boundary polygon or the GMS graphics window. If you
zoom in to look at a local area of the model and select the F5 button, the background grid is rebuilt to fit the current viewing area. In
this manner, one can view the solution at any desired level of detail.
Pathlines
The pathlines can be toggled on and off, and the pathline style and color can be adjusted. The pathline color can be set to the default
color, or the color corresponding to the starting or ending zone codes of the pathlines.
If the Pathlines option is turned on for one or more MODAEM wells, a set of pathlines are automatically computed by MODAEM
and displayed when the solution is updated. For wells, pathlines are always computed backwards in time. The display options
associated with the pathlines (max tracking time, direction arrows, etc.) can be controlled using the MODAEM Display Options
dialog.
Particles may also be created at user-specified points in the aquifer, including a starting elevation. GMS will pass these points to
MODAEM for forward tracing. Currently, GMS does not provide a way to trace these particles backwards in time.
Direction
arrows
Direction arrows can be displayed along the pathlines. The size of the arrow heads can be set by specifying the Length in pixels. The
arrows are displayed along the pathline at an interval corresponding to the Length specified.
Dry wells
Controls the display of wells that have gone dry during the MODAEM simulation run. They symbol, symbol size, and symbol color
can be adjusted by clicking on the button to the left of the toggle.
Reference
point
Controls the display of reference points. They symbol, symbol size, and symbol color can be adjusted by clicking on the button to
the left of the toggle.
253
6.3. MODFLOW
MODFLOW
GMS includes a comprehensive graphical interface to the groundwater model MODFLOW. MODFLOW is a 3D,
cell-centered, finite difference, saturated flow model developed by the United States Geological Survey (McDonald
& Harbaugh, 1988). MODFLOW can perform both steady state and transient analyses and has a wide variety of
boundary conditions and input options.
GMS supports MODFLOW as a pre- and post-processor. The input data for MODFLOW are generated by GMS and
saved to a set of files. These files are read by MODFLOW when MODFLOW is launched from the GMS menu. The
output from MODFLOW is then imported to GMS for post-processing.
A special version of MODFLOW is distributed with GMS. This version of MODFLOW is the same as the version
distributed by the USGS except for a few minor changes primarily related to file input including reading input data
from HDF5 files. These changes are clearly marked in the code. For more information see MODFLOW with HDF5.
To learn more about using MODFLOW in GMS, please refer to the available tutorials.
More information about MODFLOW is available from the USGS [1].
Starting from GMS version 8.0, GMS supports MODFLOW 2005.
Starting from GMS version 8.2, GMS supports MODFLOW-NWT.
Pre-Processing
•
•
•
•
•
•
•
•
Importing MODFLOW Files
Building a MODFLOW Model
Saving a MODFLOW Simulation
Parameters
Stochastic Modeling with MODFLOW
Interpolate to MODFLOW Layers
Packages Supported in GMS
Unsupported MODFLOW Features
Post-Processing
• MODFLOW Display Options
• MODFLOW Post Processing Viewing Options
• Reading a MODFLOW Simulation
MODFLOW Documentation
MODFLOW 88I [2]
MODFLOW 88II [3]
MODFLOW 96I [4]
MODFLOW 96II [5]
MF2K Calibration [6]
MF2K Flow Process [7]
MODFLOW
254
MF2K huf [8]
MF2K imf [9]
MF2K lmt [10]
MF2K obssenspeprocess [11]
MF2005 Flow Process [12]
MF NWT [13]
References
[1] http:/ / water. usgs. gov/ nrp/ gwsoftware/ modflow2000/ MFDOC/
[2] http:/ / gmsdocs. aquaveo. com/ modflow88I. pdf
[3] http:/ / gmsdocs. aquaveo. com/ modflow88II. pdf
[4] http:/ / gmsdocs. aquaveo. com/ modflow96I. pdf
[5] http:/ / gmsdocs. aquaveo. com/ modflow96II. pdf
[6] http:/ / gmsdocs. aquaveo. com/ mf2k_calibration. pdf
[7] http:/ / gmsdocs. aquaveo. com/ mf2k_flowprocess. pdf
[8] http:/ / gmsdocs. aquaveo. com/ mf2k_huf. pdf
[9] http:/ / gmsdocs. aquaveo. com/ mf2k_lmg. pdf
[10] http:/ / gmsdocs. aquaveo. com/ mf2k_lmt. pdf
[11] http:/ / gmsdocs. aquaveo. com/ mf2k_obssenspeprocess. pdf
[12] http:/ / gmsdocs. aquaveo. com/ mf2005_flowprocess. pdf
[13] http:/ / gmsdocs. aquaveo. com/ MF_NWT. pdf
MODFLOW 2005
Choosing MODFLOW 2000 or MODFLOW 2005
Choosing to use MODFLOW 2000 or MODFLOW 2005 is done
in the MODFLOW Global Options Dialog. At any time you can
switch from one to the other.
Changes in MODFLOW 2005
The following list shows changes in MODFLOW 2005 from
MODFLOW 2000.
1. SOR1 Solver
• MODFLOW 2005 no longer supports the SOR1 Solver.
2. PCG2 Solver
MODFLOW Global Option Dialog
• MODFLOW 2005 replaces the DAMP variable with
DAMPPCG and DAMPPCGT variables [1]. These two new
variables allow different damping factors to be applied
separately to steady-state and transient stress periods.
3. UZF Package
• MODFLOW 2005 added support for the Unsaturated Zone Flow (UZF) package.
4. LPF package
• MODFLOW 2005 provides more options for the LPF Package. Pictures below show the LPF package options
supported in MODFLOW 2000 vs MODFLOW 2005.
MODFLOW 2005
MODFLOW 2000 LPF Package Options
255
MODFLOW 2005 LPF Package Options
5. PES and PEST
• PES is not available in MODFLOW 2005. Automated calibration in GMS is handled using PEST.
References
[1] http:/ / water. usgs. gov/ nrp/ gwsoftware/ modflow2000/ MFDOC/ index. html?pcg. htm
256
6.3.1. MODFLOW Packages
MODFLOW Packages Supported in GMS
MODFLOW is divided into a series of components called "packages." Each package performs a specific task. The
input for each package is generally contained in a separate file. The MODFLOW packages supported by GMS are
listed in the following tables.
The MODFLOW packages to be used in the MODFLOW simulation are specified in the Packages dialog. This
dialog is accessed in the Global Options\Basic Package dialog. Some of the packages are always required for a
simulation and some are optional. One of the flow model packages and one of the solver packages must be selected.
Each of the boundary condition/source/sink packages is optional.
For any package not currently supported in GMS, the file associated with that package will be ignored when the
model is imported. However, GMS keeps track of unsupported packages it encounters when reading the name file
and, when the project is saved, GMS lists the unsupported packages in the name file and copies the unsupported
package files from the old directory to the new directory.
Global Options & Output
Package/File
Name
Abrev
Name
USGS
Description
Always
Req'd?
Extension
Name file
MFN
[1]
The MODFLOW name file. GMS uses "mfn" as the extension.
Yes
*.mfn
Basic Package
BAS6
[2]
Used to specify the grid dimensions, the computational time steps, and an array
identifying which packages are to be used.
Yes
*.bas
Discretization
File
DIS
[3]
The Discretization File is used to specify certain data used in all models. These
include, the number of rows, columns and layers, the cell sizes, the presence of
Quasi-3D confining beds, the time discretization.
Yes
*.dis
Output Control
OUT1
[4]
Controls what information is to be output from MODFLOW and when it is to be
output.
No
*.oc
Flow Packages
Interfaces to four different flow packages are provided in GMS: the block centered flow (BCF), the layer property
flow (LPF), the hydrogeologic unit flow (HUF), and the upstream weighting (UPW) packages. One of these four
packages must be selected in the Packages dialog.
MODFLOW Packages Supported in GMS
Package Name
257
Abrev
Name
USGS
Description
Always
Req'd?
Extension
BCF6
[5]
Performs the cell by cell flow calculations. The input to this package includes
layer types and cell attributes such as storage coefficients and transmissivity.
Parameters for sensitivity analysis or parameter estimation are NOT supported.
Yes1
*.bcf
Layer Property Flow
Package
LPF
[6]
Performs the cell by cell flow calculations. The input to this package includes
layer types and cell attributes such as storage coefficients and transmissivity.
Yes1
*.lpf
Upstream Weighting
Flow Package
UPW
[7]
Based on the LPF package. Modified to provide a linear formulation that can be
used with the NWT solver.
Yes1
*.upw
Hydrogeologic Unit
Flow Package
HUF
[8]
Defines the model stratigraphy in a grid independent fashion (in the vertical
direction).
Yes1
*.huf
Block Centered
Flow Package
1
One of the flow packages must be used.
Solver Packages
Package Name
Abrev Name
USGS
Description
Always
Req'd?
Extension
GMG
[9]
The Geometric Multigrid Solver is used to solve the finite
difference equations in each step of a MODFLOW stress
period.
Yes1
*.gmg
SIP
[10]
The Strongly Implicit Procedure package is used to solve
the finite difference equations in each step of a
MODFLOW stress period.
Yes1
*.sip
Preconditioned Conjugate Gradient
Method
PCG2
[11]
The Preconditioned Conjugate-Gradient package is used to
solve the finite difference equations in each step of a
MODFLOW stress period.
Yes1
*.pcg
Preconditioned Conjugate Gradient
Solver with Improved Nonlinear
Control
PCGN
[12]
The Preconditioned Conjugate-Gradient package is used to
solve the finite difference equations in each step of a
MODFLOW stress period.
Yes1
*.pcgn
Slice-Successive Overrelaxation
Method
SOR
[13]
The Slice-Successive Overrelaxation package is used to
solve the finite difference equations in each step of a
MODFLOW stress period.
Yes1
*.sor
Algebraic MultiGrid for Systems
Solver
SAMG or
LINK-AMG
[14]
The Link-AMG package is used to solve the finite
difference equations in each step of a MODFLOW stress
period.
Yes1
*.lmg
Direct Solver
DE4
[15]
The DE4 package is used to solve the finite difference
equations in each step of a MODFLOW stress period.
Yes1
*.de4
Newton Solver
NWT
[16]
The NWT package is used to solve the finite difference
equations in each step of a MODFLOW-NWT stress
period.
Yes1
*.nwt
Geometric Multi-Grid
Strongly Implicit Procedure
1
One of these solvers must be selected in the Packages dialog.
Once a solver has been selected, the appropriate solver package dialog can be accessed through one of the solver
commands (LMG, SIP, PCG2, or SSOR) in the MODFLOW menu. The default values shown in each dialog are
typically adequate.
For more information on Solver Packages visit: http:/ / water. usgs. gov/ nrp/ gwsoftware/ modflow2000/ MFDOC/
index.html
MODFLOW Packages Supported in GMS
258
Optional Packages
Package Name
Abrev
Name
USGS
Description
Always
Req'd?
Extension
Drain Package
DRN1
[17]
Simulates drain type boundary conditions.
No
*.drn
Drain Return Package
DRT1
[18]
Simulates drain return type boundary conditions.
No
*.drt
Evapotranspiration
Package
EVT1
[19]
Simulates the effect of evapotranspiration in the vadose zone.
No
*.evt
Evapotranspiration
Segments Package
ETS1
[20]
"allows simulation of evapotranspiration with a user-defined relation
[21]
between evapotranspiration rate and hydraulic head."
No
*.ets
Gage Package
GAGE
[22]
Allows SFR and lake gaging stations. Gaging station prints time series
values for gage location.
No
*.gag
General Head Boundary
Package
GHB1
[23]
Simulates a general purpose head-dependent source/sink. Commonly used to
simulate lakes.
No
*.ghb
Horizontal Flow Barrier
Package
HFB1
[24]
Simulates the effect of horizontal flow barriers such as sheet piles and slurry
trenches.
No
*.hfb
Lake Package
LAK3
[25]
A more sophisticated alternative to the typical approach of using the General
head package to simulate the effect of lakes and reservoirs. Computes the
stage based on the water budget unlike the GHB.
No
*.lak
MNW1 Package
MNW1
[26]
older revision of MNW package used to simulate wells that extend over
more than one cell.
No
*.mnw
MNW2 Package
MNW2
[27]
updated revision of MNW1 package used to simulate wells that extend over
more than one cell.
No
*.mnw2
Recharge Package
RCH1
[28]
Simulates recharge to the groundwater from precipitation.
No
*.rch
River Package
RIV1
[29]
Simulates river type boundary conditions.
No
*.riv
SFR Package
SFR2
[30]
Simulates the exchange of water between the aquifer and surficial streams.
Includes routing and automatic computation of stage. Parameters for
sensitivity analysis or parameter estimation are NOT supported.
No
*.sfr
STR Package
STR1
[31]
Simulates the exchange of water between the aquifer and surficial streams.
Includes routing and automatic computation of stage. Parameters for
sensitivity analysis or parameter estimation are NOT supported.
No
*.str
Time Variant Specified
Head Package
CHD1
[32]
Simulates specified head boundary conditions where the head is allowed to
vary with time.
No
*.chd
Subsidence Package
SUB1
[33]
Simulates simulates aquifer compaction and land subsidence.
No
*.sub
Well Package
WEL1
[34]
Simulates injection/extraction wells.
No
*.wel
UZF Package
UZF1
[35]
Simulate percolation of water through the unsaturated zone.
No
*.uzf
MODFLOW Packages Supported in GMS
259
Other Files
Other files that GMS reads and writes with MODFLOW simulations.
File
Name
Description
Extension
MFS
MODFLOW "Super" file, created by GMS to keep track of extra information GMS needs.
*.mfs
MFS
MODFLOW World file, created by GMS to keep track of the geographic location of a MODFLOW model.
*.mfw
PRJ
Projection file in ArcGIS well-known text
H5
An HDF5 formatted file containing array and list data referenced from other package files. See MODFLOW_with_HDF5
for more information
*.h5
A file used with a special version of MODFLOW modified to use PEST.
*.asp
ASP
PARAM
M2P
[36]
format specifying a geographic coordinate system.
Extra information about the parameters used by GMS and our modified version of MODFLOW.
Used by MF2PEST.EXE program.
*.prj
*.param
*.m2p
Output Files
Standard Extensions for OUTPUT files.
Package
Extension
*.ccf
Drawdown *.drw
Global
*.glo
Head
*.hed
Output
*.out
If a fort.# file occurs the MODFLOW file was written to the given unit number.
If a file has an underscore (*_...) followed by an extension refer to pages 29 and 30 of the MODFLOW
Documentation linked here:MF2K Obs-Sen-Pes [37]
Notes
[1] http:/ / water. usgs. gov/ nrp/ gwsoftware/ modflow2000/ MFDOC/ name_file. htm
[2] http:/ / water. usgs. gov/ nrp/ gwsoftware/ modflow2000/ MFDOC/ bas6. htm
[3] http:/ / water. usgs. gov/ nrp/ gwsoftware/ modflow2000/ MFDOC/ dis. htm
[4] http:/ / water. usgs. gov/ nrp/ gwsoftware/ modflow2000/ MFDOC/ oc. htm
[5] http:/ / water. usgs. gov/ nrp/ gwsoftware/ modflow2000/ MFDOC/ bcf. htm
[6] http:/ / water. usgs. gov/ nrp/ gwsoftware/ modflow2000/ MFDOC/ lpf. htm
[7] http:/ / water. usgs. gov/ nrp/ gwsoftware/ modflow2000/ MFDOC/ upw_upstream_weighting_package. htm
[8] http:/ / water. usgs. gov/ nrp/ gwsoftware/ modflow2000/ MFDOC/ huf2. htm
[9] http:/ / water. usgs. gov/ nrp/ gwsoftware/ modflow2000/ MFDOC/ gmg. htm
[10] http:/ / water. usgs. gov/ nrp/ gwsoftware/ modflow2000/ MFDOC/ sip. htm
[11] http:/ / water. usgs. gov/ nrp/ gwsoftware/ modflow2000/ MFDOC/ pcg. htm
[12] http:/ / water. usgs. gov/ nrp/ gwsoftware/ modflow2000/ MFDOC/ pcgn. htm
[13] http:/ / water. usgs. gov/ nrp/ gwsoftware/ modflow2000/ MFDOC/ sor. htm
[14] http:/ / water. usgs. gov/ nrp/ gwsoftware/ modflow2000/ MFDOC/ lmg. htm
[15] http:/ / water. usgs. gov/ nrp/ gwsoftware/ modflow2000/ MFDOC/ de4. htm
[16]
[17]
[18]
[19]
http:/ / water. usgs. gov/ nrp/ gwsoftware/ modflow2000/ MFDOC/ nwt_newton_solver. htm
http:/ / water. usgs. gov/ nrp/ gwsoftware/ modflow2000/ MFDOC/ drn. htm
http:/ / water. usgs. gov/ nrp/ gwsoftware/ modflow2000/ MFDOC/ drt. htm
http:/ / water. usgs. gov/ nrp/ gwsoftware/ modflow2000/ MFDOC/ evt. htm
MODFLOW Packages Supported in GMS
260
[20] http:/ / water. usgs. gov/ nrp/ gwsoftware/ modflow2000/ MFDOC/ ets. htm
[21] Banta, Edward R. (2000), MODFLOW-2000, The U.S. Geological Survey Modular Ground-Water Model-Documentation of Packages for
Simulating Evapotranspiration with a Segmented Function (ETS1) and Drains with Return Flow (DRT1). Open-File Report 00-466. (http:/ /
water. usgs. gov/ nrp/ gwsoftware/ modflow2000/ ofr00-466. pdf), Denver, Colorado,
[22] http:/ / water. usgs. gov/ nrp/ gwsoftware/ modflow2000/ Guide/ index. html?gage. htm
[23] http:/ / water. usgs. gov/ nrp/ gwsoftware/ modflow2000/ MFDOC/ ghb. htm
[24] http:/ / water. usgs. gov/ nrp/ gwsoftware/ modflow2000/ MFDOC/ hfb6. htm
[25] http:/ / water. usgs. gov/ nrp/ gwsoftware/ modflow2000/ MFDOC/ lak. htm
[26] http:/ / water. usgs. gov/ nrp/ gwsoftware/ modflow2000/ MFDOC/ mnw. htm
[27] http:/ / water. usgs. gov/ nrp/ gwsoftware/ modflow2000/ MFDOC/ mnw2. htm
[28] http:/ / water. usgs. gov/ nrp/ gwsoftware/ modflow2000/ MFDOC/ rch. htm
[29] http:/ / water. usgs. gov/ nrp/ gwsoftware/ modflow2000/ MFDOC/ riv. htm
[30] http:/ / water. usgs. gov/ nrp/ gwsoftware/ modflow2000/ MFDOC/ sfr. htm
[31] http:/ / water. usgs. gov/ nrp/ gwsoftware/ modflow2000/ MFDOC/ str. htm
[32] http:/ / water. usgs. gov/ nrp/ gwsoftware/ modflow2000/ MFDOC/ chd. htm
[33] http:/ / water. usgs. gov/ nrp/ gwsoftware/ modflow2000/ MFDOC/ sub. htm
[34] http:/ / water. usgs. gov/ nrp/ gwsoftware/ modflow2000/ MFDOC/ wel. htm
[35] http:/ / water. usgs. gov/ nrp/ gwsoftware/ modflow2000/ MFDOC/ index. html?uzf_unsaturated_zone_flow_pack. htm
[36] http:/ / en. wikipedia. org/ wiki/ Well-known_text
[37] http:/ / pubftp. ems-i. com/ download/ GMS/ GMS%206. 5/ models/ mf2k_obssenspeprocess. pdf
BCF Package
Once the data in the Global Options/Basic Package are initialized, the data for the flow package can be defined. The
BCF package is one of three flow packages that can be used. The BCF package computes the conductance between
each of the grid cells and sets up the finite difference equations for the cell to cell flow. It also computes the terms
that determine the rate of movement of water to and from storage. The BCF Package dialog is accessed through the
BCF Package command in the MODFLOW menu.
Data Required
Data arrays required for a particular layer are dependent on the layer type. The layer arrays required for each layer
type are shown in the following table. The leakance array is not required for the bottom layer and the storage
coefficients are only required for transient simulations.
Layer Type
Confined (LAYCON=0)
Unconfined (LAYCON=1)
Required Arrays
TransmissivityLeakancePrimary Storage Coefficient (storativity)
Bottom ElevationHydraulic ConductivityLeakancePrimary Storage Coefficient (specific yield)
Confined/Unconfined
(LAYCON=2)
Top ElevationTransmissivityLeakancePrimary Storage Coefficient (storativity)Secondary Storage Coefficient
(specific yield)
Confined/Unconfined
(LAYCON=3)
Top ElevationBottom ElevationHydraulic ConductivityLeakancePrimary Storage Coefficient
(storativity)Secondary Storage Coefficient (specific yield)
Each of the required input arrays must be entered by the user for each layer. Some of the layer arrays can be directly
entered. However, some are dependent on the layer geometry. For example, leakance is a function of the layer
thickness and the vertical hydraulic conductivity. The transmissivity is equal to the horizontal hydraulic conductivity
multiplied by the layer thickness.
The BCF Package can be used for simple models with a single layer for multiple layers with simple stratigraphy. In
such cases, many of the parameters are constant for an entire layer and can be entered directly. For more complex
models, the following steps can be taken to prepare the input arrays (or the user can use the LPF package):
1. Import a set of scatter points defining the elevations of the stratigraphic horizons.
BCF Package
2. Interpolate the top and bottom elevations of each unit to a 2D grid which matches the 3D computational grid.
3. Compute the desired parameter arrays using the interpolated elevation arrays and the Data Calculator.
4. Copy the parameter arrays into the appropriate MODFLOW arrays in the BCF Package dialog.
Since this approach can be quite time-consuming, the LPF Package is recommended for most models.
Layer Data
The aquifer properties are entered in the layer data section.
Layer
The layer edit field is used to select the layer. The buttons on the right side of the dialog apply to the active
layer only.
Layer Data Arrays
The six buttons on the right portion of the dialog represent layer data arrays such as elevations and hydraulic
conductivity. Each of the six buttons brings up a dialog for entering an array of values. The dialog can be used
to edit individual values, assign a constant value to the entire array, or to copy a data set generated by
interpolating from a scatter point set to the array.
Not all of the data arrays need to be specified for each layer. Some arrays are only required for transient
models. The required arrays depend on the layer type.
Layer data arrays can also be edited using other tools in GMS. The array values can be edited by selecting a
set of cells and using the Cell Properties command. The values in the layer parameter arrays can be initialized
using coverages of a conceptual model defined in the Map module. A set of tools for rapidly defining top and
bottom elevations is provided (See Defining Layer Elevations). Layer data can also be assigned using material
zones.
Layer Type
Each layer must be assigned a layer type (LAYCON). By default, the top layer is defined to be an unconfined
layer and all other layers are initialized as confined. The data arrays required by a layer may be dependent on
the layer type.
Interblock Transmissivity
The method used for computing interblock transmissivity is specified using the pull-down list in the middle
right portion of the BCF Package dialog.
Anisotropy Factor
This edit field allows the user to adjust the anisotropy that should be used in the model. This value is defaulted
to 1.0.
Head Assigned to Dry Cells
This edit field allows the user to adjust the default head value assigned to dry cells. This value is defaulted to
-888.0 or -999.0.
Cell Rewetting Parameters
The controls related to rewetting cells in the lower left portion of the BCF Package dialog are only activated if the
BCF2 or BCF3 package has been specified. If wetting of cells is to be allowed, a wetting factor, wetting iteration
interval, and wetting equation must be specified.
261
BCF Package
262
NOTE: The observation, sensitivity, and parameter estimation processes do not support the BCF package.
CHD Package
In the original version of MODFLOW, specified head boundaries are defined using a combination of the IBOUND
array and the starting heads array. Since both of these arrays are static, boundaries where the head varies with time
could not be simulated. To address this type of boundary, a new package called the Time Variant Specified Head
(CHD) package has been developed.
NOTE: GMS does not support parameters for the Time Varient Specified Head (CHD) package.
Specifying Transient Head Values
Transient data are handled in a unique fashion with the CHD package. When transient values are assigned to the
other stress packages, one value is assigned per stress period. The value represents the value at the beginning of the
stress period. This results in a stair step definition of the time series as shown in part a of the following figure. With
the CHD package, two values are assigned per stress period: a value at the beginning of the stress period and a value
at the end of the stress period. This makes it possible to specify a piece-wise linear time series as shown in part b.
Specifying Transient Values Using (a) the Traditional Approach and
(b) the Approach Used in the CHD Package.
Defining Time Variant Specified Head Boundaries
A time variant specified head boundary can be defined using a conceptual model in the Map module simply by using
the Transient option when entering the head value in the Attributes dialog. When the specified head attribute is
assigned to a polygon, the head is assigned uniformly over the entire polygon. When assigned to an arc, separate
head values are applied to each of the nodes on the ends of the arc and the head is assumed to vary linearly between
the nodes. When the attribute is assigned to a point, the head is assigned directly to the cell containing the point. For
cell-by-cell editing, a selected set of cells can be designated as time variant specified head cells using the Point
Sources/Sinks command described above. When the head vs. time values are entered using the XY Series Editor,
two values (beginning and ending values) must be entered per stress period. Once a set of cells has been specified,
the Time Variant Specified Head Package dialog can be used to view and edit the values assigned to the cells.
CHD Package
Stress Period
This field shows the current stress period and allows you to cycle through the stress periods and view the different
head properties for those stress periods in the spreadsheet below.
Use Previous
Use this option on a stress period to use the values from the previous stress period for the current stress period. This
option is unavailable for steady state models and the first stress period of transient models.
Spreadsheet
For cells where CHD type boundary conditions have been assigned, the starting and ending heads assigned to each
cell are displayed in the spreadsheet portion at the lower part of the dialog. The spreadsheet can be used to edit the
row, column, layer, starting head, and ending head values. For a transient simulation, the values displayed in the
spreadsheet are for an individual stress period. The values associated with other stress periods can be edited by
entering the number of the desired stress period in the stress period edit box in the center of the dialog. If the Use
previous option is selected for a given stress period, the values from the previous stress period are used and the
spreadsheet is dimmed.
Reset
This button restores all values in the dialog to their default values
DE4 Package
The DE4 package or Direct Solver is one of the solvers available for MODFLOW.
For more information on this solver see the USGS documentation here. [1]
References
[1] http:/ / pubs. er. usgs. gov/ usgspubs/ ofr/ ofr200092
263
DRN Package
DRN Package
The Drain package is used to simulate the effect of drains on an aquifer. Drains remove water from the aquifer as
long as the water table is above the elevation of the drain. If the water table falls below the elevation of the drain, the
drain has no effect. The rate of removal is proportional to the difference in elevation between the water table and the
drain. The constant of proportionality is the conductance of the fill material surrounding the drain.
A set of selected cells can be specified as drains using the Point Sources/Sinks command in the MODFLOW menu
or drains can be defined using the conceptual model approach in the map module. Drains are specified by assigning
an elevation and a conductance to each cell at the location of each drain.
The drain attribute may be associated with points, arcs, or polygons. There are two parameters that are associated
with a drain: elevation and conductance. Elevation may be specified as a constant value or transient series, or
interpolated from an existing TIN. Conductance may be constant or vary with time.
When a polygon is defined as a drain, the elevation and conductance values (constant or time-varying) are applied
uniformly over the entire polygon. When an arc is assigned to be a drain, the conductance is applied uniformly over
the arc but separate elevation values are applied to each of the nodes on the ends of the arc and the elevation is
assumed to vary linearly between the nodes. When a point is classified as a drain, the elevation and conductance
values are assigned directly to the cell containing the point.
See also the Drain Return Package.
Stress Period
This field shows the current stress period and allows you to cycle through the stress periods and view the different
river properties for those stress periods in the spreadsheet below.
Use Previous
Use this option on a stress period to use the drain values from the previous stress period for the current stress period.
This option is unavailable for steady state models and the first stress period of transient models.
Spreadsheet
For cells where drain type boundary conditions have been assigned, the conductance, elevation, and conductance
factor assigned to each cell are displayed in the spreadsheet portion at the lower part of the dialog. The spreadsheet
can be used to edit the row, column, layer, conductance, and elevation values. For a transient simulation, the values
displayed in the spreadsheet are for an individual stress period. The values associated with other stress periods can be
edited by entering the number of the desired stress period in the stress period edit box in the center of the dialog. If
the Use previous option is selected for a given stress period, the values from the previous stress period are used and
the spreadsheet is dimmed. The conductance factor is used, and only appears in the spreadsheet, with DRN
parameter estimation. When doing parameter estimation the value of drain conductance assigned to a particular drain
boundary condition will be the value of the drain parameter multiplied by the conductance factor. For more
information on DRN parameters and conductance factors see the MODFLOW 2000 manual.
264
DRN Package
265
Display Cell IDs/IJK
The radio group at the bottom of the dialog allows the user to adjuster whether the cell ID or the cell i, j, k values are
displayed for the cells containing the boundary condition/source/sink.
Delete All
The Delete All button deletes all of the data currently defined in the River package and restores the River package
parameters to the default values.
DRT Package
The Drain Return Package (DRT) is very similar
to the regular Drain Package (DRN). Drains
remove water from the aquifer as long as the
water table is above the elevation of the drain.
With the DRT package, some percentage of that
removed water can be reintroduced to the aquifer
at a specified grid cell.
DRT boundary conditions can be added to
selected cells using the Point Sources/Sinks
command in the MODFLOW menu. DRT objects
can also be defined using the conceptual model
approach in the map module.
[1]
Illustration of DRT package
Conceptual model
Drains can be modeled using points, arcs and/or polygons in a conceptual model. The return cell cannot be specified
in the conceptual model. This is because the conceptual model is independent of the grid and, in fact, there may be
no grid at all when the conceptual model is defined. When GMS performs the Map->MODFLOW command, the
return cell is always set to be the highest active cell above the drain cell. This can later be changed in the Drain
package dialog.
The main DRT parameters and how they can be specified are given in the following table.
DRT Input Parameters
Parameter
Points Nodes Arcs Polygons
Conductance
Bottom elevation
Rfprop (return-flow proportion)
When specifying an arc as a DRT arc, the conductance and return flow factor are specified on the arc. Bottom
elevation is specified at the nodes on the ends of the arc and is linearly interpolated along the length of the arc.
Care should be taken in entering conductance in the conceptual model so that the units are correct.
DRT Package
266
Drain Return package dialog
The Drain Return package dialog allows the user to edit the location and the input values associated with each drain
boundary condition. Drain boundary conditions cannot be created or deleted from this dialog. They can be created
and deleted via the Map -> MODFLOW command, or by using the MODFLOW Source/Sink Dialog.
The Use Return Flow toggle controls the existence of the "RETURNFLOW" optional keyword in the package input
file.
Notes
[1] Banta, Edward R. (2000), MODFLOW-2000, The U.S. Geological Survey Modular Ground-Water Model-Documentation of Packages for
Simulating Evapotranspiration with a Segmented Function (ETS1) and Drains with Return Flow (DRT1). Open-File Report 00-466. (http:/ /
water. usgs. gov/ nrp/ gwsoftware/ modflow2000/ ofr00-466. pdf), Denver, Colorado,
ETS Package
The ETS package is an enhancement of the EVT package and "allows simulation of evapotranspiration with a
user-defined relation between evapotranspiration rate and hydraulic head."[1] It is included in MODFLOW 2000 and
GMS includes an interface to it starting at version 7.0.
[1]
From OFR00-466
Evapotranspiration Segments
From the package documentation:
In the ETS1 Package, the functional relation of evapotranspiration rate to head is conceptualized as a
segmented line in the variable interval. The segments that determine the shape of the function in the
variable interval are defined by intermediate points where adjacent segments join. The ends of the
segments at the top and bottom of the variable interval are defined by the ET surface, the maximum
evapotranspiration rate, and the extinction depth. The number of intermediate points that must be
defined is one less than the number of segments in the variable interval. For each intermediate point, two
values, PXDP and PETM, are entered to define the point. PXDP is a proportion (between zero and one)
of the extinction depth, and PETM is a proportion of the maximum evapotranspiration rate. PXDP is 0.0
ETS Package
267
at the ET surface and is 1.0 at the bottom of the variable interval. PETM is 1.0 at the ET surface and is
0.0 at the bottom of the variable interval. Segments are numbered such that segment one is the segment
with its upper endpoint at the ET surface, and segment numbers increase downward. The relation of
evapotranspiration rate to head is defined over the model grid by a series of two-dimensional arrays;
therefore, PXDP and PETM also are specified as arrays.[1]
The input order of the arrays defining the segmented line is important and is defined in the package documentation:
PXDP-is a proportion of the extinction depth (dimensionless), measured downward from the ET surface,
which, with PETM, defines the shape of the relation between the evapotranspiration rate and head. The value
of PXDP must be between 0.0 and 1.0, inclusive. Repetitions of PXDP and PETM are read in sequence such
that the first occurrence represents the bottom of the first segment, and subsequent repetitions represent the
bottom of successively lower segments. Accordingly, PXDP values for later repetitions (representing lower
segments) should be greater than PXDP values for earlier repetitions.
PETM-is a proportion of the maximum evapotranspiration rate (dimensionless) which, with PXDP, defines the
shape of the relation between the evapotranspiration rate and head. The value of PETM should be between 0.0
and 1.0, inclusive. Repetitions of PXDP and PETM are read in sequence such that the first occurrence
represents the bottom of the first segment, and subsequent repetitions represent the bottoms of successively
lower segments. Accordingly, PETM values for later repetitions (representing lower segments) generally
would be less than PETM values for earlier repetitions.[1]
Segmented line functions in GMS
In GMS, the ETS segmented line function can be defined in a conceptual model. When this is done, the standard XY
Series Editor is used. The XY Series Editor is a simple tool for creating 2D curves. When used to define the ETS
segmented function, the X values correspond to PXDP, and the Y values correspond to PETM. The order of the
values is important and is defined by the package documentation as mentioned above. PXDP should be entered in
order of increasing value, and PETM should be entered in order of decreasing value. Here are a couple of examples:
Values
Plot
PXDP PETM
0.0
1.0
0.25
0.25
1.0
0.0
XY Series Curve 1 for ETS
ETS Package
268
PXDP PETM
0.0
1.0
0.25
0.25
1.0
0.0
XY Series Curve 2 for ETS
In a GMS conceptual model, it is not possible to define segmented lines which vary with time. However, this can be
done in the ETS Package dialog.
Notes
[1] Banta, Edward R. (2000), MODFLOW-2000, The U.S. Geological Survey Modular Ground-Water Model-Documentation of Packages for
Simulating Evapotranspiration with a Segmented Function (ETS1) and Drains with Return Flow (DRT1). Open-File Report 00-466. (http:/ /
water. usgs. gov/ nrp/ gwsoftware/ modflow2000/ ofr00-466. pdf), Denver, Colorado,
EVT Package
The Evapotranspiration package is used to simulate the effect of plant transpiration and direct evaporation by
removing water from cells during a simulation. Evapotranspiration is typically defined by specifying values for each
stress period for each vertical column in the grid. The values consist of an elevation, an ET extinction depth, and a
maximum ET rate. The elevation is an absolute elevation and the ET extinction depth (measured positive downward)
is relative to the specified elevation. If the water table rises above the specified elevation, the evapotranspiration
occurs at the maximum ET rate. If the water table falls below the ET extinction depth, evapotranspiration ceases. If
the water table elevation lies between these two extremes, the evapotranspiration rate varies linearly with depth. The
ETS package, a later extension of the EVT package, allows the rate to vary non-linearly.
[1]
From OFR00-466
To learn more about Evapotranspiration in MODFLOW go here: http:/ / water. usgs. gov/ nrp/ gwsoftware/
modflow2000/ofr00-466.pdf
EVT Package
EVT Package Dialog
The dialog for editing the evapotranspiration package input data is identical to the Recharge Package dialog except
that rather than editing the flux and layer indicator arrays, the evapotranspiration arrays are edited: elevation, ET
extinction depth, maximum ET rate, and layer indicator.
Evapotranspiration Option
Two ET options are supported by MODFLOW: ET only at the top layer, and ET at specified vertical cells.
Multiplier
The multiplier is a constant which can be written to the package file with each stress period array. Each value in the
array is scaled by the multiplier as the array is imported to MODFLOW. The format button brings up a dialog listing
the standard MODFLOW formats. This format is used for displaying the values in the spreadsheet and it controls
how the values are written to the package file.
Stress Periods
The values displayed in the spreadsheet are for an individual stress period. The values associated with other stress
periods can be edited by entering the ID of the desired stress period in the Stress period edit box in the center of the
dialog. If the Use previous option is selected for a given stress period, the values from the previous stress period are
used and the spreadsheet is dimmed.
2D Data Set -> Array
The 2D Data Set -> Array button brings up the Data Browser listing all of the current data sets associated with the
current 2D grid. In order for this button to be active, the 2D grid must have the same number of rows and columns as
the 3D grid. The selected data set is copied to the recharge array. Data sets are typically generated with the 2D
Scatter Point module. The 2D Scatter Point module can be used to interpolate from a scattered set of rainfall
measurements to the cell locations. If the data set is transient, the values in the data set are linearly interpolated, if
necessary, to each stress period as the data set is copied to the array.
Array -> 2D Data Set
The Array -> 2D Data Set button copies the array to the 2D data set list associated with the existing 2D grid.
Constant -> Array
The Constant -> Array button brings up a dialog which prompts for a single value. This constant is then assigned to
each item in the array for the given stress period.
Spreadsheet
The spreadsheet allows you to edit a 2D array of values, the type depending on the selection in the view/edit combo
box. The array types include elevation, et extinction depth, and max ET rate.
269
EVT Package
Notes
[1] Banta, Edward R. (2000), MODFLOW-2000, The U.S. Geological Survey Modular Ground-Water Model-Documentation of Packages for
Simulating Evapotranspiration with a Segmented Function (ETS1) and Drains with Return Flow (DRT1). Open-File Report 00-466. (http:/ /
water. usgs. gov/ nrp/ gwsoftware/ modflow2000/ ofr00-466. pdf), Denver, Colorado,
GHB Package
The General Head package is similar to the Drain and River packages in that flow in or out of a cell is proportional
to a difference in head. General head cells are often used to simulate lakes. General head conditions are specified by
assigning a head and a conductance to a selected set of cells. If the water table elevation rises above the specified
head, water flows out of the aquifer. If the water table elevation falls below the specified head, water flows into the
aquifer. In both cases, the flow rate is proportional to the head difference and the constant of proportionality is the
conductance.
A set of selected cells can be specified as general head cells using the Point Sources/Sinks command in MODFLOW
menu or general heads can be assigned using the conceptual model in the Map module. When the general head
attribute is assigned to a polygons, the head and conductance are applied uniformly over the entire polygon. When
assigned to an arc, the conductance is applied uniformly over the arc, but separate head values are applied to each of
the nodes on the ends of the arc and the head is assumed to vary linearly between the nodes. When the attribute is
assigned to a point, the head and conductance values are assigned directly to the cell containing the point. Once a set
of cells have been specified, the General Head Package dialog can be used to view and edit the values assigned to
the cells.
Stress Period
The stress period field shows the current stress period and allows you to cycle through the stress periods and view
the different general head properties for those stress periods in the spreadsheet below.
Use Previous
Use this option on a stress period to use the general head values from the previous stress period for the current stress
period. This option is unavailable for steady state models and the first stress period of transient models.
Spreadsheet
For cells where river type boundary conditions have been assigned, the stage, conductance, bottom elevation , and
conductance factor assigned to each cell are displayed in the spreadsheet portion at the lower part of the dialog. The
spreadsheet can be used to edit the row, column, layer, head, and conductance values. For a transient simulation, the
values displayed in the spreadsheet are for an individual stress period. The values associated with other stress periods
can be edited by entering the number of the desired stress period in the stress period edit box in the center of the
dialog. If the Use previous option is selected for a given stress period, the values from the previous stress period are
used and the spreadsheet is dimmed. The conductance factor is used with HFB parameters. When doing parameter
estimation the value of head conductance assigned to a particular head boundary condition will be the value of the
head parameter multiplied by the conductance factor. For more information on HFB parameters and conductance
factors see the MODFLOW 2000 manual.
270
GHB Package
Display Cell IDs/IJK
The radio group at the bottom of the dialog allows the user to adjuster whether the cell ID or the cell i, j, k values are
displayed for the cells containing the boundary condition/source/sink.
Delete All
The Delete All button deletes all of the data currently defined in the River package and restores the River package
parameters to the default values.
Global Options/Basic Package
Once the MODFLOW simulation has been initialized, the next step is to enter the data required by the Global
Options/Basic package. This includes data defining fundamental program options such as the computational time
intervals (stress periods), an array defining which cells are inactive and which cells have constant heads, an array of
starting head values for a transient simulation, and a set of flags defining which of the other packages are to be used.
The input data for this package should be entered before editing any of the other packages. The MODFLOW Global
Options\Basic Package dialog is accessed through the Global Options command in the MODFLOW menu. The
options in the dialog are as follows:
Headings
The two headings are optional text strings which are written to the MODFLOW text output file.
Run Options
The run options are not part of the actual MODFLOW input files, but present different ways that MODFLOW 2000
can be run from GMS.
Forward Run
A forward run is a normal MODFLOW simulation. If parameters have been defined for either a stochastic or
parameter estimation run, the mean or starting values of the parameters are used for the forward run.
Sensitivity Analysis
The sensitivity analysis option is used to perform a sensitivity analysis on a set of selected parameters. The
results can be presented with a set of plots or by contouring data sets representing grid sensitivities. This
option is only available with the LPF and HUF flow packages. This option is not available in GMS 6.5 and
later (see MODFLOW with HDF5).
After running PEST, sensitivities are displayed in the .sen file. Click here for more information.
271
Global Options/Basic Package
Parameter Estimation
In the parameter estimation mode, a set of parameters is found that minimizes the residual between observed
and simulated heads and flows. These options are described in more detail on the Automated Parameter
Estimation page. This option is only available with the LPF and HUF flow packages.
Stochastic Simulation
The stochastic simulation option is used to perform a stochastic simulation using the Monte Carlo or Latin
Hypercube methods for randomizing a selected set of parameters. Stochastic simulations can also be
performed using a material set approach (indicator simulations). A risk analysis wizard can be used to analyze
the results for a probabilistic threshold analysis or a probabilistic capture zone delineation. These options are
described in more detail on the stochastic simulation page.
Stochastic Inverse Model
If the material set option is used for stochastic simulations, the "stochastic inverse" option can be used to
perform automated parameter estimation on each of the N candidate model instances in the stochastic. The
weighted RMS errors for each of the resulting optimized solutions can be used to weight the computations
performed by the risk analysis wizard. This option is only available with the LPF and HUF flow packages.
Model Type
The simulation can be designated as either steady state or transient. If a steady state simulation is specified, certain
portions of the MODFLOW interface such as the Stress Period dialog are inactivated since they are not relevant.
No Flow Head
This is the value of head to be assigned to all inactive (no flow) cells (IBOUND=0) throughout the simulation.
Stress Periods
The Stress Periods button is used to bring up the Stress Period dialog. The stress periods should be defined before
any of the sources/sinks are entered. If the steady state option is selected, the Stress Periods button is dimmed.
Packages
The Packages button brings up the Packages dialog.
Units
The Units button the Basic Package dialog brings up the Units dialog.
272
Global Options/Basic Package
IBOUND
Values
The IBOUND button of the Global Options\Basic Package dialog brings up the array editor. The IBOUND array
contains a value for each cell in the grid defining the type of the cell as constant head, inactive, or variable head.
Constant Head
A negative value indicates that the cell has a constant head. The value of the constant head is defined in the
starting heads array.
Inactive
An IBOUND value of zero indicates that the cell is inactive (no-flow).
Variable Head
A positive IBOUND value indicates that the cell has a variable head (i.e., the head value will be computed as
part of the simulation).
Editing the IBOUND Array
There are several ways to change the active/inactive status (positive vs. zero) of a cell before or after initializing the
IBOUND array. One method is to directly edit the IBOUND array using the IBOUND dialog. Another method is to
select the Cell Attributes command in the MODFLOW menu. In most cases, the most efficient method is to use the
Activate Cells in Coverage command in the Map module. This method uses a polygon to define the active and
inactive regions.
The constant head cells are typically assigned or edited in one of three ways. One method is to directly edit the
IBOUND array. Another method is to select a set of cells and use the Cell Properties dialog in the MODFLOW
menu. The simplest method is to define the constant head zones using feature objects as part of a conceptual model
in the Map module.
Starting Heads
The starting head values are used as initial conditions for head for both steady state and transient simulations. The
Starting Heads button on the left side of the Basic Package dialog is used to enter the values of the starting heads
array. Selecting the Starting Heads button brings up the MODFLOW Array Editor.
Top Elevation
The Top Elevation button brings up an array editor that allows you to edit the top elevation of each layer. GMS
requires that the top and bottom elevations for adjacent layers be the same. This means that when you edit the bottom
of one layer, move down to the next layer, and edit the top of that layer, the bottom of the previous layer will also be
changed. Note that the top and bottom layer elevations must be entered regardless of the which layer data package
(BCF, LPF, HUF) is chosen even though these values may not be used because of certain package options.
273
Global Options/Basic Package
Bottom Elevation
The Bottom Elevation button brings up an array editor that allows you to edit the bottom elevation of each layer.
Note that the top and bottom layer elevations must be entered regardless of the which layer data package (BCF, LPF,
HUF) is chosen even though these values may not be used because of certain package options.
Confining Beds
The Layer Confining Beds dialog, accessed from the Global Options/Basic Package dialog, allows you to select
which layers will have a confining bed below them. The last layer in the grid may not have a confining bed.
Confining beds are most common in older models where the user was trying to conserve memory in solving the
groundwater model. In general, it is recommended that you explicitly model all of the layers in the system instead of
using confining beds. This feature is supported in GMS to make it possible for users to read in older models.
In the spreadsheet, the user may turn on the confining bed option for any of the layers except the last layer in the
grid.
The Confining Bed Elevations button brings up the array editor that allows the user to edit the elevation of each
layer.
GMG Package
The GMG package is one of four solver packages for MODFLOW supported by GMS. The GMG solver is an
iterative solver based on a multi-grid approach.
For more info on the GMG solver look at the following document: MODFLOW-2000, THE U.S. GEOLOGICAL
SURVEY MODULAR GROUND-WATER MODEL -- GMG LINEAR EQUATION SOLVER PACKAGE
DOCUMENTATION By: J. D. Wilson, NRC Post-Doc, and R. L. Naff, U.S. Geological Survey [1]
References
[1] http:/ / pubs. usgs. gov/ of/ 2004/ 1261/
274
HFB Package
275
HFB Package
The Horizontal Flow Barrier (HFB) package is used to simulate the effect of sheet pile walls, slurry trenches, or
other objects which act as a barrier (or partial barrier) to horizontal flow. Barriers are simulated in the HFB package
by identifying cell boundaries which approximately coincide with the location of the barrier and assigning a
hydraulic characteristic to each cell boundary. Each cell boundary represents a vertical face between two adjacent
cells as shown in the following figure.
Hydraulic Characteristic
The original version of the HFB Package required the input of the
hydraulic characteristic either as barrier transmissivity divided by the
width of the horizontal-flow barrier (for layer types 0 and 2 in BCF) or
as barrier hydraulic conductivity divided by the width of the
horizontal-flow barrier (for layer types 1 and 3 in BCF). In the current
HFB Package, the hydraulic characteristic is always the barrier
hydraulic conductivity divided by the width of the barrier, regardless of
the layer type or flow package (BCF or LPF) used; thus, layer
thickness is always used in calculating the contribution to the
conductance terms. The HFB Package uses cell elevations specified in
the discretization file to calculate cell thickness. Cell thickness is head
dependent for layer types 1 and 3 in the BCF Package and for
convertible layers in the Layer-Property Flow Package. (taken from
MODFLOW 2000 documentation)
Cell Boundary Used to Represent Horizontal
Flow Barrier. (a) Oblique View, (b) Plan View.
Defining Barriers
Barriers are defined in one of two ways: (1) they can be defined using a set of arcs in the Map module or (2) they can
be defined one cell boundary at a time using the Toggle Barrier command in the 3D Grid module.
Using the Map Module
In most cases, the simplest method is to create one or more Horizontal Flow Barrier arcs in the Map module
corresponding to the barriers and let GMS automatically find the closest sequence of cell boundaries and mark them
as barriers.
HFB Package
276
Using the Toggle Barrier Command
Horizontal flow barriers can also be defined one at a time by selecting two adjacent cells and selecting the
MODFLOW|Toggle Barrier menu command. This brings up a dialog that can be used to mark the boundary
between the two selected cells as a barrier and to enter a hydraulic characteristic for the barrier. This same command
can be used to delete a barrier between two cells.
HFB Package Dialog
Regardless of which method is used to define the barriers, an existing set of barriers can be viewed and edited using
the HFB Package command in the MODFLOW menu. This command brings up the HFB Package dialog. This
dialog can be used to edit the location and hydraulic characteristic of each of the currently defined barriers.
Spreadsheet
For cells where horizontal flow barriers have been assigned, the hydraulic characteristic assigned to each cell is
displayed in the spreadsheet portion at the lower part of the dialog.
Reset
The Reset button can be used to delete all barriers.
HUF Package
This package is an alternative to the BCF and LPF packages. The HUF package allows the user to define the vertical
elevations of the hydrogeology independent of the 3D grid as shown in the figures below. Notice in the figures
below that the second grid layer has more than one hydrogeologic unit associated with it.
Side view of MODFLOW grid
HUF units displayed in MODFLOW grid
With the HUF package, the user then defines the top and thickness of each of the hydrogeologic units. A material is
associated with each unit and the hydraulic properties (HK, VK...) are assigned to the material. The top and thickness
arrays can be automatically generated from solids using the Solids -> HUF command from the Solids menu or from
boreholes with the Horizons -> HUF command in the Boreholes menu.
Another feature in GMS that incorporates the HUF package is the ability to use TPROGS to Generate HUF Data.
Once the HUF package has been chosen using the packages dialog, the HUF package dialog can be accessed through
the HUF package command in the MODFLOW menu. The following options are available in the HUF Package
dialog.
HUF Package
Layer
This field displays the current layer. Selecting any of the input array buttons will display the corresponding layer
initially. For multiple layer models, this field can be incremented or decremented to show other layers.
Layer type
This radio group selects the layer type for the current layer. By default, all layers are convertible.
Hydrogeologic Unit Properties
The window lists the names of the currently defined units. The Top and Thickness button bring up the MODFLOW
Array Editor. For each hydrogeologic unit the user can specify if vertical hydraulic conductivity (VK) or vertical
anisotropy (VANI) will be used. The material selection box show the material the is assigned to the unit. The
material properties (HK, VK...) are edited by selecting the Edit Materials button.
Vertical hydraulic conductivity
The HUF package has the option to enter vertical hydraulic conductivity values as either actual hydraulic
conductivity values or as anisotropy factors dependant on horizontal hydraulic conductivity. These options are only
available for multi-layer models.
Head Assigned to Dry Cells
This is the value that MODFLOW will give to cells with a head level below the bottom elevation of the cell (dry
cell). When reading in a solution, GMS will mark cells with this value with a dry cell symbol.
Cell Rewetting Parameters
If wetting of cells is allowed, a wetting factor, wetting iteration interval, and wetting equation must be specified.
277
LAK Package
LAK Package
The Lake Package is a more sophisticated alternative to the typical approach of using the General Head Package to
simulate the effect of lakes and reservoirs on an aquifer. Comparing the Lake package to the GHB Package is similar
to comparing the River Package to the Stream Package. With the GHB Package, the user defines the stage. With the
Lake package, the stage is computed automatically based on the water budget. The water budget is a function of
inflow, outflow, recharge, evaporation, etc. The storage capacity of the lake is determined automatically based on the
lake geometry.Some of the cells defining the lake are allowed to go dry if the lake stage drops sufficiently.
The lake is also assumed to have lakebed sediments which affect the flow between the aquifer and the lake. The
effect of the lakebed sediments is represented with a leakance term which includes the thickness and the hydraulic
conductivity.
The Lake Package includes an option that allows one to simulate "sublakes". This option makes it possible for the
lake to partition into smaller, separated lakes as the lake stage drops.
The Theta term offers the user a choice between an explicit solution at 0.0, a semi-implicit solution between 0.0 and
1.0, or an implicit solution at 1.0
Terms
•
•
•
•
Leakance - Represents the lakebed leakance. This is a function of hydraulic conductivity and lakebed thickness
Bathymetry - A reference to a TIN from which the bathymetric elevations are derived.
Sill Elev - The sill elevation at which the sublake begins to drain into the parent lake.
Withdrawal - The volumetric rate, or flux, of water removal from a lake by means other than rainfall, evaporation,
surface outflow, or ground-water seepage.
LMG Package
The LMG1 package is only supported in GMS versions prior to 8.0. The LMG1 Package information can be found
here.
LMG3 package offers some improvements over the LMG1 package for certain types of problems. The LMG3
package is backward compatible with LMG1 input files. For non-linear problems and simulations which use several
time steps, subsequent matrices to be solved for often change only slightly in their algebraic properties. In this case
the LMG3 offers a possibility to accelerate the overall simulation time enormously.
MXITER. Maximum outer iterations
This value is the maximum iterations, or calls to the solver. For linear problems, this value can be 2. For non linear
problems, this values should be larger, but generally less than 50.
MXCYC. Maximum inner iterations
This value is the maximum number of iterations per call to the solver. The default value is 50, and this is sufficient
for most problems.
RCLOSE. Inner iteration closure criterion
Same as RCLOSE for the GMG solver package. The PCG algorithm computes the l2norm of the residual and
compares it against RCLOSE. In LMG1 this was called Budget Closure Criterion. When the scaled norm of the
matrix equations is less than this value then the solver iteration stops.
278
LMG Package
HCLOSE. Outer iteration closure criterion
Head change convergence criterion for nonlinear problems. After each linear solve (inner iteration), the maximum
norm of the head change is compared against HCLOSE.
CONTROL. LMG version to use
This variable allows the user to select either LMG1 or LMG2 version of the LMG solver.
Damping method
Three different damping methods are available: constant, Adaptive damping using the Cooley method, or Adaptive
RRR damping using the relative reduced residual. Refer to the official package documentation for more explanation
on the different damping methods.
DAMP. Accleration Parameter
This value is used if the acceleration method is set to constant. Usually, this value is 1.0, but for some problems
lower values may help achieve convergence.
DUP. Max Acceleration
This is the max damping value when using the adaptive damping with relative reduced residual.
DLOW. Min Acceleration
This is the min damping value when using the adaptive damping with relative reduced residual.
Conjugate Gradient
Controls whether the conjugate gradient method is used to accelerate the solver. By default this option is on.
Stor1, Stor2, Stor3
These values are ignored in LMG2. In LMG1, these variables are used to control the amount of memory storage used
by the solver. The defaults rarely need to be changed.
IOUTAMG. Output control
This controls the information printed to the samg output file while the solver is running.
Reset
This button will change all options to the default state.
279
LMG1 Package
LMG1 Package
The LMG package is one of four solver packages for MODFLOW supported by GMS.
Maximum outer iterations
This value is the maximum iterations, or calls to the solver. For linear problems, this value can be 2. For non linear
problems, this values should be larger, but generally less than 50.
Maximum inner iterations
This value is the maximum number of iterations per call to the solver. The default value is 50, and this is sufficient
for most problems.
Acceleration type
Three different acceleration methods are available: constant, adaptive damping using the Cooley method, or adaptive
damping using the relative reduced residual. Refer to the official package documentation for more explanation on the
different damping methods.
Accleration Parameter
This value is used if the acceleration method is set to constant. Usually, this value is 1.0, but for some problems
lower values may help achieve convergence.
Max Acceleration
This is the max damping value when using the adaptive damping with relative reduced residual.
Min Acceleration
This is the min damping value when using the adaptive damping with relative reduced residual.
Budget Closure Criterion
When the scaled norm of the matrix equations is less than this value then the solver iteration stops.
Conjugate Gradient
Controls whether the conjugate gradient method is used to accelerate the solver. By default this option is on.
Stor1, Stor2, Stor3
These variables are used to control the amount of memory storage used by the solver. The defaults rarely need to be
changed.
Reset
This button will change all options to the default state.
280
LPF Package
LPF Package
This package is an alternative to the BCF and HUF packages and is similar to the "true layer" option used with the
BCF package in version 3.1. With MODFLOW 2000, the layer elevations (top and bottom) are defined as input to
the Global Process (using the Global Options Dialog), regardless of which flow package is being used. With the LPF
package, the user then defines the horizontal and vertical hydraulic conductivity for each layer. MODFLOW then
computes the cell by cell conductances using the K values and the layer geometry.
Other noteworthy features include the ability to enter horizontal anisotropy values on a cell by cell basis. There is
also an option to specify vertical anisotropy factors rather than vertical hydraulic conductivity values. This option is
particularly useful when performing automated parameter estimation since it ties the Kv to Kh and eliminates the
need to define Kv as an independent parameter.
Another feature of the LPF package relative to the BCF package is that there are now only two layer types: confined
and convertible. A convertible layer is similar to the LAYCODE = 2 and LAYCODE = 3 types in the BCF package.
The layer can be either confined or unconfined depending on the elevation of the computed water table.
Once the LPF package has been chosen using the packages dialog, the LPF package dialog can be accessed through
the LPF package command in the MODFLOW menu.
Use data arrays
This option allows you to enter conductivities on a layer-by-layer basis. When this option is chosen, the Horizontal
Hyd. Conductivity…, Vertical Hyd. Conductivity, Specific Storage, etc. buttons will be available.
Use material ids
This options uses material sets in the place of property arrays. Property values are entered on a material-by-material
basis. When MODFLOW files are saved, GMS internally replaces the correct values from the materials to the
property arrays. When this option is chose, the property array buttons are replaced with the Material Properties and
Material IDs buttons.
Layer
This field displays the current layer. Selecting any of the input array buttons will display the corresponding layer
initially. For multiple layer models, this field can be incremented or decremented to show other layers.
Layer type
This radio group selects the layer type for the current layer. By default, all layers are convertible. Here you can
change the layer type to confined.
Vertical hydraulic conductivity
The LPF package has the option to enter vertical hydraulic conductivity values as either actual hydraulic
conductivity values or as anisotropy factors dependant on horizontal hydraulic conductivity. Vertical anisotropy
(VKA) "is the ratio of horizontal to vertical hydraulic conductivity. In this case, HK is divided by VKA to obtain
vertical hydraulic conductivity, and values of VKA typically are greater than or equal to 1.0."[1] These options are
only available for multi-layer models.
281
LPF Package
Interblock transmissivity
The method used for computing interblock transmissivity is specified using the pull-down list in the middle right
portion of the LPF Package dialog.
Layer Data Arrays
The eight buttons in the lower right portion of the dialog represent layer data arrays such as elevations and hydraulic
conductivity. Each of the eight buttons brings up the MODFLOW Array Editor. Not all of the data arrays need to be
specified for each layer. Some arrays such as specific storage and specific yield are only required for transient
models.
Head Assigned to Dry Cells
This is the value that MODFLOW will give to cells with a head level below the bottom elevation of the cell (dry
cell). When reading in a solution, GMS will mark cells with this value with a dry cell symbol.
Remove vertical leakance correction
This is the value that MODFLOW will give to cells with a head level below the bottom elevation of the cell (dry
cell). When reading in a solution, GMS will mark cells with this value with a dry cell symbol. The Layer Property
Flow Package of MODFLOW-2000 was modified by A.W. Harbaugh (U.S. Geological Survey, written commun.,
2002) to remove the vertical leakage correction for conditions in which a partially saturated cell is immediately
below a fully or partially saturated cell (Harbaugh and others, 2000, p. 31-33). The vertical leakage correction
simulates perched conditions within an aquifer system. However, perched conditions are not known to be widespread
on a basin scale. The vertical leakage correction adds an additional nonlinear term to the model (A.W. Harbaugh,
U.S. Geological Survey, written commun., 2002), which resulted in several of the numerical solvers (SIP (strongly
implicit procedures), SOR (slice-successive overrelaxation), and PCG (Hill, 1990; Harbaugh and others, 2000) not
coming to a solution and the LMG (link-algebraic multigrid; Mehl and Hill,2001) solver providing unacceptable
volumetric budget errors (wrir02-4200.pdf) . Thus in the LPF package the user has the option to turn off the vertical
leakance correction to account for these factors. As the user turns on the "Remove Vertical Leakance Correction"
toggle, GMS then uses the NOCVCORRCTION [2] option that is found in MODFLOW2005 to remove vertical
leakance corrections.
Cell Rewetting Parameters
If wetting of cells is allowed, a wetting factor, wetting iteration interval, and wetting equation must be specified.
Notes
[1] Harbaugh, A.W., Banta, E.R., Hill, M.C., McDonald, M.G. (2000), MODFLOW-2000, the U.S. Geological Survey modular ground-water
model — User guide to modularization concepts and the Ground-Water Flow Process (http:/ / water. usgs. gov/ nrp/ gwsoftware/
modflow2000/ ofr00-92. pdf), Open-File Report 00-92, U.S. Geological Survey, p. 62,
[2] http:/ / water. usgs. gov/ nrp/ gwsoftware/ modflow2000/ MFDOC/ index. html?lpf. htm
282
MNW1 Package
283
MNW1 Package
The Multi-Node Well (MNW1) package was developed to more accurately model wells that are completed in
multiple aquifers or in a single heterogeneous aquifer, partially penetrating wells, and horizontal wells that can be
affected by the effects of dynamic changes in the distribution of pumping or intraborehole flow that can significantly
alter groundwater flow. A more recent revision of the MNW package is available in the MNW2 package. A
MODFLOW model can not use both the MNW1 and MNW2 packages, it must use one or the other.
MNW1 boundary conditions can be added to selected cells using the Point Sources/Sinks command in the
MODFLOW menu. MNW1 points can also be defined using the conceptual model approach in the map module.
[1]
Illustration of MNW package
Conceptual model
MNW1 Wells can be modeled using points in a conceptual model. The user can specify the various MNW1
properties associated with points in a coverage. In addition, a multi-node MNW1 boundary condition (bc) can be
created using the conceptual model approach. The easiest way to create a multi-node MNW1 bc is to define a well
screen associated with the MNW1 point that crosses multiple layers of the MODFLOW grid. Another method for
creating a multi-node MNW1 bc is to specify a common "Well ID" to group different points together. Thus, multiple
points in the same or different coverages can be used to create multi-node MNW1 bcs.
Multi-Node Well package dialog
The Multi-Node Well (MNW1) package dialog allows the user to edit the location and the input values associated
with each mnw boundary condition. MNW1 boundary conditions cannot be created or deleted from this dialog. They
can be created and deleted via the Map -> MODFLOW command, or by using the MODFLOW Source/Sink Dialog.
The upper section of the dialog controls global options for the package. The spreadsheet in the lower section of the
dialog controls the bcs that vary with each stress period. The user is referred to the MNW1 documentation for a full
explanation of each of the inputs to the MNW1 boundary conditions. In GMS we have added the Name, Active, and
Well ID fields. Name is a label used to identify a boundary condition. Active is a flag used to determine if the
boundary condition is used during a particular stress period. The Well ID field is used to identify multi-node wells.
MNW1 Package
284
Notes
[1] Halford, Keith J. (2002), User Guide for the Drawdown-Limited, Multi-Node Well (MNW) Package for the U.S. Geological Survey's Modular
Three-Dimensional Finite-Difference Ground-Water Flow Model, Versions MODFLOW-96 and MODFLOW-2000. Open-File Report 02-293.
(http:/ / pubs. usgs. gov/ of/ 2002/ ofr02293/ text. pdf), Sacramento, California,
MNW2 Package
The Multi-Node Well (MNW2) package is an updated revision of the MNW package meant to replace the MNW1
Package. It includes modifications to better model partially penetrating wells, non-vertical wells, and includes the
ability to specify a pump performance curve. The MNW package was developed to more accurately model wells
spanning multiple aquifers or in a single heterogeneous aquifer, partially penetrating wells, and horizontal wells that
can be affected by the effects of dynamic changes in the distribution of pumping or intraborehole flow that can
significantly alter groundwater flow. A MODFLOW model can not use both the MNW1 and MNW2 packages, it
must use one or the other. A detailed description of the MNW2 input is available at the USGS website [27].
MNW2 boundary conditions can be directly added via the Multi-Node well (MNW2) package dialog. Boundary
conditions can also be added to selected cells using the Point Sources/Sinks command in the MODFLOW menu. For
a conceptual model MNW2 points can be defined in the map module.
[1]
Illustration of MNW2 package
Conceptual Model
An MNW2 well can be added to a conceptual model by creating an MNW2 point. The geometry of the well screen
can be set using the Use screen attribute for a single screen, or for multiple screens the geometry can be set using the
Boreline attribute button. If niether one is set, the generated well nodes include the grid layers specified for the
coverage by its default layer range.
Multi-Node Well (MNW2) Package Dialog
MNW2 Wells can be edited in the Multi-Node Well (MNW2) Package Dialog. The main dialog allows editing stress
period data for wells. The stress period field shows the current stress period and allows you to cycle through stress
periods and view the well properties for each stress period in the spreadsheet below. MNW2 AUX fields can be
added and removed by clicking on the Edit AUX... button. The values are displayed in the spreadsheet. Controls to
edit the print detail (MNWPRNT) and the MNWI package values are available below the spreadsheet. Wells can be
added, edited and removed by clicking on the Wells... button to bring up the MNW2 Wells Dialog.
MNW2 Package
MNW2 Wells Dialog
The MNW2 Wells Dialog allows wells to be added, removed, and edited. It consists of two spreadsheets. The top
spreadsheet lists the table of MNW2 wells. When a well in the top spreadsheet is clicked on, the nodes for the well
are listed in the bottom spreadsheet. Nodes can be added and removed by changing the NNODES column in the
wells spreadsheet.
Sources/Sinks Dialog
An MNW2 well can be added or edited for a selected cell using the Sources/Sinks menu item under the MODFLOW
menu. The well info can be edited from the Sources/Sinks Dialog by clicking on the button in the Edit column.
Notes
[1] Konikow, Leonard F. (2009), Revised multi-node well (MNW2) package for MODFLOW ground-water flow model: U.S. Geological Survey
Techniques and Methods 6–A30 (http:/ / pubs. usgs. gov/ tm/ tm6a30/ pdf/ TM-6A30__hirez. pdf), Reston, Virginia,
NWT Package
The Newton package (NWT) is one of the solvers available in MODFLOW-NWT. The NWT package is only used
with the UPW Package. Using the NWT solver requires twice the memory of other MODFLOW solvers because
using the Newton method results in an asymmetric matrix. Because of the asymmetric matrix a different matrix
solver must be used. The NWT package provides an option to use one of two matrix solvers: a
generalized-minimum-residual (GMRES) solver and an Orthomin/stabilized conjugate-gradient solver called xMD
(chi-MD).
For more information on the NWT package see the USGS documentation here. [16]
285
PCG2 Package
PCG2 Package
The PCG2 package is one of four solver packages for MODFLOW supported by GMS.
Maximum outer iterations
This value is the maximum iterations, or calls to the solver. For linear problems, this value can be 1, unless more
than 50 inner iterations are required, when maximum outer iterations could be as large as 10. For non linear
problems, this values should be larger, but generally less than 100.
Maximum inner iterations
This value is the maximum number of iterations per call to the solver. The default value is 50, and this is sufficient
for most problems.
Matrix Preconditioning Method
Use this radio group to choose the matrix conditioning method. The default is to use a modified incomplete cholesky
method.
Relaxation Parameter
This value is used if the modified incomplete cholesky method is used. Usually, this value is 1.0, but for some
problems a value of 0.99, 0.98, or 0.97 will reduce the number of iterations required for convergence.
Head Change Criterion For Convergence
When the maximum absolute value of head change from all cells during an iteration is less than or equal to the head
change criterion, AND the residual change criterion is met, solver iteration stops.
Residual Change Criterion For Convergence
When the maximum absolute value of residuals from all cells during an iteration is less than or equal to the residual
change criterion, AND the head change criterion is met, solver iteration stops.
Reset
This button will change all options to the default state.
286
RCH Package
RCH Package
The Recharge package is used to simulate recharge to an aquifer due to rainfall and infiltration. Recharge is typically
defined by specifying a recharge value for each stress period for each vertical column in the grid (i.e., a NLAY X
NCOL array of values is entered). The recharge value represents the amount of water that goes into the groundwater
system and not the amount of precipitation. The units of recharge are length/time, so in a cell with a recharge value
of 10(m/day), 10 meters of rainfall each day would be distributed across every m2 of the cell. The recharge
parameters are specified in the Recharge Package dialog. The options in the dialog are as follows:
Recharge Option
Three recharge options are supported by MODFLOW: recharge only at the top layer, recharge at specified vertical
cells, and recharge at highest active cells.
Multiplier
The multiplier is a constant which can be written to the package file with each stress period array. Each value in the
array is scaled by the multiplier as the array is imported to MODFLOW. The format button brings up a dialog listing
the standard MODFLOW formats. This format is used for displaying the values in the spreadsheet and it controls
how the values are written to the package file.
Stress Periods
The values displayed in the spreadsheet are for an individual stress period. The values associated with other stress
periods can be edited by entering the ID of the desired stress period in the Stress period edit box in the center of the
dialog. If the Use previous option is selected for a given stress period, the values from the previous stress period are
used and the spreadsheet is dimmed.
Layer Indicator
If the Recharge at specified vertical cells option is chosen, the layer indicator for each vertical cell can be displayed
and edited in the spreadsheet window by selecting Layer indicator in the View/Edit option.
Constant -> Array
The Constant -> Array button brings up a dialog which prompts for a single value. This constant is then assigned to
each item in the array for the given stress period.
2D Data Set -> Array
The 2D Data Set -> Array button brings up the Data Browser listing all of the current data sets associated with the
current 2D grid. In order for this button to be active, the 2D grid must have the same number of rows and columns as
the 3D grid. The selected data set is copied to the recharge array. Data sets are typically generated with the 2D
Scatter Point module. The 2D Scatter Point module can be used to interpolate from a scattered set of rainfall
measurements to the cell locations. If the data set is transient, the values in the data set are linearly interpolated, if
necessary, to each stress period as the data set is copied to the array.
287
RCH Package
Array -> 2D Data Set
The Array -> 2D Data Set button copies the array to the 2D data set list associated with the existing 2D grid.
Spreadsheet
The recharge flux values for each of the vertical columns in the grid are displayed and edited in the spreadsheet at
the lower part of the dialog.
Reset
The Reset button deletes all of the data currently defined in the package and restores the package parameters to the
default values.
RIV Package
A set of selected cells can be specified as river cells using the Point Sources/Sinks command in the MODFLOW
menu or river cells can be created using the conceptual model in the Map module. River attributes are typically used
with arcs but may also be associated with polygons and points. The river parameters include elevation, stage, and
conductance. Elevation is constant. The river stage and conductance may either be constant or vary with time.
When the river attribute is assigned to an arc, the conductance is applied uniformly over the arc, but separate
elevations and stage values are applied to each of the nodes on the ends of the arc, and the elevation and stage are
assumed to vary linearly between the nodes. When a river object is defined using a polygon or a point, all of the
values are assigned directly to the cell(s) overlapped by the polygon or point.
Once a set of river cells has been specified, the MODFLOW River Package dialog can be used to view and edit the
values assigned to the cells. The options in the dialog are as follows:
Stress Period
This field shows the current stress period and allows you to cycle through the stress periods and view the different
river properties for those stress periods in the spreadsheet below.
Spreadsheet
For cells where river type boundary conditions have been assigned, the stage, conductance, bottom elevation, and
conductance factor assigned to each cell are displayed in the spreadsheet portion at the lower part of the dialog. The
spreadsheet can be used to edit the row, column, layer, stage, conductance, and bottom elevation values. For a
transient simulation, the values displayed in the spreadsheet are for an individual stress period. The values associated
with other stress periods can be edited by entering the number of the desired stress period in the stress period edit
box in the center of the dialog. If the Use previous option is selected for a given stress period, the values from the
previous stress period are used and the spreadsheet is dimmed. The conductance factor is used with RIV parameters.
When doing parameter estimation the value of river conductance assigned to a particular river boundary condition
will be the value of the river parameter multiplied by the conductance factor. For more information on RIV
parameters and conductance factors see the MODFLOW 2000 manual.
288
SIP Package
SIP Package
The SIP package is one of four solver packages for MODFLOW supported by GMS.
Maximum Iterations Per Time Step
This value is the maximum number of times through the iteration loop in one time step in an attempt solve the
system of finite-difference equations.
Number of Iteration Parameters
Five variables are generally sufficient.
Acceleration Parameter
This value must be greater than zero and is usually 1.0.
Head Change Criterion For Convergence
When the maximum absolute value of head change from all cells during an iteration is less than or equal to the head
change criterion, solver iteration stops.
Print Out Interval
The maximum absolute head change is printed for each iteration of a time step whenever the time step is an even
multiple of the print out interval. The printout also occurs at the end of each stress period regardless of the print out
interval.
Iteration Parameter Seed
These options control the seed for calculating iteration variables. You can either specify the seed yourself or have
MODFLOW calculate it.
Reset
This button will change all options to the default state.
289
SSOR Package
SSOR Package
The SSOR package is one of four solver packages for MODFLOW supported by GMS. The SOR solver only uses a
head change convergence criterion and may result in significant volume budget error.
Maximum iterations per time step
This value is the maximum solver iterations per timestep. The default value is 50.
Acceleration Parameter
This value is usually between 1.0 and 2.0
Head change criterion for convergance
When the maximum absolute value of head change from all cells during an interation is less than or equal to the head
change criterion, solver iteration stops.
Print out interval
The maximum absolute head change is printed for each iteration of a time step whenever the time step is an even
multiple of the print out interval. The printout also occurs at the end of each stress period regardless of the print out
interval.
Reset
This button will change all options to the default state.
290
STR/SFR Packages
STR/SFR Packages
The STR and SFR packages are used to simulate the interaction between surficial streams and the groundwater.
These packages are somewhat similar to the River package in that water can move from the stream to the aquifer or
from the aquifer to the stream depending on the relative differences in the stream stage and the water table
elevations. However, unlike the River package, flow is routed through the stream. For the STR package, simple
channel hydraulics and Manning's equation are used to compute the stage in the stream. The SFR package has more
sophisticated hydraulics and routing options.
Stream Network
When either the STR or SFR package is used, a complete, ordered stream network must be defined as shown in the
following figure.
A stream network is composed of reaches and
segments. A reach is the portion of a stream that lies
inside a single cell. A single cell may contain multiple
reaches. A segment is a group of reaches that forms one
section of the stream. The reaches within a segment are
always numbered from upstream to downstream. The
segments should also be numbered from upstream to
downstream.
The incoming flowrate may only be defined for the
topmost segments (segments 1, 4, and 6 in the above
figure) and is typically entered as a positive value to
represent the amount of flow in the stream channel.
Ordered stream network used by the STR or SFR packages.
Flow is then routed and combined to get the incoming
flowrate for the other segments. An exception to this is a diversion such as the canal at segment #2 in the above
figure. In this case the flowrate into the diversion should be specified. The flow to the diversion would be subtracted
from the flow coming out of segment #1 and whatever is left over would be routed to segment #3.
Defining Streams
Unlike other packages in GMS, a stream network cannot be created by selecting cells in the grid and manually
assigning values to the cells. Due to the complex nature of the input and the requirement that the data be ordered in a
specific fashion, a stream network can only be created using a series of Stream Arcs in the Map module. The
cell-by-cell values are automatically created and properly ordered when the Map -> MODFLOW command is
selected.
There are some restrictions on the STR and SFR conceptual models:
• STR and SFR stream arcs cannot both exist in the same coverage because of the stream numbering issues.
• All STR (or SFR) arcs must be in one coverage. You cannot use two or more coverages to represent your stream
network.
• SFR - All downstream streams must be diversions except for one. The variable OUTSEG is the segment number
of the downstream segment that is not a diversion.
• SFR - If the current segment has the diversion flag set then IUPSEG is the id of the upstream segment.
291
STR/SFR Packages
Set Arc Directions From Stream Data
Right-clicking on a coverage containing STR streams shows a Set Arc Directions From Stream Data menu item.
This operation will cause all stream arcs to point downhill based on the elevation of the top of the river sediments as
defined at the nodes.
STR Package
In the input file for the STR package, each reach is assigned the following values:
• ijk indices of cell
• segment ID
• reach ID
• stage (typically starting stage)
• conductance
• conductance factor (multipled by the conductance during parameter estimation)
• Elevation of the bottom of the streambed
• Elevation of the top of the streambed
Each segment is assigned the following values:
• incoming flow (for top segments and diversions)
• width
• slope
• roughness coefficient
• IDs of tributaries (upstream segments)
• ID of upstream segment (for diversions only)
When Manning's equation is used to route the flow through the network, the stream channels are assumed to have a
rectangular cross section.
When the Map -> MODFLOW command is selected, GMS automatically does the following: classifies all of the
cells beneath the streams as reaches, builds segments, numbers the reaches and segments, and assigns the appropriate
values to the reaches and segments. These values defined at the nodes are linearly interpolated across the arcs when
the model is converted. The slope assigned to reaches is computed by dividing the difference in the streambed top
elevations at the ends of the arc by the arc length multiplied by the sinuosity factor.
The STR Package Dialog
Once the Map -> MODFLOW command is selected and the stream data have been assigned to the grid cells, the
data can be viewed and some of the input values can be edited using the Stream Package dialog. The options for the
Stream Package dialog include:
Calculate Stage
The Calculate stage toggle is used to specify whether the Stream package should compute the stages (specified
stages are initial values only) or whether the specified stages should be used directly.
292
STR/SFR Packages
SFR Package
Support for the SFR2 package was added at GMS version 7.0.
The SFR Package Dialog
Once the Map -> MODFLOW command is selected and the stream data have been assigned to the grid cells, the
data can be viewed and some of the input values can be edited using the SFR Package dialog. Stream segments and
reaches cannot be created in the SFR Package dialog - creation can only be done via the Map -> MODFLOW
command. The SFR Package dialog has two spreadsheets, one showing stream segments and one showing stream
reaches. For a further explanation of the columns in each spreadsheet you can refer to the Online Guide to
MODFLOW [30].
ISTCB2 info
If the Save ISTCB2 info to *.istcb2 text file option is on, MODFLOW will save more stream related data to a text file
which has the same prefix as the other MODFLOW files and a "*.istcb2" extension. This text file will be displayed
in the MODFLOW Solution in the Project Explorer when the solution is imported. The data in this file includes
information on "inflows and outflows from each reach; on stream depth, width, and streambed conductance; and on
head difference and gradient across the streambed."
If the Save ISTCB2 info to *.istcb2 text file option is off, streamflow out of each reach will be saved to the CCF file
if the Save cell by cell flow terms to *.ccf file is on in theOutput Control dialog.
UZF Package
The UZF Package is used to simulate percolation of water through the unsaturated zone. This package is compatible
with MODFLOW 2005 (not earlier versions of MODFLOW).
The inputs to the UZF Package are edited in the UZF Package dialog. The inputs to the UZF package are explained
here [1]. All of the inputs are labeled using the MODFLOW variable names.
Gages
The spreadsheet with the IUZROW, IUZCOL, IFTUNIT, and IUZOPT columns is used to edit gages associated with
the UZF package. By default GMS will assign the unit numbers to the gage files (the IFTUNIT variable). However,
the user can specify these values by turning on the toggle below the spreadsheet and entering the unit numbers in the
IFTUNIT column. Gages can be added or removed by selecting the insert or delete buttons below this spreadsheet.
Care should be taken to enter unique unit numbers. The user can inspect the MODFLOW name file (*.mfn) written
by GMS to ensure that the specified unit numbers are unique.
293
UZF Package
Multiplier
The multiplier is a constant which can be written to the package file with each array. Each value in the array is scaled
by the multiplier as the array is imported to MODFLOW.
Stress Periods
The values displayed in the spreadsheet are for an individual stress period for the first 4 arrays (FINF, PET, EXTDP,
and EXTWC). The other arrays are not specified per stress period.
The values associated with different stress periods can be edited by entering the ID of the desired stress period in the
Stress period edit box. If the Use previous option is selected for a given stress period, the values from the previous
stress period are used and the spreadsheet is not editable.
Constant -> Array
The Constant -> Array button brings up a dialog which prompts for a single value. This constant is then assigned to
each item in the array for the given stress period.
2D Data Set -> Array
The 2D Data Set -> Array button brings up the Data Browser listing all of the current data sets associated with the
current 2D grid. In order for this button to be active, the 2D grid must have the same number of rows and columns as
the 3D grid. The selected data set is copied to the recharge array. Data sets are typically generated with the 2D
Scatter Point module. The 2D Scatter Point module can be used to interpolate from a scattered set of rainfall
measurements to the cell locations. If the data set is transient, the values in the data set are linearly interpolated, if
necessary, to each stress period as the data set is copied to the array.
Array -> 2D Data Set
The Array -> 2D Data Set button copies the array to the 2D data set list associated with the existing 2D grid.
Spreadsheet
The values for the array listed in the View/Edit selection box are shown in the spreadsheet.
References
[1] http:/ / water. usgs. gov/ nrp/ gwsoftware/ modflow2000/ MFDOC/ uzf_unsaturated_zone_flow_pack. htm
294
WEL Package
WEL Package
A set of selected cells can be specified as wells using the Point Sources/Sinks command in the MODFLOW menu or
by using the conceptual model in the Map module. Wells are specified by assigning a pumping rate to a selected cell
at the location of each well. Wells can be either injection wells (positive flow rate) or extraction (negative flow rate)
wells.
Once a set of cells has been specified, the Well Package dialog can be used to view and edit the values assigned to
the cells.
Stress Period
The stress period field shows the current stress period and allows you to cycle through the stress periods and view
the different well properties for those stress periods in the spreadsheet below.
Use Previous
Use this option on a stress period to use the well values from the previous stress period for the current stress period.
This option is unavailable for steady state models and the first stress period of transient models.
Spreadsheet
For cells where well type boundary conditions have been assigned, the well flow rate for each cell is displayed in the
spreadsheet portion at the lower part of the dialog. The spreadsheet can be used to edit the well name, row, column,
layer, and flow values.
For a transient simulation, the values displayed in the spreadsheet are for an individual stress period. The values
associated with other stress periods can be edited by entering the number of the desired stress period in the stress
period edit box in the center of the dialog. If the Use previous option is selected for a given stress period, the values
from the previous stress period are used and the spreadsheet is dimmed.
The conductance factor is used with WEL parameters. When doing parameter estimation the value of well
conductance assigned to a particular well boundary condition will be the value of the well parameter multiplied by
the conductance factor. For more information on WEL parameters and conductance factors see the MODFLOW
2000 manual.
Display Cell IDs/IJK
The radio group at the bottom of the dialog allows the user to adjuster whether the cell ID or the cell i, j, k values are
displayed for the cells containing the boundary condition/source/sink.
Delete All
The Delete All button deletes all of the data currently defined in the River package and restores the River package
parameters to the default values.
295
296
6.3.2. MODFLOW Pre-Processing
Building a MODFLOW Model
Two basic approaches are provided in GMS for constructing a MODFLOW model: the model can be completely
defined using the tools in the 3D Grid module, or the model can be defined with the aid of the feature objects in the
Map module. Also, scatter points and solids can be used to define layer elevation, and boreholes can be used with
TPROGS to create material sets for the 3D grid.
Basic Steps in Building a MODFLOW Model
The basic steps in building a MODFLOW model include:
• Build a 3D grid defining the extents of the model. Two approaches are available:
• MODFLOW Grid Approach
•
•
•
•
•
• MODFLOW Conceptual Model Approach
Initialize MODFLOW
Assign boundary conditions and model stresses, including sources and sinks
Define layer elevations
Assign material properties
Run MODFLOW
MODFLOW Array Editor
The MODFLOW Array Editor is used throughout the MODFLOW interface to edit array based data. It includes the
following features:
Spreadsheet
The array is displayed in a spreadsheet and each value can be selected and edited. Individual layers in the array are
displayed one at a time. The edit fields in the spreadsheet associated with inactive cells are dimmed.
Layers
The edit field in the upper left corner of the dialog is used to switch to a different layer.
MODFLOW Array Editor
Multiplier
The multiplier is a value that can be specified to scale all of the values in the array.
Constant -> Grid
The Constant -> Grid button prompts for a single value and assigns the value to all of the cells in the entire array.
Constant -> Layer
The Constant -> Layer button prompts for a constant value which is assigned to all of the cells in the currently
displayed layer.
3D Data Set -> Grid
The 3D Data Set -> Grid button brings up the Select Data Set dialog listing all of the current data sets associated
with the 3D grid. The selected data set is then copied into the starting heads array. This option is typically used to
load in a previously computed MODFLOW solution to use as the initial condition. The previously computed solution
must be imported as a data set before selecting this option.
2D Data Set -> Layer
The 2D Data Set -> Layer button allows the user to select one of the data sets associated with a 2D grid and copy it
to the current layer of the starting heads array. In order for this button to be active, a 2D grid that has the same
number of rows and columns as the 3D grid must be imported or created. Such a grid can be automatically generated
using the Grid -> 2D Grid command in the Grid menu. The 2D Data Set -> Layer option is typically used to load in
a data set that has been created by interpolating heads from a 2D scatter point set to the 2D Grid.
Grid -> 3D Data Set
The Grid -> 3D Data Set button copies values from the entire starting heads array to the 3D grid data set list.
Layer -> 2D Data Set
The Layer -> 2D Data Set button copies values from the selected layer of the starting heads array to the 2D grid data
set list.
297
MODFLOW Grid Approach
MODFLOW Grid Approach
Building a MODFLOW 3D Grid
For models with simple geometry and boundary conditions, the entire model can be constructed using the tools and
commands in the 3D Grid module. With this approach, the editing of the MODFLOW data is performed directly on
the grid on a cell-by-cell basis. The main steps are as follows:
• Create a 3D cell-centered grid covering the domain to be modeled using the Create Grid command in the Grid
menu.
• Use the commands in the MODFLOW menu to initialize and define the data required by the MODFLOW
packages.
• Sources and sinks such as wells are defined by selecting the cells and assigning the attributes directly to the
cells.
Defining the Layer Data
An important part of a MODFLOW model is the definition of the layer data (hydraulic conductivity, layer
elevations, leakance, etc.). While both the Grid and Map module approaches to constructing a MODFLOW model
can be used to define the layer data, both approaches may lead to an overly simplistic definition of the stratigraphy.
Layers with spatially varying thicknesses can be handled most effectively using a special set of layer data tools
provided in GMS. Solids can also be used to define layer data with the Solids->MODFLOW and Solids->HUF
commands.
MODFLOW Conceptual Model Approach
A MODFLOW model can be created in GMS using one of two methods: assigning and editing values directly to the
cells of a grid (the grid approach), or by constructing a high level representation of the model using feature objects in
the Map module and allowing GMS to automatically assign the values to the cells (the conceptual model approach).
Except for simple problems, the conceptual model approach is typically the most effective.
Definition
In GMS, the term conceptual model is used in two different ways. In the generic sense, a conceptual model is a
simplified representation of the site to be modeled including the model domain, boundary conditions, sources, sinks,
and material zones. GMS also has a conceptual model object, that can be defined in the Map module. The conceptual
model object can contain coverages.
A conceptual model object can be defined in the Map module using feature objects, such as points, arcs, and
polygons. The conceptual model is constructed independently of the numerical grid. Once the conceptual model
object is defined, a grid can be automatically generated to fit the conceptual model. The boundary conditions and
model parameters are computed and assigned to the proper cells. The MODFLOW data are converted from the
conceptual model to the cells of the grid. This approach to modeling fully automates the majority of the data entry
and eliminates the need for most or all of the tedious cell-by-cell editing traditionally associated with MODFLOW
modeling. Once the conceptual model is constructed and converted to a grid, the package dialogs and interactive
editing tools in the MODFLOW menu can be used to edit or review the data if desired.
A complete conceptual model object consists of several coverages. One coverage is typically used to define the
sources and sinks such as wells, rivers, lakes, and drains. Another coverage (or the same coverage) is used to define
298
MODFLOW Conceptual Model Approach
the recharge zones. Other coverages can be used to define the zones of hydraulic conductivity within each layer. Any
number of coverages may be used, or all these attributes may exist in the same coverage.
In addition to the feature data, a conceptual model may include other data (scatter points, boreholes, solids) to define
the layer elevations. A specialized set of tools for manipulating layer elevation data is provided in GMS.
Steps in Developing a Conceptual Model
Several steps are involved in setting up a MODFLOW conceptual model and converting the conceptual model to a
numerical model. The basic steps are as follows:
1. Create a MODFLOW conceptual model in the Map Module.
2. Decide how many coverages you will need and what attributes you want with each. It is typical to use three
coverages, each with a different purpose. One coverage is used for sources and sinks, like wells, specified head
boundaries etc. Another coverage is used for recharge, and another is used for hydraulic conductivity. However, it
is not required to use coverages in this manner, and the attributes associated with a coverage are user defined, so
you can define a coverage with any combination of attributes. Thus, if your recharge zones were the same as your
hydraulic conductivity zones, you might use just one coverage for both.
3. Create the sources and sinks. The most effective way to do this is with the aid of a background Image. A digital
image representing a scanned map or an aerial photo of the site can be imported and displayed in the background
using the image tools. Once the image is displayed, feature objects defining the model boundary, rivers, lakes,
flow barriers, and specified head boundaries can be created on top of the background image.
4. Create the areal features, such as recharge zones and evapotranspiration zones.
5. Create the layer features, such as hydraulic conductivity zones.
6. Use the Grid Frame command to place an outline of the numerical grid on the conceptual model. The frame is
placed so that it just surrounds the conceptual model. The frame can be rotated if necessary if the major axis of
the model is at an angle.
7. Use the Feature Objects | Map -> 3D Grid command to automatically generate a grid. The location of the grid is
controlled by the Grid Frame and the density of the grid is automatically adjusted around user-specified points
(typically wells).
8. Define the active region of the grid using the Activate Cells in Coverage command. This automatically activates
all of the cells within the boundary of the conceptual model and inactivates all cells outside the boundary.
9. Initialize the MODFLOW data by selecting the New Simulation command in the MODFLOW menu. Select the
type of mode (steady state vs. transient) and define stress periods if necessary. Define a set of starting heads. Go
to the LPF/BCF/HUF Package dialog and define the layer type for each of the layers in the grid.
10. Select the Map -> MODFLOW command to automatically assign the MODFLOW boundary conditions,
stresses, and material properties to the appropriate cells in the grid.
11. Use the specialized interpolation tools to define the layer elevations.
In many cases, it is useful to repeat some, but not all, of these steps. For example, suppose after running a simulation
it is determined that one of the boundaries of the model corresponding to a groundwater divide is not properly
located. The boundary can be moved by simply selecting and dragging the vertices and nodes of the arc(s) defining
the boundary. Once the boundary is moved, step 6 should be repeated to redefine the active/inactive regions and then
step 8 is repeated to reassign the model data to the cells.
299
MODFLOW Conceptual Model Approach
300
Example Application
To illustrate the conceptual model approach, consider the site
shown in the following figure. It represents information that might
be available from a combination of sources including maps,
photos, and GIS data. This information may include the location of
hydrologic features as well as hydrologic properties of the site.
However, this information is not yet organized into a form that is
useful to a numerical model.
The first step in creating a conceptual model of this site
is to create points, arcs and polygons that represent
hydrologic features at the site. These points, arcs and
polygons are assigned types that correspond to the
feature they represent. Based on the attribute type,
parameters such as head, concentration and
conductance are assigned to these feature objects. The
resulting coverage is shown in the following figure.
Other coverages, defining such things as recharge
zones, would also be defined.
The final step is to take the information that is stored in
the conceptual model and construct a numerical model.
GMS automates both the creation of the grid geometry
as well as assigning boundary conditions and material
parameters to the grid. Refine points can be used to
specify areas where the grid should have a high density.
By specifying polygons that represent the domain of
the model, it is possible to automatically inactivate all
the cells that lie outside that domain. Boundary
conditions may be applied to the individual cells that
are intersected by specified feature objects. In addition
to determining which cells are assigned boundary conditions, GMS also calculates the appropriate values to assign to
each stress period of a transient simulation. The resulting numerical model is illustrated in the following figure.
Advantages of the Conceptual Model Approach
There are numerous benefits to the conceptual model approach. First of all, the model can be defined independently
of the grid resolution. The modeler does not need to waste valuable time computing the appropriate conductance to
assign to a river cell based on the length of the river reach within the cell. This type of computation is performed
automatically. Furthermore, transient parameters such as pumping rates for wells can also be assigned independently
of model discretization. Transient parameters are entered as a curve of the stress vs. time. When the conceptual
model is converted to the numerical model, the transient values of the stresses are automatically assigned to the
MODFLOW Conceptual Model Approach
appropriate stress periods. Since the conceptual model is defined independently of the spatial and temporal
discretization of the numerical model, the conceptual model can be quickly and easily changed and a new numerical
model can be generated in seconds. This allows the modeler to evaluate numerous alternative conceptual models in
the space of time normally required to evaluate one, resulting in a more accurate and efficient modeling process.
A further advantage of storing attributes with feature objects is that the method of applying the boundary conditions
to the grid cells reduces some of the instability that is inherent in finite difference models such as MODFLOW and
MT3DMS. When the user enters individual values for heads and elevations, entering cell values one cell at a time
can be tedious. It is also difficult to determine the correct elevation along a river segment at each cell that it crosses.
The temptation is to select small groups of cells in series and apply the same values to all of the cells in the group.
This results in an extreme stair-step condition that can slow or even prevent convergence of the numerical solver. By
using GMS to interpolate values at locations along a linear boundary condition such as a river, the user insures that
there will be no abrupt changes from cell to cell-thus minimizing the stair-step effect. It also produces a model with
boundary conditions that more accurately represent real world conditions.
Defining the Layer Data
An important part of a MODFLOW model is the definition of the layer data (hydraulic conductivity, layer
elevations, leakance, etc.). While both the Grid and Map module approaches to constructing a MODFLOW model
can be used to define the layer data, both approaches may lead to an overly simplistic definition of the stratigraphy.
Layers with spatially varying thicknesses can be handled most effectively using a special set of layer data tools
provided in GMS. Solids can also be used to define layer data with the Solids->MODFLOW and Solids->HUF
commands.
Activate Cells in Coverage
Once a grid has been created, the next step in converting a MODFLOW conceptual model to a numerical model is to
inactivate the cells which lie outside the boundary of the conceptual model. This is accomplished by selecting the
Activate Cells in Coverage command in the Feature Objects menu. When this command is selected, GMS utilizes
the polygons in the coverage that is designated as the model boundary to determine which cells should be active and
which cells should be inactive. Each cell is compared with the polygons in the coverage and if the cell does not lie
within the interior of any of the polygons, the cell is determined to be outside the domain of the model and is
inactivated. Cells inside the model domain are made active.
When cells are tested to determine whether they are
outside or inside the model domain, if the cell lies
partially inside the model domain and partially out, the
attribute type of the feature object on the boundary
where the cell is located is used to determine the
active/inactive status of the cell. An example of this
process is shown in the figure at the right.
If an arc on the boundary of the model domain has no
attribute assigned to it, it is assumed to be a no-flow
Sample Application of the Activate Cells in Coverage Command
boundary. If a cell is partially covered by a no-flow
boundary, the cell is activated if the majority of the cell area is inside the coverage. Conversely, the cell is
inactivated if the majority of the cell area is outside the coverage. As a result, the outer edges of the cells along the
no-flow boundary approximately coincide with the no-flow arc.
301
Activate Cells in Coverage
If an arc on the boundary of the model domain has a head dependent attribute assigned to it, a different test is used.
Any cell that intersects the arc is designated as active, regardless of what percentage of the cell is inside the model
domain. As a result, the centers of the cells along the boundary approximately coincide with the source/sink arc. This
is appropriate in this case since the stresses are applied in MODFLOW at the cell centers.
Stress Periods
The computational time intervals for a MODFLOW simulation are called "stress periods". The transient stresses
(pumping rates, river stages, etc.) can only change at the beginning of each stress period. Stress periods can be
subdivided into smaller time steps, if desired. The Stress Periods button in the Global Options\Basic Package dialog
is used to bring up the Stress Period dialog. The stress periods should be defined before any of the sources/sinks are
entered. If the steady state option in the Global Options\Basic Package dialog is selected, the Stress Periods button is
dimmed.
Each stress period is now a single row in the spreadsheet. The stress period properties such as length and number of
time steps can now be copied quickly and easily to other stress periods using the spreadsheet interface.
Initialize
A set of stress periods can be defined using the Initialize button. The Initialize button brings up a dialog which is
used to generate a set of stress periods of constant length. The dialog prompts for a number of stress periods, a
length, a number of time steps, and a time step multiplier. A set of stress periods is then generated and displayed
graphically in the stress period plot.
Stress Period Plot
The horizontal strip at the top of the Stress Periods dialog is used to graphically edit stress periods. A stress period
can be selected in the plot by clicking on the stress period with the mouse. The values associated with the selected
stress period can be edited in the spreadsheet.
Insert Buttons
New stress periods can be added by selecting a stress period and selecting either the Insert Row button
or by
editing the last row in the spreadsheet. Stress periods can be deleted by selecting the stress periods and selecting the
Remove Row button .
Reference Time
The first cell in the spreadsheet is used to enter the reference time for the MODFLOW simulation. The reference
time is the date/time corresponding to the beginning of the simulation (t=0). If the Use Date/Times option is selected
in the Time display section, all time values entered for transient input data, i.e., time series defined in the XY Series
Editor can be entered in a date/time format rather than a scalar time format. Also, when post-processing, the values
shown in the time step selector in the Data Browser or at the top of the GMS Window are displayed in the date/time
format. Furthermore, any time series curves entered as part of the MODFLOW conceptual model in the Map module
that were defined using the date/time format will be automatically converted to the proper time scale when the
conceptual model is converted to grid-based numerical model.
302
Map to MODFLOW
Map to MODFLOW
After the conceptual model is constructed and a grid has been created, the final step in converting a conceptual
model to a MODFLOW numerical model is to select the Map -> MODFLOW command. However, before this
command can be selected, MODFLOW must be initialized. MODFLOW is initialized as follows:
1. Switch to the 3D Grid module
2. Select the New Simulation command in the MODFLOW menu.
3. MODFLOW simulations are steady state by default. For a transient simulation, go to the Global Options/Basic
Package Dialog and select the Transient option. Then set up the stress periods you wish to use in the simulation.
4. By default, the top layer is unconfined and the remaining layers are confined. To use a different set of layer types,
go to the BCF/LPF/HUF Package dialog and select the appropriate layer type for each layer.
Once MODFLOW is initialized, the Map -> MODFLOW command becomes available. When the command is
selected, the Map -> MODFLOW Options dialog appears. Three options are available for converting the conceptual
model: Active coverage only, All applicable coverages, and All visible coverages. If the All applicable coverages
option is chosen, all of the feature objects in all of the MODFLOW-related coverages in the active conceptual model
are used. This option is typically selected when the conceptual model is first converted. If the Active coverage only
or the All visible coverages option is selected, only a subset of the coverages are used to update the numerical model.
Temporal Discretization
See the Temporal Discretization page.
Multiple Values Per Cell
Because GMS processes each feature object separately, there will often be sources/sinks that were derived from two
separate feature objects in the same cell. In fact, this is almost always the case in the cell that contains the endpoint
of one arc and the beginning point of an adjacent arc. This is not an error. MODFLOW handles each of the boundary
conditions in the cell simultaneously.
Specified Head Cells
Because the constant head condition forces the head in those cells to match whatever is specified, it is inappropriate
to have other boundary conditions defined in the cells that are designated constant head. Therefore, GMS processes
all of the specified head objects first. Afterwards, if there is another stress that should normally be assigned to a cell
that has been previously assigned a constant head condition, the new stress is not assigned.
Changing Head Boundary
When mapping a specified head boundary to MODFLOW, GMS always uses the CHD package (Time Variant
Specified Head package). In MF2K, a changing head boundary must be used in order to extract fluxes out of the
MODFLOW output for the arcs in the map module. With MF2K you can not get a flux observation with normal
Spec Head. It is assumed that most of the time the user would want to see the flux in/out of the boundary. If a cell
contains two different arcs, the specified head is split in 2 pieces at cells where 2 specified head arcs meet. This is
done for 2 reasons. First, the CHD package will combine the CHD boundary conditions that are in the same cell.
Second, the flux in/out of the cell will be partitioned to the 2 different arcs in the map module.
A traditional specified head boundary can be manually applied by using the IBOUND and starting heads arrays. The
computed heads from MODFLOW will be the same whether a constant head or changing head boundary is used.
303
Map to MODFLOW
Well Screens
When using well screens in your conceptual model the following equation is used to partition the flow to
different layers:
where
Qi = The flow rate for layer i
(kh)i = The horizontal hydraulic conductivity for layer i
Bi = The length of the well screen intercepted by the layer
For example
Assuming the K's are the horizontal K's, Q1 would be computed as:
In order to complete this computation, the K's must be assigned to the cells in the grid. You must assign the K values
to the grid prior to executing the Map -> MODFLOW command.
If the HUF package is being used then the K value for each cell is estimated from the HUF units.
Automatic Layer Assignment
When building a MODFLOW conceptual model with a multi-layer model, it is necessary to define the range of
layers associated with a particular source sink object. For example, an arc corresponding to a specified head
boundary condition may be associated with layers 1-3 on the edge of a model. On the other hand, a drain arc in the
middle of the model may only be associated with the top layer. The following example shows how a specified head
boundary condition would map with the "Use layer range" option with the range set from 1 to 2:
In some cases, however, the proper layer for a particular source/sink object will depend on the elevation of the object
relative to the layer elevations. For example, a drain may represent a channel that cuts through the terrain. In some
places the channel may be shallow and correspond to layer 1. In other places, the channel may be deep enough that it
cuts into layer 2. The "Auto assign to one cell" option is used for defining the layer range in these cases. If this
option is selected, the object will be associated with the layer where the elevation or head associated with the object
falls between the top and bottom elevation for the layer. The following shows how the same specified head boundary
304
Map to MODFLOW
condition would map with the "Auto assign to one cell" option:
The "Auto-assign including lower cells" option is useful for cases where you want a specified head boundary
assigned to the layer where the head is between the top and bottom elevation of the cell as well as any active cells
below that cell. The following shows how the same specified head boundary condition would map with the
"Auto-assign including lower cells" options:
Defining the Layer Elevations
One of the most important steps in defining a MODFLOW model is to define the layer elevations. The layer
elevations are stored in the Global Options/Basic package. The layer elevations include a top elevation for layer 1
and a bottom elevation for all layers. For all layers except for the top layers, the top elevation for the layer is
assumed to be equal to the bottom elevation of the layer above.
Define Layer Data
As described above, MODFLOW models can be defined using one of two approaches: (1) by editing the input values
on a cell-by-cell basis directly on the grid, or (2) by creating a high level conceptual model using the Map module.
Both approaches can be used to define the layer elevation arrays. With the grid approach, a constant value can be
assigned to the entire array at once or to a set of selected cells. With the conceptual model approach, a set of
polygons can be used to define zones of elevations within each layer. While these two approaches are simple to use,
in most cases they result in an overly simplistic stair step definition of the layer elevations. In most cases, it is more
appropriate to use the 2D geostatistical tools in GMS to smoothly interpolate layer elevations.
Interpolating Elevation Data
The following steps are used to interpolate elevation data:
Step 1 - Importing the Scatter Point Elevation Data
The fist step in defining MODFLOW layer elevation array data is to create a 2D scatter point set. The set should
include a data set for the top elevation of the top layer and the bottom elevation array of the top layer and each of the
underlying layers. A water table elevation corresponding to the desired initial condition (starting head) may also be
defined. The simplest way to create such a scatter point set is to create a tabular scatter point file using a spreadsheet
or a text editor. The scatter point file is imported File|Open menu command. A sample tabular scatter point file for a
three layer model is shown below:
305
Defining the Layer Elevations
306
x
y
top1 bot1 bot2 bot3
360
1670 450
345
200
100
290
870
445
340
195
95
480
420
450
350
200
100
620
2120 455
245
200
100
990
1820 470
355
210
115
890
1190 465
350
205
110
1030
710
360
215
130
475
etc.
Step 2 - Interpolating the Elevations to the MODFLOW Arrays
Once the scatter point file is imported to GMS, the next step in defining MODFLOW layer elevation arrays is to
interpolate the elevations to the MODFLOW layer elevation arrays. The elevation values can be interpolated directly
to the MODFLOW arrays using the ...to MODFLOW Layers command in the Interpolation menu in the 2D Scatter
Point module. When this command is selected, the Interpolate to MODFLOW Layers dialog appears.
The purpose of this dialog is to associate each of the data sets in the scatter point set with one of the layer data input
arrays. A data set and the corresponding layer data array are selected in the top of the dialog and the Map button is
selected. The defined relationship is then shown in the bottom of the dialog. Once this is completed for each data
set/layer data array combination, the OK button is selected and the scatter point data set values are interpolated
directly to the MODFLOW arrays using the currently selected interpolation options.
In some cases, GMS can automatically match the scatter point data sets to the appropriate layer elevation arrays.
GMS searches each data set name to see if "top" or "bot" makes up any portion of the name. If so, it then searches
for a number to determine the layer the array should be interpolated to. For example, the data set names top1, top of
layer 1, and top elevation of layer 1 would all automatically map correctly.
It should be noted that the layer data can be set up using multiple scatter point sets. For example, it is possible to
have one dense set of scatter points to define the ground surface (top of layer one), and a second, more sparse set of
scatter points to define the layer bottom elevations. In this case, the to Layers command would need to be selected
twice, once for each of the scatter point sets.
Step 3 - Fixing Layer Interpolation Errors
When interpolating layer data for the purpose of defining MODFLOW layer elevation arrays, there are often cases
where the interpolated values overlap. For example, for some of the cells, the top elevation values for a particular
layer may be lower than the bottom values for the layer. In some cases, the best way to fix such a problem is to
experiment with the interpolation options or to create some "pseudo-points" to fill in the gaps between sparse scatter
points. In other cases, the overlap may correspond to a pinchout or truncation in the layer. In such cases, the
elevations need to be adjusted so that there is a small but finite thickness for all cells in the overlapping region.
The first step in fixing layer errors is to use the Model Checker to determine if elevation overlaps occur. If they do
occur, the Fix Layer Errors button at the top of the Model Checker dialog can be used to bring up the Fix Layer
Errors dialog. The number of overlap errors for each layer is listed on the right side of the dialog. A layer is
highlighted and a correction method is selected on the left side of the dialog. The Fix Selected Layer button is then
used to adjust the elevations. Four options are available for fixing layer errors:
Defining the Layer Elevations
Average
With the Average method, for each cell where an overlap is found, the average elevation at the overlap is computed
as
The top and bottom elevations are then adjusted as follows:
This option is useful for modeling the transition zones adjacent to embedded seams.
Preserve Top
With the Preserve top method, at each cell, where an overlap is found the top elevation is unchanged and the bottom
elevation is adjusted to:
This option can be used to model truncated outcroppings.
Preserve Bottom
With the Preserve bottom method, at each cell where an overlap is found the bottom elevation is unchanged and the
top elevation is adjusted to:
Truncate to Bedrock
The Truncate to bedrock option differs from the other methods in that it can be used to alter several layers at once.
With this method, it is assumed that the bottom elevation values for the bottom layer represent the top of a bedrock
unit. The bedrock elevations may overlap several upper elevation arrays. Each cell in the grid is checked and if the
bedrock elevation is above the top elevation for the cell, the cell is turned off (made inactive). If the bedrock
elevation is below the top elevation and above the bottom elevation for the cell, the bottom elevation for the cell is
set equal to the bedrock elevation. If the bedrock elevation is below the bottom of the cell, the cell elevations are
unchanged.
Define Layer Data with Solids
Solids can also be used to define layer data for MODFLOW. The Solids -> MODFLOW and Solids -> HUF
commands in the Solid module set up the layer elevations using the currently defined solids.
307
Standard MODFLOW Parameters
Standard MODFLOW Parameters
Caution
There are two ways to do MODFLOW parameterization in GMS:
1. The key value method (recommended)
2. The standard MODFLOW method
The "key value" approach is the preferred approach to defining parameters in GMS. Using key values is the only option for WEL, RIV, DRT, DRN,
GHB, CHD, STR, and HFB parameters. In GMS, using the key value approach with these parameters provides the same functionality of parameter
instances available in MODFLOW.
Key values can also be used with array based parameters. However, GMS does support defining array based parameters with clusters and instances
(for ETS, EVT, RCH parameters).
When reading in a MODFLOW simulation that was created outside of GMS all parameters will be converted to key values so long as the parameter
can be represented by key values.
Key values can not be used to represent an array based parameter if the parameter is defined using more than one cluster or more than one instance.
Also, if more than one parameter uses the same zone array with a matching IZ value then the parameter can not be represented using key values.
Further, if the multiplier array associated with the parameter has values other than 1.0 in the zones where the parameter is used then the parameter
can not be represented with key values.
The standard MODFLOW method is considered an "advanced" feature in GMS. Only users that understand how MODFLOW uses parameters
should attempt to use this feature.
This article describes how to use the standard MODFLOW parameterization method in GMS.
Support in GMS
Reading
GMS can read MODFLOW models that use standard MODFLOW parameters.
Writing
GMS writes MODFLOW models using the key value approach. So, although GMS can read models that use
standard MODFLOW parameters, it cannot write them using the standard MODFLOW parameter method. Writing is
usually done using the key value method. There are a few exceptions which include recharge and evapotranspiration
parameter instances, and LPF and HUF parameter clusters. GMS will write these parameters using the standard
MODFLOW parameter method because these cannot always be represented using the key value method.
Editing
When GMS reads a model that uses standard MODFLOW parameters it converts them to regular GMS key value
approach parameters. The parameters can then be edited using the Parameters Dialog. Recharge, evapotranspiration,
LPF, and HUF parameters are special in that you can edit the instance and cluster information associated with these
types of parameters.
MODFLOW Parameter Clusters Dialog
The MODFLOW Parameter Clusters Dialog allows users to define instances for RCH, EVT, LPF, and HUF
parameters that use clusters. The inputs in this dialog basically follow the necessary inputs for defining a parameter
instance in a package file. You may wish to review the MODFLOW Parameter Clusters and Instances section below.
Array based parameters are defined using clusters. A cluster is a multiplier array, a zone array, and specified zone
values where the parameter is applied. Multiplier arrays and zone arrays have associated data sets underneath the
308
Standard MODFLOW Parameters
three dimensional grid in the Project Explorer.
Instances are enabled for RCH and EVT parameters. Instances allow the user to define multiple sets of clusters that
are all tied to one parameter. Then the user may use different instances in different stress periods in their
MODFLOW model. For more information on parameter instances consult the MODFLOW documentation.
In the MODFLOW Parameters dialog the user selects the Define clusters option for a parameter. This will allow the
user to specify the number of instances and clusters that are used to define the parameter.
In the Parameter Instances dialog the user defines a name for each parameter instance for RCH and EVT
parameters. For LPF parameters a level is defined and for HUF parameters a hyrdogeologic unit is defined. Then for
each cluster the user selects a multiplier array and a zone array. These are data sets on the 3D Grid. The user must
also specify the zone values (IZ) where the parameter is to be applied in the model. If there is more than one IZ value
for the cluster then the user enters the numbers with spaces between the entries. So if the parameter is to be applied
where the zone array values are 1 and 3 then the user would enter "1 3". The user must also specify the stress periods
where an instance is to be used. The numbers entered in the Stress Periods field should also be space delimited. This
means if you want an instance to be used in stress periods 1, 2, and 5 then your entry in the Stress Periods field
should be "1 2 5".
When the package is written out for MODFLOW the instances will be included in the parameter definition and used
for forward runs or for parameter estimation runs.
309
Standard MODFLOW Parameters
310
MODFLOW Parameter Clusters and Instances
For those wanting to follow the standard MODFLOW approach to parameterization, the following explanation may
be helpful. You should refer to the MODFLOW documentation for more information.
Definitions
Here is a brief review of the most important terms used when dealing with parameters.
•
•
•
•
•
•
•
Parameter - Has a name, type, one or more clusters, and zero or more instances.
Parval - The value of the parameter.
Cluster - Has a multiplier array (Mltarr), a zone array (Zonarr), and zone numbers (IZ).
Mltarr - Name of the multiplier array. Parval is multiplied by this to define the value.
Zonarr - Name of the zone array used to define the cells that are associated with a parameter.
IZ - Up to 10 zone numbers (separated by spaces) that define the cells that are associated with a parameter.
Instance - Parameter cluster that could be used for different stress periods in a MODFLOW simulation.
Examples
Below are some examples showing different ways parameters can be used. The examples use parameters to define
recharge for a forward run (not doing inverse modeling). The grid in the examples is 5 rows, 5 columns, 1 layer. The
examples use the following multiplier and zone arrays.
Multiplier arrays
MULT0001
MULT0002
1.0 1.0 1.0 1.0 1.0
0.5 0.5 0.5 0.5 0.5
1.0 1.0 1.0 1.0 1.0
0.5 0.5 0.5 0.5 0.5
1.0 1.0 1.0 1.0 1.0
0.5 0.5 0.5 0.5 0.5
1.0 1.0 1.0 1.0 1.0
0.5 0.5 0.5 0.5 0.5
1.0 1.0 1.0 1.0 1.0
0.5 0.5 0.5 0.5 0.5
Zone Arrays
ZONE0001
ZONE0002
ZONE0003
2 2 2 0 0
3 3 3 3 3
0 0 0 0 0
2 2 2 0 0
3 3 3 3 3
0 0 6 7 0
2 2 2 0 0
4 4 4 4 4
0 0 6 7 0
0 0 0 0 0
4 4 4 4 4
0 0 0 0 0
0 0 0 0 0
5 5 5 5 5
0 0 0 0 0
Standard MODFLOW Parameters
311
Example 1
Steady state. 1 recharge parameter with 1 cluster, 1 instance.
Recharge file
Variables
PARAMETER 1
3 40
Param1 RCH 0.00005 1
MULT0001 ZONE0001 2
1 1
Param1
Explanations
PARAMETER NPRCH
One recharge parameter will be used
NRCHOP IRCHCB
Apply to highest active cell, save CCF to unit 40
PARNAM PARTYP Parval NCLU Parameter name, type, value and number of clusters
Mltarr Zonarr IZ
Multiplier array, zone array, and zone number
INRECH INIRCH
One parameter used in current stress period, INIRCH (ignored)
Pname
Name of parameter used to define RECH in this stress period
Results
The resulting recharge applied to the top-most active layer would be:
0.00005 0.00005 0.00005 0 0
0.00005 0.00005 0.00005 0 0
0.00005 0.00005 0.00005 0 0
0
0
0
0 0
0
0
0
0 0
Example 2
Steady state. 2 recharge parameters:
• the first with 1 cluster, 1 instance
• the second with 2 clusters, 1 instance.
Recharge file
Variables
PARAMETER 2
3 40
Param1 RCH 0.00005 1
MULT0001 ZONE0001 2
Param2 RCH 0.00004 2
MULT0002 ZONE0002 4 5
MULT0002 ZONE0003 6 7
2 1
Param1
Param2
Explanations
PARAMETER NPRCH
Two recharge parameters will be used
NRCHOP IRCHCB
Apply to highest active cell, save CCF to unit 40
PARNAM PARTYP Parval NCLU Parameter name, type, value and number of clusters
Mltarr Zonarr IZ
Multiplier array, zone array, and zone number
PARNAM PARTYP Parval NCLU Parameter name, type, value and number of clusters
Mltarr Zonarr IZ
Multiplier array, zone array, and zone numbers
Mltarr Zonarr IZ
Multiplier array, zone array, and zone numbers
INRECH INIRCH
Two parameters used in current stress period, INIRCH (ignored)
Pname
Name of parameter used to define RECH in this stress period
Pname
Name of parameter used to define RECH in this stress period
Results
The intermediate results for each parameter cluster are listed below:
Param1
Param2, cluster 1
Param2, cluster 2
0.00005 0.00005 0.00005 0 0
0
0
0
0
0
0 0 0
0
0
0.00005 0.00005 0.00005 0 0
0
0
0
0
0
0 0 0.00002 0.00002 0
0.00005 0.00005 0.00005 0 0
0.00002 0.00002 0.00002 0.00002 0.00002
0 0 0.00002 0.00002 0
0
0
0
0 0
0.00002 0.00002 0.00002 0.00002 0.00002
0 0 0
0
0
0
0
0
0 0
0.00002 0.00002 0.00002 0.00002 0.00002
0 0 0
0
0
Standard MODFLOW Parameters
312
The final result after accumulating each cluster is:
0.00005 0.00005 0.00005 0
0
0.00005 0.00005 0.00007 0.00002 0
0.00007 0.00007 0.00009 0.00004 0.00002
0.00002 0.00002 0.00002 0.00002 0.00002
0.00002 0.00002 0.00002 0.00002 0.00002
Example 3
Transient. 1 recharge parameter with 1 cluster, 2 instances. One instance is used in the first and third stress periods,
and the other is used in the second stress period.
Recharge file
Variables
PARAMETER 1
PARAMETER NPRCH
3 40
NRCHOP IRCHCB
MULT0001 ZONE0001 2
Mltarr Zonarr IZ
Instance2
INSTNAM
MULT0002 ZONE0001 2
Mltarr Zonarr IZ
1 1
INRECH INIRCH
Param1 Instance1
Pname Iname
1 1
INRECH INIRCH
Param1 Instance2
Pname Iname
1 1
INRECH INIRCH
Param1 Instance1
Pname Iname
Explanations
One recharge parameters will be used
Apply to highest active cell,
save CCF to unit 40
Param1 RCH 0.00005 1 INSTANCES 2 PARNAM PARTYP Parval NCLU Parameter name, type, value number
INSTANCES NUMINST
of clusters, number of instances
Instance1
INSTNAM
Instance name
Results
The intermediate results for each parameter cluster are listed below:
Multiplier array, zone array,
and zone number
Instance name
Multiplier array, zone array,
and zone number
One parameters used in current stress
period, INIRCH (ignored)
Name of parameter and name of instance
used in this stress period
One parameters used in current stress
period, INIRCH (ignored)
Name of parameter and name of instance
used in this stress period
One parameters used in current stress
period, INIRCH (ignored)
Name of parameter and name of instance
used in this stress period
Standard MODFLOW Parameters
313
Stress Period 1, Param1, Instance RCH_1_1
0.00005 0.00005 0.00005 0 0
0.00005 0.00005 0.00005 0 0
0.00005 0.00005 0.00005 0 0
0
0
0
0 0
0
0
0
0 0
Stress Period 2, Param1, Instance RCH_1_2
0.000025 0.000025 0.000025 0 0
0.000025 0.000025 0.000025 0 0
0.000025 0.000025 0.000025 0 0
0
0
0
0 0
0
0
0
0 0
Stress Period 3, Param1, Instance RCH_1_1
0.00005 0.00005 0.00005 0 0
0.00005 0.00005 0.00005 0 0
0.00005 0.00005 0.00005 0 0
0
0
0
0 0
0
0
0
0 0
MODFLOW Parameters - Two Methods
MODFLOW Parameters - Two Methods
Caution
There are two ways to do MODFLOW parameterization in GMS:
1. The key value method (recommended)
2. The standard MODFLOW method
The "key value" approach is the preferred approach to defining parameters in GMS. Using key values is the only option for WEL, RIV, DRT, DRN,
GHB, CHD, STR, and HFB parameters. In GMS, using the key value approach with these parameters provides the same functionality of parameter
instances available in MODFLOW.
Key values can also be used with array based parameters. However, GMS does support defining array based parameters with clusters and instances
(for ETS, EVT, RCH parameters).
When reading in a MODFLOW simulation that was created outside of GMS all parameters will be converted to key values so long as the parameter
can be represented by key values.
Key values can not be used to represent an array based parameter if the parameter is defined using more than one cluster or more than one instance.
Also, if more than one parameter uses the same zone array with a matching IZ value then the parameter can not be represented using key values.
Further, if the multiplier array associated with the parameter has values other than 1.0 in the zones where the parameter is used then the parameter
can not be represented with key values.
The standard MODFLOW method is considered an "advanced" feature in GMS. Only users that understand how MODFLOW uses parameters
should attempt to use this feature.
Conductance
Many MODFLOW boundary condition types (i.e., general head, rivers, streams, drains) include a conductance
parameter. MODFLOW uses the conductance to determine the amount of water that flows in or out of the model due
to the boundary condition stresses.
When using a conceptual model, the manner in which the conductance term should be computed and entered
depends on whether the feature object is a polygon, arc or point. Before explaining this fully, a short review of the
definition of conductance is appropriate.
Conductance formulation
Darcy's law states:
where Q is the flow rate, k is the hydraulic conductivity, i represents the hydraulic gradient, and A represents the
gross cross-sectional area of flow. Darcy's law can also be expressed as:
where DH represents the head loss and L represents the length of flow. Since the unknown on the right side is the
head, it is convenient to group all of the other terms together and call them conductance:
This results in the following general definition for conductance:
This may be represented more specifically in the following form.
314
Conductance
Where t represents the thickness of the material in the direction of flow, and lw represents the cross-sectional area
perpendicular to the flow direction.
Conductance in conceptual models
In the case of a river boundary condition, the conductance is defined in MODFLOW as the hydraulic conductivity of
the river bed materials divided by the vertical thickness (length of travel based on vertical flow) of the river bed
materials, multiplied by the area (width times the length) of the river in the cell. The last term, area, is the hardest
parameter to determine by hand since it varies from cell to cell.
Arcs
Fortunately, GMS can automatically calculate the lengths of arcs and areas of polygons. Therefore, when a
conductance is entered for an arc, it should be entered in terms of conductance per unit length. For example, in the
case of rivers, conductance should be entered as:
Where t is the thickness of the material and w is the width of the material along the length of the arc. When GMS
applies the boundary condition from the arc to the grid cell, it automatically multiplies the entered value of
conductance by the length of the arc that intersects the cell to create an accurate conductance value for the cell.
Polygons
For polygons, conductance should be entered in a conductance per unit area form:
Where t is the thickness of the material. When GMS converts the stress from a polygon to a grid cell, it automatically
multiplies the entered value of conductance by the area of the cell that is covered by the polygon to create an
appropriate conductance value for the cell. This restores the dimensional accuracy to the expression for conductance.
Points
When a general head, river, stream or drain attribute is assigned to an individual point, the conductance should be
entered as a normal conductance value. This conductance is then directly assigned to the cell containing the point.
Parameter Factors
Beginning with GMS version 7.0, the Well, Drain, River, General head, and Stream boundary conditions have a
parameter factor field that is associated with each boundary condition. The parameter factor is used with the
parameter value to compute the final value of conductance for a given boundary condition (or in the case of the well
package the final Q value). The parameter factor is automatically set by GMS when doing the Map->MODFLOW
command. This value will be set to the length of the arc in the cell or the area of the polygon in the cell associated
with the boundary condition; for a point feature the factor is set to 1.0.
315
Convergence Options
Convergence Options
When performing automated parameter estimation, a set of optimal parameter values can only be found if
MODFLOW produces a stable solution for all iterations. One of the things that can cause problems with the inverse
model is cells going dry. The dry cell flag that is written to the head array can cause instability in the inverse model,
and thus it will not converge. When such problems occur, a successful run may be achieved by turning on some
convergence options that have been added to the GMS version of MODFLOW by John Doherty. These options are
accessed via the PEST ASP Package command in the MODFLOW menu. The options are as follows:
Do Not Stop on Non-Convergence
The "Do not stop ..." option is used for transient simulations. When this option is on, if the MODFLOW model does
not converge for a particular time step, it continues to the next time step rather than aborting.
Assign Bottom Elevation to Dry Cells
During a normal MODFLOW run, if a cell goes dry, the HDRY value assigned in the BCF package is assigned to the
cell. The default value for HDRY is -888. At each iteration of the inverse model run (each time a MODFLOW
solution is found), the inverse model interpolates the computed head values to the observation points and computes
the residual error. This error is factored into the objective function. If the head at a cell near an observation point
suddenly switches from a normal head value to -888, an extreme discontinuity is introduced to the objective function
and the inverse model may not be able to converge. This problem can be avoided by turning on the Assign bottom
elevation to dry cells option. If this option is on, the bottom elevation associated with the cell is assigned as the head
value for the cell.
Prevent Cell Drying
The Prevent Cell Drying option does not allow a cell in the bottom layer to go dry. The head is not allowed to drop
below the value corresponding to the specified minimum saturated thickness. Additional instruction is provided by
Richard Winston and in a USGS Open-File [1]:
Use of the wetting capability can cause serious problems with convergence. You can try to avoid this by
several methods.
1. If you know a cell should never become wet, make it an inactive cell rather than a variable head cell.
2. You can adjust the value of the wetting threshold in WETDRY. (Higher is more stable but may be less
accurate.)
3. You can decide which neighbors will be checked to decide if a cell should be wetted using WETDRY. Often it
is better to allow only the cell beneath the dry cell to rewet it.
4. You can use IHDWET to determine which equation is used to specify the head in newly wetted cells.
5. You can vary the wetting factor WETFCT.
6. In steady-state conditions you can adjust initial conditions to values that are close to your best guess of the
final conditions to improve stability.
7. You can choose a different solver. The SIP, PCG1, and PCG2 solvers will work with the wetting capability.
The SOR solver doesn't work well with the wetting capability. Note that cells can not change between wet and
dry during the inner iterations of the PCG1 and PCG2 solvers. The PCG1 solver is no longer included in the
USGS version of MODFLOW.
8. When using the PCG2 solver, you can set RELAX in the range of 0.97 to 0.99 to avoid zero divide and
non-diagonally dominant matrix errors. (However, this is an infrequent cause of instability. If such an error
occurs, PCG2 prints an error message in the output file and aborts the simulation.)
316
Convergence Options
9. When using the PCG2 solver, you can set DAMP to a value between 0 and 1.
10. Unrealistically high conductances on boundary cells can contribute to instability. Check the conductances in
the Drain, River, Reservoir, Lake, Stream, and General-Head Boundary packages. In the Evapotranspiration
check the EVT Flux Stress[i] and EVT Extinction Depth which together control the conductance of
evapotranspiration cells.
The two most important variables that affect stability are the wetting threshold and which neighboring cells are
checked to determine if a cell should be wetted. Both of these are controlled through WETDRY. It is often
useful to look at the output file and identify cells that convert repeatedly from wet to dry. Try raising the
wetting threshold for those cells. It may also be worthwhile looking at the boundary conditions associated with
dry cells.
Sometimes cells will go dry in a way that will completely block flow to a sink or from a source. After that
happens, the results are unlikely to be correct. It's always a good idea to look at the flow pattern around cells
that have gone dry to see whether the results are reasonable.
References
[1] http:/ / pubs. er. usgs. gov/ usgspubs/ ofr/ ofr91536
MODFLOW Parameters Disclaimer
The "key value" approach is the preferred approach to defining parameters in GMS. Using key values is the only
option for WEL, RIV, DRT, DRN, GHB, CHD, STR, and HFB parameters. In GMS, using the key value approach
with these parameters provides the same functionality of parameter instances available in MODFLOW.
Key values can also be used with array based parameters. However, GMS does support defining array based
parameters with clusters and instances (for ETS, EVT, RCH parameters).
When reading in a MODFLOW simulation that was created outside of GMS all parameters will be converted to key
values so long as the parameter can be represented by key values.
Key values can not be used to represent an array based parameter if the parameter is defined using more than one
cluster or more than one instance. Also, if more than one parameter uses the same zone array with a matching IZ
value then the parameter can not be represented using key values. Further, if the multiplier array associated with the
parameter has values other than 1.0 in the zones where the parameter is used then the parameter can not be
represented with key values.
The standard MODFLOW method is considered an "advanced" feature in GMS. Only users that understand how
MODFLOW uses parameters should attempt to use this feature.
317
Saving and Reading a MODFLOW Simulation
Saving and Reading a MODFLOW Simulation
Saving a MODFLOW Simulation
Once a MODFLOW simulation has been created and checked for potential problems with the Model Checker, the
next step is to save the simulation to disk and run MODFLOW. MODFLOW simulations are saved using the Save
and Save As commands in the File menu.
Selecting the Save command saves the GMS project including the model simulation. By default the model
simulation will be saved to the same location as the GMS project. However, in the Save dialog the path for the model
simulation can be specified.
A MODFLOW simulation is actually saved to a set of input files. The MODFLOW super file is used to store extra
data used by GMS but not used by MODFLOW. The super file also contains the path to the name file. The names of
all of the input and output files associated with a simulation are saved in the name file. When MODFLOW is
launched, the name of the super file is automatically passed to the MODFLOW executable.
When a MODFLOW simulation is saved, the names of the other MODFLOW input files are automatically patterned
after the name of the super file. For example, if the super file is named sampmod.mfs, the other files are named
sampmod.bas, sampmod.bcf, etc.
The user can adjust the output options in the Output Control dialog
The version of MODFLOW 2000 that ships with the GMS software has been modified to be able to read and write
input data stored in HDF5 files. For more information see MODFLOW with HDF5.
Reading a MODFLOW Simulation
Once a MODFLOW simulation has been saved by GMS using the Save command in File menu, the entire simulation
can be read back into GMS using the Open command in the File menu.
MODFLOW simulations can be read in individually (*.mfs) or as part of a project (*.gpr). They can also be
imported by using the MODFLOW name file. The extension for the name file must be changed to *.mfn.
Reading a Completed MODFLOW Solution
When you are using the Model Wrapper to control your MODFLOW run, you can use the Read MODFLOW
solution toggle at the bottom of the dialog to automatically read in the corresponding solution.
You can also read in solution files generated by MODFLOW using the Read Solution command in the MODFLOW
menu. This command brings up the a file browser and prompts you to choose a MODFLOW super file (pre GMS
7.0) or a MODFLOW name file (GMS 7.0+).
318
Output Control
Output Control
The Output Control dialog is accessed from the MODFLOW menu. The Output Control dialog contains the
following options:
Output Interval Options
The Output Interval section lets you choose which files you want to output and when you want to output the results.
By default, GMS instructs MODFLOW to output heads and volume data to both data files and text output files.
Drawdown is not output by default.
Global Output File
Choose this option to use the global output file (*.glo). This file contains information about the input files and,
during an inverse run using the PES process, will contain information about each iteration. Either the global file, list
file, or both must be used with MODFLOW.
List Output File
Choose this option to use the list output file (*.out). This file contains information about the current MODFLOW
run. This file will be overwritten during an inverse run using the PES process for each inverse iteration.
*.hff File For Transport
Select this option to output the head and flow file (*.hff) used by MT3DMS to generate the flow fields for transport
modeling.
Save Arrays Using Binary Files
Choose this option to save all 2D arrays used as MODFLOW input as binary arrays in external files. If this option is
not selected, the 2D arrays are written within the respective files in ASCII format. The binary option results in more
files, but uses less disk space. There is also a time savings during running for MODFLOW models with large grids.
Enable saving of computed flows for all source/sink objects
This option allows GMS to create a flow observation for all sources/sinks that were created using the
Map->MODFLOW command so that the user can see the computed flux through the group of boundary conditions.
If the user is doing a transient simulation then having this option may cause MODFLOW to crash because
MODFLOW attempts to allocate more memory than any of us have available. Turning off this option in this
situation is the best course of action.
319
Importing MODFLOW Files
Importing MODFLOW Files
GMS imports standard MODFLOW 88, 96, 2000, 2005[1], and MODFLOW-NWT[2] files. GMS supports saving of
MODFLOW 2000, 2005, and MODFLOW-NWT so other versions will be converted to MODFLOW 2000, 2005, or
NWT.
If GMS created the MODFLOW simulation then you should open the corresponding GMS project file (*.gpr). If
there is no GMS project file, you can import the MODFLOW simulation into GMS as described below. GMS will
create a new copy of the imported MODFLOW simulation in its own modified MODFLOW file format. Click here
for more information on the modified MODFLOW file format.
Native MODFLOW files (ascii/text) can be exported from GMS. Click here for more information on exporting
MODFLOW files.
How to import a MODFLOW model into GMS
You can follow these steps when importing a MODFLOW simulation into GMS.
1. Were the MODFLOW files created by GMS?
• Yes
If the files were created by GMS, and you have the GMS project file (.gpr), you should just read that into
GMS using the standard File|Open command. If you don't have the .gpr file, you should import the
MODFLOW model into GMS by opening the "super file" (*.mfs) using the standard File|Open command. The
super file is a non-standard file that GMS creates along with the standard MODFLOW files. If you don't have
a super file, proceed to step 2 below.
• No
Proceed to step 2 below.
• Don't know
If you have a *.gpr file or a *.mfs file, then it's almost certain that the files were created by GMS. If you don't
have these files, proceed to step 2 below.
2. Determine whether your model is MODFLOW 88, 96 or 2000. If you are unsure, refer to the section below
entitled Determining the MODFLOW version which describes each one.
• MODFLOW 88
Read the basic package file into GMS (using the standard File|Open dialog). GMS will attempt to import all
the other files.
• MODFLOW 96
Read the name file.
• MODFLOW 2000
Read the name file.
• MODFLOW 2005
Read the name file.
• MODFLOW-NWT
Read the name file.
320
Importing MODFLOW Files
321
Troubleshooting
If you are having trouble reading the files into GMS, first verify that MODFLOW can read the files by launching
MODFLOW at a command prompt and giving it the name of the file to read. If MODFLOW can read the files but
GMS cannot, it may be because you are attempting to import packages which GMS does not support; see
MODFLOW Packages Supported in GMS for more information.
Contact tech support [20] for additional help.
Determining the MODFLOW version
MODFLOW 88
To tell if a file is MODFLOW 88 open up the basic package file as a text file. GMS uses *.bas as the extension for
this file. The file should appear something like the figure below.
Heading 1
Heading 2
3
11 13 14 15
0
1
1 1 1 1
1 1 1 1
1 1 1 1
1 1 1 1
0
1
1
1
1
23
0 16
0
1
1 1
1 1
1 1
1 1
0
1
1
1
1
0
1
1
1
1
17
0
1
1
1
1
1
0 10 12
1
1
1
1
(17I3)
1 1
1 1
1 1
1 1
4
0
0
0
0
0
0
0
0 29
0
0
0
1
1
1
1
1
1
1
1
1
1
1
1
1
1
1
1
For a MODFLOW 88 file the third line of the basic package file will include an IUNIT array with 24 slots. There
may also be an IUNIT array with only 12 slots, if so just ok the warning GMS gives. These slots include the unit
numbers for packages included in the file. Every number must be unique to its package. If the number does not
correspond to a file then the file is an external array which must be matched by the user. If the basic package file
includes an IUNIT array as described it is a MODFLOW 88 file.
To import the MODFLOW 88 file locate the *.mfs file. If there is no *.mfs file then select the *.bas file. Then
simply use the File|Open command to read the file into GMS.
More about MODFLOW 88 files
MODFLOW 88 files have no name (*.nam or *.mfn) file.
GMS makes a few assumptions when reading in MODFLOW 88 files:
1. All files must have the same prefix.
• Example: If the files are named bas.dat, drain.dat, and river.dat they all must be converted to run1.bas,
run1.drn, and run1.riv
2. All files use the standard GMS suffixes as shown in the table below.
• If these are not the suffixes in use, you will need to rename the files.
3. IUNIT slots must be standard with standard ID #'s according to MODFLOW documentation.
4. It is up to the user to know what external arrays go to which MODFLOW files. Otherwise the files will not be
properly read in.
• GMS can import external arrays but is unable to import external binary arrays
5. MODFLOW 88 files use a fixed format.
Importing MODFLOW Files
322
MODFLOW 88 IUNIT Array Positions and Packages
1
2
3
4
5
BCF WEL DRN RIV EVT
6
7
8
9
10
11
12
13
14
15
GHB RCH SIP DE4 SOR OC PCG GFD
16
17
18
19
20
HFB RES STR IBS CHD
Standard GMS Extensions for MODFLOW 88 files
Package
Extension
BASIC
*.bas
OUTPUT CONTROL
*.oc
BCF
*.bcf
RIVER
*.riv
DRAIN
*.drn
WELL
*.wel
GENERAL HEAD BOUNDARY
*.ghb
STREAM
*.str
RECHARGE
*.rch
EVAPOTRANSPIRATION
*.evt
STRONGLY IMPLICIT PROCEDURE
*.sip
SLICE-SUCCESSIVE OVERRELAXATION *.sor
MODFLOW 96
To tell if model files are in MODFLOW 96 format, open up the basic package file as a text file. For a MODFLOW
96 file the third line of the *.bas file will NOT include an IUNIT array. Instead the third line will say FREE, which
means that the data in the file is in free format and each data entry is separated with a space. A 96 file may not
contain the FREE line. Instead the line may be blank and the file may be fixed format. This file can be read in just
the same using the name file.
Heading 1
Heading 2
3
23
17
1
4
FREE
0
INTERNAL 1 (free)
1 1 1 1 1 1 1 1 1
1 1 1 1 1 1 1 1 1
1 1 1 1 1 1 1 1 1
0
0
1
1
1
"Ibound
1 1 1 1
1 1 1 1
1 1 1 1
Layer 1"
1 1 1
1 1 1
1 1 1
If the basic package file says FREE as described it is a MODFLOW 96 file. A name file (typically with a *.mfn or
*.nam extension) should also exist. If one does not it must be created as described below.
To open a MODFLOW 96 file locate the name file and use the File|Open command to read the file into GMS.
Importing MODFLOW Files
More about MODFLOW 96 files
MODFLOW 96 files use a name file to identify the packages files. This replaces the IUNIT array used in
MODFLOW 88. The advantage of it is that the files do not need to all have the same prefix in their name. The name
file is laid out as shown below. In the first column the card name is given (see MODFLOW documentation for more
information). In the second colum the IUNIT number is given. This number must be unique from all other numbers.
The third column gives the file name and as stated does not need to have the same prefix for every package.
Sample *.mfn file:
LIST
26 "run1.out"
BAS
1 "run1.bas"
BCF
11 "run1.bcf"
OC
10 "run1.oc"
DATA(BINARY) 30 "run1.hed"
DATA(BINARY)
40 "run140.ccf"
PCG
12 "run1.pcg"
RIV
15 "run1.riv"
WEL
13 "run1.wel"
RCH
20 "run1.rch"
MT3D
29 "run1.hff"
MODFLOW 2000, 2005[1], & MODFLOW-NWT[2]
Like the MODFLOW 96 files, MODFLOW 2000, 2005 and MODFLOW-NWT use name files rather than an IUNIT
array. To know if a file is a MODFLOW 2000, 2005, or MODFLOW-NWT file look for a discretization file (*.dis).
If a *.dis file exists then use the File|Open command and select the name file (*.nam or *.mfn) to read the simulation
into GMS.
Sample *.mfn file:
# MF2K NAME file
#
# Output Files
GLOBAL 1 "easttex.glo"
LIST 2 "easttex.out"
DATA(BINARY) 30 "easttex.hed"
DATA(BINARY) 40 "easttex.ccf"
LMT6 18 "easttex.lmt"
#
# Obs-Sen-Pes Process Input Files
OBS 50 "easttex.obs"
DROB 54 "easttex.drob"
CHOB 55 "easttex.chob"
ASP 71 "easttex.asp"
#
# Global Input Files
DIS 19 "easttex.dis"
#
# Flow Process Input Files
BAS6 3 "easttex.ba6"
LPF 4 "easttex.lpf"
323
Importing MODFLOW Files
OC 15 "easttex.oc"
RCH 16 "easttex.rch"
WEL 9 "easttex.wel"
DRN 10 "easttex.drn"
CHD 13 "easttex.chd"
PCG 14 "easttex.pcg"
Changes in GMS 7.0
When GMS 7.0 or later reads a MODFLOW simulation it checks if the simulation files are in the modified GMS
format. MODFLOW files created by GMS 6.5 or a later use this format. If the simulation is not in the GMS format
then GMS converts it into this format.
In versions of GMS prior to 7.0, GMS would read the MODFLOW files and do the conversion. Starting with version
7.0, GMS uses a modified version of MODFLOW to read the input files and do the conversion. GMS then reads the
converted files. By using MODFLOW to read MODFLOW files and do the conversion, GMS can read whatever
MODFLOW can read. Conversely, if GMS cannot read it, MODFLOW probably can't either.
Conversion Steps
Depending on the version of your model, GMS will perform all or some of the following steps to convert the model
into the standard GMS format.
1. Convert MODFLOW 88 to MODFLOW 96. If importing a MODFLOW 88 model, GMS creates a
MODFLOW 96 Name file by examining the Basic package file or the GMS super file. The name file is put in the
same directory where the Basic package file or super file is found. In creating the MODFLOW 96 name file,
GMS assumes the unit numbers in the IUNIT array in the Basic package file are ordered according to the standard
MODFLOW 88 order (as found in the MODFLOW 88 source code). GMS uses the lowest unit number not used
in the IUNIT array for the List file added to the name file. If external arrays are being used, the unit number GMS
uses for the List file may be the same as one used for an external array.
2. Convert MODFLOW 96 to MODFLOW 2000. After creating the MODFLOW 96 Name file, GMS calls
mf96to2k.exe, a USGS program distributed with MODFLOW 2000 which converts MODFLOW 96 models to
MODFLOW 2000. This creates some new files in the same directory as the basic package file: name_MF2k.bas,
name_MF2K.bcf, and name_MF2K.nam (where "name" is the name of the MODFLOW 96 name file).
3. Translate MODFLOW 2000 to GMS H5 Format. GMS then calls the MODFLOW Translator to translate the
simulation into GMS H5 format. This creates an H5 file in the temp directory. The user must save the GMS
project in order to have a GMS H5 formatted MODFLOW simulation on disk, otherwise the temp file will be
discarded.
mf96to2k
Some modifications were made to mf96to2k.exe with regards to layer elevations and confining beds so that the
program could be run in a non-interactive batch mode.
Grid Elevations
When mf96to2k.exe converts a MODFLOW 88/96 simulation to a MODFLOW 2000 simulation the program creates
a discretization file (DIS). This file defines the layer elevations for the model grid as well as the stress periods. In
MODFLOW 88/96 a model could be defined without the need for explicitly defining the top and bottom elevations
of the model grid. If the old model has grid elevations defined in the BCF file then those elevations are preserved in
the new MODFLOW 2000 DIS file. Where elevations are not defined in the old model then mf96to2k.exe would
prompt the user to enter a constant elevation for the particular layer. When mf96to2k.exe is run by GMS these layer
324
Importing MODFLOW Files
values are automatically set. After the model is read into GMS the user may need to edit these values.
Layer Confining Beds (LAYCBD)
When mf96to2k.exe converts a MODFLOW 88/96 model it also asks the user if a layer confining bed exists beneath
each of the grid layers. When mf96to2k.exe is run by GMS no confining beds will be defined beneath the model
layer. If the user wishes to include confining beds these can be edited in the Global/Basic dialog under the
MODFLOW menu.
Files generated by other software
Other software such as Groundwater Vistas, Visual MODFLOW, and PM Win use their own file formats. However
they do write out native MODFLOW files which GMS can read in. To use them make sure that the other software is
saving out the files properly and then follow the steps above for the proper version of MODFLOW files.
Groundwater Vistas
To export MODFLOW files from Groundwater Vistas:
1. Open the simulation in Groundwater Vistas
1. Select “File | Open”
2. Navigate to and select the “*.gwv” file, then select “Open”
2. Export the native MODFLOW files from Groundwater Vistas
1. Select “Model | MODFLOW (or MODFLOW 2000) | Create Datasets”
3. Import the name file into GMS
1. Select “File | Open”, the “Open” macro, or just drag and drop the *.nam file in the GMS main screen.
Visual MODFLOW
Visual MODFLOW files can not be read into GMS. To use Visual MODFLOW files, you'll need to run MODFLOW
from within Visual MODFLOW, and then modify the *.mfi file. See below for details.
1. Run MODFLOW from Visual MODFLOW
1. Open the Visual MODFLOW project (vmf file if using the latest version of Visual MODFLOW) in Visual
MODFLOW
2. Select “Run” in the top menu
3. Select “Run” again from the top menu
4. Select “MODFLOW 2000” in the “Engines to Run” dialog, then select “Translate & Run”
5. Select the “Close” button in the “VMEngine” window when the model is finished running
2. Modify and rename the “*.mfi” file
1.
2.
3.
4.
Go to the directory where the simulation is saved on your computer
Create a copy of the “*.mfi” file. Change the extension of the copy to “*.mfn”
Open the *.mfn file in a text editor
Comment out packages that are not supported by the USGS release of MODFLOW (for example, the “WHS”
and “NDC” lines)^
5. If necessary, modify the directory that each MODFLOW file is referencing. This is necessary if the Visual
MODFLOW files were not created on the computer you are on
6. Save the *.mfn file
3. Open the *.mfn file in GMS
1. Select “File | Open”, the “Open” macro, or just drag and drop the *.mfn file in the GMS main screen
325
Importing MODFLOW Files
326
2. The “MODFLOW Translator” will most likely appear. Select “OK” after selecting the appropriate version of
MODFLOW
3. Select “Done” when the MODFLOW Translator is finished
4. A dialog will appear saying that a supported solver was not found in the name file and that the PCG solver has
been added. This is because the solver that Visual MODFLOW uses is not compatible with the USGS version
of MODFLOW, and so GMS does not use it either. Select “OK”
^Note: to comment out a package, place a pound/number sign in front of a line. See the Online Guide to
MODFLOW [3] for packages that the USGS version of MODFLOW supports.
USGS MODFLOW Documentation
Here are some links to MODFLOW documentation that may be helpful.
[2]
MODFLOW 88
MODFLOW 88 (I)
MODFLOW 96
MODFLOW 96 (I)
MODFLOW 2000
MF2K Flow
MODFLOW 2005
MF2005 Flow Process
[7]
[4]
, MODFLOW 88 (II)
, MODFLOW 96 (II)
, MF2K Obs-Sen-Pes
[11]
[3]
[5]
, HUF
[8]
, LMG
[9]
, LMT
[10]
[12]
MODFLOW-NWT MODFLOW-NWT, A Newton Formulation for MODFLOW-2005 [13]
Notes
[1] Supported starting at GMS version 8.0
[2] Supported starting at GMS version 8.2
[3] http:/ / water. usgs. gov/ nrp/ gwsoftware/ modflow2000/ MFDOC/ index. html?introduction. htm
, MF2K Calibration
[6]
MODFLOW with HDF5
MODFLOW with HDF5
The versions of MODFLOW 2000, MODFLOW 2005[1], and SEAWAT[1] that ship with the GMS software have
been modified to be able to read input data stored in HDF5 files. GMS saves some MODFLOW data to an HDF5 file
that is saved with the other MODFLOW files. Some MODFLOW files will have references to the HDF5 file. For
more information about HDF5, click here[2].
Advantages to HDF5
The HDF5 file format is a cross platform binary format for storing scientific data. One advantage of using HDF5 is
that the data is stored in binary format so the disk reads and writes are much faster than with ASCII files (although
not nearly as elegant to read). You can view the data stored in an HDF5 file by using HDFView [3] (or some other
available viewer).
Another advantage of using the HDF5 libary with MODFLOW package data and array data is that HDF5 will
compress the data. For example, if you have a transient simulation using the river package the typical line in a river
package file would look like this:
[K] [I] [J] [STAGE] [CONDUCTANCE] [ELEVATION]
1 3 4 10.2 5.8 9.5
Then during the next stress period typically the stage would change. The line in the file would look like this:
1 3 4 10.8 5.8 9.5
So we repeated all of the data except that 10.2 changed to 10.8. With compression those repeated values do not take
up much space on disk so that the resulting file is smaller.
In one example a river file that was 437 MB was saved to HDF5 format with a compression level of 1; the resulting
file was 14 MB. In another example an HDF5 file that contained drain and general head data was 8 MB while the
drain file was 253 MB and the general head 141 MB. Not only do the files compress extremely well but the
read/write times for the HDF5 file are much faster than the ASCII files.
Changes to MODFLOW 2000 & 2005[1] code
The following subroutines in ult6.f were modified: U2DREL, U2DINT, and ULSTRD. The stream package reading
routines were also modified in the str6.f file.
ult.f modifications
U2DREL and U2DINT were modified so that if the key word HDF5 was encountered when attempting to read an
array then an external procedure is called to read in the data. We have added support for the following:
327
MODFLOW with HDF5
328
Explanation of variables
HDF5
a card to indicate that this is read from an HDF5 file
CNSTNT
the multiplier for the array
IPRN
print flag for the output control for MODFLOW
"FNAME"
the HDF5 file where the array is stored
"pathInFile" path to the data set in the HDF5 file
nDim
number of dimensions that the data set has (this is 1, 2, 3)
start1
the index (NOTE: these are 0 based not 1) for the starting point to read the data set in the first dimension
nToRead1
the number of values to read in the first dimension
start2
the index for the starting point to read the data set in the second dimension
nToRead2
the number of values to read in the second dimension
start3
the index for the starting point to read the data set in the third dimension
nToRead3
the number of values to read in the third dimension
example: "HDF5 1.0 0 "input.h5" "Recharge/07. Property" 3 0 1 0 132 0 1"
This type of formatting will work for any HDF5 data set that has 3 dimensions or less and the data set can be a
4 byte float or an 8 byte double. The other available format that can be used with the HDF5 key word for the
array reading utilities is the following:
HDF5 CONSTANT CNSTNT
example: HDF5 CONSTANT 3.0
This type of formating will assign a constant value to the array. This type of formatting may seem
unnecessary. However, the constant identifier can be useful when using parameters to define arrays.
Parameters will be explained in another section.
ULSTRD was also modified to read data from an HDF file. This format is specific to the types of HDF5 files that
GMS creates.
GMS_HDF5_01 "FNAME" "pathInFile" SP
Explanation of variables
GMS_HDF5_01 a card to indicate that this is read from an HDF5 file
"FNAME"
the HDF5 file where the array is stored
"pathInFile"
path to the group in the HDF5 file where all of the data for the boundary condition is stored
SP
stress period number
Here is an example of a regular modflow drain file and a drain file with the HDF5 modifications.
MODFLOW with HDF5
329
Comparison of MODFLOW Drain files
Traditional Drain file
Drain file with HDF5
3 40 AUX IFACE AUX CONDFACT AUX
CELLGRP
30
1 3 2 19.0 10.0 6 1.0 -1
1 4 3 19.0 10.0 4 1.0 -1
1 5 4 19.0 10.0 5 1.0 -1
30
1 3 2 18.9 11.0 6 1.0 -1
1 4 3 18.9 11.0 4 1.0 -1
1 5 4 18.9 11.0 5 1.0 -1
30
1 3 2 19.0 10.0 6 1.0 -1
1 4 3 19.0 10.0 4 1.0 -1
1 5 4 19.0 10.0 5 1.0 -1
#GMS_HDF5_01
3 40 AUX IFACE AUX CONDFACT AUX
CELLGRP
300
GMS_HDF5_01 "sg_t_pest_65.h5" "Drain" 1
300
GMS_HDF5_01 "sg_t_pest_65.h5" "Drain" 2
300
GMS_HDF5_01 "sg_t_pest_65.h5" "Drain" 3
str6.f modifications
Since the STR package does not use the ULSTRD utility the str6.f file had to be modified to read the same data that
ULSTRD was modified to read: GMS_HDF5_01 "FNAME" "pathInFile" SP.
Parameters
MODFLOW 2000 introduced the concept of parameters as native input to MODFLOW. Starting with version 6.5,
GMS no longer writes out native MODFLOW parameters (except when clusters are defined) and the use of the
MODFLOW PES process is not available from within GMS. Even when native MODFLOW files are exported from
GMS, native MODFLOW parameters are not used (except when clusters are defined) and instead the parameter
starting values are written. However, GMS still supports PEST and users may create parameters in the GMS
interface as they have been able to do previously. Parameters are created in GMS by assigning a "key" value (usually
a negative number) to a MODFLOW input. When MODFLOW is running and calls our external routine to read in
the HDF5 a check is made in the data that is read from the HDF5 file. If one of the parameter "key" values is found
in the data then the parameter value is substituted into the array or list.
By adopting this approach it was much easier to support transient parameters and very large sets of pilot points.
Also, adopting this approach allows GMS users to use parameters with the BCF package. This feature is not
available with the MODFLOW PES process.
Pilot Points
In previous versions of GMS, pilot points were supported by using the multiplier arrays in MODFLOW. Beginning
with version 6.5 the pilot point interpolation takes place with in our external routine that is called by MODFLOW.
For example, if MODFLOW calls our routine to read an HK array and that array has parameter key values that are
associated with a parameter that is defined using pilot points then our routine will perform the pilot point
interpolation and substitute the appropriate value. This includes any log interpolation that the user has specified.
MODFLOW with HDF5
Reading MODFLOW files which include HDF5 data
When GMS writes out the MODFLOW files for the list based packages, the first item written to the file is
#GMS_HDF5_01. When GMS reads these MODFLOW files with this special comment, it does not read any more of
the package file and the data from the *.h5 file will be used.
When GMS saves the RCH or EVT package with parameter that are defined with cluster (and instances). Then a
different special comment is written to the top of the file: #GMS_PARAM_CLUSTERS. If GMS is reading a project
file that includes a MODFLOW simulation then when this special comment is encountered GMS will not read any
more of the package file. However, if a user is reading a MODFLOW model (not a project file) then the rest of this
package file will be read and new data sets will be created on the 3D grid that are used to define the clusters used by
the parameters.
Exporting Native MODFLOW Files
To export native MODFLOW ASCII files from GMS 6.5 (or later), use the following steps:
1. Open a project in GMS (6.5 or later).
2. In the 3D Grid Module, select MODFLOW|Export Native MF2K text....
3. In the window that appears, double-click the Name file of the MODFLOW model that you want to convert to
ASCII format.
4. A DOS prompt will appear. Press the Enter key when the executable is finished.
5. A folder called Out_Mf2k is created in the same folder as the name file you selected. Out_Mf2k contains all the
MODFLOW input files in ASCII format.
If the DOS prompt does not appear after selecting the name file, then go to Edit|Preferences... and select Models.
Verify that the Gms2Mf2k executable (the application that converts MODFLOW files from HDF5 to ASCII format)
has the correct path next to it. If it doesn't, select Browse... and locate the executable. It will probably be located at
C:\Program Files\GMS 8.1\models\mf2k\Gms2Mf2k.exe.
Notes
[1] Supported starting at GMS version 8.0
[2] http:/ / hdf. ncsa. uiuc. edu/ HDF5/
[3] http:/ / hdf. ncsa. uiuc. edu/ hdf-java-html/ hdfview/ index. html
330
Unsupported MODFLOW Features
Unsupported MODFLOW Features
MODFLOW Versions
The supported MODFLOW versions include:
•
•
•
•
MODFLOW 2005 (Supported starting at GMS version 8.0. Read/Write)
MODFLOW 2000 (Read/Write)
MODFLOW 96 (Read and convert to MODFLOW 2000. No write)
MODFLOW 88 (Read and convert to MODFLOW 2000. No write)
The unsupported MODFLOW versions include:
• MF2K-GWM
• MF2K-VSF
• MF2K-FMP
Packages
• See Packages Supported in GMS. All other packages are unsupported (but we are always working on adding
support for more packages). For any package not currently supported in GMS, the file associated with that
package will be ignored when the model is imported. However, GMS keeps track of unsupported packages it
encounters when reading the name file and, when the project is saved, GMS lists the unsupported packages in the
name file and copies the unsupported package files from the old directory to the new directory.
Options
The following MODFLOW options are not supported:
• XSECTION
• GMS does not support models that use the XSECTION option on line 1 of the BA6 file.
• Quasi-3D confining bed (GMS 6.5.x and before)
• File formats: GMS 6.5.x (and earlier versions) can read most regularly formatted files but MODFLOW supports
more formatting options than GMS does. Beginning with version 7.0, MODFLOW is used to import non-GMS
MODFLOW simulations (thus, all MODFLOW formats can be imported).
Parameters
MODFLOW 2000 introduced the concept of parameters as native input to MODFLOW. Starting with version 6.5,
GMS no longer writes out native MODFLOW parameters (except when clusters are defined) and the use of the
MODFLOW PES process is not available from within GMS. Even when native MODFLOW files are exported from
GMS, native MODFLOW parameters are not used (except when clusters are defined) and instead the parameter
starting values are written. However, GMS still supports PEST and users may create parameters in the GMS
interface as they have been able to do previously. Parameters are created in GMS by assigning a "key" value (usually
a negative number) to a MODFLOW input. When MODFLOW is running and calls our external routine to read in
the HDF5 a check is made in the data that is read from the HDF5 file. If one of the parameter "key" values is found
in the data then the parameter value is substituted into the array or list.
By adopting this approach it was much easier to support transient parameters and very large sets of pilot points.
Also, adopting this approach allows GMS users to use parameters with the BCF package. This feature is not
available with the MODFLOW PES process. Other unsupported parameter options:
• HFB, SFR (GMS 7.0.x and before)
331
Unsupported MODFLOW Features
• STR, CHD (GMS 6.5.x and before)
• Multiple clusters for array based parameters (GMS 6.5.x and before)
• Parameter Instances (GMS 6.5.x and before)
Interpolate to MODFLOW Layers
In this dialog the user can select various 2D scatter point data sets and associate them with MODFLOW input data.
GMS will then interpolate from the 2D scatter point data to the MODFLOW input data. This is often useful to define
the layer elevations of a MODFLOW model. Click here for more information on MODFLOW layer elevations.
The user associates 2D scatter point data with MODFLOW data by selecting a data set in the list on the left of the
dialog and selecting an item from the MODFLOW data list on the right and then selecting the Map button. The
association between the data sets and the MODFLOW data is shown in the spread sheet labeled Data set =>
MODFLOW data.
The MODFLOW data group box contains options to allow the user to pick which MODFLOW data they would like
to interpolate to. Elevations refers to the top and bottom elevations of the 3D grid. Heads refers to the starting heads.
Flow package data refers to the various input arrays for the LPF or BCF packages (HK, VK...). Recharge refers to
the recharge rate specified in the RCH package. CHD BCs refers to the starting and ending heads associated with
existing CHD boundary conditions in the MODFLOW model.
The Automap button will try to automatically map the data sets to the MODFLOW data by matching names and
layer numbers. The Unmap button is used unmap the selected item(s) in the spread sheet. The Unmap All button is
self explanatory.
The Interpolation Options button will bring up the 2D Interpolation Options dialog.
Transient Interpolation
If a 2D scatter point data set is transient and the user is interpolating to MODFLOW data that does not vary with
time then the user will select a time step from that data set to interpolate to the MODFLOW data. When the user has
selected a time step the Apply Selected Time To All Transient Data Sets button will undim. This button allows the
user to set the selected time of all of the transient data sets to be the same as the currently selected time.
If the current MODFLOW model is transient and the user is interpolating to Recharge then interpolation will occur
for each stress period defined in the MODFLOW model. For a particular stress period, the closest data set time step
whose time is less than the beginning of the stress period is used. Figure 1 illustrates this process.
332
Interpolate to MODFLOW Layers
333
Figure 1: Transient interpolation of Recharge
If the current MODFLOW model is transient and the user is interpolating to CHD BCs then interpolation will occur
at the beginning and the end of each stress period (because a start head and an end head are specified for each CHD
BC). If there is no data set time step that matches the beginning or the end of the stress period then GMS will
linearly interpolate between data set time steps. Figure 2 illustrates this process.
Figure 2: Transient interpolation of CHD BCs
MODFLOW Layers to 2D scatter points
MODFLOW Layers to 2D scatter points
This dialog allows the user to create a scatter point set and data sets of the current MODFLOW simulation.
The user can limit the number of scatter points created by turning on the Only create scatter points within selected
coverage option and selecting the appropriate coverage. This is often used when converting between a regional
model and a local scale model.
Layer Subdivision
The layers of the current MODFLOW simulation can be subdivided by specifying the Number of local model layers
for each layer in the current 3D grid.
The user can select which MODFLOW data sets to create by turning off/on the toggles below the Create data sets of
text. Data sets for layer elevations, flow package data (HK, HANI, VK, SY, SS...), Recharge, and Heads can be
created. The user must select a 3D grid data set in order to create a data set for the Heads (most often this will be the
MODFLOW solution from the regional model).
The Recharge and Head data sets can be transient if the regional model was transient. The user can also select a Start
and End time to limit the number of time steps for these data sets.
Bias Layer 1
An option to bias the thickness of the new layer 1 is also available. This can be useful if equally subdividing layer 1
of the regional model would result in cells where the elevation would be above the computed heads. Thus, the user
can choose to bias the thickness of the new layer 1 to ensure that the top layer in the new model will not be dry.
MODFLOW Source/Sink Dialog
The Sources/Sinks dialog allows the user to edit both point sources/sinks and areal sources/sinks.
Point Sources/Sinks
The MODFLOW stresses can be categorized as point sources/sinks and areal sources/sinks. The point sources/sinks
include rivers, wells, drains, and general head. Point sources/sinks are not assigned using arrays. Rather, they are
associated with individual cells. Two methods are used to define point source/sink data. The simplest method is to
define them as part of a MODFLOW conceptual model defined in the Map module. Another method is to assign
them by selecting a set of cells and using the Sources/Sinks command.
The Sources/Sinks command is used to both assign and edit river, drain, general head, and well type sources/sinks.
Before selecting the Cell Sources/Sinks command, a set of cells should be selected using the cell selection tools.
Once the command is selected, the Point Sources/Sinks dialog appears.
Creating New Sources/Sinks
A new instance of a source/sink of a particular type is created by selecting the Add button for the type. This creates a
new source/sink and displays a default value or set of values for the source/sink in the edit fields on the right side of
the dialog. If the simulation is steady state, normal edit fields are used to enter the values. If the simulation is
transient, buttons appear which can be used to bring up the XY Series Editor. A value is entered for each of the
defined stress periods.
334
MODFLOW Source/Sink Dialog
Multiple instances of a source/sink can be created by repeatedly selecting the Add button. Each cell can contain
multiple sources/sinks of a particular type or a mixture of several types.
Editing Sources/Sinks
An existing source/sink can be edited by selecting the name of the source/sink in the source/sink list. The values
associated with the highlighted source/sink are displayed in the spread sheet.
Deleting Sources/Sinks
An instance of a source/sink may be deleted by selecting the source sink from the list and selecting the Delete button.
Constant Values
Several of the parameters shown in the Point Sources/Sinks dialog, such as elevation and conductance, are not likely
to change during a transient simulation. A constant value can be entered for these parameters in the XY Series Editor
and the resulting curve is a flat line.
Areal Sources/Sinks
The Areal Sources/Sinks command is used to edit recharge and evapotranspiration parameters on a cell-by-cell basis.
Before selecting the Areal Sources/Sinks command, a set of cells should be selected using the cell selection tools.
Recharge and evapotranspiration parameters are applied to vertical columns rather than to individual cells.
Therefore, to edit the value for a vertical column, any cell in the column can be selected. Once the Areal
Sources/Sinks command is selected, the Areal Sources/Sinks dialog appears. The options in the dialog are as
follows:
Packages
If the Recharge package has not been activated (using the Packages dialog which is accessed through the Global
Options\Basic Package dialog) the Recharge portion of the Areal Sources/Sinks dialog is dimmed. Likewise, if the
Evapotranspiration package has not been activated, the Evapotranspiration portion of the dialog is dimmed.
Editing Values
The edit fields to the right of each option are used to enter the values of the parameters associated with each type.
The fields are standard edit fields if the simulation is steady state and are graphic windows displaying a time series if
the simulation is transient. Clicking on the window brings up the XY Series Editor. The XY Series Editor is a
general purpose editor for entering curves or lists of pairs of data (e.g., rainfall rate vs. time). Once a curve is defined
in the editor, it is displayed graphically in the window.
Layers
The Layer option in the Recharge portion of the dialog is only active (undimmed) if the Recharge at Specified
Vertical Cells option is chosen in the Recharge Package dialog. Likewise, the Layer option in the Evapotranspiration
portion of the dialog is only active if the ET at Specified Vertical Cells option is chosen in the Evapotranspiration
Package dialog.
Editing Multiple Cells
After a set of source/sink parameters has been defined, it is often necessary to change one of the parameters of a
subset of the cells (vertical columns).
For example, suppose the Evapotranspiration package has been activated and each vertical column was assigned a
unique value of elevation, extinction depth, and maximum evapotranspiration rate. Suppose that it becomes
necessary to change the extinction depth of a large subset of the vertical columns to a constant value while leaving
335
MODFLOW Source/Sink Dialog
the other parameters unchanged. The Areal Sources/Sinks dialog has been designed so that it can be used to change
one of the parameters without altering the other parameters.
If more than one cell is selected when the Areal Sources/Sinks dialog is brought up, the available edit fields appear
with a checkerboard pattern if the values in the cells are not all identical. Before editing a parameter, click on the
field to switch it from multi-select mode to normal mode. When the OK button is selected after the parameters have
been edited, only the parameters that have been selected are changed. For example, in the case of changing the
extinction depth, if the extinction depth is edited, the extinction depth of all of the vertical columns associated with
the selected cells is changed to the new value but the individual values of elevation and maximum evapotranspiration
rate are left unchanged.
336
337
6.3.3. MODFLOW Post-Processing
MODFLOW Display Options
The properties of all MODFLOW data that GMS displays on the screen can be controlled through the MODFLOW
tab of the Display Options dialog. This dialog is opened by right clicking on the
MODFLOW entry in the Project
Explorer and selecting the Display Options command. It can also be accessed from the from the Display menu, the
MODFLOW menu, or the
Display Options macro. The following table describes the display options available for
the 3D Grid module.
Display Option
Description
Wells, Drains, Rivers,
Streams, General
head, Constant head,
Transient head
These items on the left side of the dialog represent source/sink objects. If the check box just to the left of each source/sink
name is selected, a symbol is displayed at the center of each cell with that type of source/sink. The symbol for each
source/sink is displayed to the left of the check box. The symbol can be changed by selecting the symbol button. This
brings up the symbol editor dialog. The symbol editor contains a list of available symbols. The dialog can also be used to
edit the size and color of the symbol.
Horiz. flow barriers
The Horiz. flow barrier option displays a line at the location of each horizontal barrier. The attributes (thickness, color,
etc.) can be edited by clicking on the small window to the left of the Horiz. flow barrier toggle.
Dry cells
If the Dry cells option is selected, the chosen symbol will be displayed at the location of all dry cells in the grid. A
MODFLOW solution must be imported to GMS prior to displaying dry cells. When a cell goes dry during a MODFLOW
simulation, the HDRY value defined in the BCF Package is assigned as the head value for the cell. If an HDRY value is
encountered in the active scalar data set when the display is refreshed, the cell is assumed to be dry.
Water table
If the Water table option is selected, the water table defined by a MODFLOW solution is superimposed on the layer
geometry when a grid cross section is displayed in orthogonal mode. The water table is defined as the head value in the
uppermost active cell. If the water table display is on, all contours (head, concentration, etc.) are clipped so that they lie at
or below the water table. This option is only available if the True Layer mode is active.
Mark flooded cells
The Mark flooded cells option is used in conjunction with the True Layer approach to defining layer data. With the True
Layer approach, the top elevation is entered for each layer, regardless of the layer type. With many models, the top layer is
an unconfined layer and the top elevation represents the ground surface. For unconfined layers, the top elevation array is
not read by MODFLOW. Only the bottom elevation array is used in the calculations. MODFLOW assumes that the top
layer extends to an infinite height. It is often the case that the computed water table elevation exceeds the elevation of the
ground surface. The Mark flooded cells option is used to draw a symbol at the center of all cells where the computed water
table elevation is greater than the top elevation of the top layer in the grid.
Lake cells
If the Lake cells option is selected, a symbol is draw in the center of each cell representing a lake. The symbol, the symbol
size, and symbol color can be adjusted by clicking on the button to the left of the Lake cells toggle.
Lake ID's
If the Lake ID's option is selected, each cell representing a lake will display the lake ID in the center of the cell. The font,
font size, and font color can be adjusted by clicking on the button to the left of the Lake ID's toggle.
Display symbol legend If the Symbol legend option is selected, a legend showing each of the symbols associated with sources/sinks, dry cells, and
flooded cells is displayed in the lower right corner of the GMS window.
Display hydrogeologic The Display hydrogeologic units option is used to display HUF data. This option only works if the current display mode is
units
Ortho Mode. This mode can be turned on in the Display menu.
Check All
By clicking this button, all of the display options are turned on.
Check None
By clicking this button, all of the display options are turned off.
MODFLOW Post Processing Viewing Options
MODFLOW Post Processing Viewing Options
In addition to generating and editing the MODFLOW input files, GMS can also be used for post-processing the
solution files computed by MODFLOW. The solution files computed by MODFLOW include head, drawdown, and
CCF files. By default, the head and CCF files are automatically generated. The output options are controlled in the
MODFLOW Output Control dialog.
No-Flow and Dry Cells
When a MODFLOW simulation is solved, MODFLOW writes out a head or drawdown value for every cell of the
finite difference grid to the solution files. However, some of the cells are either outside the problem domain or they
have gone dry during the course of the simulation. These cells are flagged by MODFLOW in the output file by
writing special values for the cells. The value assigned to inactive cells is the No flow head value specified in the
Global Options/Basic Package dialog. The value assigned to cells which have gone dry is the Head assigned to dry
cells value defined in the BCF, LPF or HUF package dialogs. If the MODFLOW data are in memory when the
solution is read in, GMS will automatically use the No flow head and Head assigned to dry cells values to define
active/inactive cells for post-processing.
Layer Contours
In most cases, the best way to display computed head and drawdown is with layer contours. Layer contours are
generated by selecting the Layer Contours option in the 3D Grid Display Options dialog. This option is
automatically turned on whenever a MODFLOW solution is read into GMS. The Mini-Grid Toolbar, which is part
of the Tool Palettes, can be used to switch between layers.
Viewing Computed Fluxes
The CCF file that is part of the MODFLOW solution contains useful information about the computed flux rates
between the aquifer and external sources and sinks. A special set of tools are provided for viewing computed fluxes.
Summation of Fluxes on Arcs and Polygons
GMS writes the necessary files so that MODFLOW will output the computed flow for boundary conditions created
in the Map module. These computed flows can be viewed by selecting the appropriate feature object (river arc, etc)
and then looking at the Status Bar. For an object with an assigned observed flow, the observed flow value and the
residual error are displayed in addition to the computed flow. For objects without an observed flow, only the
computed flow is shown.
This cannot be done for SFR stream arcs since the SFR package does not participate in the Observation Process.
338
MODFLOW Post Processing Viewing Options
Calibration Targets and Statistics
For objects with an observed flow, a Calibration Target can be plotted on the object. The calibration target provides a
graphical representation of the calibration error. Calibration targets are described in section 14.5. The display of flow
calibration targets is turned on by selecting the Display Options command in the Feature Objects menu when the
Local Source/sink coverage is the active coverage.
Flow Budget for Selected Cells
If a MODFLOW model is built without using the conceptual model approach (directly from the grid), the computed
fluxes corresponding to a user-defined set of cells can still be displayed. This is accomplished by selecting a set of
cells and selecting the Flow Budget command from the Data menu in the 3D Grid module. This command brings up
the Flow Budget dialog. This dialog lists the complete flow budget for the selected cells.
GMS also includes a Zone Budget tool to view the computed flows into (out of) user defined zones.
Vector Plots
If a CCF file has been imported as described above, a vector plot can be generated to illustrate the flow field
computed by MODFLOW. The CCF file contains flows through each of the cell walls in the grid, i.e., the flow from
each cell to each of its six surrounding cells.
Vectors are generated by right-clicking on the CCF file in the Project Explorer and selecting the CCF->Velocity
Vectors command. The cell top and bottom elevations as well as the porosity are used when calculating the velocity
vectors. Therefore, for GMS to compute the vectors, a MODFLOW simulation must exist in GMS. Although
porosity is not an input to a MODFLOW model, the porosity can be specified per cell, using the cell properties
dialog, whenever a MODFLOW simulation exists.
The vectors are computed by reading the CCF file to get the net flow through each grid cell face. Each component of
the velocity vector is computed by dividing the flow through the cell face by the saturated area of the face multiplied
by the porosity. For example, the I, J, K direction components of the vector are calculated as follows:
• vector.I = flow.I / (saturated area I * porosity)
• vector.J = flow.J / (saturated area J * porosity)
• vector.K = flow.K / (area K * porosity)
The saturated area may be less than the area of the cell face if the computed head is below the top elevation of the
grid cell. The velocity vector is set to 0.0 in cells that are inactive, dry (the computed head is below the cell bottom
elevation), or have inappropriate elevations (the top elevation is below the bottom elevation).
Prior to version 8.2.
To generate a vector data set from the CCF file, right click on the CCF data set in the Data Tree and select the
Generate vectors option from the pop up menu. A flow vector is generated at each cell center by computing a vector
sum of the flows through the six walls of the cell. The resulting vectors can be plotted by selecting the Vectors
option in the 3D Grid Display Options dialog.
Viewing the Printed Output File
Two types of output are produced by MODFLOW: a printed output file and a set of solution files (head, drawdown,
CCF). Before reading in the solution files, it is often useful to examine the printed output file. In some cases,
MODFLOW may crash or not complete its run successfully. You can usually determine if the run was completed
successfully by viewing the printed output file. When viewing the file you should check to make sure that a solution
was output for all stress periods and time steps you are expecting. In some cases MODFLOW will also output to the
listing file a description of any problems which may have occurred.
339
MODFLOW Post Processing Viewing Options
GMS provides two ways to view the text files produced by MODFLOW and the other analysis codes:
1. When a solution is read into GMS, the text output files are placed into the data tree. Double clicking on their file
icons in the Project Explorer will bring up the text files in a text editor.
2. Any text file can be viewed by selecting the Edit File command in the File menu. A File Browser appears and the
selected file is opened in a text editor.
MODFLOW Solution Properties Dialog
The MODFLOW Properties Dialog Box is opened by right clicking on the MODFLOW solution folder in the project
explorer.
The data in this dialog come from the *._os, *._ww, *._r, *._w files computed by the MODFLOW Observation
process. The computation from MODFLOW will include any observed flows combined with the observed heads to
calculate a single error value. In a transient model, the error value includes all of the observations at the various
times. The error shown in this dialog is different from the error found in the Error Summary Plot.
340
MODFLOW Solution Properties Dialog
Comment on different error values
• Mean Residual - Average error for the observations. This can be misleading because the positive and negative
errors can cancel.
• Mean Absolute Residual - Mean of the absolute error values for the observations. This is a true mean, not
allowing positive and negative errors to cancel.
• Root Mean Squared Residual - RMS is calculated by taking the sum of the square of the errors for the
observations and then taking its square root. This tends to give more weight to cases where a few extreme error
values exist.
• Sum of Squared Weighted Residual - This is the error value that is minimized by a PEST run.
Point head observation errors
Mean Residual (Head).
Mean Absolute Residual (Head).
Root Mean Squared Residual (Head).
Flow observation errors
Mean Residual (Flow).
Mean Absolute Residual (Flow).
Root Mean Squared Residual (Flow).
Combined head and flow error values
Mean Weighted Residual (Head+Flow).
Mean Absolute Weighted Residual (Head+Flow).
Root Mean Squared Weighted Residual (Head+Flow).
Sum of Squared Weighted Residual (Head+Flow).
341
Saving and Reading a MODFLOW Simulation
Saving and Reading a MODFLOW Simulation
Saving a MODFLOW Simulation
Once a MODFLOW simulation has been created and checked for potential problems with the Model Checker, the
next step is to save the simulation to disk and run MODFLOW. MODFLOW simulations are saved using the Save
and Save As commands in the File menu.
Selecting the Save command saves the GMS project including the model simulation. By default the model
simulation will be saved to the same location as the GMS project. However, in the Save dialog the path for the model
simulation can be specified.
A MODFLOW simulation is actually saved to a set of input files. The MODFLOW super file is used to store extra
data used by GMS but not used by MODFLOW. The super file also contains the path to the name file. The names of
all of the input and output files associated with a simulation are saved in the name file. When MODFLOW is
launched, the name of the super file is automatically passed to the MODFLOW executable.
When a MODFLOW simulation is saved, the names of the other MODFLOW input files are automatically patterned
after the name of the super file. For example, if the super file is named sampmod.mfs, the other files are named
sampmod.bas, sampmod.bcf, etc.
The user can adjust the output options in the Output Control dialog
The version of MODFLOW 2000 that ships with the GMS software has been modified to be able to read and write
input data stored in HDF5 files. For more information see MODFLOW with HDF5.
Reading a MODFLOW Simulation
Once a MODFLOW simulation has been saved by GMS using the Save command in File menu, the entire simulation
can be read back into GMS using the Open command in the File menu.
MODFLOW simulations can be read in individually (*.mfs) or as part of a project (*.gpr). They can also be
imported by using the MODFLOW name file. The extension for the name file must be changed to *.mfn.
Reading a Completed MODFLOW Solution
When you are using the Model Wrapper to control your MODFLOW run, you can use the Read MODFLOW
solution toggle at the bottom of the dialog to automatically read in the corresponding solution.
You can also read in solution files generated by MODFLOW using the Read Solution command in the MODFLOW
menu. This command brings up the a file browser and prompts you to choose a MODFLOW super file (pre GMS
7.0) or a MODFLOW name file (GMS 7.0+).
342
Cell Properties
Cell Properties
The cell properties dialog allows the user to edit cell properties. Most cell properties are associated with a model
such as MODFLOW or MT3D. If no models exist in the GMS project them the cell properties dialog will only allow
editing of the material assigned to the grid cell.
MODFLOW
Several input arrays defining parameters such as starting head, IBOUND, hydraulic conductivity, and transmissivity
are defined in the Global/Basic and BCF, LPF, or HUF packages. These arrays can be edited in the Basic and
BCF/LPF/HUF Package dialogs, or they can be initialized using a conceptual model in the Map module. In many
cases however, it is necessary to view or edit the values on a cell-by-cell basis. This can be accomplished using the
Cell Properties command in the MODFLOW menu.
Before selecting the Cell Properties command, a set of cells should be selected using the cell selection tools. Once
the command is selected, the MODFLOW Cell Attributes dialog appears.
The parameters for the selected cells are changed by typing in new values in the edit fields. If more than one cell is
selected when the Cell Properties command is selected, the available edit fields will be left blank (unless all values
are the same for that parameter). To edit one of the parameters, click on the edit field to be edited. When the OK
button is selected, only the parameters whose edit fields that have data are changed. This makes it possible to change
one of the parameters (e.g., transmissivity) for all of the selected cells while leaving the other parameters unchanged.
NOTE: When you are using materials to define the MODFLOW model, the Cell Properties dialog will show the
material properties relating to the material of the selected cell. You will not be able to edit these values on a
cell-by-cell basis, but you can either edit the material type for this cell if the active material set is the default material
set, or you can change the material properties for the material (which affects every cell that uses that material).
MT3DMS/RT3D/SEAM3D
MT3D inputs that vary on a cell by cell basis can also be editing using this dialog and editing the data in the MT3D
tab.
343
MODFLOW World File
MODFLOW World File
A MODFLOW world file is a plain text file containing the geographic location of a MODFLOW model. The world
file contains 3 lines including the origin, rotation about the z axis, and the path of a projection file. The world file is
found in the same directory as the name file. The MODFLOW world and projection files are automatically written
by GMS when the project has a global projection.
Format
ORIG x y z
ROTZ theta
PRJ_FILE "file_path"
The ORIG line contains the space separated x, y, and z coordinates of the outside corner of the model cell at the first
column and last row.
The ROTZ line contains the counter-clockwise (looking down) rotation of the model about the origin coordinate in
degrees.
The PRJ_FILE line contains the absolute or relative path to the model's projection file which ends in with a *.prj
extension. The file path is sourounded by double quotes.
Sample
ORIG 612086.0 3429376.55 230.0
ROTZ 90.0
PRJ_FILE "modfmap.prj"
344
Error Summary Plot
Error Summary Plot
An Error Summary plot is one of the plot types that can be created by the Plot Wizard. See the Error Summary plot
section on the Plot Wizard page for a basic description. The Error Summary plot is used to display a text listing of
the mean error, mean absolute error, and root mean squared error for an observation measurement in a coverage. The
error values may be listed for a single time step of a data set or for all time steps.
Error types
Mean Error: This is the average error for the points. This value can be misleading since positive and negative
errors can cancel.
Mean Absolute Average: This is the mean of the absolute values of the errors. It is a true mean, not allowing
positive and negative errors to cancel.
Root Mean Square: This takes the sum of the square of the errors and then takes its square root. This norm
tends to give more weight to cases where a few extreme error values exist.
Time matching
When the measurement is transient (i.e., observed heads at various times) then it is very unlikely that the output
times from the model match the times when the field measurements were taken. In this case GMS will interpolate an
observed value at the model output time. If the model output time is before the first field measurement for a
particular point then the interpolated value is the first measurement. Similarly if the model output time is after the
last field measurement then the interpolated value is the last measurement. When the model output time is between
the first and last measurement then GMS will find the 2 closest field measurments to the model output time and use
linear interpolation to compute the "observed" value at that time.
MODFLOW errors
The Error Summary Plot is most useful with models that do not make error computations from observation data.
MODFLOW does compute error computations from observation data, and these errors are available in the
MODFLOW properties dialog. Therefore, when using MODFLOW, you should use the MODFLOW properties
dialog and not the Error Summary Plot. The errors shown in the Error Summary Plot are not the same as those found
in the MODFLOW properties dialog due to the time matching and interpolation issues described above. The
MODFLOW properties dialog shows the errors computed by MODFLOW for the observations at the actual
observation times and is therefore superior. The errors reported by MODFLOW have nothing to do with the model
output times, only observation times.
Plot creation
Error Summary plots are created in the Plot Wizard by setting the plot type to Error Summary. A sample plot is
shown in the figure.
345
Error Summary Plot
Error Summary Plot Options
After the plot type is set in the first step of the Plot Wizard, the Next button is clicked to move to the second step of
the Plot Wizard.
Coverage: Displays the name of the coverage where the current data for the plot is coming from.
Measurement: This is the name of the current measurement, created in the Feature Objects | Attributes dialog,
being plotted.
Feature Objects: Displays which feature object is utilized in the current plot, points or arcs.
Zone Budget
In previous versions of GMS, it has been possible to view a detailed MODFLOW flow budget for a set of selected
cells using the Flow Budget command in the Data menu. Now, the flow budget can be summarized based on
user-defined zones. This provides a capability quite similar to the USGS ZoneBudget tool. However, the calculations
are all done inside GMS using the CCF file generated by MODFLOW.
Defining Zones
The first step in using this utility is to identify the model zones by assigning a zone budget id to each of the cells in
the grid. The zone budget id is an integer value. It can be associated with polygons in a MODFLOW conceptual
model in the map module. The zone budget id property is listed in the Areal Properties column of the Coverage
Setup dialog. These IDs are then assigned to the appropriate grid cells when the Map->MODFLOW command is
selected. The IDs can also be assigned directly to cells by selecting a set of cells and selecting the Cell Properties
command in the MODFLOW menu.
A Zone Budget IDs item is also included just below the MODFLOW icon in the Project Explorer window. Clicking
on this icon displays the zone budget IDs and double-clicking brings up the zone budget id array in the spreadsheet
editor.
Viewing the Flow Budget
Once the zone budget IDs have been assigned, the flow budget for each zone can be viewed by selecting the Flow
Budget command in the MODFLOW menu. This brings up the Flow Budget dialog. There is a new zone selector
combo box at the top of the dialog. The flow budget associated with the selected zone is shown in the table. The
combo box includes an "All zones" option that displays a summary for all zones in the model. Also, turning on the
Use all timesteps toggle will create a flow budget report for each time step in the current MODFLOW solution.
346
Zone Budget
Viewing in a Plot File
For a transient model you may use the flow budget vs. time plot to view the flow budget for any number of cells.
By right clicking on the plot and select the view values option, GMS will generate a table of the flow budget for the
different time steps.
347
Zone Budget
348
Viewing the MODFLOW CCF File
There are two new options to view MODFLOW cell-to-cell flow (CCF) file output:
1. The CCF file can be viewed in a spreadsheet by right-clicking on the CCF file in the Project Explorer and
selecting the View Values command.
2. The CCF file can also be converted to a set of data sets. One data set would be created for drains (if they exist),
one for rivers etc., and 3 for cell-to-cell flow (flow right, flow back, flow down).
CCF data sets displayed in the Project Explorer
ZONEBUDGET
ZONEBUDGET
ZONEBUDGET is USGS program that reads cell to cell flow data produced by MODFLOW and calculates water
budgets for subregions of the modeled area. GMS has an interface to ZONEBUDGET available from the
MODFLOW | Flow Budget menu command. This command brings up the Flow Budget dialog and one of the
available tabs in the dialog is USGS ZONEBUDGET. GMS supports version 3.01 of ZONEBUDGET.
When the user brings up the ZONEBUDGET tab they will be analyzing the CCF file from the active MODFLOW
solution. All ZONEBUDGET inputs and outputs will be written to the same location as the CCF file.
GMS has its own internal tools for analyzing CCF data. These tools are explained here.
ZONEBUDGET OPTIONS
• Title - This is a title that is printed to the listing output file.
• Output
• Listing File - This specifies that ZONEBUDGET will produce a listing file as output. This was the only kind
of output that the first version of ZONEBUDGET produced.
• Multiple Outputs - Version 3 of ZONEBUDGET has the option to produce multiple output files.
• ZBLST - ZONEBUDGET will create a listing file as part of its output.
• CSV - ZONEBUDGET will create a comma separate value (CSV) file as part of its output. For each time
for which a budget is requested there is one line for each input term and each output term along with totals.
The zones are displayed in columns, so one table displays all zones. This makes it easy to compare any
budget term for all the different zones.
• CSV2 - ZONEBUDGET will create another CSV file as part of its output. The CSV2 file displays the
complete budget for one zone and one time in a single line. Each column has a separate inflow or outflow
budget term. The rows can be sorted by time within the spreadsheet program, which makes it possible to
easily see how each term changes with time.
• Output times
• all - Every time step in the MODFLOW CCF file will be processed.
• specified - With this option selected the user can select individual time steps from the CCF file for
ZONEBUDGET to process. When the user clicks on the Times button a spread sheet comes up that allows
the user to select the time steps.
• Composite Zones - ZONEBUDGET allows users to combine zones into "Composite Zones" and then
information about the composite zone is printed to the listing file.
• Number of zones - This specifies the number of composite zones.
• Edit Zones - This button brings up a dialog where the user can create composite zones. A composite zone is
defined by a name that is 10 characters or less in length and a list of the zone ids separated by a comma. For
example, when analyzing a model with zones 1, 2, 3, and 4, composites zone could be defined as follows:
349
ZONEBUDGET
350
Name
Zone IDs
zone_top 1, 2
zone_bot 3, 4
• Run ZONEBUDGET - This launches ZONEBUDGET with the specified input options.
• View - This allows the user to load ZONEBUDGET outputs. The options available include LST, ZBLST, CSV,
and CSV2. The contents of the output file are loaded into a text window or a spread sheet in the space below the
View check box.
• Open Containing Folder - This button brings up Windows Explorer opened to the directory with the
ZONEBUDGET output.
Viewing Computed Fluxes
Once a set of observed flows has been entered, the next step is to run the MODFLOW model, read in the solution,
and compare the computed flows to the observed flows. The computed flows are part of the MODFLOW output.
Summation of Fluxes on Arcs and Polygons
GMS writes the necessary files so that MODFLOW will output the computed flow for boundary conditions created
in the Map module. These computed flows can be viewed by selecting the appropriate feature object (river arc, etc)
and then looking at the Status Bar. For an object with an assigned observed flow, the observed flow value and the
residual error are displayed in addition to the computed flow. For objects without an observed flow, only the
computed flow is shown.
Calibration Targets and Statistics
For objects with an observed flow, a calibration target can be plotted on the object. The calibration target provides a
graphical representation of the calibration error. Calibration targets are described in section 14.5. The display of flow
calibration targets is turned on by selecting the Display Options command in the Feature Objects menu when the
Local Source/sink coverage is the active coverage.
Flow Budget for Selected Cells
If a MODFLOW model is built without using the conceptual model approach (directly from the grid), the computed
fluxes corresponding to a user-defined set of cells can still be displayed. This is accomplished by selecting a set of
cells and selecting the Flow Budget command from the Data menu in the 3D Grid module. This command brings up
the Flow Budget dialog. This dialog lists the complete flow budget for the selected cells.
351
6.4. MODPATH
MODPATH
MODPATH is a particle tracking code that is used in conjunction with MODFLOW. After running a MODFLOW
simulation, the user can designate the location of a set of particles. The particles are then tracked through time
assuming they are transported by advection using the flow field computed by MODFLOW. Particles can be tracked
either forward in time or backward in time. Particle tracking analyses are particularly useful for delineating capture
zones or areas of influence for wells.
A complete description of MODPATH is beyond the scope of this help file, however, because of the user-friendly
interface in GMS, an intimate knowledge of MODPATH is not required to effectively do particle tracking in GMS.
For a more complete knowledge of MODPATH, refer to the MODPATH documentation (Pollock, 1994).
MODPATH was developed by the U.S. Geological Survey. Version 5.0 of MODPATH is supported in GMS. The
version of MODPATH distributed with GMS is the original public domain version distributed by the USGS, with
minor modifications to accommodate GMS.
MODPATH Links
•
•
•
•
•
MODPATH Particle Tracking
MODPATH Particle Sets
MODPATH Zone Codes
MODPATH Display Options
Exporting Pathlines
MODPATH Particle Tracking
MODPATH Particle Tracking
Requirements
Before you can do particle tracking with MODPATH, you must have:
1. A MODFLOW simulation in memory.
2. A MODFLOW solution in memory computed using MODFLOW 2000 with a valid head and flow field.
If the Conceptual Model approach is used to build the MODFLOW model, the same conceptual model can be used
to initialize some of the input data for MODPATH. Both the zone codes and porosities can be defined using
polygons in a MODFLOW / MT3D / MODPATH Layer Attributes type coverage. The values are assigned to the
cells when the Map -> MODPATH command is selected.
Steps
Once you have a MODFLOW solution, all that is necessary to do particle tracking is to:
1. Create particle starting locations.
As soon as you create the particle starting locations GMS immediately does a number of things depending on the
Run MODPATH automatically for steady state models option in the MODPATH General Options dialog. If the
option is on and the MODFLOW model is steady state.
Automatic option on
1.
2.
3.
4.
GMS saves the MODPATH input files.
GMS launches MODPATH and passes it the input files.
GMS waits for MODPATH to compute the pathlines.
GMS then reads in and displays the pathlines.
All this is done automatically and behind the scenes and usually takes just a second or two. Thus, pathlines will
appear almost immediately after you define the particle starting locations. If MODPATH encountered problems
attempting to generate the path lines, the errors will be displayed in the MODPATH Errors dialog.
Automatic option off
If the Run MODPATH automatically for steady state models option is off, or the MODFLOW model is transient, you
must save and run MODPATH manually after creating particle starting locations before pathlines will appear. This is
to prevent having GMS spend lots of time updating pathlines because MODPATH can take a considerable amount of
time with large, transient models. The MODPATH|Run MODPATH menu command or equivalent toolbar macro can
be used to run MODPATH.
Generating Particles
There are two ways to generate particle starting locations in GMS, both available via the MODPATH menu:
Generate Particles at Wells - Accessed in the MODPATH menu. This command automatically generates
particle starting locations in cells containing wells. The specified number of particle starting locations are
distributed evenly in a horizontal circle around the center of the cells containing the wells. You specify the
number of starting locations per cell, and whether you want starting locations created in extraction well cells,
or injection well cells.
Injection Wells - If this option is selected, particles are created in cells with wells that have a positive
flow rate. The tracking direction for the current particle set is changed to forward.
352
MODPATH Particle Tracking
Extraction Wells - If this option is selected, particles are created in cells with wells that have a negative
flow rate. The tracking direction for the current particle set is changed to backward.
Selected Wells - This option makes it possible to generate particles at either all wells or only at wells
within selected cells.
Generate Particles at Selected Cells - Accessed in the MODPATH menu. This command opens the Generate
Particles dialog, and when you select OK, particles are created in all the selected cells according to the options
specified.
Number of Particles - If the More options toggle is not selected, you can use the slider to change the
number of particles created per cell. The minimum is 1, and the maximum depends on the option being
used to distribute the particles. The number of particles jumps as the slider is moved in order to create an
even distribution of particles. If the More options toggle is selected, the slider is not available, and the
user has more control over the total number of particles and how they are distributed.
Distribute Particles - There are three options for distributing the particles within the selected cells.
• Within Cell - With this option, the particles are distributed in the interior of the cells.
• On Cell Faces - With this option, the particles are distributed on the faces of the cells.
• Distribute Starting Points on Water Table Surface - With this option, the particles are restricted to the
top face only. When using this option, you should be sure to select the cells corresponding to the location
of the water table surface.
• More Options - The More options toggle expands the dialog, allowing you to further define how
particles are distributed within the selected cells.
(These commands are only available if a MODFLOW CCF solution generated by MODFLOW 2000 exists, and you
have 3D grid cells selected.)
Transient MODFLOW Solution
For each time step, particle paths are computed just as for the steady state case until the end of the time step is
reached. A new velocity distribution is then calculated for the next time step and the computation of particle paths is
resumed. The computation of paths forward or backward, boundary conditions, and the path line termination criteria
are handled the same as for steady state flow.
353
MODPATH Particle Sets
MODPATH Particle Sets
MODPATH particles are grouped into sets. For each set, you can specify the name of the set, the tracking direction,
the tracking duration, and if the particles in the set should be displayed.
Grouping particles into sets increases the power and flexibility of particle tracking. For example, several particle
sets, some tracking backward and some forward can all be displayed at once. Or, several particle sets, each with
different tracking times, can all be displayed at the same time. This can be used to show nested capture zones.
Active Particle Set
One particle set is always designated as the active particle set, and there is never more than one active particle set.
Whenever particles are created, they are added to the active particle set. Particles can only be deleted from the active
particle set - to delete particles in a particle set that is not active, you must first make it active.
Order
The order that particle sets are listed in the Data Tree corresponds to the order they are displayed. Thus, particle sets
that are listed at the top are displayed on top of particle sets listed further down. The order can be changed by
dragging the particle sets.
Creation / Deletion
If a particle set is deleted, all the particles in the set are deleted.
If there are no particle sets, and you create particles, a particle set is automatically created.
Pathline Export
See Exporting Pathlines.
Spreadsheet Report
In addition to the text file export, we have an option for generating a tabular report directly within GMS. This report
is accessed by right clicking on a particle set in the Project Explorer and selecting the View Pathline Report
command. This command brings up the following dialog:
354
MODPATH Particle Sets
MODPATH Zone Codes
When post-processing the results of the MODPATH simulation, the colors of the paths or particles can be varied
depending on the zone code of the cell in which the particle started or in which the particle terminated. Zone codes
are assigned using the IBOUND array in the MODFLOW interface. In other words, unique values of the IBOUND
array (100, 200, 300, etc.) are assigned to the cells of the grid to define the zone codes. The zone code array can be
edited by clicking on the Zone Code Array command in the MODPATH menu. This command is only available if a
MODFLOW simulation exists.
Cell Properties
The Zone Code for each cell can also be edited by selecting a cell and then choosing the Cell Properties command
from the MODPATH menu. In addition to the zone code, cell porosity can be edited in the Cell Properties dialog.
355
MODPATH Display Options
356
MODPATH Display Options
A set of display options unique to the MODPATH input data and MODPATH solutions is provided in GMS. These
options are accessed through the Display Options command in the MODPATH menu. This command is only
available if a MODFLOW simulation exists. This command brings up the Particles tab of the 3D Grid Display
Options dialog. The following table describes the display options available for the MODPATH model.
Display
Option
Description
Starting
locations
The starting locations for the particles can be turned on and off. The symbol style, color and size can also be adjusted.
Starting
location
indices
The starting locations indices for the particles can be turned on and off. The font style, color and size can also be adjusted.
Ending
locations
The ending locations for the particles can be turned on and off. The symbol style, color and size can also be adjusted.
Pathlines
The pathlines can be toggled on and off, and the pathline style and color can be adjusted. The pathline color can be set to the default
color, or the color corresponding to the starting, ending, or
cell zone codes of the pathlines. The "Cell zone code" option causes the pathline to change color as it passes through cells with
different zone codes.
Direction
arrows
Direction arrows can be displayed along the pathlines. The size of the arrow heads can be set by specifying the Length in pixels. The
arrows are displayed along the pathline at an interval corresponding to the Length specified.
Zone codes
Colors can be associated with zone codes. If the Auto compute colors option is selected, GMS will automatically pick colors to go
with each unique zone code. Otherwise, you can specify the color you want to associate with each zone code. These colors are used
if the Pathline Color option is set to Starting zone code or Ending zone code.
Capture
zones
GMS groups pathlines together into capture zones. A polygon representing the outer boundary of the pathlines is found and can be
outlined, or filled. The following options are available relating to the capture zones:
•
Delineate by well
With this option, all the pathlines originating from a cell containing a well will be grouped together into one capture zone.
All wells with the same name are included in the same capture zone.
•
Delineate by zone code
With this option, all pathlines originating from the same zone code are grouped together into capture zones. This option
could be used to create a single capture zone for several wells that have different names. The cells containing the wells
would need to be assigned the same zone code. This option could also be used to find the "capture zone" for a zone of cells
where the cells all have the same zone code.
•
Thin triangle ratio
GMS triangulates the pathlines in a capture zone to determine the capture zone boundary. Depending on the length and shape
of the pathlines, it may be necessary to adjust the Thin triangle ratio to get a good looking capture zone. Increasing the value
causes more area around the edges to be included. Decreasing the value causes less area around the edges to be included.
Exporting Pathlines
Exporting Pathlines
MODPATH pathlines can be exported from GMS in a few different ways:
Capture Zones -> Arcs
The MODPATH | Capture Zones -> Arcs command will convert the capture zone outline to feature arcs, creating a
separate coverage for each well. Coverages can be exported as a shapefile or converted to CAD data.
Pathlines -> Arcs
The MODPATH | Pathlines -> Arcs command will convert pathlines to feature arcs, creating a separate coverage for
each well. Coverages can be exported as a shapefile or converted to CAD data.
Starting Locations -> 3D Scatter Points
Starting locations can be converted to 3D scatter points and vice versa. If the MODPATH | Starting Locations -> 3D
Scatter Points menu command is selected, a new 3D scatter point set will be created from each particle set that is
visible. If the command is executed by right-clicking on a particle set in the Project Explorer, a new 3D scatter point
set will be created from only that particle set.
Tab delimited file
Pathlines can be exported by right-clicking on a particle set in the Project Explorer and selecting the Export option.
This saves the pathline geometry to a tab-delimited text file that can be imported directly into Excel:
Spreadsheet report
You can bring up a spreadsheet report showing the pathline XYZ data in GMS. See MODPATH Particle Sets,
Spreadsheet Report.
357
358
6.5. MT3DMS
MT3DMS
MT3DMS is a modular three-dimensional transport model for the simulation of advection, dispersion, and chemical
reactions of dissolved constituents in groundwater systems (Zheng, 1990). MT3DMS uses a modular structure
similar to the structure utilized by MODFLOW. MT3DMS is used in conjunction with MODFLOW in a two step
flow and transport simulation. Heads and cell-by-cell flux terms are computed by MODFLOW during the flow
simulation and are written to a specially formatted file. This file is then read by MT3DMS and utilized as the flow
field for the transport portion of the simulation.
MT3DMS is a newer version of the MT3D model distributed with earlier versions of GMS. MT3DMS differs from
MT3D in that it allows for multi-species transport, supports additional solvers, and allows for cell-by-cell input of all
model parameters.
A complete description of MT3DMS is beyond the scope of this reference manual. It is assumed that the reader has a
basic knowledge of MT3DMS and has read the MT3DMS documentation (Zheng, 1990). Only the details of the
GMS graphical interface to MT3DMS are described herein.
GMS supports MT3DMS as a pre- and post-processor. The input data for MT3DMS is generated by GMS and saved
to a set of files. These files are then read by MT3DMS when MT3DMS is executed. MT3DMS can be launched from
the GMS menu. The output from MT3DMS is then imported to GMS for post-processing.
A special version of MT3DMS is distributed with GMS. Both the source code and executable are included. This
version of MT3DMS has been modified to output GMS data set files.
The RT3D and SEAM3D models are special versions of MT3DMS that have been customized to simulate reactive
transport problems. The interfaces to MT3DMS, RT3D, and SEAM3D are all contained in the MT3D menu.
MT3DMS Links
•
•
•
•
MT3D Packages
Building an MT3DMS Simulation
Saving an MT3DMS Simulation
Importing an MT3D Simulation
MT3D Packages
359
MT3D Packages
MT3DMS is divided into a series of components called "packages." Each package performs a specific task. Some of
the packages are always required for a simulation, and some are optional. The input for each package is contained in
a separate text file. The MT3DMS packages supported in the GMS interface are listed in the following table:
Package Name
Abrev
Name
Decription
Always
Req'd?
Basic Transport
Package
BTN
Handles basic tasks that are required by the entire transport model. Among these tasks are definition of
the problem, specification of the boundary and initial conditions, determination of the step size,
preparation of mass balance information, and printout of the simulation results.
YES
Advection
ADV
Solves the concentration change due to advection with one of the three mixed Eulerian-Langrangian
schemes included in the package: MOC, MMOC, or HMOC
NO
Dispersion
DSP
Solves the concentration change due to dispersion with the explicit finite difference method.
NO
Sink & Source
Mixing
SSM
Solves the concentration change due to fluid sink/source mixing with the explicit finite difference
method. Sink/source terms may include wells, drains, rivers, recharge, and evapotranspiration. The
constant-head boundary and general-head-dependent boundary are also handled as sink/source terms in
the transport model.
NO
Chemical
Reactions
RCT
Solves the concentration change due to chemical reactions. Currently, the chemical reactions include
linear or nonlinear sorption isotherms and first-order irreversible rate reactions (radioactive decay or
biodegradation).
NO
Generalized
Conjugate
Gradient Solver
GCG
This package can be used to implicitly solve the dispersion, source/sink, and reaction terms of the
transport equation.
NO
Transport
Observation
TOB
Outputs concentration at observation points and mass fluxes at groups of source/sink boundary
conditions.
NO
MT3D Source/Sink Mixing Package
MT3D Source/Sink Mixing Package
The Source/Sink Mixing Package dialog is used to assign concentrations to point sources/sinks (wells, river/streams,
specified head, general head) and areal sources/sinks (recharge, evapotranspiration). In most cases, the concentration
is assigned to the incoming water when the sources/sinks are acting in the source mode, i.e., contributing water to the
system. In sink mode, the concentration of the outgoing water is equal to the concentration of groundwater in the
aquifer and the concentrations assigned to the sources/sinks have no effect. The only exception is evapotranspiration.
Even though evapotranspiration always acts in sink mode, a concentration can be specified. Generally, the assigned
concentration is zero which only allows pure water to leave the aquifer.
Source/Sink Mixing Package dialog
Maximum number of Sources/Sinks in Flow Model
MT3DMS needs to know the maximum number of sources/sinks in the flow model. This number is simply the total
number of cells in the MODFLOW model that have a source or sink defined at them. This number is computed
automatically.
Point sources/sinks spreadsheet
Values for the concentration as well as the type of source or sink and the location of each of the point source/sink
cells are displayed and edited in the spreadsheet. Since the concentration data are time dependent, one value is
defined for the concentration at each stress period. Concentration values are displayed in the spreadsheet for the
current stress period only. The current stress period is displayed above the spreadsheet and can be changed. If the
concentration values for a previous stress period are the same as those used for the current stress period, the Use
previous option may be used. When the Use previous option is selected, the fields in the spreadsheet cannot be
edited.
A column is provided for each of the species concentrations. Changing the source/sink type for one stress period at a
cell will automatically change the type for the remainder of the stress periods at the same cell.
Point sources/sinks can be added and removed from the list by selecting the Add and Delete buttons. However,
when adding new point source/sink, it is usually more convenient to select the 3D grid cells and use the MT3D|Point
Sources/Sinks menu command.
Initializing Point Source Sinks from MODFLOW
An option is included in the Source/Sink Mixing Package dialog to initialize the point sources/sinks to be used in the
MT3DMS simulation directly from data that have already been defined in a MODFLOW simulation. If a
MODFLOW simulation is currently in memory, the buttons in the Initialize point sources/sinks from MODFLOW
dialog can be used. Each button is labeled with a different source/sink type, corresponding to the MODFLOW point
sources or sinks. Selecting one of the buttons automatically adds to the list of point sources/sinks. For example, if the
Well button is selected, GMS creates a new well source/sink for each cell where a well is defined in the MODFLOW
simulation currently in memory. The initial concentration of each of the new well sources/sinks is zero. In order to
utilize the source/sink initialization buttons, the following conditions must be met:
1. The MODFLOW package corresponding to the source/sink type to be initialized must have been selected in the
MODFLOW Packages dialog.
2. Point sources or sinks of the type to be initialized must have been defined in MODFLOW.
360
MT3D Source/Sink Mixing Package
Fixing Concentrations for Selected Species
When entering the concentrations for a specified concentration cell, it is sometimes necessary to specify the
concentrations of some of the species but allow the concentrations for the remaining species to vary. This can be
accomplished by specifying a negative concentration for the species that are to vary.
Areal Sources/Sinks
Recharge and evapotranspiration are known as areally distributed sources and sinks. This is because a value for
concentration must be entered for each species for every vertical column of cells in the finite difference grid. This
essentially means that a two dimensional array of concentration values must be defined for each species for both
recharge and evapotranspiration, depending upon which options are utilized. The buttons labeled Recharge and
Evapotranspiration bring up the Areal Source/Sink Array dialog.
Reset
The Reset button deletes all of the data currently defined in the Source/Sink Mixing package and restores the package
parameters to the default values.
Conceptual Model Input
In some cases, the simplest way to define both point and areal sources/sinks is with an MT3DMS conceptual model
in the Map module. Concentrations can be assigned directly to points, arcs, and polygons; points representing point
sources/sinks and polygons representing recharge and evapotranspiration zones. These concentrations are copied
directly to the appropriate cells/arrays in the Source/Sink Mixing package when the conceptual model is converted to
the numerical model with the Feature Objects | Map -> MT3DMS command.
Basic Transport Package Dialog
The first step in setting up an MT3DMS simulation is to define the data for the Basic Transport package. The
information defined in the Basic Transport package includes the computational time intervals (stress periods), an
array defining which cells are inactive and which cells have constant concentration, an array defining aquifer
porosity, and array of starting concentration values. The input data for the Basic Transport package must be entered
before editing any of the other packages in the MT3DMS simulation. The Basic Transport Package dialog contains
the following options:
Headings
A brief description of the model can be entered in the two lines provided at the top of the Basic Transport Package
dialog. This information is printed to the ASCII listing file output by MT3DMS.
Model Selection
The Model section in the middle of the Basic Transport Package dialog is used to select which version of MT3D is
to be used. The menu commands and packages and options that are available depend on which model is selected. All
three model interfaces are contained in the MT3D menu. The RT3D and SEAM3D interfaces are described in
Chapters 18 and 19 respectively.
361
Basic Transport Package Dialog
Stress Periods
As is the case with MODFLOW, the computational time intervals for an MT3DMS simulation are called "stress
periods". Concentrations at boundary conditions or source/sink terms can only change at the beginning of each stress
period. Stress periods are subdivided into time steps and time steps are subdivided into transport steps. The Stress
Periods button on the left of the Basic Transport Package dialog is used to bring up the Stress Period dialog. If a
transient MODFLOW simulation is used, the stress periods and time steps used for MT3DMS are initialized to
coincide exactly with those defined for MODFLOW. If a steady state MODFLOW simulation is used, any set of
stress periods may be utilized for MT3DMS.
The Stress Periods dialog is identical to the MODFLOW Stress Periods dialog except for two fields. In addition to
the stress period definition required by MODFLOW, MT3DMS also requires a transport step size and a maximum
number of transport steps allowed for one time step. These values are defined for each stress period. If a value of
zero is entered for the transport step size (the default), MT3DMS will automatically calculate an appropriate
transport step size. Furthermore, if the value for the transport step size entered by the user is larger than the value
computed by MT3DMS, the MT3DMS value will be used. The transport step size times the Max transport steps
must be longer than the total simulation length.
Output Control
Options for printing and saving the results from an MT3DMS simulation are also included in the Basic Transport
package. The MT3DMS output control options are modified by selecting the Output Control button on the left side
of the Basic Transport Package dialog. This brings up the MT3D Output Control dialog.
One of the output options is an unformatted (binary) concentration file which is used for post-processing by GMS.
This option is selected using the toggle at the bottom of the dialog. With the version of MT3DMS included with
GMS, the concentration file is saved directly from MT3DMS as a GMS binary scalar data set file.
Another option is to Print or save at specified times. When this option is selected, the Times button is undimmed.
Selecting the Times button brings up a spreadsheet that enables users to specify the times that the output will be
printed or saved. The spreadsheet can be quickly initialized by selecting the Initialize Values button at the bottom of
the dialog. This button brings up the Initialize Time Steps dialog. This dialog is composed of edit fields that will
automatically populate the times that MT3D data will be saved or printed.
Packages
The Packages button on the left of the Basic Transport Package dialog brings up the Packages dialog. This dialog is
used to specify which of the packages are to be used in the simulation. The check box to the left of the package name
is selected to signify that a package will be utilized as part of the simulation. Some of the packages are used by
RT3D or SEAM3D and are dimmed for MT3DMS simulations.
Define Species
MT3DMS is a multi-species transport model. It can track the migration and concentration of several species at once.
The Define Species button is used to define the number of species in the simulation and the name and type of each
species. The button brings up the Define Species dialog.
The species are listed in the box on the left side of the dialog. Species are added and deleted using the New and
Delete buttons. The name of a selected species can be edited. The Mobile toggle is used for RT3D and is dimmed
for MT3DMS simulations.
The species names are not used by the MT3DMS code. They are only used in GMS to simplify the model input. In
MT3DMS, all species are identified by an integer ID. The species names are saved to the MT3DMS super file
(*.mts). When building a new simulation, it is sometimes useful to use the same set of names used in a previous
362
Basic Transport Package Dialog
simulation. This can be accomplished by selecting the Import button and selecting the MT3DMS super file used by
the previous simulation. This automatically loads in the species names to the list.
Units
All MT3DMS input parameters must be entered using a consistent set of units. The Units button brings up a dialog
which can be used to specify a standard unit for length, time, mass, force, and concentration. The selected units are
used by GMS to post the appropriate unit labels next to each of the input fields in the MT3DMS interface. These
labels serve as a reminder to the user of the correct units. The units must be consistent with the units used in the
MODFLOW simulation.
CINACT
The CINACT value is written to the MT3DMS solution file wherever an inactive concentration cell exists
(ICBUND=0). This value should be selected so that it will not likely be a valid concentration computed from
MT3DMS. The default value of -999 is generally sufficient.
Use Materials for Porosity and Long. Dispersivity
If this option is selected, the porosities and longitudinal dispersivities specified in the Materials dialog will be used in
the MT3DMS model.
HTOP Equals Top of Layer 1
In some cases it is useful to explicitly define the HTOP array separately from the top elevation array for layer 1
defined in the Global Options package. If the toggle entitled HTOP equals top of layer 1 is turned off, an HTOP
array can be explicitly defined. This option should be used if the top of layer 1 is substantially higher than the
computed water table. In such cases, using the top of layer 1 could lead to significant error (see MT3DMS Reference
Manual).
Another option would be to use the default approach and lower the value of the layer 1 top elevation array. For
unconfined layers, this array is not used by MODFLOW anyway. The only reason to keep the HTOP array separate
from the top elevation array is for visualization. When a MODFLOW solution is displayed in side view, GMS plots
the computed water table on top of the cross section display. Using the top elevation of layer 1 as the ground surface
makes it possible to see exactly where the water table lies in relation to the ground surface and illustrates where cells
are flooded.
HTOP and Thickness Arrays
Part of the input to the Basic Transport package is a set of arrays defining the layer geometry. These arrays include
an HTOP array that defines the top elevations for the top layer and a thickness array for each layer. Since MT3DMS
can only be used in combination with the True Layer approach in MODFLOW, there is no need to input these arrays
in the MT3DMS interface. By default, the HTOP array is assumed to be equal to the top elevation array for layer 1
defined in the Global Options package of MODFLOW. Furthermore, the thickness arrays are automatically
generated by GMS using the top and bottom elevation arrays when the Basic Transport package file is written.
363
Basic Transport Package Dialog
ICBUND
The ICBUND button in the Basic Transport Package dialog is used to enter the values of the ICBUND array.
Porosity
The array defining the porosity of each cell in the model can be defined and edited by selecting the Porosity button
in the Basic Transport Package. This array can also be initialized using a conceptual model in the Map module. It
can also be edited on a cell-by-cell basis using the Cell Properties command.
ICBUND Array
The ICBUND button in the Basic Transport Package dialog is used to enter the values of the ICBUND array. The
MODFLOW Array Editor is used to edit the ICBUND array.
Values
The ICBUND array contains a value for each cell in the grid defining the type of the cell as either constant
concentration, inactive, or variable concentration.
Constant Concentration
A negative ICBUND value indicates that the cell has a constant concentration. The value of the constant
concentration is defined in the starting concentration array described below.
Inactive
An ICBUND value of zero indicates that the cell is inactive.
Variable Concentration
A positive ICBUND value indicates that the cell has a variable concentration (i.e., the concentration will be
computed as part of the simulation).
Initializing the ICBUND Array
The IBOUND array used by MODFLOW is similar (but not identical) to the ICBUND array. When a new MT3DMS
simulation is initialized, the MODFLOW IBOUND array is used to initialize the values of the ICBUND array. Each
cell which is designated as inactive in the IBOUND array is designated as inactive in the ICBUND array. Each cell
which is designated as active (variable head) in the IBOUND array is designated as active (variable concentration) in
the ICBUND array. Each cell that is designated as constant head in the IBOUND array is NOT designated as
constant concentration in the ICBUND array. Rather, constant head cells are designated as active (variable
concentration) in the ICBUND array.
364
ICBUND Array
Cell Attributes Command
In addition to directly editing the ICBUND array, another method for editing the ICBUND array is to select a set of
cells and use the Cell Properties command in the MT3D menu.
Activate Cells in Coverage Command
If the Activate Cells in Coverage command in the Map module is used to change the active/inactive status of the
cells, both the IBOUND and ICBUND arrays are updated accordingly.
Flow vs. Transport Inactive Zones
Since the computational domain of the transport simulation does not necessarily have to match the domain of the
flow simulation, the active/inactive zones of the ICBUND array may differ from the active/inactive zones of the
IBOUND array. In some cases, the active zone for a transport simulation is only a subset of the active zone of the
flow simulation. Care should be taken, however, to ensure that any cells defined as inactive in the flow simulation
are not defined as active in the transport simulation.
IBOUND vs. ICBUND Display
If a cell is designated as inactive, it is hidden when the grid is displayed, unless the Inactive cells option is selected in
the 3D Grid Display Options dialog, in which case the inactive cells are displayed, but in a different color. If neither
MODFLOW nor MT3DMS is in memory, the default 3D grid active/inactive flags are used to control the display of
the grid. If MODFLOW is in memory, the active/inactive status of the cells as defined by the IBOUND array is used
to display the grid. If both MODFLOW and MT3DMS are in memory, the ICBUND array takes precedence and is
used to display the grid.
MT3D Source/Sink Mixing Package
The Source/Sink Mixing Package dialog is used to assign concentrations to point sources/sinks (wells, river/streams,
specified head, general head) and areal sources/sinks (recharge, evapotranspiration). In most cases, the concentration
is assigned to the incoming water when the sources/sinks are acting in the source mode, i.e., contributing water to the
system. In sink mode, the concentration of the outgoing water is equal to the concentration of groundwater in the
aquifer and the concentrations assigned to the sources/sinks have no effect. The only exception is evapotranspiration.
Even though evapotranspiration always acts in sink mode, a concentration can be specified. Generally, the assigned
concentration is zero which only allows pure water to leave the aquifer.
Source/Sink Mixing Package dialog
Maximum number of Sources/Sinks in Flow Model
MT3DMS needs to know the maximum number of sources/sinks in the flow model. This number is simply the total
number of cells in the MODFLOW model that have a source or sink defined at them. This number is computed
automatically.
Point sources/sinks spreadsheet
Values for the concentration as well as the type of source or sink and the location of each of the point source/sink
cells are displayed and edited in the spreadsheet. Since the concentration data are time dependent, one value is
defined for the concentration at each stress period. Concentration values are displayed in the spreadsheet for the
current stress period only. The current stress period is displayed above the spreadsheet and can be changed. If the
365
MT3D Source/Sink Mixing Package
concentration values for a previous stress period are the same as those used for the current stress period, the Use
previous option may be used. When the Use previous option is selected, the fields in the spreadsheet cannot be
edited.
A column is provided for each of the species concentrations. Changing the source/sink type for one stress period at a
cell will automatically change the type for the remainder of the stress periods at the same cell.
Point sources/sinks can be added and removed from the list by selecting the Add and Delete buttons. However,
when adding new point source/sink, it is usually more convenient to select the 3D grid cells and use the MT3D|Point
Sources/Sinks menu command.
Initializing Point Source Sinks from MODFLOW
An option is included in the Source/Sink Mixing Package dialog to initialize the point sources/sinks to be used in the
MT3DMS simulation directly from data that have already been defined in a MODFLOW simulation. If a
MODFLOW simulation is currently in memory, the buttons in the Initialize point sources/sinks from MODFLOW
dialog can be used. Each button is labeled with a different source/sink type, corresponding to the MODFLOW point
sources or sinks. Selecting one of the buttons automatically adds to the list of point sources/sinks. For example, if the
Well button is selected, GMS creates a new well source/sink for each cell where a well is defined in the MODFLOW
simulation currently in memory. The initial concentration of each of the new well sources/sinks is zero. In order to
utilize the source/sink initialization buttons, the following conditions must be met:
1. The MODFLOW package corresponding to the source/sink type to be initialized must have been selected in the
MODFLOW Packages dialog.
2. Point sources or sinks of the type to be initialized must have been defined in MODFLOW.
Fixing Concentrations for Selected Species
When entering the concentrations for a specified concentration cell, it is sometimes necessary to specify the
concentrations of some of the species but allow the concentrations for the remaining species to vary. This can be
accomplished by specifying a negative concentration for the species that are to vary.
Areal Sources/Sinks
Recharge and evapotranspiration are known as areally distributed sources and sinks. This is because a value for
concentration must be entered for each species for every vertical column of cells in the finite difference grid. This
essentially means that a two dimensional array of concentration values must be defined for each species for both
recharge and evapotranspiration, depending upon which options are utilized. The buttons labeled Recharge and
Evapotranspiration bring up the Areal Source/Sink Array dialog.
Reset
The Reset button deletes all of the data currently defined in the Source/Sink Mixing package and restores the package
parameters to the default values.
Conceptual Model Input
In some cases, the simplest way to define both point and areal sources/sinks is with an MT3DMS conceptual model
in the Map module. Concentrations can be assigned directly to points, arcs, and polygons; points representing point
sources/sinks and polygons representing recharge and evapotranspiration zones. These concentrations are copied
directly to the appropriate cells/arrays in the Source/Sink Mixing package when the conceptual model is converted to
the numerical model with the Feature Objects | Map -> MT3DMS command.
366
MT3D point Sources/Sinks BC
MT3D point Sources/Sinks BC
The Source/Sink Mixing Package dialog can be used to edit both point and areal sources/sinks using a spreadsheet. In
many cases, it is more convenient to view and edit source sink concentrations on a cell-by-cell basis. Two commands
are provided to facilitate this type of editing: the Point Sources/Sinks command and the Areal Sources/Sinks
command.
Point Sources/Sinks
The Point Sources/Sinks command is used to assign and edit the concentrations at point sources and sinks. Before
selecting the Point Sources/Sinks command, a set of cells should be selected using the cell selection tools. Once the
command is selected, the MT3DMS Point Source/Sink dialog appears.
A point source/sink concentration for each species is assigned to the selected cells by selecting the toggle
corresponding to the type of source/sink. The concentration at the cells can be specified as either constant or
transient. If a constant value is specified, this number will be used for all stress periods. If the Variable option is
used, clicking on the window brings up the XY Series Editor. The XY Series Editor is used to assign a concentration
value for each stress period.
Multiple Sources/Sinks per Cell
In many cases, multiple point sources/sinks, each having a different type, can be assigned to an individual cell. In
this case, the toggle for each type should be selected and the concentration specified. It is also possible for multiple
sources/sinks of the same type to be assigned to a single cell. However, MT3DMS only allows one concentration to
be assigned to each type for a single cell. In such cases, the specified concentration for that type applies to all
sources/sinks of that type within the cell.
Fixing Concentrations for Selected Species
When entering the concentrations for a specified concentration cell, it is sometimes necessary to specify the
concentrations of some of the species but allow the concentrations for the remaining species to vary. This can be
accomplished by specifying a negative concentration for the species that are to vary.
Areal Sources/Sinks
The Areal Sources/Sinks command is used to edit the concentrations assigned to recharge and evapotranspiration
fluxes. Before selecting the Areal Sources/Sinks command, a set of cells should be selected using the cell selection
tools. The concentration fluxes due to recharge and evapotranspiration are applied to vertical columns rather than to
individual cells. Therefore, to edit the value for a vertical column, any cell in the column can be selected. Once the
Areal Sources/Sinks command is selected, the MT3DMS Areal Sources/Sinks dialog appears.
The areal source/sink concentration values at the selected cells can be edited by highlighting a species and either
selecting a constant value for all stress periods, or by defining a set of values.
367
Building an MT3DMS Simulation
Building an MT3DMS Simulation
Setting up an MT3DMS simulation involves taking a pre-defined MODFLOW simulation and defining some
additional properties such as porosity, assigning concentrations to sources and sinks, and choosing some general
simulation options. MODFLOW automatically generates a head and flow file (*.hff) containing information on
computed heads and fluxes. This file is used as part of the input to the transport model when MT3DMS is launched.
MT3DMS uses the top and bottom grid elevation specified in the Global Options/Basic Package Dialog. When
building or interacting with an MT3DMS simulation, the corresponding MODFLOW model must always be in
memory in GMS. This is due to the fact that MODFLOW and MT3DMS share many of the same data structures
(layer elevation arrays, stress periods, units, etc.).
Two basic approaches are provided in GMS for defining these data: using the 3D Grid module or using the Map
module.
Using the 3D Grid Module
Although it is not always the most efficient approach, an MT3DMS simulation can be completely defined using only
the tools in the 3D Grid module. With this approach, the material properties and concentrations at sources/sinks are
assigned directly to the cells.
Using the Map Module (MT3DMS Conceptual Model)
For sites with complicated boundary conditions and sources/sinks, the preferred method for setting up an MT3DMS
simulation is to use the feature object tools in the Map module to define an MT3DMS conceptual model of a site
being studied.
In order to use the conceptual model approach to build a MT3DMS model, the same conceptual model must be used
for both the MODFLOW flow model and the MT3DMS transport model. This ensures that there is a proper linkage
between the sources/sinks in the conceptual model and the sources/sinks in the grid model.
The conceptual model is a high-level description of the site describing sources/sinks, the boundary of the domain to
be modeled, recharge and evapotranspiration zones, and material zones within each of the layers. In addition to the
parameters required by MODFLOW, many of the parameters required by MT3DMS such as concentrations at
sources/sinks and layer data, including porosity and dispersion coefficients, can be assigned directly to the feature
objects.
The following steps are used in setting up a conceptual model and converting the conceptual model to a numerical
model:
1. Construct a MODFLOW conceptual model, create a grid, and convert the conceptual model data to the
MODFLOW data defined at the grid cells.
2. Run the MODFLOW simulation to save the MT3DMS head and flow file.
3. Return to the Map module. Edit the properties of the Conceptual model to include transport. Assign
concentrations to the sources/sinks in the conceptual model where necessary. Also define polygonal zones
describing layer data including porosity, longitudinal dispersivity, sorption constants, rate constants, and bulk
density.
4. Select the Feature Objects | Map -> MT3DMS command to automatically assign the MT3DMS data to the
appropriate cells in the grid.
368
Saving an MT3DMS Simulation
Saving an MT3DMS Simulation
Once an MT3DMS simulation has been created and checked for potential problems with the Model Checker, the
final step is to save the simulation to disk and run MT3DMS. MT3DMS simulations are saved using the Save and
Save As commands in the File menu.
Selecting the Save command saves the GMS project including the model simulation. By default the model
simulation will be saved to the same location as the GMS project. However, in the Save dialog the path for the model
simulation can be specified to be different from the project file if the "Match model names with project name" toggle
is unchecked. This is done with the Browse buttons next to each model.
An MT3DMS simulation is saved to a set of input files. The MT3DMS super file is a special type of file which is
used to organize the set of files used in a simulation. The names of all of the input and output files associated with a
simulation are saved in the super file. When MT3DMS is launched, the name of the super file is automatically
passed to the MT3DMS executable.
When an MT3DMS simulation is saved, the names of the other MT3DMS input files are automatically patterned
after the name of the super file. For example, if the super file is named sampmod.mts, the other files are named
sampmod.btn, sampmod.ssm, etc.
Importing an MT3D Simulation
It is often necessary to import an MT3DMS simulation that was not generated by GMS. Since GMS uses the
standard MT3DMS file format, this is not a problem in most cases. However, there are a few steps and precautions
that should be taken.
File Formats
GMS uses the standard MT3DMS file formats described in the MT3DMS documentation (Zheng, 1998). The files
you are importing must match these formats exactly. If the files were generated for a version of MT3DMS that uses a
different set of file formats, the files will need to be edited before they can be successfully imported to GMS.
CON File
The source code of MT3DMS was changed to create a *.con file instead of the default *.ucn file. GMS can read
either the *.con or *.ucn file. The *.con file is written in the GMS binary data set format.
Importing Super Files
GMS uses an MT3DMS super file to organize the files used by an MT3DMS simulation. This file is not a standard
MT3DMS file. One approach to importing an externally defined simulation is to create an MT3DMS super file
containing the names of the files used in the simulation using a text editor.
369
MT3DMS Display Options
370
MT3DMS Display Options
The properties of all MT3DMS data that GMS displays on the screen can be controlled through the MT3D tab of the
Display Options dialog. This dialog is opened by right clicking on the
3D Grid Data entry in the Project Explorer
and selecting the Display Options command. It can also be accessed from the from the Display menu, the MT3D
menu, or the
Display Options macro. The following table describes the display options available for the 3D Grid
module.
Display Option
Description
Point Sources/Sinks,
NAPL Point
Sources/Sinks, Constant
concentration
The three items at the top of the dialog represent display options for the constant concentration cells and the point
sources/sinks. If the check box just to the left of one of these is selected, a symbol is displayed at the center of each cell
where that object has been defined. The symbol for each object is displayed in a window to the left of the check box.
The symbol can be changed by clicking on the button. This brings up the Symbol Editor dialog. The Symbol Editor
contains a list of available symbols and can be used to edit the size and color of the symbol.
Display symbol legend
If the Symbol legend option is selected, a legend showing each of the symbols associated with sources/sinks and
constant concentration cells is displayed in the lower right corner of the GMS window.
Check All
By clicking this button, all of the display options are turned on.
Check None
By clicking this button, all of the display options are turned off.
Calculate Mass
The MT3D Calculate Mass dialog allows the calculation of the mass of a contaminant in the entire model domain or
in the selected cells.
Definition
Explains the formula that is used to calculate the mass. Basically, the volume of water in each cell is calculated and
then multiplied by the concentration computed by MT3D. A conversion factor must be supplied so that the
calculated mass will be computed in the correct units.
Concentration Range
Allows the specification a range over which the mass will be calculated. This is most useful to ignore negative
concentrations that result in MT3D simulations.
Conversion Factor
The factor determines which units the resulting mass will be displayed in.
371
6.6. PEST
PEST
PEST is a general purpose parameter estimation utility developed by John Doherty of Watermark Computing. The
PEST interface in GMS can be used to perform automated parameter estimation for MODFLOW. The steps involved
in setting up a PEST run are described in the automated parameter estimation topic.
The PEST options are edited by selecting the Parameter Estimation command in the MODFLOW menu and then
clicking on the PEST tab.
PEST version support
The following table shows the version of PEST supported by different versions of GMS. To see the latest released
version of PEST visit http://www.pesthomepage.org/Downloads.php.
GMS
PEST
GMS 6.5
PEST 10.0
GMS 7.0
PEST 10.0
GMS 7.1
PEST 12.0
GMS 8.0, 8.1, 8.2 PEST 12.1
GMS 8.3
PEST 12.2
372
6.7. RT3D
RT3D
RT3D is a multi-species reactive transport model developed by the Battelle Pacific Northwest National Laboratory.
RT3D is a modified version of MT3DMS that utilizes alternate Chemical Reaction packages. Numerous pre-defined
reactions are available and an option is provided for creating user-defined reactions. RT3D is well-suited for
simulating natural attenuation and bioremediation.
Since RT3D is a modified version of MT3DMS, most of the input to RT3D is identical to the input required for
MT3DMS. Thus, the RT3D interface is contained within the MT3D menu in the 3D Grid module. In the Basic
Transport Package dialog, an option is provided for selecting the current model as either MT3DMS, RT3D, or
SEAM3D. A number of options in the interface then change based on which model is selected.
Since much of the RT3D interface is identical to the MT3DMS Interface, only the portions of the interface which are
unique to RT3D are described in this help file.
Basic Transport Package
The first step in defining an RT3D simulation is to define the data required by the Basic Transport (BTN) package.
The options in the Basic Transport Package dialog unique to RT3D are as follows:
Packages
The Packages button brings up the Packages dialog. If the RT3D model is the current model and the Chemical
Reaction package is selected, one of the RT3D reactions must be selected from the pull-down list. The first nine
reactions are pre-defined reaction types. If one of these reactions is selected, the names of the species and the names
of the reaction parameters are automatically determined by GMS. The last reaction is a user-defined reaction. If this
option is selected, a list of species and list of reaction parameters must be specified by the user.
Define Species
For most of the reaction package options, once the reaction package is selected, the list of species used by the
package is automatically initialized by GMS. However, if the user-defined reaction package is selected, the Define
Species button is undimmed in the Basic Transport Package dialog and a list of species must be manually defined
before any concentrations are assigned to sources/sinks.
Chemical Reactions Package
The Chemical Reactions Package dialog utilized by RT3D is different from the MT3DMS Chemical Reactions
dialog. The items in the dialog unique to RT3D are as follows:
RT3D
Solver
If the selected reaction package is a kinetic reaction, several solvers are available for the solution of the chemical
reaction equations. The desired solver should be selected from the Solver pull-down list. When one of these solvers
is used, an absolute and relative tolerance must be specified for each of the mobile species using the atol and rtol
parameters.
Reaction Parameters
With each reaction package, a set of reaction parameters must be defined. The method used to edit the reaction
parameters depends on whether the reaction is a pre-defined reaction or a user-defined reaction.
Pre-Defined Reactions
For the pre-defined reactions, the number of reaction parameters and the names of the parameters are fixed. If the
Spatially vary all toggle is off, a single value is entered for each parameter using the edit field below the parameter
list. If the Spatially vary all toggle is on, an array of values is entered for each parameter using the Edit button. In
this case, the cell-by-cell parameter values can also be edited using the Cell Attributes command.
User-Defined Reactions
For user-defined reactions, the list of reaction parameters must be defined using the Define Parameters button. This
button brings up the Define Parameters dialog. This dialog functions similarly to the Define Species dialog. The New
and Delete buttons are used to add and remove items from the list. The Import button is used to read a previously
defined list of reaction parameters from an RT3D super file (*.rts).
With the pre-defined reactions, the reaction parameters are either all spatially variable or all constant. However, with
the user-defined reaction option, selected parameters may be designated as spatially variable while others are
designated as constant. The variable/constant status of a parameter is selected using the Spatially variable toggle in
the Define Parameters dialog.
373
Basic Transport Package Dialog
Basic Transport Package Dialog
The first step in setting up an MT3DMS simulation is to define the data for the Basic Transport package. The
information defined in the Basic Transport package includes the computational time intervals (stress periods), an
array defining which cells are inactive and which cells have constant concentration, an array defining aquifer
porosity, and array of starting concentration values. The input data for the Basic Transport package must be entered
before editing any of the other packages in the MT3DMS simulation. The Basic Transport Package dialog contains
the following options:
Headings
A brief description of the model can be entered in the two lines provided at the top of the Basic Transport Package
dialog. This information is printed to the ASCII listing file output by MT3DMS.
Model Selection
The Model section in the middle of the Basic Transport Package dialog is used to select which version of MT3D is
to be used. The menu commands and packages and options that are available depend on which model is selected. All
three model interfaces are contained in the MT3D menu. The RT3D and SEAM3D interfaces are described in
Chapters 18 and 19 respectively.
Stress Periods
As is the case with MODFLOW, the computational time intervals for an MT3DMS simulation are called "stress
periods". Concentrations at boundary conditions or source/sink terms can only change at the beginning of each stress
period. Stress periods are subdivided into time steps and time steps are subdivided into transport steps. The Stress
Periods button on the left of the Basic Transport Package dialog is used to bring up the Stress Period dialog. If a
transient MODFLOW simulation is used, the stress periods and time steps used for MT3DMS are initialized to
coincide exactly with those defined for MODFLOW. If a steady state MODFLOW simulation is used, any set of
stress periods may be utilized for MT3DMS.
The Stress Periods dialog is identical to the MODFLOW Stress Periods dialog except for two fields. In addition to
the stress period definition required by MODFLOW, MT3DMS also requires a transport step size and a maximum
number of transport steps allowed for one time step. These values are defined for each stress period. If a value of
zero is entered for the transport step size (the default), MT3DMS will automatically calculate an appropriate
transport step size. Furthermore, if the value for the transport step size entered by the user is larger than the value
computed by MT3DMS, the MT3DMS value will be used. The transport step size times the Max transport steps
must be longer than the total simulation length.
Output Control
Options for printing and saving the results from an MT3DMS simulation are also included in the Basic Transport
package. The MT3DMS output control options are modified by selecting the Output Control button on the left side
of the Basic Transport Package dialog. This brings up the MT3D Output Control dialog.
One of the output options is an unformatted (binary) concentration file which is used for post-processing by GMS.
This option is selected using the toggle at the bottom of the dialog. With the version of MT3DMS included with
GMS, the concentration file is saved directly from MT3DMS as a GMS binary scalar data set file.
Another option is to Print or save at specified times. When this option is selected, the Times button is undimmed.
Selecting the Times button brings up a spreadsheet that enables users to specify the times that the output will be
printed or saved. The spreadsheet can be quickly initialized by selecting the Initialize Values button at the bottom of
374
Basic Transport Package Dialog
the dialog. This button brings up the Initialize Time Steps dialog. This dialog is composed of edit fields that will
automatically populate the times that MT3D data will be saved or printed.
Packages
The Packages button on the left of the Basic Transport Package dialog brings up the Packages dialog. This dialog is
used to specify which of the packages are to be used in the simulation. The check box to the left of the package name
is selected to signify that a package will be utilized as part of the simulation. Some of the packages are used by
RT3D or SEAM3D and are dimmed for MT3DMS simulations.
Define Species
MT3DMS is a multi-species transport model. It can track the migration and concentration of several species at once.
The Define Species button is used to define the number of species in the simulation and the name and type of each
species. The button brings up the Define Species dialog.
The species are listed in the box on the left side of the dialog. Species are added and deleted using the New and
Delete buttons. The name of a selected species can be edited. The Mobile toggle is used for RT3D and is dimmed
for MT3DMS simulations.
The species names are not used by the MT3DMS code. They are only used in GMS to simplify the model input. In
MT3DMS, all species are identified by an integer ID. The species names are saved to the MT3DMS super file
(*.mts). When building a new simulation, it is sometimes useful to use the same set of names used in a previous
simulation. This can be accomplished by selecting the Import button and selecting the MT3DMS super file used by
the previous simulation. This automatically loads in the species names to the list.
Units
All MT3DMS input parameters must be entered using a consistent set of units. The Units button brings up a dialog
which can be used to specify a standard unit for length, time, mass, force, and concentration. The selected units are
used by GMS to post the appropriate unit labels next to each of the input fields in the MT3DMS interface. These
labels serve as a reminder to the user of the correct units. The units must be consistent with the units used in the
MODFLOW simulation.
CINACT
The CINACT value is written to the MT3DMS solution file wherever an inactive concentration cell exists
(ICBUND=0). This value should be selected so that it will not likely be a valid concentration computed from
MT3DMS. The default value of -999 is generally sufficient.
Use Materials for Porosity and Long. Dispersivity
If this option is selected, the porosities and longitudinal dispersivities specified in the Materials dialog will be used in
the MT3DMS model.
375
Basic Transport Package Dialog
HTOP Equals Top of Layer 1
In some cases it is useful to explicitly define the HTOP array separately from the top elevation array for layer 1
defined in the Global Options package. If the toggle entitled HTOP equals top of layer 1 is turned off, an HTOP
array can be explicitly defined. This option should be used if the top of layer 1 is substantially higher than the
computed water table. In such cases, using the top of layer 1 could lead to significant error (see MT3DMS Reference
Manual).
Another option would be to use the default approach and lower the value of the layer 1 top elevation array. For
unconfined layers, this array is not used by MODFLOW anyway. The only reason to keep the HTOP array separate
from the top elevation array is for visualization. When a MODFLOW solution is displayed in side view, GMS plots
the computed water table on top of the cross section display. Using the top elevation of layer 1 as the ground surface
makes it possible to see exactly where the water table lies in relation to the ground surface and illustrates where cells
are flooded.
HTOP and Thickness Arrays
Part of the input to the Basic Transport package is a set of arrays defining the layer geometry. These arrays include
an HTOP array that defines the top elevations for the top layer and a thickness array for each layer. Since MT3DMS
can only be used in combination with the True Layer approach in MODFLOW, there is no need to input these arrays
in the MT3DMS interface. By default, the HTOP array is assumed to be equal to the top elevation array for layer 1
defined in the Global Options package of MODFLOW. Furthermore, the thickness arrays are automatically
generated by GMS using the top and bottom elevation arrays when the Basic Transport package file is written.
ICBUND
The ICBUND button in the Basic Transport Package dialog is used to enter the values of the ICBUND array.
Porosity
The array defining the porosity of each cell in the model can be defined and edited by selecting the Porosity button
in the Basic Transport Package. This array can also be initialized using a conceptual model in the Map module. It
can also be edited on a cell-by-cell basis using the Cell Properties command.
376
377
6.8. SEAM3D
SEAM3D
SEAM3D is a reactive transport model used to simulate complex biodegradation problems involving multiple
substrates and multiple electron acceptors. It is based on the MT3DMS code. In addition to the regular MT3DMS
modules, SEAM3D includes a Biodegradation package and NAPL Dissolution package. SEAM3D was developed by
Mark Widdowson at Virginia Tech University.
Since SEAM3D is a modified version of MT3DMS, most of the input to SEAM3D is identical to the input required
for MT3DMS. Thus, the SEAM3D interface is contained within the MT3D menu in the 3D Grid module. In the
Basic Transport Package Dialog, an option is provided for selecting the current model as either MT3DMS, RT3D, or
SEAM3D. A number of options in the interface then change based on which model is selected.
378
6.9. SEAWAT
SEAWAT
SEAWAT is a three dimensional variable density groundwater flow and transport model developed by the USGS
based on MODFLOW and MT3DMS. SEAWAT v4 is based on MODFLOW 2000 and MT3DMS 5.2. SEAWAT
includes two additional packages: Variable-Density Flow (VDF) and Viscosity (VSC). A complete description of
SEAWAT is beyond the scope of this reference manual. It is assumed that the reader has a basic knowledge of
SEAWAT and has read the SEAWAT documentation.
GMS supports SEAWAT as a pre- and post-processor. The interface to SEAWAT relies on the interface to
MODFLOW and MT3DMS. The input data for SEAWAT is generated by GMS and saved to a set of files including
a MODFLOW model, an MT3D model if transport is used, and a SEAWAT model pointing to the MODFLOW and
MT3D model's package files. These files are then read by SEAWAT and executed. SEAWAT uses the MODFLOW
and MT3D interfaces for boundary condition display and for post-processing.
SEAWAT Links
•
•
•
•
•
•
Building a SEAWAT Model
SEAWAT:Global Options Dialog
SEAWAT:MODFLOW AUX Variables
SEAWAT:Packages
Importing a SEAWAT Simulation
MODFLOW with HDF5
Building a SEAWAT Model
Building a SEAWAT Model
Grid Approach
Although it is not always the most efficient approach, a SEAWAT simulation can be completely defined using only
the tools in the 3D Grid module. To build a SEAWAT model with this approach you must first create a MODFLOW
model using the grid approach. If using transport, an MT3D model is then created, and then a SEAWAT model is
created. For each of the 3 models the properties and concentrations at sources/sinks assigned directly to the cells.
Any SEAWAT MODFLOW AUX Variables are assigned using the MODFLOW package dialogs. SEAWAT
specific packages can be set using the VDF or VSC package dialogs.
Conceptual Model Approach
To create a SEAWAT using a conceptual model:
1. Construct a MODFLOW conceptual model, create a grid, and convert the conceptual model data to the
MODFLOW data defined at the grid cells.
2. Run the MODFLOW simulation to make sure it is working properly.
3. If the simulation includes transport, return to the Map module. Edit the properties of the Conceptual model to
include transport. Assign concentrations to the sources/sinks in the conceptual model where necessary. Also
define polygonal zones describing layer data including porosity, longitudinal dispersivity, sorption constants, rate
constants, and bulk density.
4. Select the Feature Objects | Map -> MT3DMS command to automatically assign the MT3DMS data to the
appropriate cells in the grid.
5. Enable SEAWAT in the MODEL interfaces dialog and create a SEAWAT simulation.
6. Edit the MODFLOW AUX variables, VDF, and VSC packages if necessary.
7. Use the SEAWAT model checker to check the simulation for any errors or warnings.
379
SEAWAT Global Options Dialog
SEAWAT Global Options Dialog
The Global Options Dialog is used to setup a new SEAWAT model or to edit the current options for an existing
model. To set up a new SEAWAT model select Edit|Model Interfaces... menu and turn on the SEAWAT model
interface. Next select SEAWAT|New menu item to create the SEAWAT model.
In the Global Options dialog, toggles are provided to modify the use of transport in the simulation, to turn on and off
the Variable-Density Flow (VDF) and Viscosity (VSC) packages, and to enable or disable the MODFLOW AUX
variables used by SEAWAT.
SEAWAT MODFLOW AUX Variables
SEAWAT allows using MODFLOW AUX variables for some packages to set values used for MODFLOW packages
the variables include:
• WELDENS - Density of well fluid (WEL package).
• DRNBELEV - Drain bottom elevation (DRN package).
•
•
•
•
•
RBDTHK - River bed thickness (RIV package).
RIVDEN - Density of river fluid (RIV package).
GHBELEV - General head elevation (GHB package).
GHBDENS - Density of general head fluid (GHB package).
CHDDENSOPT and CHDDEN - Constant head fluid density (CHD package).
These AUX variables can be enabled by selecting them in the SEAWAT Global Options Dialog and can be edited in
the associated MODFLOW package dialog or in the MODFLOW Sources/Sinks dialog.
380
SEAWAT Packages
SEAWAT Packages
SEAWAT specific packages include the Variable-Density Flow (VDF) and Viscosity (VSC) packages. The package
dialogs for both packages are available under the SEAWAT menu. For the package menu items to be available, the
packages must first be enabled from the SEAWAT Global Options Dialog. For a detailed description of the VDF and
VSC input options, please refer to the SEAWAT manual available in the side bar.
VDF Package
The VDF package can be used in a SEAWAT simulation to model the affects of concentration on fluid density. The
input values available in the VDF package include:
•
•
•
•
•
•
IWTABLE - Active variable-density water table corrections.
MFNADVFD - Internodal density calculation method.
DENSEMIN - Minimum fluid density.
DENSEMAX - Maximum fluid density.
FIRSTDT - Length of first transport time step.
NSWTCPL - Flow/transport coupling.
• DNSCRIT - Convergence criteria.
• MT3DRHOFLG - type of fluid density calculation.
•
•
•
•
• When equal to zero, the fluid density for each grid cell can be entered in the table at the bottom of the dialog.
For INDENSE enter -1 to use values from previous stress period, 0 to use DENSREF, and 1 to enter values for
DENSE column.
• When equal to -1, the fluid density will be calculated using one or more species entered in the table at the
bottom of the dialog using species ID, DRHODC, and CRHOREF. Rows can be entered into the table with the
tool bar below the table.
• When greater than or equal to 1 density is calculated using the corresponding species number.
DENSREF - Reference fluid density.
DRHODC - Density/conc. slope.
DRHODPRHD - Density/pressure slope.
PRHDREF - Reference pressure head.
VSC Package
The VSC package can be used in a SEAWAT simulation to model the affects of concentration on fluid viscosity.
Using the Viscosity Package requires using the VDF package and the LPF package in MODFLOW. The input values
available in the VSC package include:
• VISCMIN - Minimum viscosity.
• VISCMAX - Maximum viscosity.
• MT3DMUFLG - Type of viscosity calculation.
• When equal to zero, the fluid viscosity for each grid cell can be entered in the table at the bottom of the dialog.
For INVISC enter -1 to use values from previous stress period, 0 to use VISCREF, and 1 to enter values for
VISC column.
• When equal to -1, the fluid density will be calculated using one or more species entered in the table at the
bottom of the dialog using species ID, DMUDC, and CMUREF. Rows can be entered into the table with the
tools bar below the table.
• When greater than or equal to 1 viscosity is calculated using the corresponding species number.
• VISCREF - Reference viscosity.
381
SEAWAT Packages
•
•
•
•
DMUDC - Viscosity/concentration slope.
CMUREF - Reference concentration.
MTMUTEMPSEC - Temp. species ID.
AMUCOEFF - coefficients for equation 18-20 in SEAWAT 4 documentation.
Importing a SEAWAT Simulation
An existing SEAWAT v4 model can be imported into GMS by opening the name file which must have a "*.nam"
extension. Upon opening the name file GMS uses the name file to determine if the simulation is MODFLOW-2000,
MODFLOW-2005, or a SEAWAT simulation based on the packages included. Once the import is complete, if the
model includes transport packages or the VDF or VSC packages then a SEAWAT model is automatically created
inside GMS. If the model only includes MODFLOW packages, then the SEAWAT model needs to be created by
enabling the SEAWAT model interface by selecting SEAWAT in the Model Interfaces dialog available under the
Edit menu, and then selecting New Simulation under the SEAWAT menu.
382
383
6.10. SEEP2D
SEEP2D
SEEP2D is a two-dimensional steady state finite element groundwater model developed by Fred Tracy of the
Engineer Research and Development Center [1]. Both saturated and unsaturated flow is simulated. SEEP2D is
designed to be used on profile models (XZ models) such as cross-sections of earth dams or levees.
A variety of options are provided in GMS for displaying SEEP2D results. Contours of total head (equipotential lines)
and flow vectors can be plotted. An option is also available for computing flow potential values at the nodes. These
values can be used to plot flow lines. Together with the equipotential lines (lines of constant total head), the flow
lines can be used to plot a flow net. The phreatic surface can also be displayed.
A more complete description of the SEEP2D model, including a discussion of boundary conditions and guidelines
for model conceptualization is contained in the SEEP2D Primer. The SEEP2D Primer should be reviewed before
consulting this help file. The user is also encouraged to complete the SEEP2D tutorials.
Portions of a SEEP2D model can be imported from GeoStudio files.
Building a SEEP2D Simulation
For a typical application, the following steps
are used to perform a SEEP2D simulation
using GMS:
1. Generate a 2D mesh - The first step in
setting up a SEEP2D simulation is to
construct a 2D finite element mesh. This
can be accomplished using the Feature
Objects | Map -> 2D Mesh command in
Sample flow net from SEEP2D
the Map module. SEEP2D only supports
meshes composed entirely of linear
elements (three node triangles and four node quadrilaterals). The mesh should not contain quadratic elements (six
node triangles and eight node quadrilaterals).
2. Select the analysis options - The analysis options are used to set up the type of problem being modeled and to
defined constants that are used by SEEP2D when calculating the solution. The items in the dialog are as follows:
• Title - A descriptive title can be entered for the simulation. This title is used in the header of the SEEP2D input
and output files. It can also be displayed at the top of the Graphics Window in GMS by turning on the Title
option in the SEEP2D Display Options dialog.
• Datum - By default, the datum of the model is at zero, but it can be specified to any convenient value, such as
the value corresponding to the base or lowest y coordinate of the model.
• Unit Weight of Water - The unit weight of water must be entered. SEEP2D uses this value to compute pore
pressures. The weight and length units defined in this value should be consistent with the units used elsewhere
in the model.
• Units - The Units button brings up the Units dialog. This dialog is used to enter the units for length, time,
concentration, etc. for the simulation. GMS uses the selected unit options to display the appropriate units next
to each input edit field in the other SEEP2D dialogs.
SEEP2D
• Problem Type - The problem type must be specified either as plane flow or axisymmetric flow. The
axisymmetric option should be selected for models corresponding to flow to a single well as described in the
SEEP2D Primer. All other models should use the plane flow option.
• Flow Lines - If the Compute flow lines option is turned on, once the head solution is computed, SEEP2D will
reverse the boundary conditions and compute flow potential values at the nodes. These values can be
contoured by GMS using the Flow lines option is the SEEP2D Display Options dialog.
• Model Type - The model type should be selected as either Confined or Unconfined. For confined models, the
entire model domain is assumed to be saturated. No exit face boundary conditions should be applied and the
unsaturated zone material properties are not required. For unconfined models, two options are available for
dealing with the unsaturated zone: (1) deforming mesh and (2) saturated/unsaturated flow modeling. For both
types of problems, exit face boundary conditions should be applied along the boundary of the mesh where the
free surface is expected to exit. With the deforming mesh option, SEEP2D iterates to find the location of the
phreatic surface and the mesh is deformed or truncated so that the upper boundary of the mesh matches the
phreatic surface. The solution files from this type of simulation include a geometry file containing the
deformed mesh. With the saturated/unsaturated option, the mesh is not modified and the flow in both the
saturated and unsaturated zone is modeled. The hydraulic conductivity in the unsaturated zone is modified
(reduced) using either the linear frontal method or the Van Genuchten method. The equations used by both
methods are described in more detail in the SEEP2D Primer.
3. Assign the material properties - Each element in the 2D mesh is assigned a material ID. The material properties
are assigned to each element using these IDs and a list of material properties. The material properties specific to
SEEP2D are entered using the Material Properties command in the SEEP2D menu. This command brings up the
SEEP2D Material Properties dialog. The items in the dialog are as follows:
4.
5.
6.
7.
• List of Materials - The currently defined materials are listed at the top of the dialog. The values for a material
are entered by selecting the material and editing the values in the lower part of the dialog.
• Soil Coefficients - The hydraulic conductivity in the two major principal directions and the angle from the
x-axis to the major principal axis are entered in the Soil Coefficients section. These hydraulic conductivity
values represent the hydraulic conductivity for saturated conditions.
• Van Genuchten Parameters - If the Van Genuchten Saturated/Unsaturated option has been selected in the
SEEP2D Analysis Options dialog, the Van Genuchten alpha and n-value numbers must be defined.
• Linear Front Parameters - If the Saturated/Unsaturated with Linear Front option has been selected in the
SEEP2D Analysis Options dialog, the minimum pressure head (ho) and minimum relative conductivity (kro)
values must be defined.
Assign the boundary conditions (either with a conceptual model or with the 2D mesh tools) - Two general types
of boundary conditions can be defined for SEEP2D simulations: nodal boundary conditions and flux boundary
conditions. (See SEEP2D Boundary Conditions)
Run the Model Checker.
Save the simulation
Run the simulation
8. Display the results - Before reading in the solution file for post-processing in GMS, it is often useful to examine
the text output listing file. The output file can also be viewed by simply double-clicking on the *.out file found in
the SEEP2D solution folder in the Project Explorer. Also, any text file can be viewed by selecting the Edit File
command in the File menu. The File Browser appears and the selected file is opened in a text editor. Once the
solution is imported to GMS, a variety of options are available for displaying the solution. The total head and
pressure head data sets can be contoured. Velocity vectors corresponding to Darcy velocity can be plotted. If the
Compute flow lines option was selected, a complete flow net may be plotted by displaying contours of total head
(equipotential lines) and turning on the Flow lines option in the SEEP2D Display Options dialog.
384
SEEP2D
SEEP2D Boundary Conditions
Two general types of boundary conditions can be defined for SEEP2D simulations: nodal boundary conditions and
flux boundary conditions. The type or value assigned to a previously defined boundary condition can be edited by
selecting the node or node string and selecting either the Node BC or Flux BC commands. A boundary condition can
be deleted by selecting the boundary condition using either the Select Node or Select Node String tools and selecting
the Delete BC command in the SEEP2D menu.
Nodal Boundary Conditions
The most common type of SEEP2D boundary conditions is nodal boundary conditions. Nodal boundary conditions
are assigned by selecting the nodes and selecting the Node BC command in the SEEP2D menu. When selecting the
nodes, either the Select Node tool or the Select Node String tool may be used. The Node BC command brings up the
Node BC dialog. Three types of nodal boundary conditions can be assigned: head, exit face, and flow rate.
• Head BC - Specified head boundary
conditions represent boundaries where
the head is known. They typically are
found where water is ponding or at the
boundary of a region where the water
table is known to remain constant. Since
the head along such boundaries cannot
Sample SEEP2D Problem Showing Boundary Conditions
change, they represent regions of the
model where flow enters or exits the
system (flow lines are always orthogonal to constant head boundaries).
• Exit Face BC - Exit face boundary conditions imply that the head is equal to the elevation (assuming that the
datum is 0). They are used when modeling unconfined flow problems and should be placed along the face where
the free surface is likely to exit the model. This boundary condition must be used if the option for deforming the
mesh to the phreatic surface has been selected in the analysis options. It may also be used with a
saturated/unsaturated flow model. In this case, if the head at a node on the boundary becomes greater than the
node elevation during the iteration process, the head at the node is fixed at the nodal elevation and the node acts
as a specified head boundary. Thus, water is allowed to exit the boundary above the tailwater. If an exit face
boundary is not used with a saturated/unsaturated flow model, all of the flow will be forced through the tailwater.
• Flow Rate BC - Flow rate boundary conditions are used to specify nodes at which a certain flow rate is known to
exist. They are used primarily when modeling wells and the flow specified represents the pumping rate. Negative
values represent extraction of fluid from the system whereas positive values represent injection.
Flux Boundary Conditions
Flux boundary conditions are used to specify a known flux rate [L/T] along a sequence of element edges on the
perimeter of the mesh. They are often used to simulate infiltration. Flux into the system is positive and flux out of the
system is negative.
Flux BC are assigned by selecting a sequence of nodes along the mesh boundary using the Select Node String tool
and selecting the Flux BC command in the 'SEEP2D menu. This command brings up a simple prompt for the flow
rate.
385
SEEP2D
386
Reading the SEEP2D Solution
Once the simulation is completed, the solution is automatically imported to GMS for post-processing. The solution
files are organized in a SEEP2D solution folder in the Project Explorer. If the unconfined/deforming mesh option is
selected, the solution will consist of two files: a geometry file that contains the deformed mesh and a solution file
that contains the head, velocity, and flow potential data sets. If any of the other analysis options is selected, only the
solution file is saved. Regardless of which option is used, the solution can be quickly imported to GMS using the
Read Solution command in the SEEP2D menu. The solution data sets are organized into a SEEP2D solution folder
in the Data Tree.
SEEP2D Files
See the main page about SEEP2D files at SEEP2D Files.
References
[1] http:/ / www. erdc. usace. army. mil/
SEEP2D Display Options
The properties of all SEEP2D data that GMS displays on the screen can be controlled through the SEEP2D tab of the
Display Options dialog. This dialog is opened by right clicking on the
2D Mesh Data entry in the Project
Explorer, selecting the Display Options command, and then selecting the SEEP2D tab. This tab is only visible when
there is a SEEP2D simulation. It can also be accessed from the from the Display menu, the SEEP2D menu, or the
Display Options macro. The following table describes the display options available for the SEEP model.
Display
Option
Description
Head BC The Head BC, Exit face BC, Flux rate BC, and Flux BC items can be used to turn on the display of a symbol for each of the boundary
condition types. The color and type of symbol can be edited by clicking on the button to the left of each item.
Exit face
BC
Flow rate
BC
Flux BC
BC
values
If the BC values option is selected, the numerical value of each boundary condition (head, flux rate, etc.) is displayed next to the
boundary condition. The font used to display the values can be editing by clicking on the button to the left of the item.
Flow
lines
If the Compute flow lines option is selected the SEEP2D Analysis Options dialog prior to saving and running the model, SEEP2D
performs the computations in two steps. In the first step, SEEP2D solves for the heads. In the second step, the head solution is used to
"reverse" the boundary conditions and a second solution is found. This solution represents "flow potential" values. When the solution is
read back into GMS, these flow values can be contoured to generate a plot of flow lines. When superimposed on contours of total head
(equipotential lines) a complete flow net can be displayed. (see Note)
Title
If the Title option is selected, the problem title specified in the Analysis Options dialog will be displayed at the top of the Graphics
Window.
Total
flow rate
If the Total flow rate option is selected and if a solution is in memory, the total flow rate through the model will be displayed at the top
of the Graphics Window, just below the title.
Phreatic
surface
If the Phreatic Surface option is selected and if a solution is in memory, the phreatic surface will be displayed on the mesh. The color
and type of line can be edited by clicking on the button to the left of the item.
Check
All
By clicking this button, all of the display options are turned on.
SEEP2D Display Options
Check
None
By clicking this button, all of the display options are turned off.
Note: When contouring the flow values, GMS must determine a contour interval that will result in the proper number
of flow channels. The number of flow channels is computed by solving for numflow in the following equation:
The kequiv value is solved for using the k values for the base material specified using the combo box just below the
Flow Lines option. The equivalent k is computed as follows:
For problems with several material zones where each material is isotropic, the flow net cells in the base material
will appear to be square, while the cells in the other material zones will be stretched. The amount of stretching is a
function of the relative difference in k values between the material and the base material.
SEEP2D Solution
After a SEEP2D simulation is run in GMS, the solution to this simulation can be automatically loaded into GMS.
The solution will appear in the Project Explorer under the 2D Mesh Data folder in its own subfolder. The subfolder
will appear with a lock image on it. The image means that the information in the solution folder is locked and cannot
be edited from within GMS. The solution datasets in the solution can be contoured and viewed in GMS. The
potential datasets that may be part of a SEEP2D solution are listed below. A description of each also follows.
Total Head
the pressure head plus the elevation head (same as the head measured by a piezometer).
Pressure
Head
the water pressure divided by the unit weight of water.
Pore
Pressure
the hydrostatic pressure.
Flowrate
the flow rate of water into (out of) the problem domain.
Velocity
the discharge velocity is calculated by multiplying the gradient by hydraulic conductivity [k*i]. This is a vector data set and is
accompanied by a scalar data set called velocity_Mag that is the magnitude of the vector data set.
Gradient
the hydraulic gradient is calculated by dividing the difference in Total Head by distance [(h1-h2)/L]. This is a vector data set and is
accompanied by a scalar data set called gradient_Mag that is the magnitude of the vector data set.
Flowline
this data set is used to create a flow net when the Total Head data set is the active data set.
• All data set values are calculated at every node in the mesh.
387
388
6.11. T-PROGS
T-PROGS
GMS includes an interface to the T-PROGS software developed by Steven Carle. The T-PROGS software is used to
perform transition probability geostatistics on borehole data. The output of the T-PROGS software is a set of N
material sets on a 3D grid. Each of the material sets is conditioned to the borehole data and the materials proportions
and transitions between the boreholes follows the trends observed in the borehole data. These material sets can be
used for stochastic simulations with MODFLOW. A sample material set generated by the TPROGS software is
shown below. The T-PROGS software can also be used to generate multiple input data sets for the HUF package.
T-PROGS Interface
MODFLOW solution for a T-PROGS grid. Black lines are
head contours and blue lines are pathlines for an extraction
well.
Observed transition probabilities (circles)
and Markov chain model (solid lines) for a
set of borehole data with four materials.
The T-PROGS software utilizes a transition probability-based geostatistical approach to model spatial variability by
3-D Markov Chains, set up indicator co-kriging equations, and formulate the objective function for simulated
annealing. The transition probability approach has several advantages over traditional indicator kriging methods.
First, the transition probability approach considers asymmetric juxtapositional tendencies, such as fining-upwards
sequences. Second, the transition probability approach has a conceptual framework for incorporating geologic
interpretations into the development of cross-correlated spatial variability. Furthermore, the transition probability
approach does not exclusively rely on empirical curve fitting to develop the indicator (cross-) variogram model. This
is advantageous because geologic data are typically only adequate to develop a model of spatial variability in the
vertical direction. The transition probability approach provides a conceptual framework to geologic insight into a
simple and compact mathematical model, the Markov chain. This is accomplished by linking fundamental
observable attributes – mean lengths, material proportions, anisotropy, and juxtapositioning – with Markov chain
model parameters.
The first step in using T-PROGS is to import a set of borehole data. The borehole data are then passed to a utility
within T-PROGS called GAMEAS that computes a set of transition probability curves as a function of lag distance
T-PROGS
for each category for a given sampling interval. A sample set of measured transition probability curves are shown by
the dashed lines in the following figure.
Each curve represents the transition probability from material j to material k. The transition probability tjk(h) is
defined by:
[1]
where x is a spatial location, h is the lag (separation vector), and j,k denote materials. Note that the curves on the
diagonal represent auto-transition probabilities, and the curves on the off-diagonal represent cross-transition
probabilities.
The next step in the analysis is to develop a Markov Chain model for the vertical direction that fits the observed
vertical transition probability data. The Markov Chain curves are shown as solid lines in the preceeding figure.
Mathematically, a Markov chain model applied to one-dimensional categorical data in a direction Φ assumes a
matrix exponential form:
[2]
where h denotes a lag in the direction Φ, and RΦ denotes a transition rate matrix
with entries rjk,f representing the rate of change from category j to category k (conditional to the presence of j) per
unit length in the direction Φ. The transition rates are adjusted to ensure a good fit between the Markov Chain model
and the observed transition probability data.
Once the Markov chain is developed for the z direction from the borehole data, a model of spatial variability must be
developed for the x and y directions. Borehole data are typically not sufficiently dense in these directions. However,
the x and y-direction Markov chains can be developed by assuming that the juxtapositional tendencies and the
proportions observed in the vertical direction also hold true in the horizontal directions. The modeler then provides
an estimate of the ratio of the mean lengths in the x and y directions relative to the z direction, and the transition rate
matrices for the x and y directions can be formulated. The x, y, and z Markov chains are converted into a continuous
3D Markov chain using the MCMOD utility within T-PROGS.
In the final phase of setting up a transition probability analysis using T-PROGS, the modeler creates a grid, specifies
the number of model instances (N), and launches the TSIM utility. The TSIM code uses the 3D Markov chain to
formulate both indicator cokriging equations and an objective function for simulated annealing. It generates
stochastic simulations using a combination of modified versions of the GSLIB codes SISIM and ANNEAL.
389
T-PROGS
390
T-PROGS OPTIONS
T-PROGS Options dialog with and without borehole data.
Without boreholes
With boreholes
When a user selects the New Simulation command to initialize a T-PROGS simulation, the T-PROGS Options
dialog appears. If boreholes do not exist in the model, an unconditioned simulation will be generated. In this case,
the user selects the materials to be used and a corresponding background material. The Materials Editor button
enables users to quickly create, delete, or rename materials and the material list is automatically regenerated. The
upper part of the dialog lists the materials in the boreholes. The first column of toggles indicates which materials are
to be used in the analysis. By default, all materials associated with the boreholes are selected. These toggles are
necessary since it is possible that there may be materials defined in the materials list that are not associated with
boreholes. The second column in the top section of the dialog lists the background material. By default, the material
type that had the predominant occurrence in the boreholes (greatest proportion) is marked as the background
material. When defining the transition probability data in the next section, the input parameters do not need to be
edited for the background material. The parameters for this material are automatically adjusted to balance the
equations.
Background Material
Application of the transition probability approach involves the designation of a background material. The
probabilistic constraints of the Markov chains make it unnecessary to quantify data for one category. Not only is it
unnecessary, but it is futile to do so because values will be overwritten in order to satisfy constraints. Conceptually,
the background material can be described as the material that “fills” in the remaining areas not occupied by other
units. For example, in a fluvial depositional system, a floodplain unit would tend to occupy area not filled with
higher-energy depositional units and would therefore be a logical choice for the background material.
T-PROGS
391
Azimuth
Azimuths for T-PROGS and 3D Grid.
3D Grid
T-Progs
The user also enters an azimuth in this dialog. The azimuth determines the orientation of the primary directions of
the depositional trends in the strike/dip directions. These trends generally are aligned with the primary directions of
horizontal flow in the aquifer. Theoretically, the azimuth can be oriented independently from the grid orientation.
However, in practice, if the grid and azimuth orientations are offset by more than about 40o, checkerboard patterns
appear in the indicator array results. Hence, the azimuth orientation is set equal to the grid orientation by default.
However, the grid angle is defined counterclockwise, and the azimuth angle is clockwise. Therefore, if the grid angle
is 40o, then the azimuth angle will be –40o by default. If there is anisotropy in the xy plane, the azimuth angle should
be set to the principle direction of the anisotropy. If anisotropy is not present, this angle should be coincident with
the x-axis (the rows or j-direction) of the grid.
Material Limit
One limitation for both the cases with and without boreholes is that a maximum of five materials can be used in the
T-PROGS algorithm. This limitation was imposed to keep the data processing and user-interface reasonably simple.
Although five materials present a limitation, borehole data can generally be easily condensed down to five or fewer
materials. Furthermore since this is a stochastic approach, which is based on probability, the detail generated with
numerous materials is rarely justifiable anyway. In addition, as the number of materials increase, the ratio of process
time to detail becomes inefficient.
Generating Material Sets with T-PROGS
The underlying equations solved by the T-PROGS software require an orthogonal grid with constant cell dimensions
(X, Y, and Z). The delta X values can be different from the delta Y and delta Z values, and the delta Y values can be
different from the delta Z values, but all cells must have the same change in X, Y, and Z dimensions. The
MODFLOW model is capable of using the Layer Property Flow (LPF) Package with the Material ID option for
assigning aquifer properties. With this option, each cell in the grid is assigned a material id and the aquifer properties
(Kh, Kv, etc.) associated with each material are automatically assigned to the layer data arrays for the LPF package
when the MODFLOW files are saved. The T-PROGS software generates multiple material sets (arrays of material
ids), each of which represents a different realization of the aquifer heterogeneity. When running a MODFLOW
simulation in stochastic mode, GMS automatically loads each of the N material sets generated by the T-PROGS
software and saves N different sets of MODFLOW input files. The N solutions resulting from these simulations can
T-PROGS
be read into GMS and used to perform risk analyses such as probabilistic capture zone delineation.
One-Layer MODFLOW Grids
Although MODFLOW is a three-dimensional
model, a majority of the MODFLOW models
constructed by typical users are 2D models
consisting of one model layer. There are several
reasons why 2D models are so common. One
reason is that many of these models are regional
models where the aquifer thickness is very small
compared to the lateral extent of the model. As a
result, the flow directions are primarily horizontal
and little improvement is gained by adding
multiple layers to the model. Even with local
scale models, the aquifer thickness is often small
enough that one-layer models are considered
adequate. 2D models are also attractive due to the
simplicity of the model increased computational
efficiency. One of the problems associated with
Sample material set generated by the T-PROGS software. Blue lines
using multiple layers for MODFLOW models
represent particle path lines and black lines are head contours.
with unconfined aquifers is that as the water table
fluctuates, the upper cells may go dry. These cells
will not rewet even if the water table subsequently rises, unless the rewetting option has been selected in the flow
package (BCF, LPF, or HUF). The rewetting issues can often be avoided with a one-layer model.
When developing a one-layer model, the modeler must determine how to distribute the hydraulic conductivity values
within the layer. One option is to assume a homogenous aquifer; this is typically a gross over-simplification since
aquifers are usually highly heterogeneous. Therefore, a common approach is to delineate zones of hydraulic
conductivity by examining the subsurface stratigraphic data. In many cases, these data are in the form of borehole
logs. These borehole logs often exhibit substantial heterogeneity and don’t always exhibit definitive trends between
adjacent boreholes. Furthermore, the boreholes are often clustered with large regions of the model lacking any
borehole data. The modeler then faces a difficult task of trying to determine a rational approach to delineating
two-dimensional zones of hydraulic conductivity based on complex 3D borehole data.
As part of this research, we developed a technique for developing 2D zones of hydraulic conductivity from borehole
logs using transition probability geostatistics. The technique is simple, fast, and preserves proportions and trends
exhibited by the borehole data. The algorithm parses through each borehole and computes a predominant material at
each borehole. When T-PROGS runs, the predominant material for each borehole is assigned to its corresponding
location in the one-layer grid, and during the quenching process, simulations are conditioned to those data points.
Generating HUF Data with T-PROGS
Using transition probability geostatistics with MODFLOW models results in two basic limitations. First, the
underlying stochastic algorithms used by the T-PROGS software are formulated such that the MODFLOW grid must
have uniform row, column, and layer widths. The row width can be different from the column width, but each row
must have the same width. This results in a uniform orthogonal grid. While MODFLOW grids are orthogonal in x
and y, the layer thickness is allowed to vary on a cell-by-cell basis. This makes it possible for the layer boundaries to
accurately model the ground surface and the tops and bottoms of aquifer units. If a purely orthogonal grid is used,
irregular internal and external layer boundaries must be simulated in a stair-step fashion either by varying material
392
T-PROGS
properties or by activating/inactivating cells via the IBOUND array. A second limitation is that in order to get a high
level of detail in the simulated heterogeneity, the grid cell dimensions are generally kept quite small. This can result
in difficulties in the vertical dimension. The large number of layers with small layer thicknesses near the top of the
model generally ensures that many of the cells in this region will be at or above the computed water table elevation
(for simulations involving unconfined aquifers). As a result, these cells will undergo many of the numerical
instabilities and increased computational effort issues associated with cell wetting and drying.
The Hydrogeologic Unit Flow (HUF)
package released with MODFLOW 2000
makes it possible to overcome both of these
limitations resulting in a powerful
mechanism for incorporating transition
probability geostatistics in MODFLOW
simulations. With the HUF package, the
modeler is allowed to input the vertical
Sample HUF stratigraphy data generated by the T-PROGS software. Blue lines
component of the stratigraphy in a
represent particle path lines and water table.
grid-independent fashion. The stratigraphy
data are defined using a set of elevation and
thickness arrays. The first array defines the top elevation of the model. The remaining arrays define the thicknesses
of a series of hydrogeologic units, starting at the top and progressing to the bottom of the model. For each array of
thicknesses, many of the entries in the array may be zero. This makes it possible to simulate complex heterogeneity,
including pinchouts and embedded lenses that would be difficult to simulate with the LPF and BCF packages.
The T-PROGS interface in GMS includes an option for integrating transition probability geostatistics results with the
HUF package. The basic approach used by the option is to overlay a dense background grid on the MODFLOW grid
and run T-PROGS on the background grid. A set of HUF arrays is then extracted from the background grid for use
with the MODFLOW model. To use this option, user should first create a MODFLOW grid with the desired number
of layers and the layer elevations should be interpolated to match the aquifer boundaries. The row and column widths
are uniform but the layer thicknesses may vary from cell to cell. Then, when TSIM is launched, the HUF option
should be selected. GMS then generates a background grid that encompasses the MODFLOW grid. The rows and
columns of this grid match the MODFLOW grid but the layer thicknesses are uniform and relatively thin, resulting
in a much greater number of layers than the MODFLOW grid. The user specifies the number of layers in this
background grid. A T-PROGS simulation is then performed to get a set of material sets on the background grid. Each
of the material sets in the T-PROGS output is then transferred from the background grid to a set of HUF
elevation/thickness arrays. The HUF top elevation array is set equal to the top of the MODFLOW grid. The
thickness arrays are then found by searching through the background grid to find the bottom elevations of contiguous
groups of indicators. The elevations from these groups are then added to an appropriate elevation array in the HUF
input. The resulting set of HUF input arrays are listed in GMS Project Explorer. By clicking on each item in the
Project Explorer, the selected set of HUF arrays are loaded into the HUF package and the corresponding stratigraphy
is displayed in the GMS window. The multiple HUF input arrays can be used to perform a stochastic simulation.
Notes
[1] Carle, Steven F. (1999), T-PROGS: Transition Probability Geostatistical Software. Version 2.1 (http:/ / gmsdocs. aquaveo. com/ t-progs.
pdf), Davis, California, p. 6,
[2] Carle, Steven F. (1999), T-PROGS: Transition Probability Geostatistical Software. Version 2.1 (http:/ / gmsdocs. aquaveo. com/ t-progs.
pdf), Davis, California, p. 26,
393
Vertical Markov Chain
Vertical Markov Chain
A dialog assists the user in defining the vertical Markov chains. This dialog is composed of three main sections:
• Plot section
• Markov Chains section
• Spreadsheet section
All three sections enable the user to develop a 1-D Markov chain in the vertical direction.
Plot section
The plot section includes the array of
curves, the Lag spacing edit field, the
Compute button, and the Max lag
distance for plots edit field. The
number of plots in the array produced
correlates to the number of materials
used in the simulation. If N materials
are used, an N by N array of plots will
illustrate the transition probabilities for
each material with respect to every
other material. Every plot is labeled
with a name and units and can be
maximized with a command in the
menu produced by right-clicking on
Vertical Markov chain dialog.
the curve in question. The curves are
automatically regenerated anytime a change is made in the other sections of the dialog.
Each of the plots contains two curves
depicting the transition probability.
The dashed line represents the
transition probability measured from
the borehole data by the GAMEAS
utility. In general, this curve represents
the transition probability from material
j to material k. The transition
probability tjk(h) is defined by:
[1]
where x is a spatial location, h is the
Transition probability plot.
lag (separation vector), and j,k denote
materials. The lag is defined by the
Lag spacing item in the upper left corner of the Vertical (Z) Markov Chains dialog. The curve shown with the solid
line is called a “Markov Chain”. The Markov Chains are used to formulate the equations used by T-PROGS to
generate the multiple material sets during the simulation stage. The objective of this stage of the analysis is to fit the
Markov Chain curves as accurately as possible to the measured transition probability curves. This process is similar
to fitting a model variogram to an experimental variogram in a kriging exercise. The transition rates are adjusted to
394
Vertical Markov Chain
ensure a good fit between the Markov Chain model and the observed transition probability data.
It should be noted that the self-transitional curves on the diagonal start at a probability of 1.0 and decrease with
distance and the off-diagonal curves start at zero probability and increase with distance. In both cases, the curves
eventually flatten out at some distance. The probability corresponding to the flat part of the curve represents the
mean proportion of the material. All curves on a particular column should flatten out to the same proportion. The
proportions are displayed in the lower left corner of the dialog. The point where a tangent line from the early part of
the curves on the diagonal intersects the horizontal (lag distance) axis on each curve represents the mean lens length
for the material. The mean lens lengths are shown just to the right of the mean proportions in the lower left part of
the dialog. The slope at the beginning of each of the Markov Chains represents the transition rate. Together, the
proportions, lens lengths, and transition rates define the Markov Chains.
Several methods are provided for fitting the Markov Chains to the measured transition probability curves. These
methods are listed in the section of the dialog titled Markov Chains. By default, GMS automatically makes an
attempt to fit the curves using the Edit maximum entropy factors option. In many cases, this fit is sufficiently
accurate and we can proceed to the next step. However, it is often useful to explore the other options for fitting the
curves.
If boreholes exist in the model, the Compute... button becomes undimmed. When the user clicks the Compute...
button, the parameter files required for running GAMEAS are generated and GAMEAS is executed.
GAMEAS
GAMEAS is an algorithm that
processes
borehole
data
and
determines geologic characteristics
such as material proportions and
transition probability curves in a given
direction. A separate window displays
the details of the GAMEAS run, which
allows the user to monitor the output
from the GAMEAS simulation.
When
GAMEAS
completes
a
successful run, the results, including
the material proportions and transition
probability curves from the measured
data, are read into the corresponding
data fields in the Vertical Markov
Chain dialog. Furthermore, the
transition rates which correspond to the
GAMEAS executable inside GMS interface.
slope of the transition probability
curves when the lag equals 0 are interpolated from the measured data curves. In addition to running GAMEAS, the
code parses through the borehole data and calculates the embedded transition probabilities and frequencies. These
values are stored in arrays that correspond to options #2 and #3 in the Markov Chains section of the dialog.
395
Vertical Markov Chain
Lag
The Lag spacing determines how dense the curves are, and the Max lag distance for plots determines the range of the
curves. The curves always range from 0 to the Max lag distance for plots horizontally, and they range from 0 to 1
vertically to honor probability constraints.
Markov chains section
There are five alternate methods of generating Markov chains in this section (area in the Vertical Markov Chain
dialog). These methods are in a radio-button configuration to allow the user to conveniently change from one method
to another. Each of these five methods will be described.
•
•
•
•
•
•
Edit the transition rates
Edit embedded transition probabilities
Edit embedded transition frequencies
Edit maximum entropy factors
Fit curves to a discrete lag
Edit the transition rates
Edit the transition rates
With this option one can directly edit the array of transition rates that are listed in the Transition Rates section. This
option is useful after selecting the Compute button and running GAMEAS because slopes can be inferred from the
measured data curves. GAMEAS outputs transition probability curves. Transition rates used in this option
correspond to the slope of the transition probability curve at a lag = 0. When reading the output from GAMEAS, the
transition probability rates are interpolated as
where r1, r2, and r3 are the slopes defined by a straight line from the origin out to lag1, lag2, and lag3 respectively.
As the lag approaches zero, more weight should be given to the corresponding slope. Hence, a weight of 0.57, 0.29,
and 0.14 were assigned to r1, r2, and r3 respectively. Once the slopes are computed for each entry in the matrix, the
mean lengths for each category are computed by
Regardless of which Markov Chain option is selected, the background row and column, Sand_w/_fines, is dimmed
because the values in this row and column are automatically computed from the remaining entries by probability
constraints of the background material. In addition, with this option selected, the Lens Length column is also
dimmed because the lens lengths are automatically computed and updated from the diagonal terms in the Transition
Rates spreadsheet. The diagonal terms of the Transition Rates spreadsheet must be negative to obey probability
rules. With this data, this method produces an accurate fit between the measured (green) and the Markov chain (blue)
curves at small lag spaces.
Edit the embedded transition probabilities
This is a more intuitive method of generating Markov chains and is conducive to sites with and without data. It is
conducive to sites with data because the embedded transition probabilities can be determined from the borehole data.
When a simulation is initialized, if borehole data exist default embedded transition probabilities are computed from
the borehole data. If borehole data do not exist, the embedded transition probabilities can be estimated with some
basic geologic knowledge including the average mean lengths of each material for each direction and depositional
trends.
396
Vertical Markov Chain
With this option selected, the diagonal terms are dimmed because these values are derived from the values entered in
the Lens Length column. Adjusting the proportions, lens lengths, or the off-diagonal terms in the Transition Rates
spreadsheet alters the curves.
With this option, the spreadsheet in the lower right of the dialog represents the probability that the row material will
transition to the column material moving vertically upwards in the +Z direction.
Edit the embedded transition frequencies
This option is similar to option #2, except embedded transition frequencies populate the off-diagonal terms of the
Transition Rates spreadsheet. Embedded transition frequencies are also computed from borehole data when a
simulation is initialized if borehole data exist. Once again, this is an intuitive framework with geologic knowledge
including average mean lengths and depositional trends.
Edit maximum entropy factors
While this option can be used with borehole data, it is ideally suited for cases without borehole data. With this
option, the user edits the proportions for all but the background material and the mean lens lengths for all materials.
The lens lengths are used to populate the diagonal terms of the Transition Rates spreadsheet, and the maximum
entropy factors fill the off-diagonal terms of the spreadsheet. The maximum entropy factors represent the ratio of the
transition rate to the maximum entropy transition rate. A maximum entropy factor of 1.0 represents maximum
disorder in depositional tendencies. A rate greater than 1.0 indicates that the two categories tend to occur next to
each other. A factor less than unity would infer the opposite. This is an intuitive method of generating Markov chains
and is conducive to all types of sites. This method enables logical incorporation of anisotropy into the model with the
maximum entropy factors.
Fit curves to a discrete lag
This option is only undimmed if a transition probability curve from measured data exists in memory. When this
option is selected, the Lag # edit field is undimmed and the user enters the discrete lag the curves will be fit to.
This option produces Markov chains that are computed from the measured transition rates produced by GAMEAS.
GAMEAS computes a set of transition probabilities at each lag specified by the user. This option computes an array
of transition rates from the slope of the curves generated by GAMEAS (green). The transition rates correlate to the
shape of the curve from the origin to the lag # specified by the user in the Lag # edit field. Therefore, the cells of all
the spreadsheets in the dialog are dimmed because the values are inherited from the measured curves (green). The
values in the spreadsheets change depending on the lag # entered. By adjusting the lag interval, an excellent fit can
often be obtained.
397
Vertical Markov Chain
398
Spreadsheet section
This section includes two separate spreadsheets: Transition Rates and Proportions & Mean Lengths spreadsheets.
The Transition Rates spreadsheet contains the rate entries that correspond to the selected option in the Markov
Chains section. The Proportions column holds the proportions for each material. The Mean Lengths column contains
the average mean length in the vertical direction for each material. The data in these spreadsheets define the Markov
chains.
Notes
[1] Carle, Steven F. (1999), T-PROGS: Transition Probability Geostatistical Software. Version 2.1 (http:/ / gmsdocs. aquaveo. com/ t-progs.
pdf), Davis, California, p. 6,
Strike Dip Markov Chain
Once the vertical Markov chains have been defined, the user is then presented with the Strike (X) Markov Chains
dialog. This dialog has the same general setup as the vertical dialog.
Strike (X) Markov Chains
There are three minor differences
between this dialog and the vertical
dialog. The first difference is in the
Markov Chains section. The option,
Lens width ratios, replaces the Fit
curves to a discrete lag option. The Fit
curves to a discrete lag option is not
applicable
because
horizontal
measured transition probability curves
do not exist due to lack of data in the
horizontal direction. The Lens width
ratios option is the default option and
should be used in most cases. This
option allows users to apply the
transition data entered in the vertical
direction to the horizontal direction.
The proportion data are directly
inherited from the vertical data.
Strike/Dip Markov chain dialog.
The second change is in the Spreadsheet Section. Rather than entering the mean lengths, the user enters a ratio
corresponding to the ratio of the lens length in the x direction to the lens length in the z direction. For example, if the
lens length for material A is 5 feet in the z direction and the user enters 10.0 for the ratio, then the lens length in the x
direction would be 50 feet. The Lens Width Ratios option is particularly useful because the only required input is
lens length ratios for the non-background materials. The remaining data are all inherited from the vertical data. The
third change is in the Plot Section. Due to the lack of measured data in the horizontal direction, each plot contains
only one curve: the Markov chain curve.
Strike Dip Markov Chain
Vertical->Lateral Data Conversion
Typical site stratigraphic data is conducive to developing vertical spatial variability. However, rarely is the quantity
of data adequate to develop an accurate model in the lateral directions. The combination of Walther’s Law and the
transition probability approach allows for a logical method of developing lateral spatial variability from vertical
spatial variability. Walther’s Law states that vertical successions of deposited facies represent the lateral succession
of environments of deposition. Therefore, a logical method of generating a 3-D model of spatial variability would be
first to develop a 1-D Markov chain in the vertical direction based on site data, assuming there is such data. Second,
using Walther’s Law and geologic knowledge, one can develop lateral, strike and dip, Markov chains of spatial
variability. However, one issue that arises when applying vertical transition trends to lateral directions is how to cope
with asymmetric vertical trends like fining upwards. For example, if in the vertical direction, sand tends to deposit on
gravel as would be typical in a fluvial deposition, there will be a transition rate associated with the transition of
"sand->gravel" and "gravel->sand". The transition of "gravel->sand" will be greater than "sand->gravel" because of
the fining upward trend. However, in the lateral direction, which of these transition rates should be applied?
Although the trend of sand next to gravel remains in the lateral direction, the transition rates of "sand->gravel" and
"gravel->sand" should be equivalent or symmetric as defined by
The strategy for averaging the vertical transition rates to come up with the lateral rates is given in the three steps
below.
1. Compute the lower-half rate (R-ls) that will satisfy symmetry with the upper-half rate (R-u) for the vertical data
using the symmetry relation.
2. Set the lower-half rate for the lateral direction (R'-l) equal to (R-l + R-ls)/2
3. Compute the upper-half rate for the lateral direction (R'-u) that will satisfy symmetry with the new lower-half rate
(R'-l) using the symmetry relation.
In addition to the averaging technique applied to the off-diagonal terms of the lateral transition rates, an adjustment
was made to the diagonal terms of the rate matrix. It will be remembered that the diagonal terms correlate to the
average mean lengths by
Generally, in depositional patterns, lateral mean lengths are larger than their counterparts. Therefore, the lateral mean
lengths generally need to be increased by a factor F prescribed by the user. This factor F is equal to the ratio of the
lateral mean lengths/vertical mean lengths. If the mean length for category K increases by a factor F, the
corresponding transition rate will decrease by that same factor F. And the row sum for category K must therefore
decrease by the factor F.
Dip (Y) Markov Chains
The dip dialog has an identical appearance and functionality as the strike dialog.
399
TSIM
400
TSIM
When a T-PROGS simulation has been created, TSIM can be run to generate either material sets on a 3D grid or
HUF data for MODFLOW. TSIM is run via the TPROGS|Run TSIM menu command. This brings up the TSIM
Wizard.
Step 1
You can choose to run TSIM now from GMS or save the input files so you can run TSIM later. If you don't run
TSIM from GMS, no material sets or HUF arrays will be created.
Step 2
Running TSIM from GMS
Option
Description
Number of realizations
The number of material sets or HUF sets that will be generated.
Seed
The random number seed used by TSIM. This is generated by GMS but can be changed by the user. Running TSIM with
the same inputs and see will result in identical outputs.
Max. # of quenching
iterations
A TSIM parameter. "No more than five quenching iterations are usually necessary - too many iterations may produce
[1]
unrealistic artifacts."
Quenching tolerance
A TSIM parameter. "The tolerance limit sets a criteria for terminating quenching based on the value of the objective
function as normalized relative to its initial value."
TSIM Output
You can choose to generate material sets or, if a MODFLOW model exists which uses the HUF package, HUF arrays.
Create material
probability data sets
This will cause data sets to get created, one per material, where the data set values equal the probability that that material
occurs in the given cell.
Background Grid
The dimensions and number of grid ranks of the background grid are determined from the 3D grid in the project. If
generating HUF arrays you can specify the number of grid layers in the vertical (Z) direction.
Target grid layers
Starting at GMS version 8.0 you can target a subset of grid layers. The resulting material sets will have inactive values
outside of the targeted area. You can specify the min and max layers or the named layer ranges you wish to target.
Saving files to run TSIM later
The option in Step 2 if saving the TSIM files for later use are similar to those for running TSIM in GMS. You must
specify a file and where it is to be saved. Also, the dimensions and number of ranks of the background grid must be
specified. Finally, no material sets or HUF arrays will be generated.
Notes
[1] Carle, Steven F. (1999), T-PROGS: Transition Probability Geostatistical Software. Version 2.1 (http:/ / gmsdocs. aquaveo. com/ t-progs.
pdf), Davis, California, p. 6,
401
6.12. UTEXAS
UTEXAS
UTEXAS is a slope stability software package created by Dr. Stephen G. Wright of the University of Texas at
Austin. UTEXAS is used to analyze slope stability using the limit equilibrium method. The user provides the
geometry and shear strength parameters for the slope in question and UTEXAS4 computes a factor of safety against
slope failure. The factor of safety for a candidate failure surface is computed as the forces driving failure along the
surface divided by the shear resistance of the soils along the surface. UTEXAS4 is a state-of-the-art slope stability
code and has been widely used in industry for many years.
GMS versions 6.5 and later include an interface to UTEXAS which allows users to create UTEXAS input files using
GMS.
Creating a Model
Existing UTEXAS models can be imported into GMS, or new models can be created from scratch. The UTEXAS
interface is entirely within the map module. The model consists of a conceptual model and one or more coverages.
• Importing
To import an existing UTEXAS model, use the standard File|Open command. The file to import is the
UTEXAS input file. This file may have a '*.dat' extension which is (unfortunately) the extension UTEXAS
expects. GMS creates the UTEXAS conceptual model and coverages from the file being imported.
Aspects of UTEXAS models can also be imported from a GeoStudio file.
• Creating in GMS
Creating a UTEXAS model in GMS can be done a variety of ways. The UTEXAS tutorials illustrate these
methods.
• Type in the feature point coordinates, then connect the points with arcs
• Create feature arcs with the mouse
• Convert a CAD drawing to feature objects
Profile Lines vs. Arcs and Polygons
Profile lines depicting a dam. Gaps show where lines begin and end (no gaps would exist in an
actual model).
UTEXAS
402
Polygons depicting a dam
Profile Lines
UTEXAS uses "profile lines" to define the soil stratigraphy. A profile line is a series of connected points that must
go from left to right (or bottom to top) and represent the top of a soil layer. The profile line does not close on itself,
and does not cross any other profile lines.
Polygons
GMS does not use profile lines, but instead uses arcs and polygons to define the soil stratigraphy. Using polygons is
much easier than using profile lines because there is no need to worry about how to break up the lines such that they
all go from left to right (or bottom to top).
When GMS saves the UTEXAS input file, it automatically figures out the profile lines that UTEXAS needs to
represent the soil stratigraphy. When importing a UTEXAS file, GMS automatically builds arcs and polygons from
the profile lines.
One notable difference between the profile line and polygon approaches is that when using polygons, the
bottom-most polygon must be extended downward some distance below the bottom-most profile line to represent the
bottom-most soil area.
Material Properties
UTEXAS soil material properties are entered in GMS using GMS materials. Each feature polygon has a material
associated with it.
Pore Water Pressure
There are various ways to define pore water pressure. Two of the methods are more advanced: the piezometric line
method, and the interpolated pressure method.
Piezometric Line
UTEXAS allows the pore water pressure to be specified using a piezometric line. In GMS, a piezometric line is an
arc that is in it's own feature coverage (since the arc will likely overlap arcs in the profile line coverage). The
material that uses the piezometric line can specify the coverage the piezometric line (arc) is in.
UTEXAS
403
Interpolated Pressure
Another method for specifying the pore water pressure is "Pressure Interpolated" which uses a set of points where
each point has a value representing the pore pressure at that point. In GMS, you can do this by associating a data set
from a 2D mesh with the material. The data set might come from a SEEP2D solution, since SEEP2D is a model in
GMS that can solve for pore pressures.
Integration with SEEP2D
SEEP2D is a 2D seepage analysis model that, when combined with UTEXAS, provides a complete and a powerful
2D profile analysis solution. Since these two models are closely related, the conceptual model type for UTEXAS is
called "SEEP2D/UTEXAS". One could use the same conceptual model to create both a SEEP2D model and a
UTEXAS model. The UTEXAS tutorials illustrate this.
Running UTEXAS
UTEXAS differs from most models supported by GMS in the way that it is run. Most model
codes supported by GMS can be run from inside GMS. Since UTEXAS is a Windows
application with no command line options (yet), this is not possible.
UTEXAS model icon
as it appears in the
Project Explorer
Also, GMS typically provides a model wrapper for most of the supported models as a
convenient way to watch the progress of the model and automatically read in the results upon
completion. Again, since UTEXAS is a Windows application, it is not possible to use a model wrapper.
To run UTEXAS:
•
•
•
•
•
Export the model from GMS
Launch UTEXAS (outside of GMS)
Open the exported file in UTEXAS
Wait for UTEXAS to finish
Read the solution into GMS
Exporting the Model
To save a UTEXAS model that is in GMS in preparation for running UTEXAS, right-click on the UTEXAS model
icon under the conceptual model and select the Export command. Note that GMS uses the extension '*.utx' instead of
'*.dat' when saving the UTEXAS input file.
Reading the Solution
To read the solution generated by UTEXAS into GMS, right-click on the UTEXAS model icon under the conceptual
model and select the Read Solution command. The UTEXAS solution will have an extension of '*.out'.
UTEXAS
404
Display Options
A number of display options are associated with UTEXAS. To find these, select the Display Options button, click
on the Map Data item from the list, and select the UTEXAS tab on the right.
UTEXAS Display Options
Option
Description
Distributed loads Arcs that are designated as distributed loads. Arrows are drawn at the spacing and scale specified to show the loading.
Head
Arcs designated as Head arcs have the space above them filled with the specified color.
Starting circle
The starting circle specified in the UTEXAS Analysis Options dialog.
Factor of safety
If a solution exists, the factor of safety.
Critical surface
If a solution exists, the critical surface.
Limiting depth
The limiting depth specified in the UTEXAS Analysis Options dialog.
Tangent line
The horizontal tangent line specified in the UTEXAS Analysis Options dialog.
Unsupported Features
Not all of the features of UTEXAS are currently supported in the GMS interface. Support for more features will be
added in future versions of GMS. The following features are not supported.
Command Words
•
•
•
•
•
•
•
LABel
NO compute
OTHer units
SIUnits /or/ SI
UT3
UT4
'***'
UTEXAS
405
Group B, Profile Lines
• Table 6.2, Group B - Profile Line Data Input Format - Import Mode
Group C, Material Properties
• Table 7.1, Group C - Material Property Data Input Format
• Line 4
• Reference (R)
• Anisotropic shear (A)
• Interpolate Strengths (I S) (version 7.0 and earlier. Supported starting at GMS version 7.1)
• Line 6
• Interpolate Ru values (I R)
Group D, Piezometric Line
• Table 8.1, Group D - Piezometric Line Data Input Format
• Line 2
• Field 2, Unit weight of water
Group E, Interpolation Data
• Table 9.1 - GMS will export this table but cannot import it
• Table 9.2 - GMS won't import or export this table
Group G, Distributed Loads
• Table 11.1, Group G - Distributed Load Data Input Format for Individual Points
• Line 2
• Field 4, Shear stress
Group K, Analysis/Computation
• Table 14.2a
• Line 3
• Field 1, "T" (or "TANGENT") (version 7.0 and earlier. Supported starting at GMS version 7.1)
• Table 14.2c, "Fixed" Grid
• Line 3
• Field 1, "T" (or "TANGENT") (version 7.0 and earlier. Supported starting at GMS version 7.1)
• Table 14.2d, "Fixed" Grid
• Not supported in version 7.0 and earlier. Supported starting at GMS version 7.1. Also, although multiple
criteria can be used to specify the radius, GMS only supports using one.
• Table 14.3, Summary of Sub-Command Words for Group K Data
• 1 (Same as "SIN" which GMS does support)
• 2 (Same as "TWO" which GMS does support)
• 3 (Same as "THR" which GMS does support)
• ARC (Arc length)
• BAS (Base length)
UTEXAS
•
•
•
•
•
•
•
•
•
•
•
•
•
•
•
•
•
406
CHA (Change)
CRI (Critical shear surface)
FAC (Factor of Safety)
FOR (Force imbalance)
INC (Increments for subdivision)
ITE (Iteration)
MIN (Minimum weight)
MOM (Moment imbalance)
PAS (Passes)
RES (Restrictions)
SAV (Save "n" most)
SEI (Seismic coefficient) (version 7.0 and earlier. Supported starting at GMS version 7.1)
SID (Side force inclination)
SOR (Sort radii)
STO (Stop)
SUB (Subtended angle)
TRI (Trial)
• UNI (Unit weight of water)
• UNS (Unsort)
•
•
•
•
•
%206.5/models/UTEXAS4%20Manual.pdf UTEXAS4 Manual [1]
%206.5/models/UTEXAS4%20Addendum.pdf UTEXAS4 Addendum [1]
Dr. Stephen G. Wright [2]
UTEXAS article on Wikipedia [3]
Jun 1987 CETN-III-34 Checking Stability of Bulkheads Located in Ports, Harbors and Coastal Waterways
Against Shear Failure Computer Program: UTEXAS2 [4]
References
[1]
[2]
[3]
[4]
ftp:/ / pubftp. ems-i. com/ download/ GMS/ GMS
http:/ / www. ce. utexas. edu/ prof/ wright/ home. html
http:/ / en. wikipedia. org/ wiki/ UTEXAS
http:/ / chl. erdc. usace. army. mil/ library/ publications/ chetn/ pdf/ cetn-iii-34. pdf
UTEXAS Display Options
407
UTEXAS Display Options
The properties of all UTEXAS properties that GMS displays on the screen can be controlled through the UTEXAS
tab of the Display Options dialog. This dialog is opened by right clicking on the
Map Data entry in the Project
Explorer, selecting the Display Options command, and then selecting the UTEXAS tab. This tab is only visible when
there is a UTEXAS simulation. It can also be accessed from the from the Display menu or the
Display Options
macro. The following table describes the display options available for the UTEXAS model.
Display
Option
Description
Distributed
loads
Controls the display of arrows representing distributed loads placed on an embankment or dam. The line color can be adjusted by
clicking on the button to the right of the toggle. If the Auto X spacing is toggled on, the arrows will automatically be distributed
along the length of the distributed load. However, the user can specify the X spacing by turning off and the Auto X spacing toggle
and specifying an X spacing the edit field. This value represents a real world value. The Auto Y scale controls the length of the arrow
tails representing the distributed load. If the Auto Y spacing toggle is turned off, the arrow tails will be drawn using the Y scale
specified in the edit field.
Head
Controls the display of the head fill color. The head will be displayed as filled polygon representing the amount of head that is acting
on an embankment. This color can be adjusted by clicking on the button to the right of the toggle.
Starting
circle
Controls the display of the line representing the starting circle to be used by UTEXAS in performing the slope stability analysis. The
line type, line width, and line color can be changed by clicking the on button to the right of the toggle.
Factor of
safety
Controls the display of the factor of safety computed by the UTEXAS simulation. The font type, font size, and font color can be
adjusted by clicking the on button to the right of the toggle.
Critical
surface
Controls the display of the line representing the critical surface determined by the UTEXAS simulation. The line type, line width, and
line color can be adjusted by clicking the on button to the right of the toggle.
Limiting
depth
Controls the display of the line representing the limiting depth to be used in the UTEXAS simulation. The line type, line width, and
line color can be changed by clicking the on button to the right of the toggle.
408
6.13. WASH123D
WASH123D Display Options
The properties of all WASH123D boundary conditions that GMS displays on the screen can be controlled through
the WASH123D tab of the Display Options dialog. This dialog is opened by right clicking on the
3D Mesh Data
entry in the Project Explorer, selecting the Display Options command, and then selecting the WASH123D tab. This
tab is only visible when there is a FEMWATER simulation. It can also be accessed from the from the Display menu
or the
Display Options macro. The following table describes the display options available for the WASH123D
model.
Display Option
Description
Well
Controls the display of well flow boundary conditions. The symbol, symbol size, and symbol color can be adjusted using the
button to the left of the display toggle.
Well (super
pump node)
Controls the display of well super pump nodes flow boundary conditions. The fill color can be adjusted using the button to the
left of the display toggle. The radius of the well can also be adjusted in the edit field below the Well (super pump node) toggle.
Head
Controls the display of head flow boundary conditions. The symbol, symbol size, and symbol color can be adjusted using the
button to the left of the display toggle.
Equivalent head
Controls the display of equivalent head flow boundary conditions. The symbol, symbol size, and symbol color can be adjusted
using the button to the left of the display toggle.
Spec. flux
Controls the display of specified flux flow boundary conditions. The symbol, symbol size, and symbol color can be adjusted
using the button to the left of the display toggle.
Variable flux
Controls the display of variable flux flow boundary conditions. The symbol, symbol size, and symbol color can be adjusted using
the button to the left of the display toggle.
Enforced total
head
Controls the display of enforced total head flow boundary conditions. The symbol, symbol size, and symbol color can be
adjusted using the button to the left of the display toggle.
Init. enforced
total head
Controls the display of initial enforced total head flow boundary conditions. The symbol, symbol size, and symbol color can be
adjusted using the button to the left of the display toggle.
Discharge
x-sect.
Controls the display of discharge cross section flow boundary conditions. The symbol, symbol size, and symbol color can be
adjusted using the button to the left of the display toggle.
Flux
Controls the display of flux boundary conditions. The symbol, symbol size, and symbol color can be adjusted using the button to
the left of the display toggle.
Well conc.
Controls the display of well concentration transport boundary conditions. The symbol, symbol size, and symbol color can be
adjusted using the button to the left of the display toggle.
Spec. conc.
Controls the display of specified concentration transport boundary conditions. The symbol, symbol size, and symbol color can be
adjusted using the button to the left of the display toggle.
Spec. mass flux
Controls the display of specified mass flux transport boundary conditions. The symbol, symbol size, and symbol color can be
adjusted using the button to the left of the display toggle.
Variable conc.
Controls the display of variable concentration transport boundary conditions. The symbol, symbol size, and symbol color can be
adjusted using the button to the left of the display toggle.
BC values
Controls the display of boundary condition values. The font, font size, and font color can be adjusted using the button to the left
of the display toggle.
Display symbol
legend
Controls the display of a legend containing the symbols for the boundary conditions used in the FEMWATER simulation.
WASH123D Display Options
Check All
By clicking this button, all of the display options are turned on.
Check None
By clicking this button, all of the display options are turned off.
409
410
7. Modeling
411
7.1. Calibration
Model Calibration
Calibration is the process of modifying the input parameters to a groundwater model until the output from the model
matches an observed set of data. GMS includes a suite of tools to assist in the process of calibrating a groundwater
model. Both point and flux observations are supported. When a computed solution is imported to GMS, the point and
flux residual errors are plotted on a set of calibration targets and a variety of plots can be generated showing overall
calibration statistics. Most of the calibration tools can be used with any of the models in GMS. Automated Parameter
Estimation is supported for MODFLOW models via PEST.
Two types of observations can be defined in GMS: point observations and flow observations. Both types of
observations are defined in the map module and are associated with points, arcs, and polygons. Point observations
represent locations in the field where some value has been observed. In most cases, the points will correspond to
observation wells and the value will be the elevation of the groundwater table (the head). Flow observations
represent linear or areal objects such as streams and reservoirs where the gain or loss between the aquifer and the
object has been measured or estimated. Both point and flow observations can be assigned a confidence interval or
calibration target. While point observations can be used with any model, flow observations can only be used with
MODFLOW.
Once a set of observed point and flow values has been entered, each time a model solution is imported, GMS
automatically interpolates the computed solution to the observation points. For some models (MODFLOW) the
model outputs the computed values at the observation points. Also, MODFLOW outputs the computed flow for the
flow observations. A calibration target representing the magnitude of the residual error is displayed next to each
observation point and each flow object as shown below. The size of the target is based on the confidence interval or
the standard deviation. In addition to the calibration targets next to the observation points, you can choose to display
any of a number of statistical plots.
Model Calibration
412
Calibration Targets and Plots of Calibration Statistics.
Automated Parameter Estimation
One of the tools provided in GMS for model calibration is automated parameter estimation. With automated
parameter estimation, an external utility, sometimes called an "inverse model", is used to iteratively adjust a set of
parameters and repeatedly launch the model until the computed output matches field-observed values. Parameter
estimation is used in conjunction with the point observations and the flow observations.
Automated parameter estimation is supported in GMS for the MODFLOW simulations using PEST a general
purpose parameter estimation utility developed by John Doherty of Watermark Computing.
Inverse models should only be used carefully and with a full understanding of the assumptions, equations, and
methods involved. It is suggested that the user read the available documentation on the inverse model being used.
Only the steps involved in setting up an inverse model are described in this document.
Basic Steps
The basic steps involved in using an inverse model for parameter estimation are follows:
1. Create a Working MODFLOW Model
The first step is to create your MODFLOW model and run a simulation. Before launching the inverse model, you
need to have a MODFLOW model that successfully converges and you need to determine a good set of starting
values for your parameters. Once you have a solution it is also a good idea to copy the computed heads from your
solution to your starting heads array. This ensures that as the inverse model modifies the parameters and runs
MODFLOW repeatedly, it is more likely that MODFLOW will quickly converge each time it is launched.
Automated Parameter Estimation
2. Enter the Observations
Once you have a working MODFLOW model, you should enter your head and flux observations. Head observations
are entered as points using an observation coverage in the Map module. Flow observations are assigned directly to
arcs and polygons in source/sink coverages. Each of the observations is assigned a weight that is saved to the inverse
input files.
3. Turn on the Inverse Model
You must select an inverse model. Bring up the Global Options dialog and select either the Parameter Estimation or
Stochastic Inverse Model button depending on whether a stochastic simulation is being run.
4. Parameterize the model
The next step is to parameterize your model. See the Parameters page for more details.
5. Create a Parameter List
The next step is to create the parameter list. See the Parameters page for details.
6. Set parameter estimation options
Once the parameter list is set up, you may wish to edit the general Parameter Estimation options. These options
include the output control and convergence criteria.
7. Edit the Group Weight Multipliers
The group weight multipliers can be edited to adjust the relative weight of the head and flux observations.
8. Edit the Convergence Options
Edit the MODFLOW Convergence Options if necessary in order to ensure a stable solution.
9. Save and Run MODFLOW Model
Once all of the inverse model options have been set, the next step is to save the MODFLOW model using the
Save/Save As command in the File menu. Next, run MODFLOW and the inverse model will run with MODFLOW.
The inverse model will then be launched in a separate window or the model wrapper in which you will see
information relating to the MODFLOW runs and the status of the objective function. Depending on the problem, the
inverse model may take anywhere from several minutes to several hours (or days) to run to completion. When the
inverse process is completed successfully, GMS automatically launches a MODFLOW forward run with the optimal
values computed by the inverse model. Thus, the solution will reflect the optimal values computed by the inverse
model.
413
Automated Parameter Estimation
10. Viewing the Optimal values
When the inverse model is finished, it writes out a text file containing the set of parameter values corresponding to
the minimum calibration error. These values can be viewed with the Import Optimal Values button. This copies the
optimal parameter values to the Starting Value field in the Parameter List.
Sensitivity Analysis
At each PEST iteration, PEST computes the sensitivities of each of the parameters. This information is available in
the "model.sen" file (where model is the name of the MODFLOW model). PEST records the composite sensitivity
and the relative composite sensitivity of each parameter in this file. This information is useful in determining which
parameters have the greatest effect on the model as well as which parameters have the least effect on the model.
Thus, the "insensitive" parameters can be removed or held constant in a subsequent PEST run.
For a more detailed description of parameter sensitivity see section 5.3.2 of the PEST manual.
Parameter Estimation Dialog
Options affecting parameter estimation can be changed via the Parameter Estimation Dialog.
Parameter Estimation Dialog
The Parameter Estimation dialog allows the editing of inverse modeling options that are specific to PEST. This
dialog is available when Parameter Estimation is chosen as the Run option in the Global Options\Basic Package
dialog.
Max number of iterations (NOPTMAX)
This value (NOPTMAX) sets the maximum number of optimisation iterations that PEST is permitted to undertake
on a particular parameter estimation run. If you want to ensure that PEST termination is triggered by other criteria,
more indicative of parameter convergence to an optimal set or of the futility of further processing, you should set this
variable very high. A value of 20 to 30 is often appropriate.
If NOPTMAX is set to 0, PEST will not calculate the Jacobian matrix. Instead it will terminate execution after just
one model run. This setting can thus be used when you wish to calculate the objective function corresponding to a
particular parameter set and/or to inspect observation residuals corresponding to that parameter set.
If NOPTMAX is set to –1, PEST will terminate execution immediately after it has calculated the Jacobian matrix for
the first time. The parameter covariance, correlation coefficient and eigenvector matrices will be written to the run
record file, and parameter sensitivities will be written to the sensitivity file; these are based on the initial parameter
set supplied in the PEST control file.
414
Parameter Estimation Dialog
Max number of iterations with no improvement (NPHINORED)
If PEST has failed to lower the objective function over NPHINORED successive iteration it will terminate
execution. A value of 3 or 4 is often suitable for this variable.
Advanced Options
Max number of relative convergence iterations (NPHISTP); Relative convergence limit
(PHIREDSTP)
If, in the course of the parameter estimation process, there have been NPHISTP optimisation iterations for which
(Φi - Φmin )/Φi ≤ PHIREDSTP (4.6)
(Φi being the objective function value at the end of the i’th optimisation iteration and Φmin being the lowest
objective function achieved to date), PEST will consider that the optimisation process is at an end.
For many cases 4 and 0.01 are suitable values for NPHISTP and PHIREDSTP respectively. However you must be
careful not to set NPHISTP too low if the optimal values for some parameters are near or at their upper or lower
bounds. In this case it is possible that the magnitude of the parameter upgrade vector may be curtailed over one or a
number of optimisation iterations to ensure that no parameter value overshoots its bound. The result may be smaller
reductions in the objective function than would otherwise occur.
Max number of relative parameter change iterations (NRELPAR); Relative parameter
change criterion (RELPARSTP)
If the magnitude of the maximum relative parameter change between optimisation iterations is less than the Relative
Parameter Change Criterion (RELPARSTP) over Max # of Relative Parameter Change Iterations (NRELPAR)
successive iterations, PEST will cease execution.
All adjustable parameters, whether they are relative-limited or factor-limited, are involved in the calculation of the
maximum relative parameter change. RELPARSTP is a real variable for which a value of 0.01 is often suitable.
NRELPAR is an integer variable; a value of 2 or 3 is normally satisfactory.
Max relative parameter change per iteration This (RELPARMAX) is the maximum relative change that a parameter
is allowed to undergo between optimisation iterations.
Max factor parameter change per iteration (FACPARMAX)
This value is the maximum factor change that a parameter is allowed to undergo during an iteration.
Run-time matrix options
Select these options if you want these arrays written to external files. These arrays will also be written to the PEST
output file (*.rec).
Measurement obj func upper limit (PHIMLIM)
This is the upper limit of the measurement objective function (i.e., the upper level of model-to-measurement misfit)
that is tolerable when trying to minimise the regularisation objective function Φr.
415
Parameter Estimation Dialog
Measurement obj func accept. level (PHIMACCEPT)
This is the acceptable level for the measurement objective function that PEST uses to change its method of
calculating the Marquardt Lamdas (see PEST documentation).
Normally PHIMACCEPT should be about 5% to 10% greater than PHIMLIM. However if PEST is performing well,
you may wish to make it closer to PHIMLIM than this. In choosing the best parameter set at any stage of the
optimisation process (for recording in the parameter value file) PEST looks at all parameter sets for which it has
carried out model runs up to that point in the process. If any of these runs have resulted in an objective function less
than PHIMACCEPT, it then searches from among these runs for the parameter set which gave rise to the lowest
regularisation objective function. If PHIMACCEPT is set too close to PHIMLIM, PEST’s selection of the best
parameter set may be restricted somewhat, for there may be some parameter sets for which the measurement
objective function Φm is just above PHIMACCEPT but for which Φr is quite low. Alternatively, if PHIMACCEPT
is set too large, then PEST might not try hard enough to reduce Φm to Φmi, preferring instead to work within the
weaker constraint set by PHIMACCEPT. When working in regularisation mode, PEST prints out Φr and Φm for
every parameter upgrade attempt. It will be apparent from this information whether PHIMACCEPT has been set
correctly.
FRACPHIM
PEST ignores the value supplied for FRACPHIM unless it is greater than zero. A value of between zero and 1.0 (but
normally less than about 0.3) can be supplied for this variable if you are unsure what value to use for PHIMLIM. See
the PEST documentation.
Automatic user intervention (AUI)
When the optimization process undertaken by PEST appears to be going nowhere, the situation can often be
remedied by selectively withdrawing certain parameters (normally the most insensitive ones) from the parameter
estimation process. This process has been automated in PEST using the AUI option. For more information on AUI
see the PEST documentation (section 5.7 of the PEST manual).
It should be noted that use of the SVD process in PEST is usually more effective than AUI as the SVD process
removes insensitive parameters.
Parallel PEST
GMS allows you to run PEST in parallel on a single machine to take advantage of multiple cores. This can greatly
speed up the PEST runs.
• Number of slaves
"Slaves" refers to the separate processes that will be run in parallel. You can specify the number of slaves or, if
not specified, GMS will automatically determine the number of cores available on the machine and use that for
the number of slaves.
• Wait time
The wait time is the amount of time that PEST will pause at certain strategic places in their communication.
Normally the default value should work fine. However, if either PEST reports a sharing violation on your hard
drive then you should increase the value of the wait time.
416
Parameter Estimation Dialog
SVD (Singular Value Decomposition)
The Use SVD toggle is available to turn on the SVD functionality in PEST. For a more complete explanation of
SVD, see the PEST manual [1] in section 8.4. The inputs to the SVD process can be edited by selecting the SVD
Options button.
The SVD process analyzes the parameters that are currently part of the parameter estimation process and removes
parameters that are not helping to solve the problem. The user can limit the number of parameters used by specifying
a maximum number of singular values (MAXSING) or by specifying EIGTHRESH. By default MAXSING is set to
1000 and EIGTRESH to 1E-7, so that the number of parameters will be limited by the value of EIGTHRESH.
• MAXSING - maximum number of singular values to include in the inversion process.
• EIGTHRESH - a ratio of the lowest to highest parameter eigen value (a value of 1E-7 is usually sufficient).
• EIGWRITE - controls output written to the *.svd file by PEST. When the value is 1 a more verbose file is written
that can become quite large. By default the value of EIGWRITE is set to 0.
SVD-Assist
The Use SVD-Assist toggle turns on the SVD-Assist process for PEST. This process is particularly advantageous for
models that have hundreds or thousands of parameters (such as pilot points). SVD-Assist involves 3 basic steps.
1. First, PEST runs MODFLOW once for every parameter in order to compute a matrix. This information is used to
create super parameters that are combinations of the parameters originally specified.
2. Second, SVDAPREP is run to create a new PEST control file. The options for SVDAPREP are entered by
selecting the SVD-Assist Options button. For more information on each of these options see the PEST manual in
section 8.5.4.2. The most important option entered is the Specify # super param and this is set to No by default.
When this option is set to No, then the information written to the *.svd file will be used to specify the number of
super parameters.
3. Third, PEST runs using the new control file written by SVDAPREP. This should result in significantly fewer
model runs for each PEST iteration. This often results in an order of magnitude reduction in the number of runs
required for each PEST iteration.
Tikhonov Regularization
Tikhonov Regularization (prior information for pilot points). This section of the dialog allows the user to select the
method for include Tikhonov regularization in the PEST run. If neither option is turned on then regularization will
not be included in the PEST run.
The first option, Preferred homogeneous regularization, is the option that GMS has always supported with pilot
points. When using this option, prior information equations are included that impose a homogeneity constraint on the
pilot points. This means that in absence of other information, pilot points that are near to one another should have
about the same value.
• Prior information power factor
This is used to change the weight applied to the prior information equations for the pilot points. A value of 1 is
normally sufficient. The prior information equations impose a homogeneity constraint on the pilot points. This
means that in absence of other information, pilot points that are near to one another should have about the
same value. When the prior information equations are created GMS will compute an inverse distance weight
between each pilot point and all other pilot points for a given parameter. This weight is then raised to the
power of the Prior information power factor and assigned to the equation for a given pair of points. So to
increase the homogeneity constraint (assign a higher weight to the prior information equation), the user should
decrease this value. To decrease the homogeneity constraint (assign a lower weight to the prior information
equation), the user should increase this value.
417
Parameter Estimation Dialog
418
The second option, Preferred value regularization, is a new option beginning with GMS version 8.0. When this
option is used, prior information equations are included that constrain the pilot points near their starting values.
Using this option the user can give a set of starting values to the pilot points based on field data or professional
judgment. PEST will only change those values if necessary to calibrate the model.
Also new in GMS 8.0, parameters of different types (HK, RCH) are put into different regularization groups.
According to John Doherty, this helps differentiate weighting amongst pertinent prior information equations.
References
[1] http:/ / gmsdocs. aquaveo. com/ pest. pdf
PEST
PEST is a general purpose parameter estimation utility developed by John Doherty of Watermark Computing. The
PEST interface in GMS can be used to perform automated parameter estimation for MODFLOW. The steps involved
in setting up a PEST run are described in the automated parameter estimation topic.
The PEST options are edited by selecting the Parameter Estimation command in the MODFLOW menu and then
clicking on the PEST tab.
PEST version support
The following table shows the version of PEST supported by different versions of GMS. To see the latest released
version of PEST visit http://www.pesthomepage.org/Downloads.php.
GMS
PEST
GMS 6.5
PEST 10.0
GMS 7.0
PEST 10.0
GMS 7.1
PEST 12.0
GMS 8.0, 8.1, 8.2 PEST 12.1
GMS 8.3
PEST 12.2
Run Options
Run Options
Once the MODFLOW simulation has been initialized, the next step is to enter the data required by the Global
Options/Basic package. This includes data defining fundamental program options such as the computational time
intervals (stress periods), an array defining which cells are inactive and which cells have constant heads, an array of
starting head values for a transient simulation, and a set of flags defining which of the other packages are to be used.
The input data for this package should be entered before editing any of the other packages. The MODFLOW Global
Options\Basic Package dialog is accessed through the Global Options command in the MODFLOW menu. The
options in the dialog are as follows:
Headings
The two headings are optional text strings which are written to the MODFLOW text output file.
Run Options
The run options are not part of the actual MODFLOW input files, but present different ways that MODFLOW 2000
can be run from GMS.
Forward Run
A forward run is a normal MODFLOW simulation. If parameters have been defined for either a stochastic or
parameter estimation run, the mean or starting values of the parameters are used for the forward run.
Sensitivity Analysis
The sensitivity analysis option is used to perform a sensitivity analysis on a set of selected parameters. The
results can be presented with a set of plots or by contouring data sets representing grid sensitivities. This
option is only available with the LPF and HUF flow packages. This option is not available in GMS 6.5 and
later (see MODFLOW with HDF5).
After running PEST, sensitivities are displayed in the .sen file. Click here for more information.
Parameter Estimation
In the parameter estimation mode, a set of parameters is found that minimizes the residual between observed
and simulated heads and flows. These options are described in more detail on the Automated Parameter
Estimation page. This option is only available with the LPF and HUF flow packages.
Stochastic Simulation
The stochastic simulation option is used to perform a stochastic simulation using the Monte Carlo or Latin
Hypercube methods for randomizing a selected set of parameters. Stochastic simulations can also be
performed using a material set approach (indicator simulations). A risk analysis wizard can be used to analyze
the results for a probabilistic threshold analysis or a probabilistic capture zone delineation. These options are
described in more detail on the stochastic simulation page.
419
Run Options
Stochastic Inverse Model
If the material set option is used for stochastic simulations, the "stochastic inverse" option can be used to
perform automated parameter estimation on each of the N candidate model instances in the stochastic. The
weighted RMS errors for each of the resulting optimized solutions can be used to weight the computations
performed by the risk analysis wizard. This option is only available with the LPF and HUF flow packages.
Model Type
The simulation can be designated as either steady state or transient. If a steady state simulation is specified, certain
portions of the MODFLOW interface such as the Stress Period dialog are inactivated since they are not relevant.
No Flow Head
This is the value of head to be assigned to all inactive (no flow) cells (IBOUND=0) throughout the simulation.
Stress Periods
The Stress Periods button is used to bring up the Stress Period dialog. The stress periods should be defined before
any of the sources/sinks are entered. If the steady state option is selected, the Stress Periods button is dimmed.
Packages
The Packages button brings up the Packages dialog.
Units
The Units button the Basic Package dialog brings up the Units dialog.
IBOUND
Values
The IBOUND button of the Global Options\Basic Package dialog brings up the array editor. The IBOUND array
contains a value for each cell in the grid defining the type of the cell as constant head, inactive, or variable head.
Constant Head
A negative value indicates that the cell has a constant head. The value of the constant head is defined in the
starting heads array.
Inactive
An IBOUND value of zero indicates that the cell is inactive (no-flow).
Variable Head
A positive IBOUND value indicates that the cell has a variable head (i.e., the head value will be computed as
part of the simulation).
Editing the IBOUND Array
There are several ways to change the active/inactive status (positive vs. zero) of a cell before or after initializing the
IBOUND array. One method is to directly edit the IBOUND array using the IBOUND dialog. Another method is to
select the Cell Attributes command in the MODFLOW menu. In most cases, the most efficient method is to use the
Activate Cells in Coverage command in the Map module. This method uses a polygon to define the active and
inactive regions.
420
Run Options
The constant head cells are typically assigned or edited in one of three ways. One method is to directly edit the
IBOUND array. Another method is to select a set of cells and use the Cell Properties dialog in the MODFLOW
menu. The simplest method is to define the constant head zones using feature objects as part of a conceptual model
in the Map module.
Starting Heads
The starting head values are used as initial conditions for head for both steady state and transient simulations. The
Starting Heads button on the left side of the Basic Package dialog is used to enter the values of the starting heads
array. Selecting the Starting Heads button brings up the MODFLOW Array Editor.
Top Elevation
The Top Elevation button brings up an array editor that allows you to edit the top elevation of each layer. GMS
requires that the top and bottom elevations for adjacent layers be the same. This means that when you edit the bottom
of one layer, move down to the next layer, and edit the top of that layer, the bottom of the previous layer will also be
changed. Note that the top and bottom layer elevations must be entered regardless of the which layer data package
(BCF, LPF, HUF) is chosen even though these values may not be used because of certain package options.
Bottom Elevation
The Bottom Elevation button brings up an array editor that allows you to edit the bottom elevation of each layer.
Note that the top and bottom layer elevations must be entered regardless of the which layer data package (BCF, LPF,
HUF) is chosen even though these values may not be used because of certain package options.
Confining Beds
The Layer Confining Beds dialog, accessed from the Global Options/Basic Package dialog, allows you to select
which layers will have a confining bed below them. The last layer in the grid may not have a confining bed.
Confining beds are most common in older models where the user was trying to conserve memory in solving the
groundwater model. In general, it is recommended that you explicitly model all of the layers in the system instead of
using confining beds. This feature is supported in GMS to make it possible for users to read in older models.
In the spreadsheet, the user may turn on the confining bed option for any of the layers except the last layer in the
grid.
The Confining Bed Elevations button brings up the array editor that allows the user to edit the elevation of each
layer.
421
Observations
Observations
Point Observations
The primary type of field data used in a typical calibration exercise is point observations. Point observations
represent values that are measured at some location in the field. Point observations generally correspond to water
table elevations measured at observation wells. However, multiple observed values can be defined at each
observation point. Observation points are managed in the Map module using the Coverage Setup dialog.
Flow Observations
Flow observations represent gains or losses between aquifers and streams or reservoirs. In addition to point
observations, flow observations are an essential part of a calibration exercise for a flow model. If calibration is
attempted using point observations only, there may be many combinations of parameters such as hydraulic
conductivity and recharge that will result in the same head distribution. Adding one or more flow observations serves
to "pin down" the flow quantity resulting in a set of hydraulic conductivities and recharge values that are more likely
to be unique.
While the point observation tools are model independent, GMS only supports flow observations for MODFLOW and
FEMWATER. With MODFLOW, observed flows are assigned to selected arcs and polygons making up the
MODFLOW conceptual model in the Map module. When a MODFLOW solution is imported, the computed flows
are read for the arcs and polygons and compared with observed values.
With a FEMWATER simulation, observed values cannot be assigned to objects in the FEMWATER conceptual
model. However, when a FEMWATER solution is imported, the computed flows on selected model boundaries can
be automatically summed. Comparison of computed vs. observed flows must then be made manually.
Observation Weights
When performing automated parameter estimation, a set of head and flow observations are defined using points,
arcs, and polygons in the Map module. When entering the point and flow observations, care should be taken when
entering the calibration interval and confidence values. These values are used to determine the weights assigned to
each observation in the inverse model. The weight is multiplied by the residual for the observation in the objective
function. The weight that is sent to the inverse model input files by GMS is computed as
Note that GMS will automatically convert from an interval and a confidence to a standard deviation or you can
directly enter the standard deviation.
422
Observations
Group Weight Multipliers
In addition to the individual weight, a group weight can also be assigned. Group weights are assigned using the
Group Weight section of the Observations dialog. This dialog is accessed by selecting the Observations command in
the MODFLOW menu.
A group weight can be assigned to each of the following observation types:
1.
2.
3.
4.
5.
6.
Head observations.
Constant head flow observations.
River flow observations.
General head flow observations.
Drain flow observations.
Stream flow observations.
Options 2-6 correspond to flow observations that are defined using the Observed flow rate option.
The default value for the group weights is 1.0. The default value can be changed to give a larger influence to a
particular observation type. For example, if a particular model had sixteen head observations and one flux
observation corresponding to a stream gage, a better solution may be obtained by increasing the flux group weight to
give more weight to the stream gage measurement.
Observations Dialog
This dialog is used to manage which coverages that contain MODFLOW observation data will be applied to the
current simulation. It is also used to apply group weights. You can only access this dialog when observations have
been created using the Map Module in a MODFLOW conceptual model.
Group Weights
These weights can be used to emphasize (or deemphasize) a type of observation for the simulation.
Coverages
This spreadsheet allows you to choose which observation coverages will be used in the current simulation. This can
be helpful if you have observations for a site from different times, but you only want to use one of the times.
Export Trans. Obs.
Beginning with version 8.0, this button allows you to export a *.csv (comma separated values) file with transient
observation data. This file can be loaded into excel to create plots of the transient observation values vs. the model
computed values. An example of using this data is included in the MODFLOW- Managing Transient Data tutorial.
Confidence Interval and Standard Deviation
The interval and standard deviation are related by the following equation:
where sd is the standard deviation, CI is the confidence interval, and z is the the "z statistic" based on the specified
confidence and the normal distribution. The user can enter an interval and confidence, and the standard deviation
will be computed; or the user can enter a standard deviation and confidence, and the interval will be computed.
In practical terms entering an interval (or standard deviation) and confidence is an indication of how much error the
user believes is associated with the observed value.
423
Observations
424
The standard deviation becomes important when using an inverse model. The weight assigned to each of the
observations points is a function of the standard deviation. This weight is used in the objective function that the
inverse model tries to minimize. An observation point with a small standard deviation will have a greater influence
on the objective function than a point with a large standard deviation.
The user must enter an interval (or standard deviation) and confidence in the Properties Dialog. Although these
values are rarely quantified the following examples may prove helpful.
If the user had the following set of head measurements for one observation well:
Date
Head
May 10, 1998
55.0
July 10, 1998
50.5
September 5, 1998
48.6
November 15, 1998
49.1
February 2, 1999
50.8
March 12, 1999
54.0
April 1, 1999
57.2
The mean of the data is 52.17 and the standard deviation is 3.25. The user could enter this standard deviation and a
confidence of 95%.
Many times the user does not have this much data available. Usually the user will only have one measured value. In
this case the user must use engineering judgement to estimate an interval or standard deviation. For example, if I
have a single head measurement of 45.7 ft and I believe that observation to be accurate to within a 1 foot. Then I
would enter 1 foot as my interval.
Plot Wizard
Plot Wizard
Plots are useful for many purposes, such as extracting data from two or three dimensional objects and model
verification. Plots are created through the Plot Wizard.
Plot Wizard Steps
The Plot Wizard (Display | Plot Wizard) is used to create 2D plots. The plot wizard is composed of two steps
described below. In addition, the types of plots that can be created are described and illustrated below.
Step 1
In the first step, the plot type is selected. The types include:
•
•
•
•
•
Computed vs. Observed Data
Computed vs. Observed Data (Weighted)
Residual vs. Observed Data
Residual vs. Observed Data (Weighted)
Parameter Sensitivities
•
•
•
•
•
•
•
•
Error vs. Simulation
Error vs. Time Step
Error Summary
Time Series
Active Data Set Time Series Plot
S/S Flow vs. Time
Flow Budget vs. Time
Gage Package Value vs. Time
A sample and explanation are displayed for each plot type. The Next > button is undimmed if the necessary data for
the selected plot type exists in the current project. If the Next > button is disabled, a help text explaining the problem
is displayed below the Plot Type box.
Step 2
In the second step, the attributes of each plot are set. The attributes associated with each plot type are explained
below and can be located quickly by clicking on the desired plot type listed above. The options depend on the plot
type and will be described below.
Computed vs. Observed
A Computed vs. Observed plot is used to display how well the entire set of observed values match a model
solution. A 45o line is drawn on this plot, which represents a perfect correspondence between observed data
and solution values. One symbol is drawn for each observation point at the intersection of the observed and
computed values for the point. This plot can show the trend of the solution values with regard to matching the
observed data. Only those points whose value is specified as observed for the selected data type will be shown
in the plot. These plots are created in the Plot Wizard by setting the Plot Type to Computed vs. Observed. A
sample plot is shown in the figure.
425
Plot Wizard
426
Computed vs. Observed Plot Options
The second step contains the following options.
Coverage and Measurements
The observation coverage and measurements can be selected for each plot. If only one observation
coverage and measurement exist these are used by default.
Use current solution
This option causes the plot to compare the observed values with the values of the current solution and
time step for each observation point. When the active solution changes, the plot is recomputed and
updated. If only one solution is in memory then this option is defaulted.
Use selected solutions
This option causes the plot to compare the observed values with the values of the specified solution for
each observation point. Changing the active solution does not affect the plot.
Use time step
Because the plot shows only values from a specific time step, The Active Times Step is used by default.
Computed vs. Observed (Weighted)
A Computed vs. Observed Weighted plot is used to display how well the entire set of weighted observed
values match a model solution. These weights are set by selecting the Observation item in the MODFLOW
menu. A 45o line is drawn on this plot, which represents a perfect correspondence between observed data and
solution values. One symbol is drawn for each observation point at the intersection of the weighted observed
and computed values for the point. This plot can show the trend of the solution values with regard to matching
the weighted observed data. Only those points whose value is specified as observed for the selected data type
will be shown in the plot. This plot is not available with transient data. These plots are created in the Plot
Wizard by setting the Plot Type to Computed vs. Observed (Weighted). A sample plot is shown in the figure.
Plot Wizard
427
Computed vs. Observed Weighted Plot Options
After the plot type is set in the First Page of the Plot Wizard, the Next button is clicked to open the Computed
vs. Observed Weighted Plot Options wizard page. This page contains the following:
Coverage and Measurements
The observation coverage and measurements can be selected for each plot. If only one observation
coverage and measurement exist these are used by default.
Use current solution
This option causes the plot to compare the weighted observed values with the values of the current
solution and time step for each observation point. When the active solution changes, the plot is
recomputed and updated. If only one solution is in memory then this option is defaulted.
Use selected solutions
This option causes the plot to compare the weighted observed values with the values of the specified
solution for each observation point. Changing the active solution does not affect the plot.
Use time step
Because the plot shows only values from a specific time step, The Active Times Step is used by default.
Residual vs. Observed
A Residual vs. Observed plot is used to display how well the entire set of observed values match a model
solution. On this plot is drawn a horizontal line along an error of zero, representing what would be a perfect
correspondence between observed data and solution values. Then, one symbol is drawn for each observation
point at the intersection of the observed and residual (computed-observed) values for the point. This plot can
show the trend of the solution values with regards to matching the observed data. Only those points whose
value is specified as observed for the selected data type will be shown in the plot. These plots are created in
the Plot Wizard by setting the Plot Type to Residual vs. Observed. A sample plot is shown in the figure.
Plot Wizard
428
Residual vs. Observed Plot Options
After the plot type is set in the First Page of the Plot Wizard, the Next button is clicked to open the Residual
vs. Observed Plot Options wizard page. This page contains the following:
Coverage and Measurements
The observation coverage and measurements can be selected for each plot. If only one observation
coverage and measurement exist these are used by default.
Use current solution
This option causes the plot to compare the observed values with the residual values of the current
solution and time step for each observation point. When the active solution changes, the plot is
recomputed and updated. If only one solution is in memory then this option is defaulted.
Use selected solutions
This option causes the plot to compare the observed values with the residual values of the specified
solution for each observation point. Changing the active solution does not affect the plot.
Use time step
Because the plot shows only values from a specific time step, The Active Times Step is used by default.
Residual vs. Observed (Weighted)
A Residual vs. Observed (Weighted) plot is used to display how well the entire set of weighted observed
values match a model solution. On this plot is drawn a horizontal line along an error of zero, representing what
would be a perfect correspondence between weighted observed data and solution values. One symbol is drawn
for each observation point at the intersection of the weighted observed and residual (computed-observed)
values for the point. This plot can show the trend of the solution values with regards to matching the weighted
observed data. Only those points whose value is specified as observed for the selected data type will be shown
in the plot. This plot is not available with transient data. These plots are created in the Plot Wizard by setting
the Plot Type to Residual vs. Observed (Weighted). A sample plot is shown in the figure.
Plot Wizard
429
Residual vs. Observed Plot Options
After the plot type is set in the First Page of the Plot Wizard, the Next button is clicked to open the Residual
vs. Observed (Weighted) Plot Options wizard page. This page contains the following:
Coverage and Measurements
The observation coverage and measurements can be selected for each plot. If only one observation
coverage and measurement exist these are used by default.
Use current solution
This option causes the plot to compare the weighted observed values with the residual values of the
current solution and time step for each observation point. When the active solution changes, the plot is
recomputed and updated. If only one solution is in memory then this option is defaulted.
Use selected solutions
This option causes the plot to compare the weighted observed values with the residual values of the
specified solution for each observation point. Changing the active solution does not affect the plot.
Use time step
Because the plot shows only values from a specific time step, The Active Times Step is used by default.
Plot Wizard
430
Parameter Sensitivity
A Parameter Sensitivity plot is used to display the sensitivity of the MODFLOW parameters. These plots are
created in the Plot Wizard by setting the Plot Type to Paramater Sensitivity. A sample plot is shown in the
figure.
Parameter Sensitivity Plot Options
After the plot type is set in the First Page of the Plot Wizard, the Next button is clicked to open the Parameter
Sensitivity Plot Options wizard page. This page contains the following:
Parameter Type
This option changes the parameter type displayed.
Use current solution
This option causes the plot to compare Parameter Sensitivities of the current solution. When the active
solution changes, the plot is recomputed and updated. If only one solution is in memory then this option
is defaulted.
Use selected solutions
This option causes the plot to compare Parameter Sensitivities of the specified solution. Changing the
active solution does not affect the plot.
Error vs. Simulation
An Error vs. Simulation plot is generally used with steady-state simulations and measurement types. It may be
used in transient simulations. This plot can display the mean error, mean absolute error, and root mean squared
error between successive solutions and observed data. Various simulations would be run after changing model
parameters, such as hydraulic conductivity or recharge. The plot will show trends in the solution to see if
model parameter changes are causing better calibration with measured field data. Error vs. Simulation plots are
created in the Plot Wizard by setting the Plot Type to Error vs. Simulation. A sample plot is shown in the
figure.
Plot Wizard
431
Error vs. Simulation Plot Options
After the plot type is set in the First Page of the Plot Wizard, the Next button is clicked to open the Error vs.
Simulation Plot Options wizard page. This page contains the following:
Solutions
This lists all available solutions.
Move Up/Move Down
GMS initially shows the solutions in the order they were opened. However, this is not necessarily the
order in which they were run. To change the order, highlight a solution and move it up or down to
rearrange their order.
Observed
This lists all available measurement types that were set up in the Observation Coverage Options dialog,
both constant and transient. This plot is generally performed using constant solutions and measurement
types, although transient data is allowed. You should select in the combo box the measurement type that
you are comparing.
Check Box Options
There are three options that can be turned on or off. They determine whether the mean error, mean
absolute error, and root mean squared error plots should be shown. Because these values are an average
of all observation points, their line and symbol styles are not linked to any one observation point, but
can be defined by clicking on the appropriate canvas window in the dialog.
Error vs. Time Step
An Error vs. Time Step plot is used with transient simulations to display the mean error, mean absolute error,
and root mean squared error between a solution and observed data as a function of time. This plot applies to a
single Data Set in a model solution. Transient measurement types will show the average errors at each time
step of the data set. Error vs. Time Step plots are created in the Plot Wizard by setting the Plot Type to Error
vs. Time Step. A sample plot is shown in the figure.
Beginning with version 8.0, this plot can no longer be used with MODFLOW.
Plot Wizard
432
Error vs. Time Step Plot Options
After the plot type is set in the First Page of the Plot Wizard, the Next button is clicked to open the Error vs.
Time Step Plot Options wizard page. This page contains the following:
Use current solution
This option causes the plot to compare Parameter Sensitivities of the current solution. When the active
solution changes, the plot is recomputed and updated. If only one solution is in memory then this option
is defaulted.
Use selected solutions
This option causes the plot to compare Parameter Sensitivities of the specified solution. Changing the
active solution does not affect the plot.
Observed
This lists all available measurement types that were set up in the Observation Coverage Options dialog,
both constant and transient. A constant measurement should be used for solutions with only one time
step, while a transient measurement should be used for transient solutions. You should select the
measurement type in the combo box that you are comparing. If only one exists then it is used by default.
Check Box Options
There are three options that can be turned on or off. They determine whether the mean error, mean
absolute error, and root mean squared error plots should be shown. Because these values are an average
of all observation points, their line and symbol styles are not linked to any one observation point, but
can be defined by clicking on the appropriate canvas window in the dialog.
Error Summary
See the Error Summary Plot page for more details. An Error Summary plot is used to display the mean error,
mean absolute error, and root mean squared error for a Solution. Error Summary plots are created in the Plot
Wizard by setting the Plot Type to Error Summary. A sample plot is shown in the figure.
Beginning with version 8.0, this plot can no longer be used with MODFLOW. This information can be found
by right-clicking on the MODFLOW solution in the Project Explorer.
Plot Wizard
433
Error Summary Plot Options
After the plot type is set in the First Page of the Plot Wizard, the Next button is clicked to open the Error
Summary Plot Options wizard page. This page contains the following:
Use active solution
This option causes the plot to show a summary of mean error between the set of observed values with
the values of the active solution for each observation point. When the active solution changes, the plot is
recomputed and updated. This option is always on by default at this time
All time steps
This option shows the mean error for all time steps instead of only at the current or specified time step
value.
Observed
This section shows the available list of observed values that were set up in the Observation Coverage
Options dialog. Both constant and transient observed values should be available in this dialog.
Time Series
A Time Series plot is used to display the time variation of one or more scalar Data Sets associated to a given
point inside a model solution. In addition, if transient calibration data has been defined, a band can be shown
which represents a time variant Calibration Target. Only transient data sets may be used in these plots. Time
Series plots are created in the Plot Wizard by setting the Plot Type to Time Series. A sample plot is shown in
the figure.
Beginning with version 8.0, these plots have been changed to show observation targets instead of a "band"
around the observed data.
Plot Wizard
434
Time Series Plot Options
After the plot type is set in the First Page of the Plot Wizard, the Next button is clicked to open the Time
Series Plot Options wizard page. This page contains the following:
Coverage and Measurements
The observation coverage and measurements can be selected for each plot. If only one observation
coverage and measurement exist these are used by default. All Measurements can also be selected to
plot all of the different measurements on one plot.
Use current solution
This option causes the plot to display the values of the active Solution for each observation point being
plotted. When the active solution changes, the plot is recomputed and updated. If only one solution is in
memory then this option is defaulted.
Use selected solutions
This option causes the plot to display the values of one or more specified Solutions for each point being
plotted. Changing the active solution does not affect the plot.
Selected Points
Each of the observation points are shown in a spreadsheet. The show toggle determines which
Observation Points will be displayed in a Time Series Plot in the Plot Window. This way, only certain
points are plotted in each individual time series plot. All the points can either be turned on or off by
selecting the corresponding buttons below the spreadsheet.
Calibration Target
Turn this on to display a band in the plot to define the valid calibration range. If this is turned off, only
the calibration curve will be drawn.
Time interval
A starting time and an ending time of observations can be specified by two combo boxes. Only the
interval chosen will be shown on the time series plot.
Plot Wizard
435
Active Data Set Time Series
A Time Series plot is used to display the time variation of one or more scalar Data Sets associated to a given
point selected in a model solution. Time Series plots are created in the Plot Wizard by setting the Plot Type to
Active Data Set Time Series. A sample plot is shown in the figure.
Active Data Set Time Series Plot Options
After the plot type is set in the First Page of the Plot Wizard, the Finish button is clicked to create the active
time series plot. For 2D and 3D grids select a grid cell and for 2D and 3D meshes select a node to display the
scalar values of the data set at that location over time. You can select up to five locations to be plotted on one
plot.
S/S Flow vs. Time
A Flow vs. Time plot is used to display the flow or water over time for a selected feature object or grid cell.
Flow vs. Time plots are created in the Plot Wizard by setting the Plot Type to Flow vs. Time. A sample plot is
shown in the figure.
S/S Flow vs. Time Plot Options
After the plot type is set in the First Page of the Plot Wizard, the Finish button is clicked to create the flow vs
time plot. This plot will report the flow either by selecting a feature object defined as a MODFLOW
source/sink in the map module or by selecting a group of cells in the 3D Grid. To change the plot options for
the Flow vs Time Plot right-click on the plot and select the Plot Data command. The Plot Data dialog contains
the following:
Feature Objects flow
This option allows you to select what data to plot when a Source/Sink feature object is selected in the
Map module. By default the computed flow is plotted. If observed values exist for the feature object
than those values can also be plotted along with calibration target ranges.
Grid Cell Flow
This option allows you to select what Source/Sink flows to be plotted when Grid Cells are selected in
the 3D grid module. The options are: Storage, Constant Head, Drains, General Heads, Rivers, Streams,
Recharge, Evapotranspiration, and Total Source/Sink flow in and out of the cells.
Plot Wizard
436
Flow Budget vs. Time
A Flow Budget vs. Time plot is used to display the flow or water over time for selected grid cell or for zone
budget ids. Flow Budget vs. Time plots are created in the Plot Wizard by setting the Plot Type to Flow Budget
vs. Time. A sample plot is shown in the figure.
Flow Budget vs. Time Plot Options
After the plot type is set in the First Page of the Plot Wizard, the Next button is clicked to open the Flow
Budget Plot Options wizard page. The options on this page are discussed below. The Finish button is clicked
to create the flow budget vs time plot. This plot will report the flow either by selecting a group of cells in the
3D Grid or by using the zone budget ids.
Display using
This option allows you to determined the data to plot. The Flow budget will be computed either from the
selected 3D grid cells or from the selected zone budget ids in the spreadsheet.
Grid Cell Flow
This option allows you to select what Source/Sink flows to be plotted. The options are: Storage,
Constant Head, Drains, General Heads, Rivers, Streams, Recharge, Evapotranspiration, and Total
Source/Sink flow in and out of the cells.
Gage Package Value vs. Time
This plot shows a time series for a single gage package column. After the plot type is set in the First Page of
the Plot Wizard, the Next button is clicked to open the Gage Package Time Series wizard page. To generate a
gage plot the gage file needs to be selected from the list on the left, and the data column from the list on the
right. If GMS is unable to properly read the data from the gage file, an error is shown in the wizard page to the
right of the data column list.
Plot Wizard
Finish
When the Finish button is selected, a window is opened with the plot. Plot windows are created each time the
Plot Wizard is run. See the 2D Plots discussion for information on editing plots that have been created.
Right-Click Menu Commands
Once the plot has been created, the appearance and data of the plot can be altered with commands accessed by
right-clicking on the plot window. The commands available through the right-click menu are described below.
Plot Data - The plot data command brings up the second step of the plot wizard where the attributes of each
plot are set. The plot data can be updated based upon the type of plot. For Histogram plots it brings up a dialog
used to edit the precision displayed on the plot.
Display Options - The Display Options command allows you to change general display attributes of the plot
(Border Style, Precision, Axis type, Fonts, Colors, etc.).
Axis Titles - The axis titles menu is used to change the x and y axis titles.
Set As Display Defaults - To save the plots current settings as the default settings, select the Save Settings
menu item.
Legends - The legend can be turned on by right clicking on the plot and selecting a location from the Legend
submenu. The maximum number of points included in the legend depends upon the size of the plot window.
Export/Print - By selecting on the Export/Print menu item, a dialog is displayed showing options for printing
or exporting the plots values.
Default Display - To save the plots current settings as the default settings, select the Save Settings menu item.
View Values - To view the values of the plot in a spreadsheet format, select the View Values menu. A
spreadsheet containing the data points associated with the current plot appear.
437
Calibration Targets
438
Calibration Targets
If an observed value has been assigned to an
observation point or if an observed flow has been
assigned to an arc or polygon, the calibration error at
each object can be plotted using a "calibration target".
A set of calibration targets provides useful feedback on
the magnitude, direction (high, low), and spatial
distribution of the calibration error.
The components of a calibration target are illustrated in
the following figure. The center of the target
corresponds to the observed value. The top of the target corresponds to the observed value plus the interval and the
bottom corresponds to the observed value minus the interval. The colored bar represents the error. If the bar lies
entirely within the target, the color bar is drawn in green. If the bar is outside the target, but the error is less than
200%, the bar is drawn in yellow. If the error is greater than 200%, the bar is drawn in red. The display options
related to calibration targets are specified in the Feature Object Display Options dialog.
Example of a calibration target
If the active time step is before the first observed time, or after the last observed time, the targets are drawn lighter.
Model Checker
Once a mesh or grid is generated and all of the analysis options and boundary conditions have been specified, the
next step is to save the simulation to disk and run the model. However, before saving the simulation and running the
model, the model should be checked with the Model Checker. Because of the significant amount of data required for
a simulation for all the different models, it is often easy to neglect important data or to define inconsistent or
incompatible options and parameters. Such errors will either cause the model to crash or to generate an erroneous
solution. The purpose of the Model Checker is to analyze the input data currently defined for a model simulation and
report any obvious errors or potential problems. Running the Model Checker successfully does not guarantee that a
solution will be correct. It simply serves as an initial check on the input data and can save a considerable amount of
time that would otherwise be lost tracking down input errors.
Running the Model Checker
To check the current data, select the Check Simulation command from the "current model" menu. The Model
Checker dialog will appear. To run the Model Checker, select the button labeled Run Check at the top of the dialog.
This generates a list of possible errors and warning messages in the top scrolling window.
If the model checker finds any potential errors with your input, then fix the errors and rerun the model checker.
Options
The Checker Options button in the Model Checker allows you to customize the checks that will be performed. A
check box is provided for each category of the model input data. Turning off any of the options will suppress the
warnings and errors associated with these categories. Also provided is the option to define the maximum number of
errors and warnings to be reported of the same type. Messages classified as warnings can also be suppressed.
Model Checker
Save Messages
The Save Messages button provides the option to save the current listing of warnings and error messages to a text
file.
One unique feature of the MODFLOW Model Checker is the Fix Layer Errors option.
439
440
7.2. Parameters
Parameters
A parameter is a variable that is used to control one or more other values. GMS uses parameters with MODFLOW to
define inputs for forward runs or for model calibration or for stochastic modeling.
Key value and standard MODFLOW parameters
There are two ways to do MODFLOW parameterization in GMS:
• The key value method (recommended)
• The standard MODFLOW method
Key values
Key values are used to parameterize the MODFLOW input. Key values can be used for both the zonation and pilot
points methods of defining parameters. A key value is a number that is assigned as input that marks the input values
as belonging to a parameter. When selecting a key value, a number should be chosen that is not likely to occur in
typical input for that parameter. We recommend using negative numbers in most cases.
For example, a model may have four K zones and three recharge zones. The four K zones would be marked by
assigning -100, -200, -300, and -400 to the cells in the K array for each of the four zones. Likewise, the recharge
zones would be marked by assigning -500, -600, and -700 to the appropriate cells in the recharge array.
Key values can be assigned either by editing the cell array values directly in the 3D grid module or by assigning the
values to a set of polygons or arcs in the conceptual model and selecting the Map -> MODFLOW command.
When MODFLOW is running and data is read from the HDF5 file, if one of the parameter key values is found in the
data then the parameter value is substituted into the array or list.
The key value approach makes it much easier to support transient parameters and very large sets of pilot points.
Also, this approach allows GMS users to use parameters with the BCF package. This feature is not available with the
MODFLOW PES process.
Standard MODFLOW parameters
The "key value" approach is the preferred approach to defining parameters in GMS. Using key values is the only
option for WEL, RIV, DRT, DRN, GHB, CHD, STR, and HFB parameters. In GMS, using the key value approach
with these parameters provides the same functionality of parameter instances available in MODFLOW.
Key values can also be used with array based parameters. However, GMS does support defining array based
parameters with clusters and instances (for ETS, EVT, RCH parameters).
When reading in a MODFLOW simulation that was created outside of GMS all parameters will be converted to key
values so long as the parameter can be represented by key values.
Key values can not be used to represent an array based parameter if the parameter is defined using more than one
cluster or more than one instance. Also, if more than one parameter uses the same zone array with a matching IZ
value then the parameter can not be represented using key values. Further, if the multiplier array associated with the
parameter has values other than 1.0 in the zones where the parameter is used then the parameter can not be
represented with key values.
Parameters
The standard MODFLOW method is considered an "advanced" feature in GMS. Only users that understand how
MODFLOW uses parameters should attempt to use this feature.
For more information, refer to the Standard MODFLOW Parameters page.
Using parameters
To use parameters, you must:
1. Parameterize your model and
2. Create a parameter list
Parameterizing the model
There are two methods used to parameterize a model:
• Zonation
• Pilot Points
Zonation
The most common form of parameterization
is zonation. With this approach, an array of
input values is divided into zones where all
of the cells in each zone share a single
parameter value. This concept is illustrated
in the figure below. The entire array of
values is represented by three parameters.
Zonation is most easily accomplished in
GMS by assigning key values to polygons in
the map module. It can also be
accomplished by assigning key values to a
selected set of cells in the 3D grid module using the Cell Attributes command.
Pilot points
Another way to parameterize a model is to use pilot points. For more information on pilot points, refer to the Pilot
Points page.
Creating a parameter list
The list of parameters is defined using the Parameter Dialog. In general, the number of parameters should be less
than the number of observations. However, if the user chooses to use pilot points with PEST in regularization mode,
then the number of parameters does not have to be less than the number of observations.
Legal MODFLOW Parameters
The following MODFLOW input values can be defined as parameters in GMS:
441
Parameters
442
Package
Option
LPF/HUF
•
•
•
•
•
•
•
Recharge
RCH - Recharge value
Evapotranspiration
HK - Horiz. hydraulic conductivity
HANI - Horiz. anisotropy
VK - Vert. hydraulic conductivity
VKCB - Vert. hydraulic conductivity of confining beds
VANI - Vert. anisotropy
SS - Specific storage
SY - Specific yield
EVT - Max ET flux
Evapotranspiration Segments ETS - Max ET flux
Well
WELL - Pumping rate
River
RIV - River conductance
General Head
GHB - Conductance
Drain
DRN - Conductance
Time-Variant Specified-Head CHD - Head
Stream
STR - Conductance
Stream-flow Routing
SFR - Conductance
Horizontal Flow Barrier
HFB - Hydraulic characteristic
Parameter Dialog
When building a MODFLOW inverse model, the input data must be parameterized. This is accomplished by
assigning a set of key values to selected input fields. Once the key values are assigned, the next step is to create a
parameter list.
Parameters can also be used to perform forward runs.
See also Standard MODFLOW Parameters.
Creating/Deleting Parameters
The Parameters dialog contains the list of parameters. A new parameter can be created by selecting the New
Parameter button. Each parameter that is defined should correspond to a key value that has been defined in the
MODFLOW input. A parameter can be removed from the list by selecting the parameter and selecting the Delete
Parameter button. The entire list of parameters can be deleted by selecting the Delete All button.
Parameter Dialog
Initialize from Model
In most cases, the fastest and simplest way to create the parameter list is to use the Initialize from Model button.
When this button is selected, GMS traverses the MODFLOW input data corresponding to legal parameter values and
searches for key values. It is assumed that the key values are entered as negative numbers. When a unique negative
number is found, a new parameter is added to the list, and a default name is given to the parameter based on the
parameter type.
NOTE: The Initialize from Model command will not search for key values in the Well package. This is because
negative pumping rates are perfectly common and do not necessarily correspond to key values. If you wish to define
a well Q as a parameter, you should use the New Parameter button and manually create the parameter.
Import Optimal Values
After performing an inverse model run, the inverse code writes out a text file containing the set of optimal parameter
values corresponding to the minimum calibration error. The next step is to read these values into GMS. This is
accomplished by selecting the Import Optimal Values button. Once you open the file, the optimal parameter values
will be loaded into the starting value field and displayed in the parameter list.
If any of your parameters use pilot points, importing the optimal values will also import and create a new data set for
the associated 2D scatter point set.
Spreadsheet
The spreadsheet holds parameters, their types, starting and bounding values and other options that depend on the
packages and run options defined for the current MODFLOW simulation in the Global Options\Basic Package.
Parameter Estimation Solve
Toggle on this option to solve for the optimal parameter value using a parameter estimation program like PEST. (See
Automated Parameter Estimation)
Name
The name must be unique and limited to 8 characters. The default name should be sufficient. This name will be used
to reference the parameter in the MODFLOW solution and output files.
Key
The key value, usually a negative value, must be unique and is used to link the parameter with the data in the
MODFLOW input files. The key value should also be entered into the MODFLOW data by directly entering the
values using the grid based approach or by using the map module.
Type
GMS supports most of the parameter types that are also supported by the MODFLOW PES process.
Start Value/Pilot Points
This value will be the starting value for inverse modeling, the mean value for stochastic modeling, or the substitute
value for forward runs.
For inverse modeling, the closer the starting value is to the "optimal" value, the better the odds that the inverse model
will converge and the less time it will take to converge. It is generally not a good idea to give all parameters of a
given type (e.g., recharge) a constant value and let the inverse model start from that point. Ideally, field tests, soil
443
Parameter Dialog
types, ground cover, and sound modeling judgement can provide a good set of starting values. It is also a good idea
to undergo some manual trial-and-error calibration prior to setting up the inverse code.
Pilot points can be used to define a parameter by selecting the drop-down arrow in this column and selecting the
Pilot points option. Pilot points are an alternative to using zonation to define parameter locations. When you use
pilot points, you use the Pilot Point Options button to choose a 2D point scatter point set and choose the appropriate
interpolation options.
Min Value Max Value
The min and max values will provide the bounds for the parameter, and they must encompass the starting value. The
parameter values will be forced between these values during inverse and stochastic modeling. In these cases, the min
and max values are just "suggestions" and are used to predict parameter values.
When selecting the min and max values for the parameters, care should be taken not to make the range in values too
large. Inverse models are highly senstive to the stability of the underlying model. If MODFLOW does not converge,
the invese model will not be able to find a solution. Furthermore, excessive cell drying can cause the inverse model
to fail to converge. If the min and/or max values are too extreme, the odds of the MODFLOW model not converging
or excessive numbers of cells going dry increases. It is best to select a limited range for each parameter and then to
compare the final optimal parameter value to this range. If the optimal value is at either the min or max of the range,
the range can be adjusted and the inverse model can be re-launched.
Log xform
This option log transforms the value during prediction process of inverse modeling and the random number
generation process of stochastic modeling. The best parameters to log transform are those that can vary by orders of
magnitude like hydraulic conductivity.
It is also recommended that you log transform recharge parameters if you are using pilot points for hydraulic
conductivity and the hydraulic conductivity parameter is log transformed.
BSCAL
MODFLOW documentation includes:
This value is an alternate scaling factor for the parameter, and always needs to be a positive number. If the parameter
value becomes 0.0, which can occur for parameters that are not log transformed, BSCAL is used in the scaling. If the
absolute value of the parameter is less than BSCAL, BSCAL is used in the scaling. The best value to use is problem
dependant. Good choices are the smallest reasonable value of the parameter or a value two to three orders of
magnitude smaller than the value specified by the starting value. If the smallest reasonable value is 0.0, a reasomable
non-zero value needs to be used. BSCAL has no effect on the scaled sensitivities for log-transformed parameters.
444
Parameter Dialog
Multiplier
Select this option to include a multiplier array for RCH and HK parameters.
Data Set / Folder
Use this button to select a multiplier array of a set of multiplier arrays (stochastic only) by selecting a folder of data
sets.
Stochastic Options
Standard Deviation
Use this field to specify the standard deviation of a parameter for a stochastic simulation.
Mean value
Use this field to specify the mean of a parameter for a stochastic simulation.
Distribution
When the parameter is stochastic, use this option to choose between a normal or linear distribution. A random
number for the parameter is generated using the distribution, the mean value (starting value) and the standard
devation.
Std Deviation
The standard deviation is used for a stochastic parameter to generate a random number using the chosen
distribution.
Num Segments
When the parameter is stochastic and the stochastic method is Latin Hypercube, the number of segments helps
determine how man total MODFLOW runs will be used.
445
Pilot Points
Pilot Points
Pilot points can be thought of as a 2D scatter point set. Instead of
creating a zone and having the inverse model estimate one value for
the entire zone, the value of the parameter within the zone is
interpolated from the pilot points. Then the inverse model estimates the
values at the pilot points. The figure below shows a set of pilot points
used to estimate horizontal hydraulic conductivity. Notice how the
hydraulic conductivity now varies from cell to cell. When the inverse
model runs, the values at the pilot points are adjusted and the “surface”
defining the variation of K values is warped until the objective function
is minimized.
PEST provides an additional option for the pilot point method called
“regularization”. Regularization imposes an additional measure of
“stiffness” to the parameter being interpolated via a “homogeneity”
constraint. In the absence of any strong influence from the PEST
objective function, this constraint causes values at pilot points to
approximate the mean value of adjacent pilot points. This constraint
makes the inversion process much more stable and makes it possible to
Pilot Points and Resulting Conductivity Field
violate one of the typical constraints associated with parameter
estimation: namely, the requirement that the number of parameters must be less than the number of observations.
With regularization, the number of parameters can greatly exceed the number of observations. As a result, complex
hydraulic conductivity distributions can be defined, resulting in extremely low residual error. The pilot point method
with regularization is an incredibly powerful feature of PEST. (For more on PEST see Automated Parameter
Estimation)
Interpolation Options
Kriging and IDW are the only interpolation options supported with pilot points. The kriging option requires the
establishment of a model variogram (by creating a nested structure). The nodal function options in the IDW method
are not supported because those schemes compute gradients based on the data set values at the surrounding points.
With the pilot point method, the values at the points will change during the inversion process, thereby rendering the
previously computed gradients inaccurate.
Pilot Point Conditioning
For pilot point interpolation of hydraulic conductivity, it is sometimes useful to include one or more measured K
values with the pilot point set. These measured values could represent K values extracted from a field pump test. The
Pilot Point Conditioning option is available to represent this scenario. One of the properties associated with scatter
points is a Fixed pilot point toggle. If this toggle is on and the corresponding scatter point set is used for pilot point
interpolation, the K value assigned to the point is not allowed to vary during the parameter estimation process.
446
Pilot Points
Guidelines for Placement of Pilot Points
Note: The recommended maximum number of pilot points is about 200.
1.
2.
3.
4.
5.
Place points between observations rather than on top of observations
Add greater density where there are more observations
Add points where head gradient is steep
Place a row of points between observation wells and head-dependent boundaries
Fill in the gaps
Multiplier Arrays for Parameters
HK and RCH parameters may be associated with a multiplier array. A data set is associated with a parameter zone
and the starting parameter value is multiplied by the data set to define the spatial variation of the parameter
throughout the zone.
Setting up Multiplier Arrays
The multiplier data set is associated with the parameter zone in the Parameters dialog by first turning on the Use
multiplier arrays toggle, selecting either Single Array or Multiple Array from the pull-down list in the Multiplier
column, and then selecting the data set using the button in the Data Set/Folder column. If the Single Array option
is selected, a single data set should be selected in the Data Set/Folder column. If the Multiple Array option is
selected, an entire folder of data sets should be selected. The Multiple Array option is only available for stochastic
modeling.
If the Single Array option is selected the array for the parameter will be defined as the starting/mean value
multiplied by the multiplication array for all cells associated with the parameter. Multiplier arrays are not available
for parameters that use pilot points.
When the Multiple Arrays Option is selected, the number of stochastic model runs will be a function of how many
data sets are in the folder selected by the user for the multipliers.
447
Multiplier Arrays for Parameters
Guassian Field Based Monte Carlo Simulations
The Multiple Array option for user-defined multiplier arrays can be used in combination with the new Gaussian
Field Generator to perform a Monte Carlo simulation. This is accomplished by first generating a set of Gaussian
fields using the FIELDGEN code and then associating the resulting folder of data sets with a parameter as described
above. A stochastic simulation can then be performed using the Parameter Randomization method. For each model
instance, GMS loads a new instance of the multiplier array into the model input. A default parameter value of 1.0 is
generally recommended in such instances.
Standard MODFLOW Parameters
Caution
There are two ways to do MODFLOW parameterization in GMS:
1. The key value method (recommended)
2. The standard MODFLOW method
The "key value" approach is the preferred approach to defining parameters in GMS. Using key values is the only option for WEL, RIV, DRT, DRN,
GHB, CHD, STR, and HFB parameters. In GMS, using the key value approach with these parameters provides the same functionality of parameter
instances available in MODFLOW.
Key values can also be used with array based parameters. However, GMS does support defining array based parameters with clusters and instances
(for ETS, EVT, RCH parameters).
When reading in a MODFLOW simulation that was created outside of GMS all parameters will be converted to key values so long as the parameter
can be represented by key values.
Key values can not be used to represent an array based parameter if the parameter is defined using more than one cluster or more than one instance.
Also, if more than one parameter uses the same zone array with a matching IZ value then the parameter can not be represented using key values.
Further, if the multiplier array associated with the parameter has values other than 1.0 in the zones where the parameter is used then the parameter
can not be represented with key values.
The standard MODFLOW method is considered an "advanced" feature in GMS. Only users that understand how MODFLOW uses parameters
should attempt to use this feature.
This article describes how to use the standard MODFLOW parameterization method in GMS.
448
Standard MODFLOW Parameters
Support in GMS
Reading
GMS can read MODFLOW models that use standard MODFLOW parameters.
Writing
GMS writes MODFLOW models using the key value approach. So, although GMS can read models that use
standard MODFLOW parameters, it cannot write them using the standard MODFLOW parameter method. Writing is
usually done using the key value method. There are a few exceptions which include recharge and evapotranspiration
parameter instances, and LPF and HUF parameter clusters. GMS will write these parameters using the standard
MODFLOW parameter method because these cannot always be represented using the key value method.
Editing
When GMS reads a model that uses standard MODFLOW parameters it converts them to regular GMS key value
approach parameters. The parameters can then be edited using the Parameters Dialog. Recharge, evapotranspiration,
LPF, and HUF parameters are special in that you can edit the instance and cluster information associated with these
types of parameters.
MODFLOW Parameter Clusters Dialog
The MODFLOW Parameter Clusters Dialog allows users to define instances for RCH, EVT, LPF, and HUF
parameters that use clusters. The inputs in this dialog basically follow the necessary inputs for defining a parameter
instance in a package file. You may wish to review the MODFLOW Parameter Clusters and Instances section below.
Array based parameters are defined using clusters. A cluster is a multiplier array, a zone array, and specified zone
values where the parameter is applied. Multiplier arrays and zone arrays have associated data sets underneath the
three dimensional grid in the Project Explorer.
Instances are enabled for RCH and EVT parameters. Instances allow the user to define multiple sets of clusters that
are all tied to one parameter. Then the user may use different instances in different stress periods in their
MODFLOW model. For more information on parameter instances consult the MODFLOW documentation.
In the MODFLOW Parameters dialog the user selects the Define clusters option for a parameter. This will allow the
user to specify the number of instances and clusters that are used to define the parameter.
In the Parameter Instances dialog the user defines a name for each parameter instance for RCH and EVT
parameters. For LPF parameters a level is defined and for HUF parameters a hyrdogeologic unit is defined. Then for
each cluster the user selects a multiplier array and a zone array. These are data sets on the 3D Grid. The user must
449
Standard MODFLOW Parameters
450
also specify the zone values (IZ) where the parameter is to be applied in the model. If there is more than one IZ value
for the cluster then the user enters the numbers with spaces between the entries. So if the parameter is to be applied
where the zone array values are 1 and 3 then the user would enter "1 3". The user must also specify the stress periods
where an instance is to be used. The numbers entered in the Stress Periods field should also be space delimited. This
means if you want an instance to be used in stress periods 1, 2, and 5 then your entry in the Stress Periods field
should be "1 2 5".
When the package is written out for MODFLOW the instances will be included in the parameter definition and used
for forward runs or for parameter estimation runs.
MODFLOW Parameter Clusters and Instances
For those wanting to follow the standard MODFLOW approach to parameterization, the following explanation may
be helpful. You should refer to the MODFLOW documentation for more information.
Definitions
Here is a brief review of the most important terms used when dealing with parameters.
•
•
•
•
•
•
•
Parameter - Has a name, type, one or more clusters, and zero or more instances.
Parval - The value of the parameter.
Cluster - Has a multiplier array (Mltarr), a zone array (Zonarr), and zone numbers (IZ).
Mltarr - Name of the multiplier array. Parval is multiplied by this to define the value.
Zonarr - Name of the zone array used to define the cells that are associated with a parameter.
IZ - Up to 10 zone numbers (separated by spaces) that define the cells that are associated with a parameter.
Instance - Parameter cluster that could be used for different stress periods in a MODFLOW simulation.
Examples
Below are some examples showing different ways parameters can be used. The examples use parameters to define
recharge for a forward run (not doing inverse modeling). The grid in the examples is 5 rows, 5 columns, 1 layer. The
examples use the following multiplier and zone arrays.
Multiplier arrays
MULT0001
MULT0002
Standard MODFLOW Parameters
451
1.0 1.0 1.0 1.0 1.0
0.5 0.5 0.5 0.5 0.5
1.0 1.0 1.0 1.0 1.0
0.5 0.5 0.5 0.5 0.5
1.0 1.0 1.0 1.0 1.0
0.5 0.5 0.5 0.5 0.5
1.0 1.0 1.0 1.0 1.0
0.5 0.5 0.5 0.5 0.5
1.0 1.0 1.0 1.0 1.0
0.5 0.5 0.5 0.5 0.5
Zone Arrays
ZONE0001
ZONE0002
ZONE0003
2 2 2 0 0
3 3 3 3 3
0 0 0 0 0
2 2 2 0 0
3 3 3 3 3
0 0 6 7 0
2 2 2 0 0
4 4 4 4 4
0 0 6 7 0
0 0 0 0 0
4 4 4 4 4
0 0 0 0 0
0 0 0 0 0
5 5 5 5 5
0 0 0 0 0
Example 1
Steady state. 1 recharge parameter with 1 cluster, 1 instance.
Recharge file
PARAMETER 1
3 40
Param1 RCH 0.00005 1
MULT0001 ZONE0001 2
1 1
Param1
Variables
Explanations
PARAMETER NPRCH
One recharge parameter will be used
NRCHOP IRCHCB
Apply to highest active cell, save CCF to unit 40
PARNAM PARTYP Parval NCLU Parameter name, type, value and number of clusters
Mltarr Zonarr IZ
Multiplier array, zone array, and zone number
INRECH INIRCH
One parameter used in current stress period, INIRCH (ignored)
Pname
Name of parameter used to define RECH in this stress period
Results
The resulting recharge applied to the top-most active layer would be:
0.00005 0.00005 0.00005 0 0
0.00005 0.00005 0.00005 0 0
0.00005 0.00005 0.00005 0 0
0
0
0
0 0
0
0
0
0 0
Standard MODFLOW Parameters
452
Example 2
Steady state. 2 recharge parameters:
• the first with 1 cluster, 1 instance
• the second with 2 clusters, 1 instance.
Recharge file
Variables
PARAMETER 2
3 40
Param1 RCH 0.00005 1
MULT0001 ZONE0001 2
Param2 RCH 0.00004 2
MULT0002 ZONE0002 4 5
MULT0002 ZONE0003 6 7
2 1
Param1
Param2
Explanations
PARAMETER NPRCH
Two recharge parameters will be used
NRCHOP IRCHCB
Apply to highest active cell, save CCF to unit 40
PARNAM PARTYP Parval NCLU Parameter name, type, value and number of clusters
Mltarr Zonarr IZ
Multiplier array, zone array, and zone number
PARNAM PARTYP Parval NCLU Parameter name, type, value and number of clusters
Mltarr Zonarr IZ
Multiplier array, zone array, and zone numbers
Mltarr Zonarr IZ
Multiplier array, zone array, and zone numbers
INRECH INIRCH
Two parameters used in current stress period, INIRCH (ignored)
Pname
Name of parameter used to define RECH in this stress period
Pname
Name of parameter used to define RECH in this stress period
Results
The intermediate results for each parameter cluster are listed below:
Param1
Param2, cluster 1
Param2, cluster 2
0.00005 0.00005 0.00005 0 0
0
0
0
0
0
0 0 0
0
0
0.00005 0.00005 0.00005 0 0
0
0
0
0
0
0 0 0.00002 0.00002 0
0.00005 0.00005 0.00005 0 0
0.00002 0.00002 0.00002 0.00002 0.00002
0 0 0.00002 0.00002 0
0
0
0
0 0
0.00002 0.00002 0.00002 0.00002 0.00002
0 0 0
0
0
0
0
0
0 0
0.00002 0.00002 0.00002 0.00002 0.00002
0 0 0
0
0
The final result after accumulating each cluster is:
0.00005 0.00005 0.00005 0
0
0.00005 0.00005 0.00007 0.00002 0
0.00007 0.00007 0.00009 0.00004 0.00002
0.00002 0.00002 0.00002 0.00002 0.00002
0.00002 0.00002 0.00002 0.00002 0.00002
Example 3
Transient. 1 recharge parameter with 1 cluster, 2 instances. One instance is used in the first and third stress periods,
and the other is used in the second stress period.
Recharge file
Variables
Explanations
Standard MODFLOW Parameters
453
PARAMETER 1
PARAMETER NPRCH
3 40
NRCHOP IRCHCB
MULT0001 ZONE0001 2
Mltarr Zonarr IZ
Instance2
INSTNAM
MULT0002 ZONE0001 2
Mltarr Zonarr IZ
1 1
INRECH INIRCH
Param1 Instance1
Pname Iname
1 1
INRECH INIRCH
Param1 Instance2
Pname Iname
1 1
INRECH INIRCH
Param1 Instance1
Pname Iname
One recharge parameters will be used
Apply to highest active cell,
save CCF to unit 40
Param1 RCH 0.00005 1 INSTANCES 2 PARNAM PARTYP Parval NCLU Parameter name, type, value number
INSTANCES NUMINST
of clusters, number of instances
Instance1
INSTNAM
Instance name
Multiplier array, zone array,
and zone number
Instance name
Multiplier array, zone array,
and zone number
One parameters used in current stress
period, INIRCH (ignored)
Name of parameter and name of instance
used in this stress period
One parameters used in current stress
period, INIRCH (ignored)
Name of parameter and name of instance
used in this stress period
One parameters used in current stress
period, INIRCH (ignored)
Name of parameter and name of instance
used in this stress period
Results
The intermediate results for each parameter cluster are listed below:
Stress Period 1, Param1, Instance RCH_1_1
0.00005 0.00005 0.00005 0 0
0.00005 0.00005 0.00005 0 0
0.00005 0.00005 0.00005 0 0
0
0
0
0 0
0
0
0
0 0
Stress Period 2, Param1, Instance RCH_1_2
0.000025 0.000025 0.000025 0 0
0.000025 0.000025 0.000025 0 0
0.000025 0.000025 0.000025 0 0
0
0
0
0 0
0
0
0
0 0
Stress Period 3, Param1, Instance RCH_1_1
Standard MODFLOW Parameters
454
0.00005 0.00005 0.00005 0 0
0.00005 0.00005 0.00005 0 0
0.00005 0.00005 0.00005 0 0
0
0
0
0 0
0
0
0
0 0
455
7.3. Stochastic Modeling
Stochastic Modeling
There are two methods in GMS for stochastic modeling using MODFLOW 2000. The first, parameter zonation, uses
either a Random Sampling, Latin Hypercube Sampling, or Gaussian Fields to generate the different realizations. The
second approach uses indicator simulations generated by T-PROGS.
After the stochastic simulation results are generated, you can view these results using the Project Explorer. You can
also refine the results by using the Risk Analysis Wizard or Statistical Analysis of Stochastic solutions.
Stochastic Applications
One approach for dealing with model heterogeneity is stochastic simulations based on multiple equally plausible
candidate realizations of the site heterogeneity. Ideally, such an approach would enable the generation of variability
in subsurface soil stratigraphy based on interpretable geologic parameters such as lens width, material proportions,
juxta-positioning tendencies and anisotropy. Multiple realizations that are conditioned to borehole data provide
modelers with a rational approach for dealing with uncertainty associated with site characterization. Stochastic
simulations can be applied to regional representations of the aquifer behavior in addition to local scale simulations.
Stochastic simulations are particularly well-suited to local scale models since the resulting complex heterogeneity is
more representative of actual stratigraphic deposition. This heterogeneity makes realistic and potentially more
accurate contaminant transport simulation possible by simulating the preferential flow channels resulting from thin
lenses of clays, sands, or other materials. The ultimate result of a stochastic approach is multiple simulations of
hydraulic parameters that create a probabilistic solution. Such a solution has more credence and provides a better
understanding of actual site conditions.
The ultimate application of T-PROGS is to generate stochastic simulations of soil heterogeneity. These realizations
can then be incorporated into MODFLOW simulations as "material sets" in the LPF package or as "HUF data" in the
HUF package. (See T-PROGS)
Stochastic Inverse Modeling
Stochastic inverse modeling is a MODFLOW run option that takes each run in a stochastic simulation and performs
parameter estimation on the run to find the optimal values based on observation data. This option is very time
consuming compared with a regular stochastic simulation and a parameter estimation run because you are doing
parameter estimation for each stochastic run times.
Stochastic inverse modeling can be performed only when using material sets or HUF arrays as chosen in the
Stochastic Options dialog. PEST is the parameter estimation code supported by GMS.
The following occurs during the stochastic inverse process:
1.
2.
3.
4.
5.
Run MODFLOW for the stochastic simulation iteration.
Set the starting head equal to the resulting heads from the MODFLOW run.
Run parameter estimation.
Run final MODFLOW (if needed for PEST).
Move to next stochastic simulation iteration.
The starting heads are interpolated to decrease the run times during the inverse portion.
Stochastic Modeling
Stochastic Options Dialog
You use the stochastic options dialog to select the type of stochastic simulation its major options.
Parameter Randomization
This option uses parameters defined in Parameters Dialog.
Material Sets
This option becomes available when there is at least one material set simulation in memory. One method for creating
material sets is to use T-PROGS. When this stochastic option is chosen, MODFLOW will be run once for each
material set. This option also requires that the LPF package and the material IDs option be chosen.
HUF Sets
This option becomes available when there is at least one HUF set simulation in memory. One method for creating
HUF sets is to use T-PROGS. When this stochastic option is chosen, MODFLOW will be run once for each HUF set.
This option also requires that the HUF package be chosen.
Only Save Solutions
With this option selected, during each stochastic iteration, changes are made to MODFLOW simulation and only a
few files are saved. If this option is not selected, each stochastic iteration results in a new entire set of MODFLOW
files being saved.
Using this option requires less disk space, but doesn't allow you to load and rerun individual stochastic iteration
simulations.
Using Parameter Zonation With Stochastic Modeling
To create a stochastic MODFLOW simulation using parameter zonation, you follow these steps:
• First define your zones using key values.
• Define parameters that link with your zones.
• Select the Stochastic Simulation option from the Global Options dialog.
• Select the Parameter Randomization option from the Stochastic Options dialog.
• Choose whether you want to use the Random Sampling or Latin Hypercube randomization approaches in the
Parameters dialog.
• Save and Run your model.
• View the different model results using the Project Explorer.
• Further analyze the results using the Risk Analysis Wizard.
456
Stochastic Modeling
Random Sampling
Random Sampling is the most widely used approach for generating multiple random model simulations. GMS
supports both normal and uniform distributions.
A normal distribution can be defined as:
where σ is the standard deviation, μ is the mean, and x is the value being sampled. A uniform distribution can be
defined as:
where α and β are the bounds of the parameter value x.
To set up the Random Sampling, you need to specify the mean, standard deviation, and upper and lower bounds for
each parameter. Finally, you choose how many realizations you want to generate.
Latin Hypercube
The Latin Hypercube randomization approach is a method that tries to efficiently probe the probability space for
each parameter in a simulation in such a way that there is at least one simulation that represents every probability
area for each parameter.
First, we specify the number of segments for each parameter. The total probability, defined by a distribution, mean,
standard devation, and upper and lower bounds, is divided up into parts with equal probability (area). GMS then
generates a random parameter value so that there is one value that lies within each probability segment.
This is repeated in a combinatorial fashion for each parameter so that there are
number of simulations, where n is the number of parameters and P is the number of segments for the ith parameter.
For example, if there were three parameters with four, four, and five segments, the number of model runs would be
as follows:
Using the Latin Hypercube method has the benefit of needing a fewer number of runs to achieve the same level of
confidence than the number required for the Monte Carlo approach because we have guaranteed that the entire
probability range will be explored.
457
Stochastic Modeling
Using Indicator Simulations With Stochastic Modeling
GMS allows you to create a stochastic simulation using output from T-PROGS. This can be in the form of either
material sets or HUF data. Use the following steps:
• Generate Material Sets or HUF data using T-PROGS.
• Select the Stochastic Simulation from the Global Options Dialog.
• Enter the Stochastic... dialog from the MODFLOW menu.
• Select the Material Sets option and choose the appropriate material set or HUF data simulation.
• Save and Run MODFLOW.
• View the different model results using the Project Explorer.
• Further analyze the results using the Risk Analysis Wizard.
• GMS will generate as many MODFLOW runs as there are material sets.
Statistical Analysis of Stochastic MODFLOW/MT3D solutions
A statistical analysis can be computed on a Stochastic MODFLOW or MT3D solution by right-clicking on a
stochastic folder in the Project Explorer and selecting the Statistical Analysis command. This command creates four
data sets for the mean, min, max, and standard deviation. The 3D grid display options can then be used to visualize
these data sets.
458
Gaussian Field Generator
Gaussian Field Generator
GMS includes an interpolation option associated with the 2D scatter point module called Gaussian Sequential
Simulation (GSS). This option is used to generate a set of scalar data sets (Gaussian fields) using a Gaussian
sequential simulation. This is somewhat similar to indicator kriging or T-PROGS in that it generates a set of equally
probable results which exhibit heterogeneity and are conditioned to values at scatter points. However, the resulting
arrays are floating point scalar data sets, rather than the integer arrays produced by T-PROGS and indicator kriging.
The results of a GSS can be used in combination with the new Multiplier Array option for parameters. It is now
possible to associate one or more scalar data sets with an array-based parameter. When MODFLOW is executed, the
parameter starting value is multiplied by the data set to produce the input array. This makes it possible to use the
results of the Gaussian sequential simulation as input for parameter fields for a stochastic (Monte Carlo) simulation.
Gaussian Simulations
The new GSS tool is based on the FIELDGEN code developed by John Doherty. John Doherty describes GSS as
follows:
The process of stochastic field generation by sequential simulation is very easy to understand. At each field point an
expected field value and a field standard deviation pertaining to that point are first determined. These are calculated
through kriging from points to which field values have already been assigned, as well as from points at which
conditioning data exists (if available). Using the expected value and standard deviation calculated in this way, a
random field value is generated based on the assumption of a Gaussian probability distribution. The field value thus
obtained can then be used in generating expected values and standard deviations at other field points at which field
generation then takes place in the same way.
GSS is a form of Kriging but it is listed in the GMS interface as a new interpolation scheme. This new option will
differ from Kriging in the following ways:
1. GSS uses the FIELDGEN utility developed by John Doherty to perform the interpolation rather than the GSLIB
code used by kriging. FIELDGEN is a modified version of the sgsim utility in GSLIB so many of the options are
quite similar to those used for normal kriging.
2. As is the case with T-PROGS, the user enters the number of desired simulations and FIELDGEN produces N
arrays, rather than one array.
3. It can only be used for 2D interpolation and it will only work when interpolating to 3D cell-centered grids.
4. It can work with or without a scatter point set. If a scatter point set is provided, the resulting fields are
conditioned to the values at the scatter points. Otherwise the user defines a mean and a variogram and the values
are randomly generated.
459
Gaussian Field Generator
Gaussian Simulation Options
The first step in setting up a GSS is to import a set of scatter points with the values to which you intend to condition
your simulation. This step can be skipped if you have no conditioning data. The next step is to select the Gaussian
Simulation Options command in the Interpolation menu in the 2D Scatter Point module. This brings up the
following dialog:
The Solution name at the top is the name that will be applied to the set of Gaussian fields. The Number of
realizations item is the desired number of Gaussian fields. The original GSLIB code was designed to work with
uniform grids (constant cell sizes). The Non-uniform grid option controls how the data are converted to a
non-uniform grid (if necessary). The Edit Variogram button should be selected to set up a model variogram using
the GMS variogram editor. A model variogram must be defined whether or not you have scatter points for
conditioning.
Running the Simulation
Once the GSS options are selected, the next step is to run the simulation. This is accomplished by selecting the Run
Gaussian Simulation command in the Interpolation menu. During the simulation, you should see a window
displaying the progress of the simulation:
460
Gaussian Field Generator
Viewing the Results
Once the simulation is finished, you should see a new folder appear in the Project Explorer window which has the
name of the simulation and contains a set of data set arrays:
Clicking on each data set icon makes it the active data set for contouring. The data set properties can be viewed by
double-clicking on the icon. The following image represents a sample Gaussian realization:
461
Risk Analysis Wizard
Risk Analysis Wizard
The risk analysis wizard is a tool for refining stochastic modeling results. The Risk Analysis Wizard has two options.
You can either perform a Capture Zone Analysis or a Threshold Analysis. Capture zone analysis requires a
MODFLOW solution set, but threshold analysis can be performed on any solution set type.
Capture Zone Analysis
Capture zone analysis includes running MODPATH for each of the MODFLOW solutions to generate a capture zone
for each well or zone code group in the MODFLOW model. These capture zones are combined into one probabilistic
capture zone
Threshold Analysis
Threshold analysis is similar to capture zone analysis, but threshold analysis can be performed using any type of 3D
data set that has been read into the Project Explorer. You first select a simulation set from the Project Explorer. Next,
you set up rules for generating a probabilistic threshold data set. For example, you might be looking at a specific
contaminant and want to know what the probability is that the concentration of this contaminant will be above the
EPA level for drinking water. You would generate a rule reflecting this limit. After processing all rules for each
simulation, GMS creates a probabilistic threshold data set.
Risk Analysis Wizard Dialogs
The risk analysis wizard is entered through the right-click menu for a folder in the Project Explorer and choose Risk
Analysis... .
462
Risk Analysis Wizard
Choosing Between Capture Zone and Threshold Analysis
The first step in the risk analysis wizard is to choose what type of simulations you want to process.
The window will list all the solution types as the analysis wizard will only process solutions of the same type.
Probabilistic capture zone analysis can only be performed on MODFLOW solutions. Probabilistic threshold analysis
can be performed on any solution type.
Capture Zone Analysis Dialog
Capture zone analysis can only be performed on MODFLOW solutions
Analysis Options - Individual wells
Choose this option to create a probabilistic capture zone for each uniquely named well in the MODFLOW model.
463
Risk Analysis Wizard
464
Analysis Options - Well groups
Choose this option to create a probabilistic capture zone for each different zone code number.
Particle Starting Locations - Distribute particles on water table surface
Choose this option to distribute particles only on the water table surface. By default, one particle is placed at the xy
center of the cell at the water table, but you can use the Particle placement within cells option to change the
number of particles placed on the water table in each cell. This option will create a 2D probabilistic capture zone
representing the intersection of the entire 3D probabilistic capture zone with the water table.
Particle Starting Locations - Distribute particles within cells
Choose this option to distribute particles within each cell. By default, one particle is placed at the center of each cell,
but you can use the Particle placement within cells option to change the number of particles placed on within each
cell. This option creates three different probabilistic capture zones. The first represents the 3D capture zone, the other
two represent different 2D projections of the 3D capture zone.
Tracking Duration - To end
This option sets MODPATH to move particles through the flow field until they exit the model.
Tracking Duration - Specified duration
This option sets MODPATH to move particles through the flow field until they either exit the model or the time
reaches the duration set, which ever comes first.
Particle Placement Within Cells
This option allows you to change the number of particles per cell from the default of one. Increase the number of
particles leads to a smoother capture zone, but drastically increases the computation time.
Weight Results Based On Residual Error
In all of the capture zone methods, the algorithms used to synthesize the probability data set can be weighted using
observation data. This makes it possible to give more weight to model instances with smaller calibration error when
calculating the capture zone probabilities. The weighted head and flow observations can be compared to the
computed values to come up with a global error norm, E, for each model run. This error norm can be based on the
root mean squared (RMS) error, the sum of the squared weighted residuals, or any other measure selected by the
modeler. For capture zone analysis, GMS uses the sum of squared weighted residuals (SSWR) for the error norm.
The error norm from each MODFLOW run is used to compute a weight for the given solution using the following
equation:
......................(1)
Where Wi is the weight applied to solution i,
is a user-defined factor, ME is the mean of the error values from all
solutions, Ejk is the error for solution i, and SD is the standard deviation of error values from all solutions. The
weights are also normalized as follows
.......................(2)
so that the weights sum to unity. Equation 1 was developed to give the greater emphasis to the lower error values and
to allow the user to control the relative emphasis given to low vs. high values simply by adjusting the
value. The
equation also avoids problems when one of the error values is zero, since a zero error value does not result in an
infinite weight. We also wanted the equation to scale the weights according to the data being examined. This is done
by subtracting the individual SSWR from the mean error and dividing by the standard deviation.
Equation 1 centers the weights on the mean error. The relative weight given to values differing from the mean is
biased by the factor. This makes it possible to bias the resulting weight using knowledge of the site and the quality of
the observation data.
Risk Analysis Wizard
465
The figure below shows how the
factor in Equation 1 affects the weight applied to a given error. An
factor of
1.2 makes the contribution of each SSWR almost linear, whereas an
factor of ten gives most of the weight to the
lowest 5-10 percent while discounting the other error values. We typically use an
value of 2.0.
Weight versus Error Norm Plot
Threshold Analysis Dialog
Threshold analysis can be performed on any collection of 3D data sets. The threshold analysis data set is created by
using rules. For each rule, you select a dataset (only applies to solutions with multiple data sets.), the greater or less
than sign and a value. You can have as many rules as you want. The AND and OR logic options allow you to use 1st rule AND 2nd rule AND 3rd rule, or - 1st rule OR 2nd rule OR 3rd rule. Threshold analysis creates one 3D data
set.
466
8. Importing/Exporting Data
Importing Non-native GMS Files
GMS can import many files generated by other software in their native format. The files that can be imported to
GMS are shown in the tables below. Each file type is identified by the file extension. The file filter corresponding to
the desired extension should be selected in the Open File dialog.
Text Import Wizard
In addition to the file types listed below, several other types of data can be imported via the Text Import Wizard.
Refer to the section on the Text Import Wizard for more information.
File Type
File Ext
Model Super *.mfs, *.rsp,
Files
*.mts, *.rts,
*.sms, *.uts,
*.fws, *.ats,
*.sps
Text files
*.txt
DXF/DWG
*.dxf, *.dwg
JPEG - TIFF
*.jpg, *.tif
Shapefiles
*.shp
DEM / Grid
*.asc, *.ddf,
*.ggd, *.dem
Surfer Grid
*.grd
Description
GMS uses super files to help organize model files, which can be numerous. Opening the super file will import the
entire model and all associated model files. This will NOT open any GMS specific data, such as Map data or TIN
data etc. The file models associated with each super file extension are as follows: *.mfs = MODFLOW, *.rsp =
MODPATH, *.mts = MT3DMS, *.rts = RT3D, *.sms = SEAM3D, *.uts = UTCHEM, *.fws = FEMWATER,
*.ats = ART3D, *.sps = SEEP2D
Text files where the data is in columns, as you might export from a spreadsheet. This brings up the GMS Text
Import Wizard. Many different types of data can be brought in to GMS by using the Text Import Wizard.
Vector drawing data used for background display or for conversion to feature objects.
Raster image files used for background display or for texture mapping to a surface.
ArcView shapefiles.
ASCII 2D grid exported from Arc/Info or ArcView, ASCII 2D grid exported from GRASS
ASCII 2D grid exported from Surfer.
Text Import Wizard
467
Text Import Wizard
GMS can import many files generated by other software in their native format. Refer to Importing Non-native GMS
Files for a list. For files that are not included in the list, GMS provides the Text Import Wizard.
The Text Import Wizard enables users to import many different types of data into GMS. The Text Import Wizard is
initialized by selecting a *.txt file in the Open command from the File menu. The wizard has two steps.
Step 1 – Delimiting Columns
The first step in the wizard allows users to delimit the data into columns. Two options exist to delimit the data:
Delimited, Fixed Width.
For the Delimited option, typical delimiters are included as well as an option for users to specify a delimiter.
Columns can also be specified with a fixed width by clicking on the ruler bar or the window with the data. Break
lines can be dragged, and they can be deleted by double-clicking on the break line or dragging them off the screen.
The user can specify the starting row the data will be imported at. If your data has a row of headings, you can
indicate such and GMS will use the headings in the next step to determine what kind of data each column represents.
Step 1 File import options of the Text Import Wizard.
Step 2 – Assigning Column Types
The first 20 lines of the file are displayed in a spreadsheet according to the file outline specified in step 1. This step
lets you pick what kind of data you are importing (see Supported File Formats). A "no data flag" can be specified for
the file. This is a number that, when encountered in the file, tells GMS to mark the value as "NULL" or "no data".
The data in the columns are identified by selecting the type in the combo box at the top of each column in the
spreadsheet. If a row of headings exists, GMS will automatically select the proper type if it recognizes the heading.
Otherwise they are Not Mapped by default. The available column types changes depending on the GMS data type
selected. Certain column types must be mapped for each file format before the user can progress to the next step in
the wizard. The name of each column is changed by editing the Header cell.
Text Import Wizard
468
Step 2 (File Format) of the Text Import Wizard.
After the data have been imported, the coordinate transformation tools can be used to transform and translate the
data.
Text Import Wizard Supported File Formats
The Text Import Wizard can import various types of data as described in the tables below.
2D scatter points
This will create new scatter points in a new 2D scatter set. Optionally the imported points can be filtered using the
filter options available by selecting the Filter Options button.
Field
Type
Required
X
Number
yes
Y
Number
yes
Label
Text
no
Data
Set
Number
no
Comments
Any number of steady-state or transient data sets can be imported. When importing transient data sets, a data set name
and a time step must be specified for each transient column. Names and time steps are entered into the header row,
separated by a vertical slash using the following format: "Name|Timestep". For example, "Dataset1|January 1, 1900".
All time steps of a transient data set should be given the same name.
Examples
These examples can be copied and pasted into GMS.
Steady state
"id"
"OW-21"
"OW-22"
"OW-23"
"OW-24"
"x"
"y"
32.4
93.4
83.3
46.8
74.3
32.3
48.2
29.1
"xylene"
300
84
89
207
"toluene 0.0"
999
999
398
401
47
52
147
134
"toluene 2.0"
Text Import Wizard Supported File Formats
469
Transient
"id"
"x"
"y"
"xylene|01/01/2000 00:00"
"OW-21"
32.4
74.3
300
87
276
"OW-22"
93.4
32.3
84
310
187
"OW-23"
83.3
48.2
89
148
198
"OW-24"
46.8
29.1
207
"OW-25"
40.3
50.1
158
"OW-26"
60.7
52.0
27
"OW-27"
78.7
72.9
264
147
"xylene|01/01/2000 12:00"
"xylene|01/02/2000 00:00"
134
213
32
41
300
275
206
3D scatter points
This will create new scatter points in a new 3D scatter set.
Field
Type
Required
X
Number
yes
Y
Number
yes
Z
Number
yes
Label
Text
no
Material Number
ID
no
Data Set Number
no
Comments
Any number of steady-state or transient data sets can be imported. When importing transient data sets, a data set
name and a time step must be specified for each transient column. Names and time steps are entered into the header
row, separated by a vertical slash using the following format: "Name|Timestep". For example, "Dataset1|January 1,
1900". All time steps of a transient data set should be given the same name.
Examples
These examples can be copied and pasted into GMS.
Steady state
"id"
"x"
"y"
"z"
"xylene"
"OW-21"
32.4
74.3
10.1
300
"OW-22"
93.4
32.3
25.7
84
"OW-23"
83.3
48.2
5.3
"OW-24"
46.8
29.1
-42.2
89
"toluene 0.0"
87
999
310
187
148
207
"toluene 2.0"
198
147
134
Transient
"id"
"x"
"y"
"z"
"xylene|01/01/2000 00:00"
"OW-21"
32.4
74.3
10.1
"OW-22"
93.4
32.3
25.7
"OW-23"
83.3
48.2
5.3
"OW-24"
46.8
29.1
-42.2
300
84
89
387
310
148
207
"xylene|01/01/2000 12:00"
276
187
198
147
134
"xylene|01/02/2000 00:00"
Text Import Wizard Supported File Formats
470
Observation data
This creates new feature points in the existing, active coverage. The active coverage must exist and have a steady
state observation attribute (like "Head") defined.
Field
Type
Required
Comments
Point Name
Text
no
X
Number
yes
Y
Number
yes
Z
Number
no
Layer
Number
no
The 3D grid layer the point is associated with.
Measurement
Text
no
Measurement name. Multiple measurements allowed.
Interval
Number
no
Use Interval and Confidence, or Std. Dev. but not both.
Confidence
Number
no
Use Interval and Confidence, or Std. Dev. but not both.
Standard Deviation Number
no
Use Interval and Confidence, or Std. Dev. but not both.
Example
"id"
"OBS_Q5"
"OBS_Q6"
"OBS_Q7"
"x"
"y"
23.3
83.3
85.3
"z"
44.2
84.3
39.3
"lay"
32.2
32.2
33.2
1
1
1
"hd"
567.5
555.3
999
"int"
1.2
1.4
0
"conf"
95
90
0
Transient observation data
This adds time series curves to existing points in an existing observation coverage. The targeted coverage must be
the active coverage. The existing points and the data being imported are matched by name.
Field
Type Required
Point Name
Text
yes
Date (MM/DD/YYYY) Date
yes
Time (HH:MM:SS)
Time
Comments
Data must be in this format.
yes
Example
"id"
"OBS_Q5"
"OBS_Q5"
"OBS_Q6"
"OBS_Q6"
"date"
"time"
12/3/1999
1/30/2000
3/27/2000
12/3/1999
"head"
18:00:00
07:38:25
18:00:00
18:00:00
238.5
834.7
878.3
733.2
Text Import Wizard Supported File Formats
471
Well data
This creates new feature points in an existing coverage. The point types are set to "well" and the flow rate and other
data are assigned to the points. A coverage with the "Wells" attribute must already exist and be the active coverage.
Field
Type
Required
Name
Text
no
X
Number
yes
Y
Number
yes
Z
Number
no
Elevation of top of well.
Depth
Number
no
Depth to top of screen.
Screen Length Number
no
Flow Rate
Number
"y"
"z"
843.2
789.4
678.1
no
Comments
Positive for injection, negative for extraction.
Example
"id"
"well_1"
"well_2"
"well_3"
"x"
123.5
134.2
147.2
"depth"
62.0
62.8
61.4
"len"
51.4
60.7
110
"Q"
6.0
5.4
10.0
120.5
100.3
300.5
Pumping data
This adds time series curves to existing points in an existing coverage containing wells. The targeted coverage must
be the active coverage. The existing points and the data being imported are matched by name.
Field
Type
Required
Comments
Well Name
Text
yes
Must match an existing well, or else data is ignored.
yes
Data must be in this format.
Date(MM/DD/YYYY) Number
Time(HH:MM:SS)
Number
yes
Flow Rate
Number
yes
Positive for injection, negative for extraction.
Depth
Number
no
Depth to top of screen.
Screen Length
Number
no
Example
"id"
"well_1"
"well_1"
"well_2"
"well_2"
"date"
"time"
"Q"
12/3/1999
18:00:00
1/30/2000
07:38:25
12/3/1999
18:00:00
3/3/2000
14:48:32
625.0
0
0
100.0
Text Import Wizard Supported File Formats
472
Borehole data
This creates new boreholes. Optionally, a borehole folder name can be specified to organize the imported boreholes.
"id"
"x"
"borehole_1"
"borehole_1"
"borehole_1"
"borehole_2"
"borehole_2"
Field
Type
Required
Borehole Name
Text
yes
X
Number
yes
X location of the contact.
Y
Number
yes
Y location of the contact.
Z
Number
yes
Z location of the contact.
HGU ID
Number
yes
HGU Material below the contact
Material ID
Number
no
Material below the contact.
Horizon ID
Number
no
"y"
0.0
0.0
0.0
5.0
5.0
"z"
0.0
0.0
0.0
0.0
0.0
Comments
"material"
0.0
3
10.0
1
15.0
6
1.0
2
6.0
2
"horizon"
1
2
4
3
4
Borehole sample data
This creates new sample data on existing boreholes, or new sample data on new boreholes if no boreholes with
matching names exist. All existing sample data is replaced with that being imported.
"id"
"x"
"borehole_1"
"borehole_1"
"borehole_1"
"borehole_2"
"borehole_2"
"y"
0.0
0.0
0.0
5.0
5.0
Field
Type
Required
Comments
Name
Text
yes
New Borehole Name
X
Number
yes
X location of the borehole.
Y
Number
yes
Y location of the borehole.
Z
Number
yes
Z location of the borehole.
Data Set Number
yes
"z"
0.0
0.0
0.0
0.0
0.0
"data"
0.0
10.0
15.0
1.0
6.0
495
484
454
259
248
Transient point data
This creates new time series curve data on existing feature points similar to the "Pumping data" option above. This
option is more generic than the "Pumping data" option, however, because it will work with feature points of any type
and any attribute (that can be transient) of that feature point. The imported data is matched to the existing points by
name or by XY location. Data for more than one attribute can be imported at the same time. The attributes of the
active coverage are listed as available fields that can be mapped.
Text Import Wizard Supported File Formats
"id"
"well_1"
"well_1"
"well_2"
"well_2"
473
Field
Type
Required
Name
Text
no
Either this or X and Y must be mapped.
Date (MM/DD/YYYY)
Date
yes
Data must be in this format.
Time (HH:MM:SS)
Time
yes
X
Number
no
Either this or Name must be mapped.
Y
Number
no
Either this or Name must be mapped.
[Attribute1...]
Number
No
The value of the selected attribute at the given date/time.
[AttributeN]
Number
No
The value of the selected attribute at the given date/time.
"date"
"time"
12/3/1999
1/30/2000
3/27/2000
12/3/1999
Comments
"x"
18:00:00
07:38:25
18:00:00
18:00:00
"y"
123.5
123.5
134.2
134.2
"Flow rate"
843.2
843.2
789.4
789.4
625
0
0
100.0
Transient node data
Similar to Transient point data but for nodes. Since nodes don't have names they must be matched by XY location.
Field
Type
Required
Comments
Date (MM/DD/YYYY)
Date
yes
Time (HH:MM:SS)
Time
yes
X
Number
yes
Y
Number
yes
[Attribute1...]
Number
No
The value of the selected attribute at the given date/time.
[AttributeN]
Number
No
The value of the selected attribute at the given date/time.
Data must be in this format.
Transient arc data
Similar to Transient point data but for arcs. Since arcs don't have a single XY location they must be matched by
name.
Field
Type
Required
Comments
Name
Text
yes
Date (MM/DD/YYYY)
Date
yes
Time (HH:MM:SS)
Time
yes
[Attribute1...]
Number
No
The value of the selected attribute at the given date/time.
[AttributeN]
Number
No
The value of the selected attribute at the given date/time.
Data must be in this format.
Text Import Wizard Supported File Formats
474
Transient polygon data
Similar to Transient point data but for polygons. Since polygons don't have a single XY location they must be
matched by name.
Field
Type
Required
Comments
Name
Text
yes
Date (MM/DD/YYYY)
Date
yes
Time (HH:MM:SS)
Time
yes
[Attribute1...]
Number
No
The value of the selected attribute at the given date/time.
[AttributeN]
Number
No
The value of the selected attribute at the given date/time.
Data must be in this format.
Importing/Exporting CAD Data
Importing
GMS can import DWG or DXF files via the File|Open command. If there is already CAD data in memory, GMS
will replace the existing data with the data being imported. Currently, GMS cannot merge the incoming data with the
data in memory.
Exporting
GMS data can be exported to a DWG or DXF file that can then be read into a CAD software package. If there is
CAD data in memory when a GMS project is saved, GMS creates a new DWG file from the CAD data. The file is
put in the same folder with the other project files and named using the project prefix.
Any CAD data in memory can be exported by right-clicking the CAD folder in the Project Explorer and selecting the
Export command. The DWG/DXF Filename dialog will appear, and you can select either the DWG of DXF file
types to save the CAD data. GMS objects must first be converted to CAD data before CAD data can be exported. To
convert GMS data to CAD data, use the Convert To CAD command in the Display Menu.
CAD Properties
The CAD Properties dialog displays data about the CAD file such as: path on disk, extents in xy, and file version.
Importing USGS DEMs
Importing USGS DEMs
The Import USGS DEMs dialog is used to
examine the limits of DEM files as well as
defining a clipping boundary to eliminate
regions outside the area of interest prior to
actually reading the elevations in. The Add
button is used to add a new file to the list of
files (you can now select multiple DEM files
at the same time rather than adding them one
at a time, but they must all be of the same
format) that will be read. The standard file
opening dialog appears from which you may
select DEM files. Once the file(s) are added
to the list a bounding rectangle is displayed in
the small graphics window in the center of
the dialog. As additional files are added the
graphics region is updated with new
rectangles in order to provide an
understanding of where DEMs are located in
relation to one another.
A small black rectangle is displayed in the
central graphics window. Only elevation
points inside this rectangular region will be
read in when hitting OK from this dialog.
This boundary rectangle can be modified in three different ways.
• DRAGGING - Using the mouse you can click near one of the four edges of the bounding rectangle and drag it to
a new location. If you click near a corner both edges will be adjusted. If you click in the center of the rectangle
then the entire rectangle can be translated to a new location. As you drag edges to new locations their
corresponding values are automatically updated in the Edit Fields.
• EDIT FIELDS - Any one of the western, eastern, northern, or southern boundaries can be explicitly set by
changing the values in their corresponding edit fields. As new values are entered the display in the small graphics
window can be updated by tabbing or by clicking the cursor outside the current edit field.
• ENCLOSE ALL DEMs - This button can be used to force the edges of the bounding rectangle to correspond to
the limits of the DEM files which have been added to this point. By default when a new DEM file is added the
bounding rectangle is adjusted to enclose all DEMs.
The thinning factor can be used to reduce the number of elevation points read. A thinning factor of 2 means that
every other row and column would be read, reducing the number of total points by a factor of 4. A factor of three
means that every third row and column would be read reducing the total by a factor of 9, etc.
The elevation units toggle can be used to specify whether imported DEM points have meter or feet for units of
elevation. If a DEMs base elevation units are feet and the toggle specified meters, all elevations are converted when
reading. This is particularly important when trying to read two adjacent DEMs with different base elevation units.
Also see about transforming coordinate systems.
475
Importing USGS DEMs
NOTE: This option does not change the base planimetric units of the DEM and you should make the elevation units
consistent with the planimetric units in order to ensure that slopes are computed properly when computing basin
geometric parameters.
At the bottom of this dialog the total number of DEM points from all DEM files which have been added and the
approximate number of points inside the bounding rectangle are displayed. These numbers can be used to determine
how many points your system is capable of reading. For example, each DEM point requires 5 bytes of memory, so
that if you read an entire 1:250,000 DEM with about 1.4 million points, 1.4 meg * 5 bytes = 7 meg of memory would
be required (in addition to whatever other memory being used by GMS). This means that you would need at least 8
meg of RAM, or some type of virtual memory capabilities would be required to read in the entire DEM file.
This same dialog is used for all five types of DEMs supported in the GMS import options: USGS, ARC/INFO®,
GRASS, DTED, and SDTS.
DEMs in Different UTM Zones
Occasionally two adjacent USGS DEM files will be read in but do not appear adjacent in the import dialog. This
occurs because while the two DEMs are adjacent, they lie in different UTM zones. X coordinates within UTM zones
repeat and therefore the DEMs do not lie adjacent to one another as they should. WMS does not contain the utility
functions necessary to transform a DEM from one UTM coordinate zone to another. However, GMS, ARC/INFO®
and possibly other GIS software can be used to convert from one zone to another.
Importing/Exporting GIS Grids
GMS includes an option to import and export grid files from/to either the GRASS or ARC/INFO (ArcView)
geographic information systems formats.
Importing
Grids are imported using the Open command in the File menu.
With GRASS and ARC/INFO grid files, the grid and the attributes are saved to a single file. When a grid file is
imported, GMS constructs the grid, and then reads in the attribute matrix as a data set.
When a grid in GRASS or ARC/INFO contains multiple attributes (data sets), each attribute is written to a separate
grid file. In such cases, it is possible to read in one instance of the grid file to create a grid with a single data set, and
then read in the other grids as extra data sets on the first grid. This can be accomplished as follows:
1.
2.
3.
4.
Select the Open command from the File menu.
Choose either the GRASS or ARC/INFO file filter.
Select the grid file.
Select the OK button.
At this point, the first grid file is imported resulting in a grid with a single